Article

Ground Deformation Associated with Deep Excavations in Beijing, China

1
School of Engineering, The Open University of China, Beijing 100039, China
2
Key Laboratory of Urban Security and Disaster Engineering, Ministry of Education, Beijing University of Technology, Beijing 100124, China
3
The Third Construction Engineering Company Ltd. of China Construction Second Engineering Bureau, Beijing 100070, China
*
Author to whom correspondence should be addressed.
Appl. Sci. 2023, 13(17), 9579; https://doi.org/10.3390/app13179579
Submission received: 31 July 2023 / Revised: 19 August 2023 / Accepted: 21 August 2023 / Published: 24 August 2023
(This article belongs to the Special Issue Urban Underground Engineering: Excavation, Monitoring, and Control)

Abstract

:
A performance study is considered to be reliable method for comprehending deformations associated with deep excavation. To gain insight into the laws governing ground deformations that are associated with deep excavation, details of 88 cases were collected and analyzed in Beijing. The results were compared with worldwide case histories. Field data were selected to survey the ground behavior and to examine the correlation between deformation and excavation. The position and magnitude of the final ground deformation (δv), as well as the maximum deformation (δvm), the correlations between δvm and excavation depth (H), the length–width ratio, embedded depth ratio (EDR), and the stiffness of the support system, were assessed. The clear evolution process, influence zone, and final deformation pattern are illustrated. Our study revealed the following: (1) the groove pattern is detected in the final deformation of the ground surface, δvm occurred when positioned approximately 0.42H~0.62H off the wall, when the 1st~2nd supports on the bottom were removed; (2) δvm increases with an increase in H, and it ranges from 0.04% to 0.12% when H has an average value of approximately 0.089%; (3) EDR has an observable effect on reducing the δvm, as there a slight impact was observed until the ratios exceeded 0.4; (4) the deformation value of the 75% monitoring points ranged from −25 mm to 0 mm; (5) excavation could cause minor upheaval in some areas, but the upheaval reduces with increasing levels of excavation, so both deformation magnitude and the number of points are low; (6) deformation exhibits clear temporal–spatial characteristics, the settlement rate gradually increased over time, especially after drainage started or consolidation appeared, and when the internal structure is completed, δvm decreases with the rise in support system stiffness, ranging from 7000 to 11,000, and deformation becomes stable; and (7) transverse sections near the excavation center experienced larger deformations than others and the smallest deformations were near the corners, a significant increase occurs with the removal of the lowest 1–2 struts, particularly on the long side where ∆δv reaches 2.8 ± 0.75 mm, and the influence zones extend from approximately 2.5H to 3H beyond the excavated face. These findings have valuable implications for designing and constructing similar projects in Beijing and other regions, as they can help prevent accidents and minimize resource wastage.

1. Introduction

The Beijing Metro is a world-class subway system that efficiently serves the city and surrounding suburbs. At the beginning of 2023, 54 cities in China had implemented urban rail transit, with 291 lines and 5609 stations in service. It is expected that by 2025, 65 cities in China will have opened or built urban rail transit lines, with a total mileage exceeding 13,000 km in operation. Over nearly half a century, numerous deep excavations have been carried out in subway stations across Beijing. With rapid economic growth, there is an increasing demand for future urbanization. As the urban rail transit net expands, the engineering of deep foundation pits is developing on a larger scale, at deeper depths, and under more complex conditions. Deep excavations are often executed near existing buildings and infrastructures. And accidents may cause serious casualties, economic losses, and have a bad influence on society. The safety and stability of deep excavation has attracted much attention. Controlling ground deformation becomes even more challenging and it meets stringent requirements due to limited construction space. Since the 1990s, performance-based design concepts have been adopted [1]. Pit performance during deep excavation may be influenced by various intricate factors, including stratum conditions, stress levels, boundary conditions, support system stiffness, type of retaining wall, time effects, and workmanship. And they are difficult to access or quantify due to their interconnectedness. Therefore, the analysis of deformation with regard to deep excavation cannot comprehensively take into account all of these factors [2]. Predicting ground movement, which is necessary for the design and construction of deep excavations, is a practical challenge faced by engineers and researchers in megacities [1,3].
As a tangible reflection of the influence of diverse factors on excavation in actual projects, the performance of the foundation pit may inform future excavation predictions. The semi-empirical study of monitoring performance is a viable approach for deciphering associated deformations [4]. Around the globe, researchers have undertaken studies on deformation caused by deep excavation, primarily in clay deposits or sand [1,3,5,6,7,8,9,10,11,12,13]. In these studies, deformation data were usually categorized based on the ground conditions, and they were analyzed to study the effects of excavation depth, the type of support, and support system stiffness on the magnitude of ground settlement [2]. In 1969, Peck [5] conducted a detailed study on ground settlements and excavations. The maximum ground settlement was approximately 1% of the excavation depth in soft clay, stiff clay, and sand [2,6]. A dimensionless curve of the relationship between the maximum settlement and the distance beyond the excavation that was normalized by the excavation depth was obtained. This work was well known and widely used in practice. Based on Peck’s research, Clough et al. [8] studied and analyzed the measured data of foundation pits in stiff clay, sandy clay [9], residual soil [10], and relatively stiff soil [13], respectively. The magnitude of the ground settlement is reduced in order to advance in the design and construction of support systems, and it ranges from 0.1 to 0.3% of the excavation depth. Maximum ground settlements that are less than 0.2% of the excavation depth have been found in mixed grounds [14,15]. Leung et al. [2] studied the characteristics and influencing factors of foundation pit deformations in Taipei [3], Singapore [16], Hong Kong, and the Yangtze River delta in China [11]. The results of hundreds of pits with different lengths, widths, and excavation depths were analyzed. The surface settlement is affected by excavation geometry [17] (i.e., length, width, and depth of excavation), and it regularly changes with the width of the foundation pit [18]. A small length–width ratio produces little ground movement [19]. The embedded depth ratio is an important factor that affects the stability of foundation pit, and average values range from 0.44 to 0.96. It has been suggested in numerical analyses and design charts that movements are related to the stiffness of the support system [8,10,20].
These studies form a series of databases composed of figures and diagrams, and they have enriched our comprehension of performance with regard to deep excavations. They offer valuable resources for engineers and researchers to aid in verifying the accuracy of numerical analyses or estimating the scale of deep excavation movements. Fewer investigations have focused on heterogeneous soils [2,12,14]. Owing to distinct regional characteristics, variations are observed in terms of the size and deformation patterns of foundation pits across diverse areas. Numerous engineering projects concerning foundation pits have been implemented in Beijing, but systemic research and comprehensive summaries concerning ground deformation that mention characteristics of surface deformation, are currently lacking.
To elucidate the principles of ground surface deformation resulting from deep excavations in Beijing, field data from 88 excavation cases concerning high-quality construction were chosen. These data were utilized to analyze ground behavior and to determine the relationship between deformation and excavation in Beijing’s heterogeneous soils. The magnitude and location of the ground surface settlement, linkages between δvm and excavation depth (H), the embedded depth ratio (EDR), length width ratio, and stiffness were evaluated. And the evolution process, which is apparent in the influence zone, and the pattern are portrayed. Some factors affecting deformation were discussed. In addition, comparisons with worldwide cases are made. We conducted a comprehensive study for this region in this paper. The results are of great significance, they enrich databases which comprise similar engineering papers, and they improve design theory, which can provide experiences for reference in Beijing and other areas in the future.

2. Typical Details concerning Deep Excavation

2.1. Geotechnical and Geological Conditions

Beijing is situated on the alluvium of the Yongding River with complex geological and hydrogeological conditions. Commonly, the soil layers are continuous, and they alternate between different densities, ranging from medium to very dense. The adjacent layers adhere tightly to each other. The strata are principally diluvial and alluvium in the quaternary period. The soils that cover the area consist mainly of medium-coarse sediments, such as sand and gravel, as well as silty sand, silty clay, silt, backfill soil, etc. Table 1 displays the physical and mechanical characteristics of soils which were collected from various locations in the city through in situ sampling. Gravel and sand show favorable engineering characteristics in the natural state, including high shear strength and stability [21,22]. Conversely, clay and backfill soil are easily disturbed, their strength rapidly decreases, and the void ratio and fractal dimensions of the pores and soil particles changes as well [23,24]. Additionally, the underground water is approximately distributed from −5 m to −26 m.

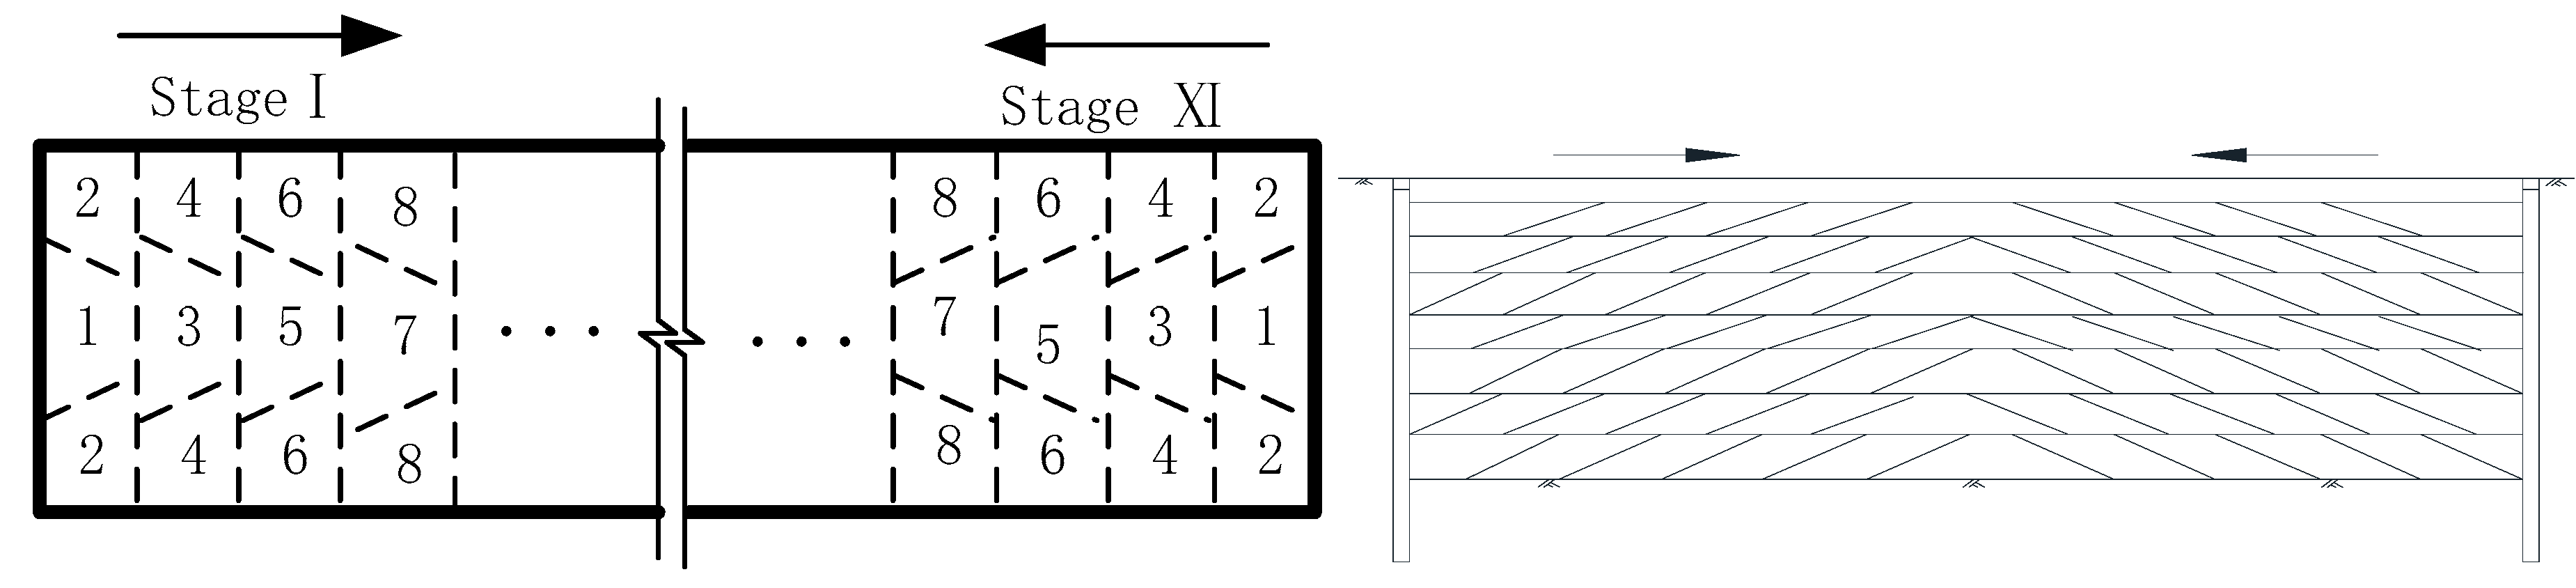
2.2. Excavation Method
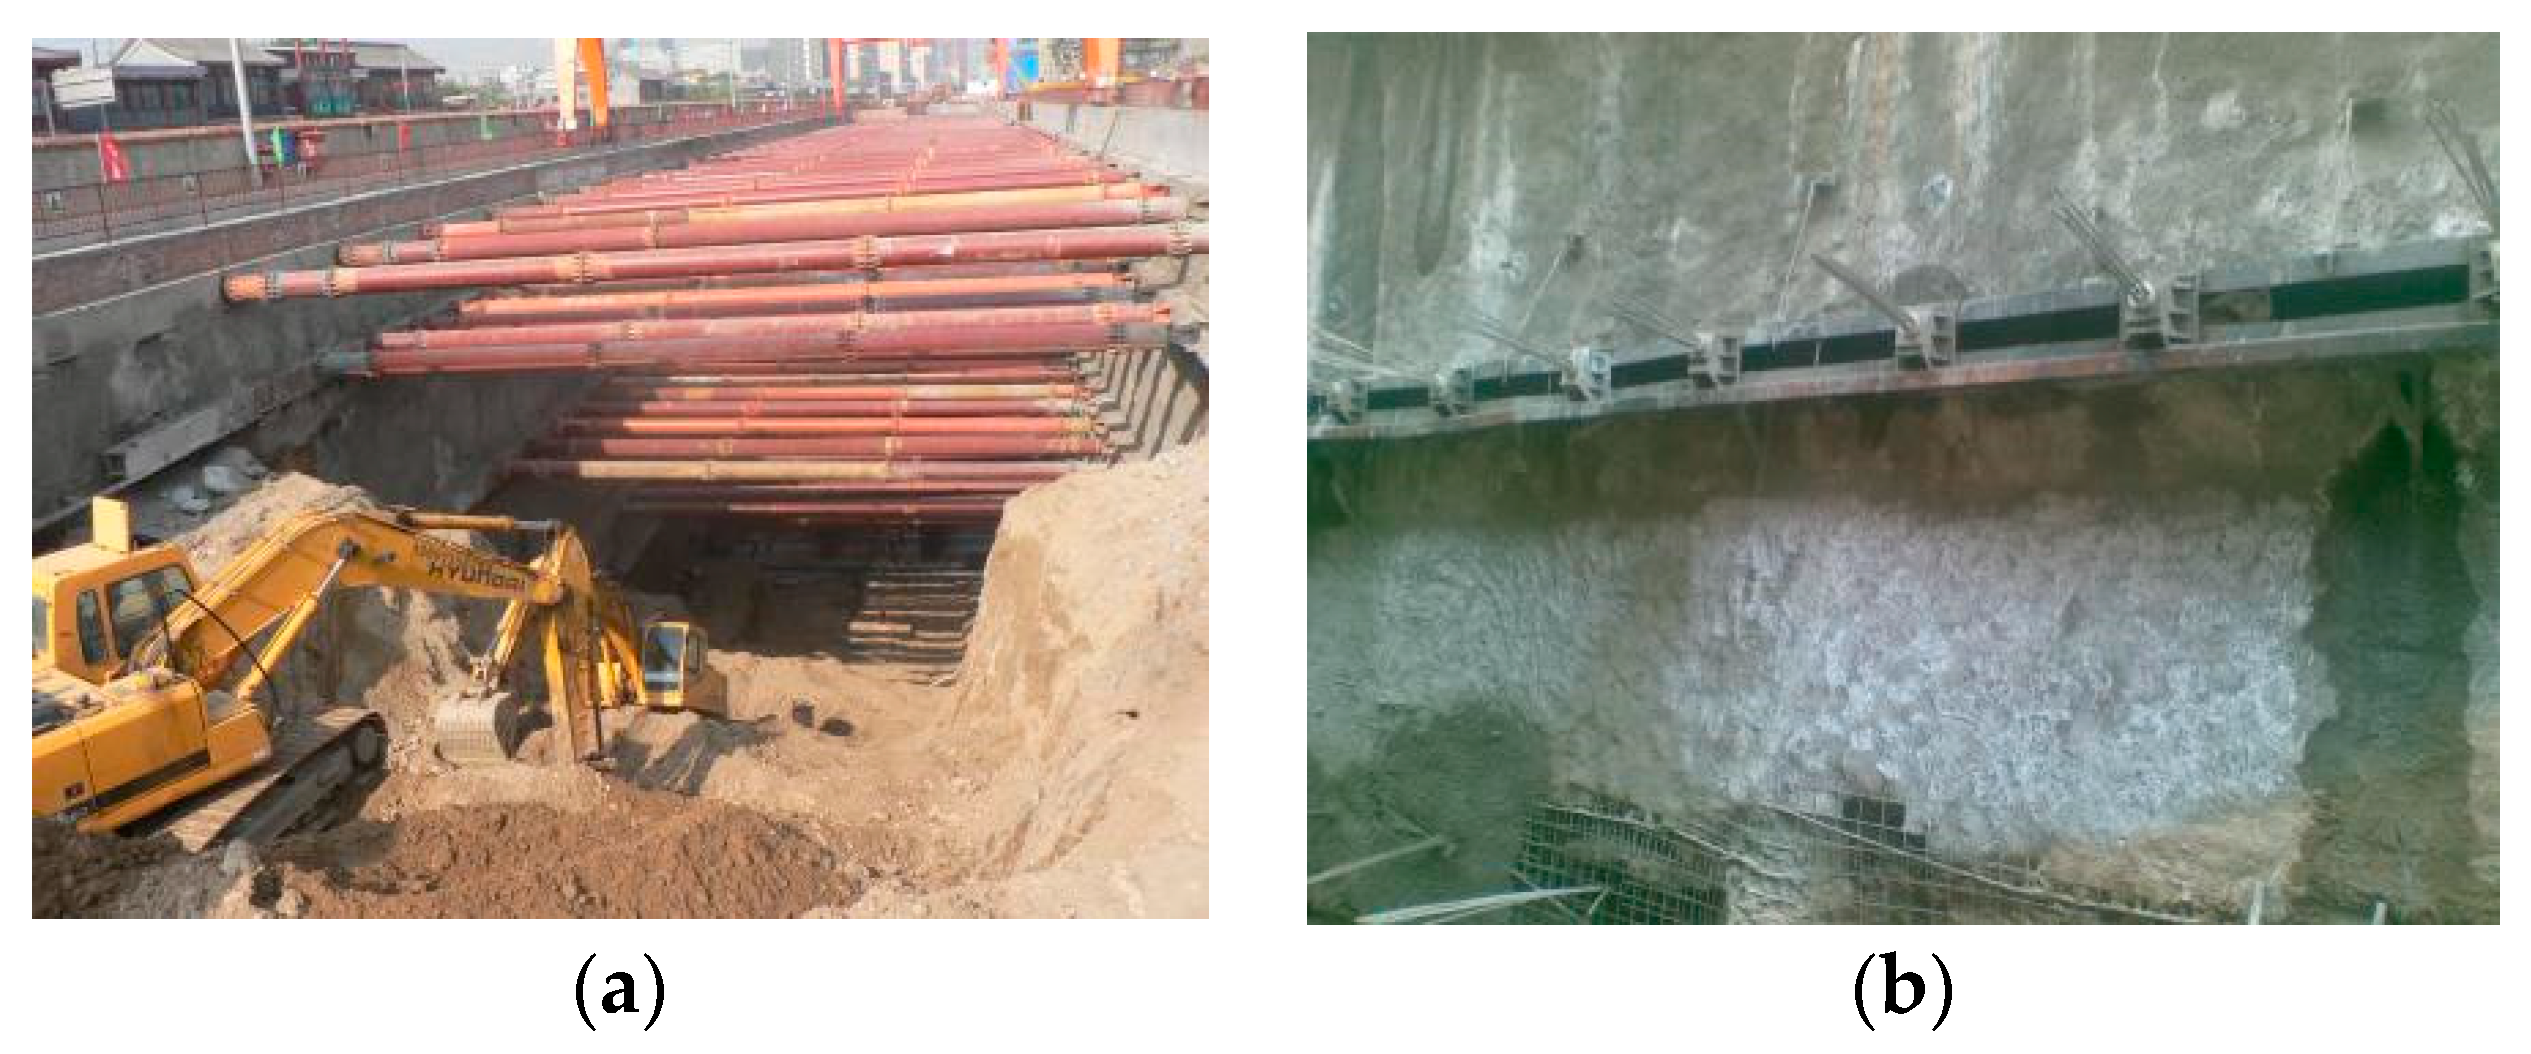
The open cut method is a fast and efficient method, and widely used for excavating deep pits. It can be divided into two major types, including the sloped open cut and cantilever open cut. Some studies have shown that when the excavation depth is more than 5 m, sometimes the sloped scheme is not necessarily more economical. The cantilever open cut method has been widely used in the Beijing subway project. Over the past three decades, 210 stations have been constructed on 8 lines, including lines 4, 5, 6, 7, 8, 9, 10, and 14; of these, 126 stations have been constructed using the open cut method, which accounts for 60% of the total stations (Table 2).
In Beijing, the maximum depth of practical projects that are constructed using the cantilever open cut method without support is up to 8 m, which can reach 15 m when using a sloped scheme. Figure 1 depicts a layered and segmented schematic diagram of an open-cut foundation pit in Beijing. Zonal sections are selected at a horizontal and vertical extent of 5–20 m, depending on the site’s geometry and condition of the equipment. The excavation begins in one zone, while the rest of the area is left to support the wall of the excavation zone. Then, the support system in the excavation zone should be installed first, and excavation starts in the rest of the area. Temporary lateral support is provided by earth beams to maintain the stability of the retaining wall during construction. This process continues in stages as the excavation develops. Symmetrical excavation, the timely erection of supports, and a reduction in exposure time without support are adopted. Several levels of horizontal elements (e.g., tie-backs or internal bracing) are used to brace the excavation, and they are arranged at a vertical spacing of 3–5 m side-by-side, which is installed in 16 h.

2.3. Support System

Generally, support systems for excavations can be divided into three categories, as follows: unrestrained systems, back-restrained systems, and front-restrained systems [4]. Contiguous pile walls (CPWs), deep soil mixing (DSM) columns, diaphragm walls (DWs), and compound soil nail (CSN) walls, among others, are commonly used in Beijing. These systems are composed of both unrestrained and restrained support systems (see Figure 2).
In Beijing, low-cost and quickly constructed CPWs are commonly utilized as temporary walls. The DSM columns, which are consist of in situ soil mixed with cement, serve as waterproof curtains, and they are typically built behind the CPWs. Since the 1990s, DSM columns have gained popularity for their effectiveness as retaining structures. Due to their low tensile strength, the DSM walls are usually very thick and they lack struts. The practical maximum depth for the cantilever pile and deep soil mixing (DSM) columns are generally less than 6~7 m, although depths of up to 10 m have been achieved in Beijing. Compared with CPWs and DSM, DWs can offer effective water tightness and relatively high stiffness, which are often reserved for use as both a retaining wall and a basement wall due to their high cost and complicated construction technology. The diaphragm wall is widely used in soft clay areas. Few cases with abundant groundwater in Beijing also adopt this support system.
CSN walls combine single or double rows of DSM columns with soil nails. By reinforcing and fixing the soil, it forms a co-acting system with the soil. It has good soil quality and it has developed quickly in Beijing in recent years. The depth of excavation supported by soil nail or composite soil nail can reach more than 7 m in clay soil or soft clay soil, and the excavation depth in plastic or hard plastic clay soil can reach 14 m. In Beijing, depths of up to 8~15 m have been achieved.
Bored pile walls are applications of a sequence of concrete piles that are cast in drilled holes as CPWs. Bored pile walls with internal support are the most commonly used bracing system for deep excavations of subway stations in Beijing (Figure 2). In situations where environmental regulations are particularly stringent, or when there are limitations upon time and workspaces, a bottom-up approach is usually used with CPWs, which are propped up by temporary concrete or steel struts.

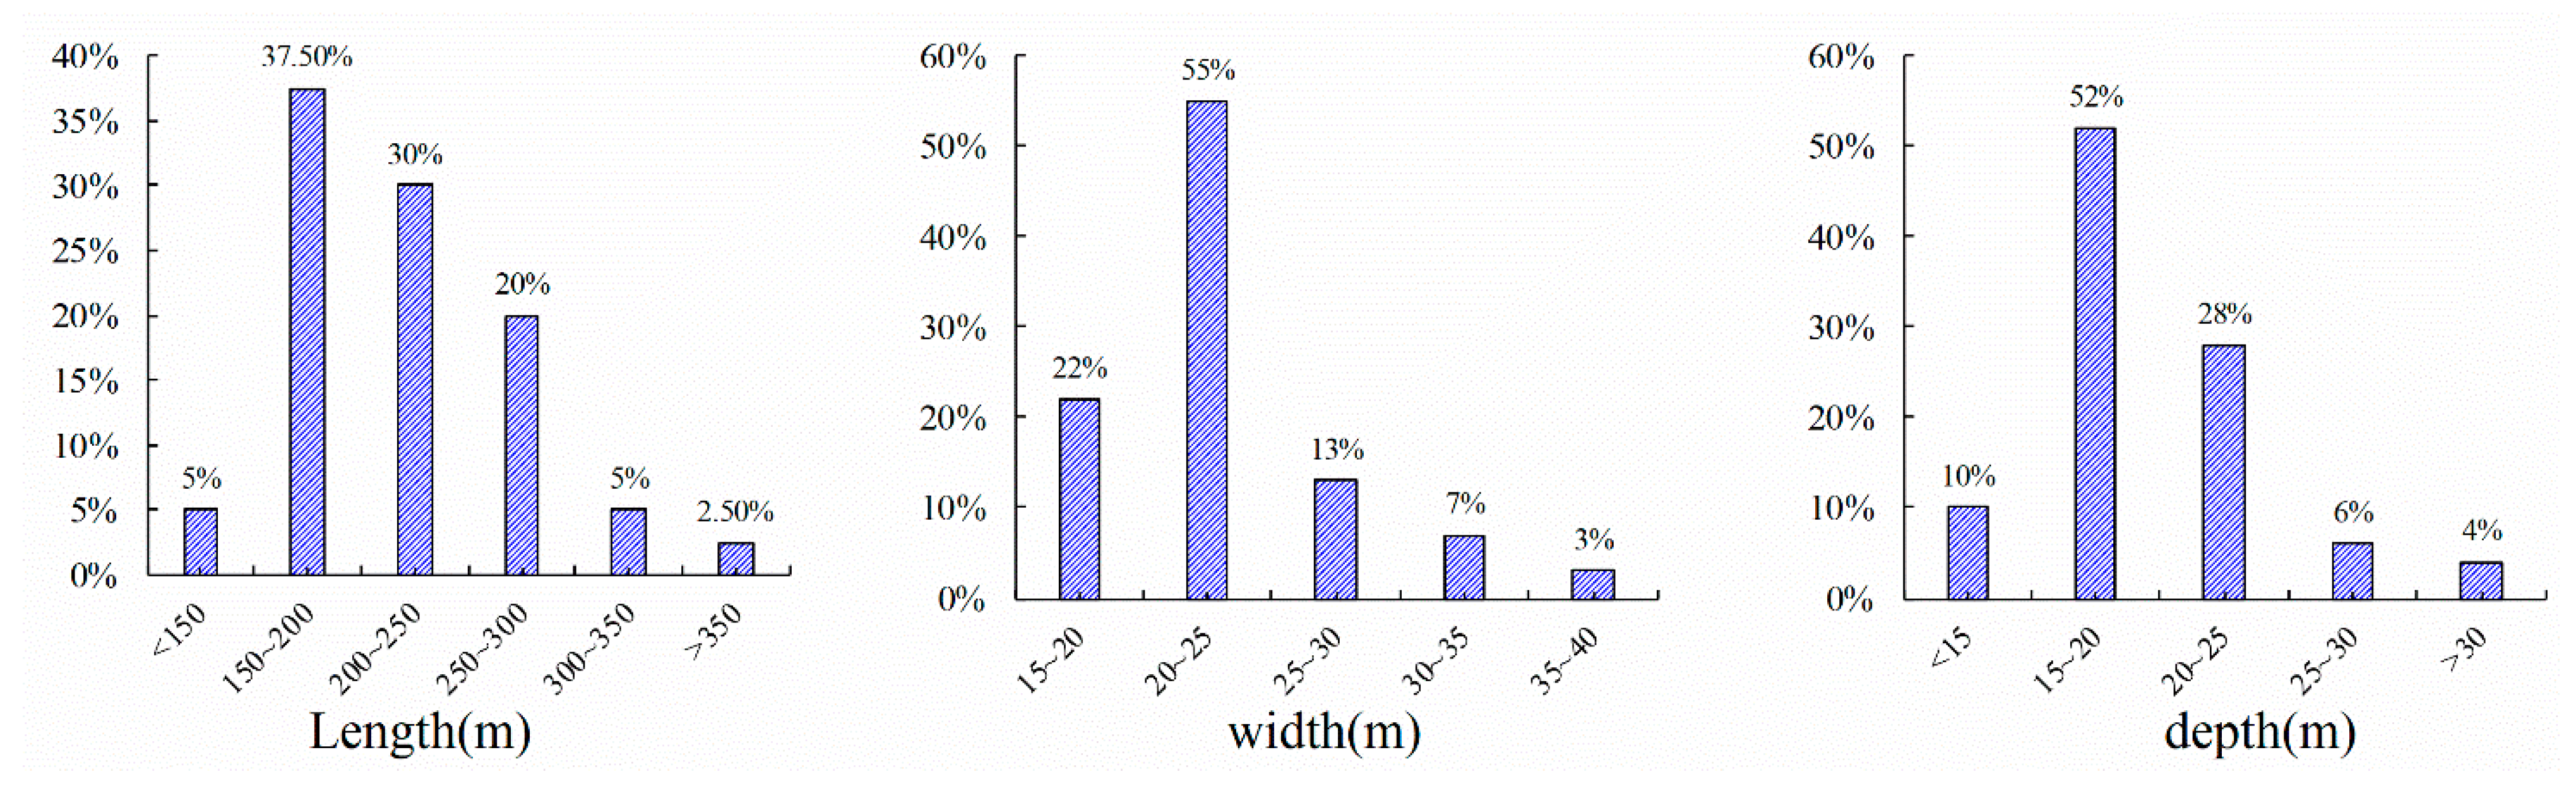
2.4. Database of Cases

The open excavation method is widely used in Beijing for its advantages of being fast, having high efficiency, being economical, offering a good working environment, and having strong controllability. Approximately 60% stations have been constructed using the open-cut method in Beijing (subway lines 4, 5, 6, 7, 8, 9, 10, and 14). As shown in Figure 3, details of 88 cases have been collected, including design data and site monitoring information. Design data include length, width, excavation depth, embedded depth ratio (EDR) (the ratio between the embedment depth of the maintenance structure below the bottom which is being excavated and the excavation depth [1]) and support system.
The main maintenance structure of all the stations is bored pile, and the supporting system includes a steel brace, a few soil nails, and a preloaded anchor cable. The shape of the pits is long and narrow, with a concentrated length of about 150–250 m, and a concentrated width of about 20–25 m. The excavation depth is usually 15–25 m, and the maximum excavation depth reaches 32 m.

3. Characteristic Analysis of Deformation

3.1. Analysis of Final Surface Deformation

A total of 1354 monitoring points were arranged in 88 cases. Abnormal points and failure points, affected by the leakage of sand and water through the wall, dewatering, and plastic flow during excavation, were eliminated. The valid data of 1231 monitoring points were obtained, which may reflect the cumulative deformation induced by the whole construction process.
Figure 4 reveals that excavation primarily results in surface settlement, and settlement points comprise 91.9% of the total. Points with settlements between 0 and −30 mm accounted for 83.9% of the total. Those with settlements exceeding −30 mm constituted a mere 8% of the total. In addition to causing ground settlement, deep excavation can also lead to ground upheaval. However, few points exhibited upheaval (this was more evident in the deeper excavations in our study), representing just 8.1% of the total points. These upheaval values were typically small, and primarily distributed within the range of 0–5 mm.
In the early stages of the entire deformation process, when the excavation level was shallow, we noticed the prevalence of upheaval of the points. As the excavation deepened, these upheaval points began to subside, and the settlement value continued to increase along with the excavation level. This could be due to the fact that when the excavation reaches a hard soil layer, the unloading of the soil at the bottom can cause a rise, pushing the surrounding soil upward. Concurrently, the lateral soil starts to move towards the pit and descend, but the presence of the support system weakens this trend. These two trends interact; if the upward force dominates, an uplift of the surface occurs.
The design and deformation information for 171 foundation pits worldwide were collected, and the data of the final surface settlement for 68 cases have been obtained (Figure 5) [8]. All surface deformations appear to have subsided. The probability of the final surface settlement in −10~−15 mm is the highest, accounting for 23.5% of the total. The proportion of points with settlements larger than −30 mm was 18.3%.
Currently, there is extensive research on the relationship between the maximum surface settlement induced by foundation pit excavation and the distance from the excavation face, but studies regarding the magnitude and probability distribution of the final surface deformation are rare. Due to variances in the stratum and support methods, the results presented in this paper slightly differ from those of M. Long [8], but the overall trend is consistent.

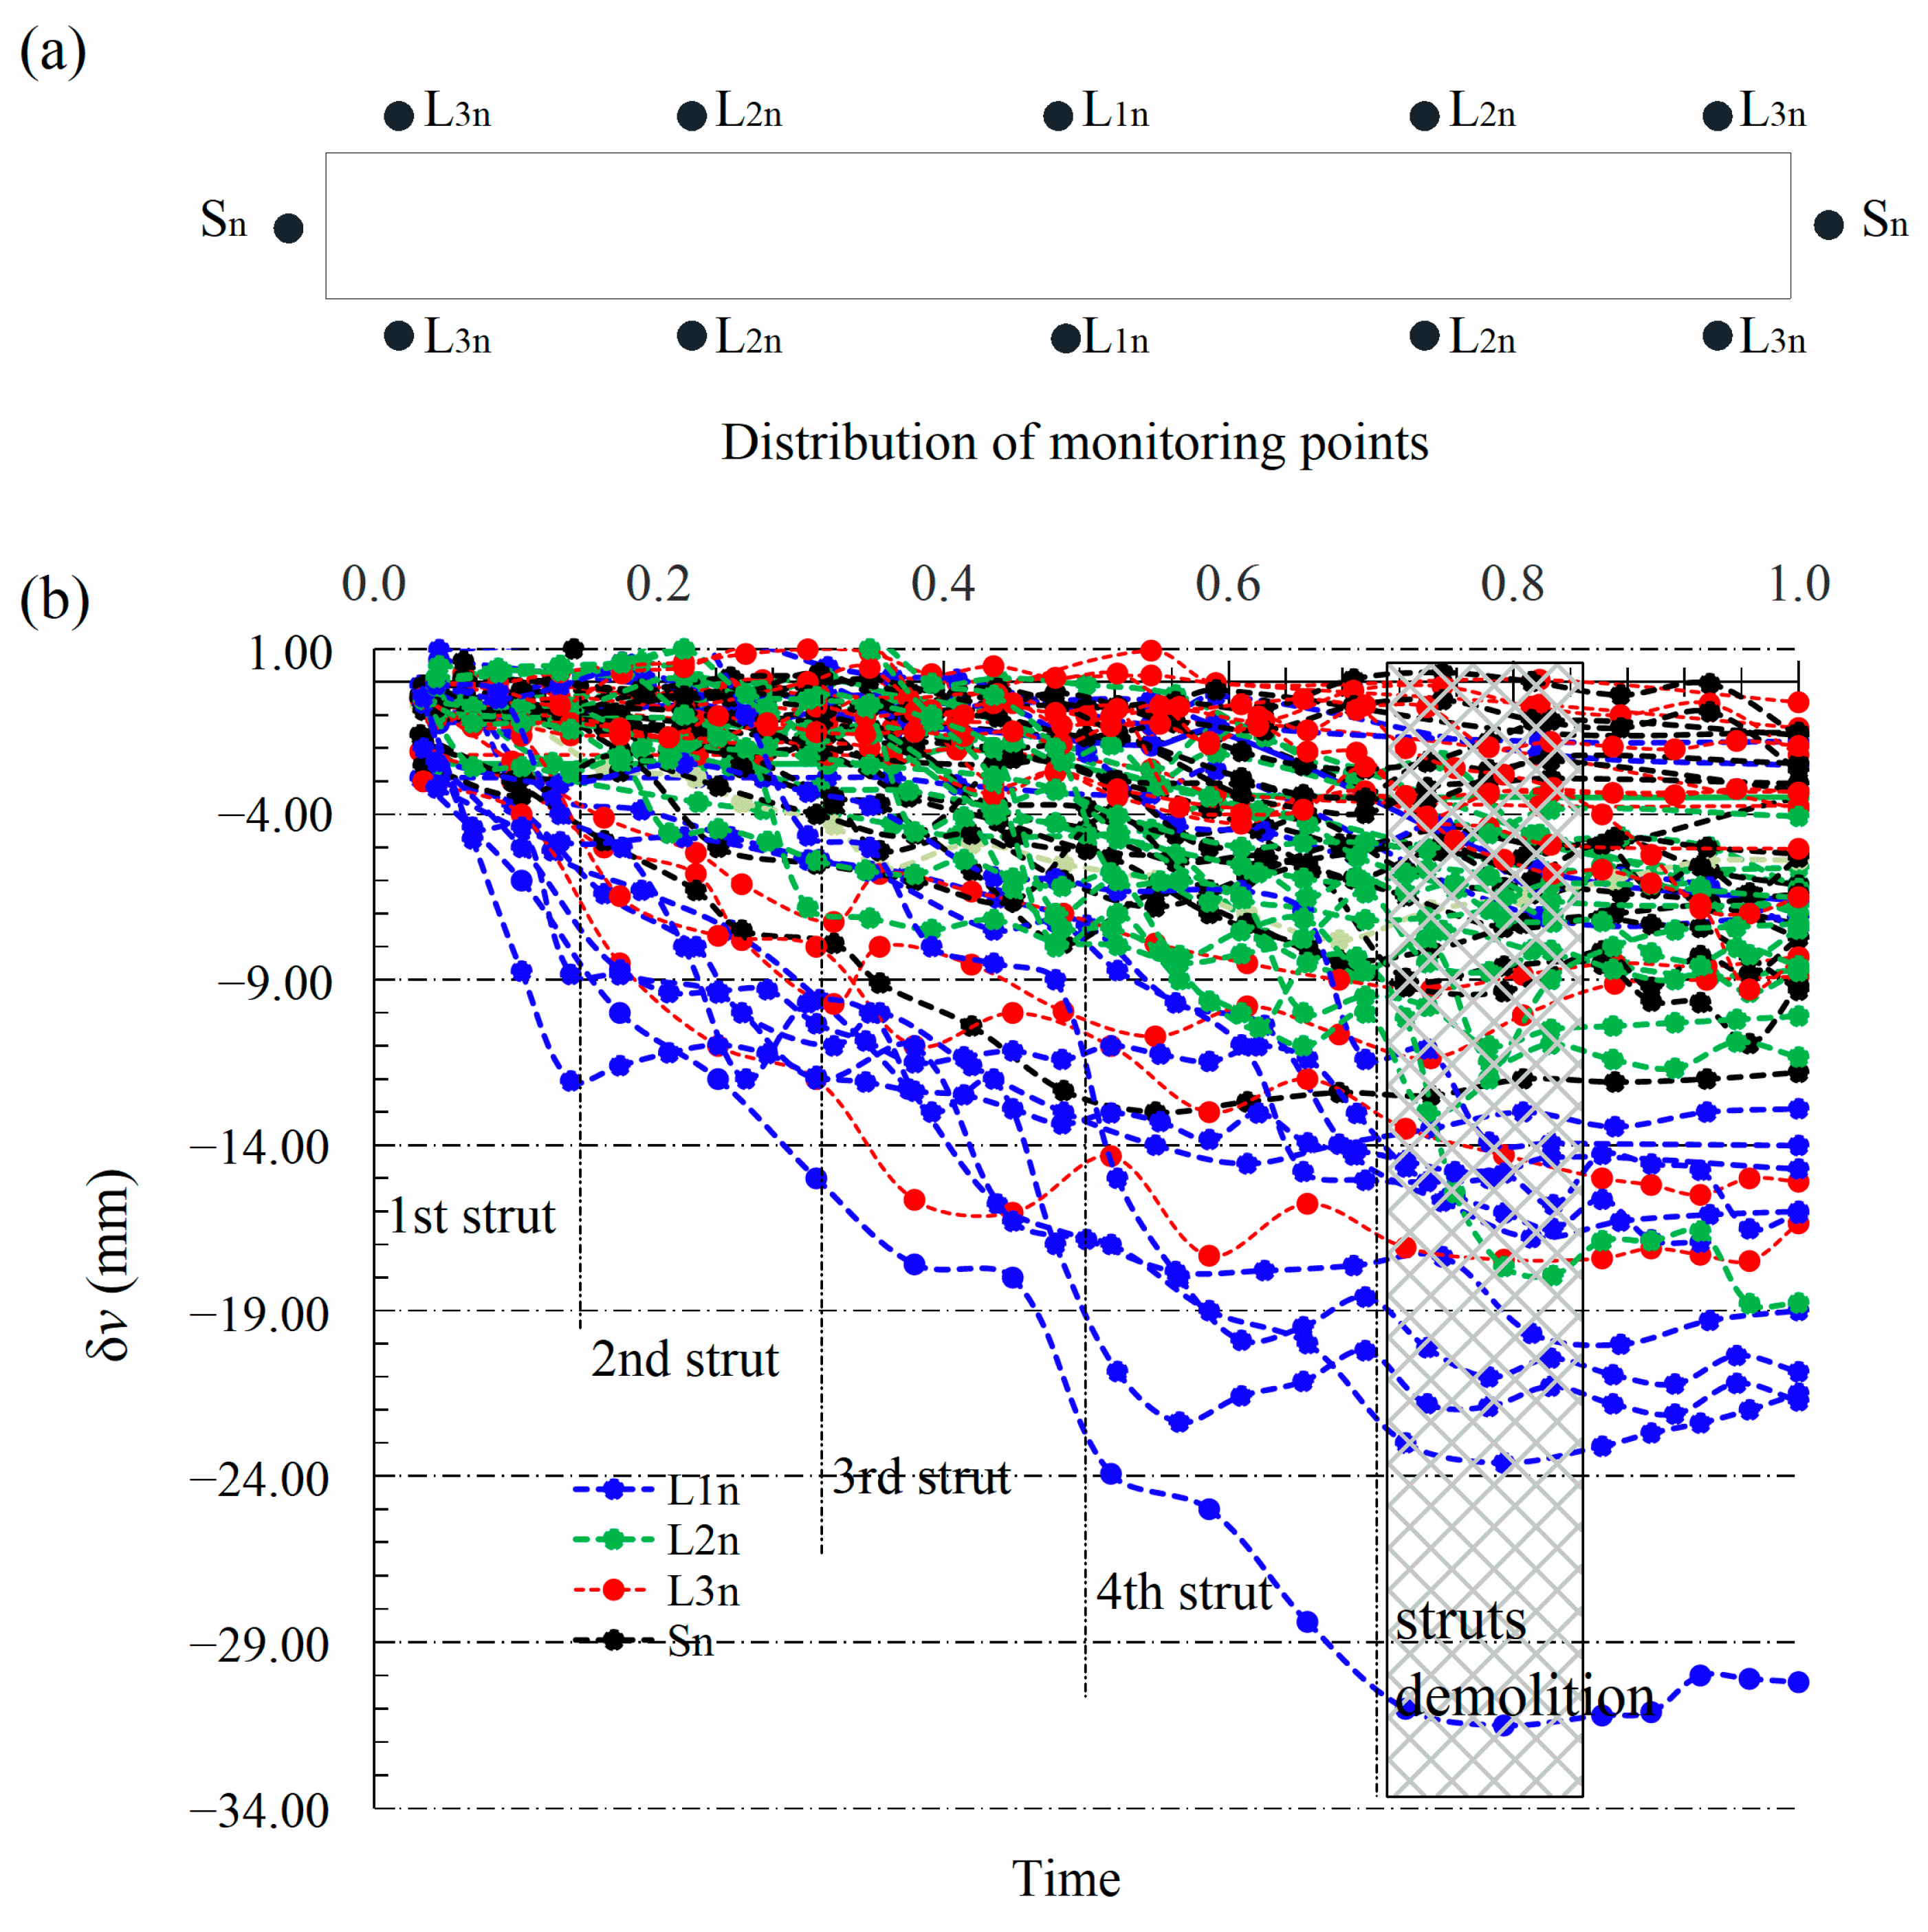
3.2. Deformation Development

Based on the time series of the real deformation, which is associated with the progress of the construction process, the development of surface deformation is analyzed. The time series of several typical cases are shown in detail (Figure 6).
The ground movements exhibit reasonable consistency, although there are significant differences in terms of the deformation of different sites (Figure 6b). At the beginning of stage 1, minor deformations occur due to the shallow depth of the excavation, showing upheaval or settlement (<5 mm) to be recorded. During the installation of the first supports, the strata exhibit an uplift tendency under the action induced by larger supporting forces; the ground points exhibit enhanced uplift or a weakened settlement. As the level of excavation continuously rises, the excavation in stage 2 starts with the installation of the second strut of the support system. This process continues in stages as the excavation process develops. Particularly at the onset of drainage consolidation in stage 2, the rate of settlement and cumulative settlement progressively increase. The deformation tends to stabilize or slightly reverse once the internal structure is completed in structure operating stage.
The maximum vertical displacement (δvm) occurs during the demolition of the first and second struts above the bottom, and not when excavating to the bottom, or during bottom slab casting. In fact, when the bottom struts are demolished, due to the high soil pressure and the reduced internal stiffness, the ground settlement developed continuously. This is noteworthy because many studies in the literature conclude by describing how surface deformation occurs during the process of excavation to bottom slab construction, and they do not reflect the maximum surface deformation. Furthermore, we detected the difference in deformation values (∆δv) before and after the demolition of last struts to clarify responses in different sites.
Remarkable differences are observed between points when comparing ∆δv values (Figure 7). The strongest response, with an average ∆δv of 2.8 ± 0.75 mm, was found at the middle transverse section along the long edge. The response of points situated at the transverse section of the 1/4 long edge have an average of ∆δv of 1.5 ± 0.7 mm, whereas those found at the middle transverse section of the short edge have an average ∆δv of 1.0 ± 0.4 mm. Corner points show the weakest response, having an average ∆δv of only 0.6 ± 0.4 mm. The final settlements of the ground surface (δv) are slightly lower than δvm, and the disparity is negligible (<5 mm). This may be because, with the completion of the internal structure, it has a larger stiffness in order to effectively bear the soil pressure acting upon it, thereby reducing deformation and encouraging convergence.
The largest values (δvm and δv) can be observed on the middle transverse section along the long edge, followed by a section on the 1/4 long side, and then, on the mid-transverse sections along its short sides. The smallest deformation is observed at the corner. This is likely because the corner is subjected to significant confinement effects by the soil on both sides, thus, the maintenance structure, and the purlin around the corner, is also more constrained.

3.3. Factors Influencing Maximum Surface Deformation

3.3.1. Excavation Depth

The influence of the excavation depth (H) on the maximum ground surface settlement (δvm) is assessed in Figure 8. The δvm shows a positive correlation with H. Most of the data concerning δvm fall into the region within the boundaries of δvm = 0.12%H, and δvm = 0.04%H, with an average value of 0.089%H. Table 3 compares the average values of δvm, which have been normalized by depth in previous studies, and this comparison shows that settlements vary significantly between different sites in different ground conditions. The magnitude resembles that which has been recorded in cases involving residual soils, stiff clays, and sands [7] in Hong Kong’s mixed ground [2] and in stiff strata [15,16,20], which mostly range from 0.02 to 0.2%H.
The δvm is smaller than that recorded in cases in UK soil [4], in soft soils of a significant thickness (>0.6H), overlaying stiffer soil or soft materials at the dredge level [8,15], in soft clay [9], and soft soils [1]; the values for these soils are 0.5%H, 0.8%H, 1.07%H and 0.42%H, respectively.

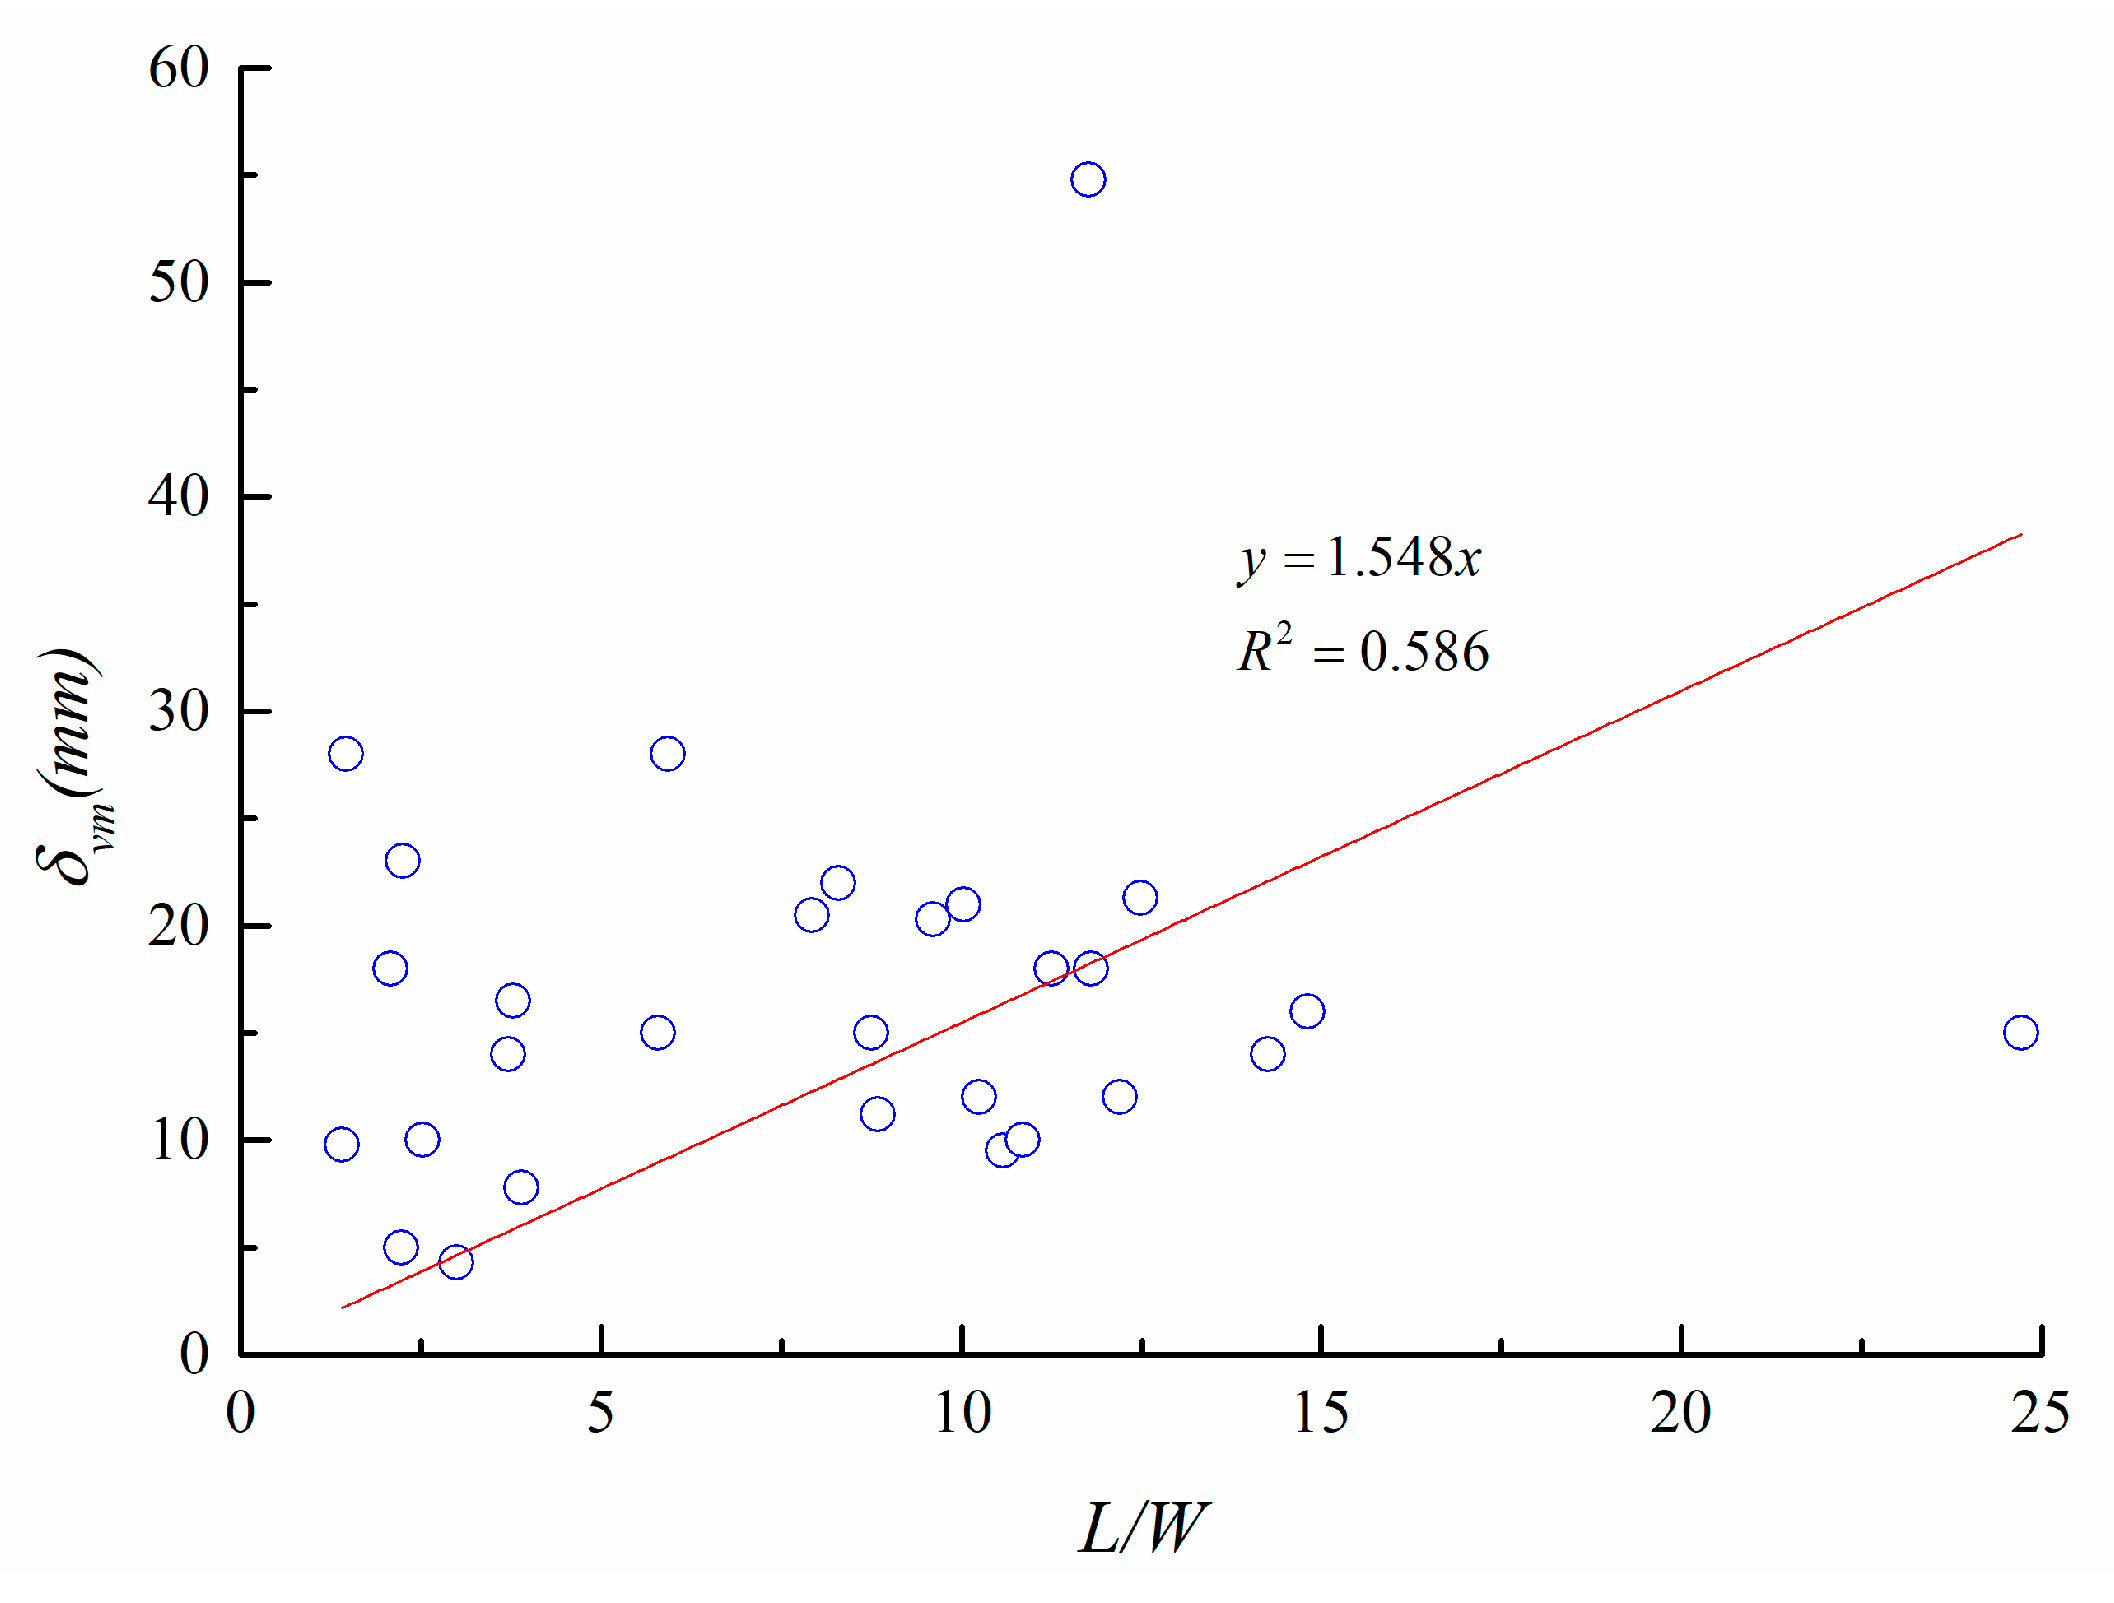
3.3.2. Length–Width Ratio

Clough et al. [8] found in their study that the length–width ratio of foundation pits has a significant influence on excavation stability. Several studies conducted in the same region have shown that the least deformation is observed in circular foundation pits, followed by elliptical pits, and finally, square pits.
A strong correlation between δvm and the length–width ratio (Pearson’s r = 0.8, p < 0.05) was found under stratum conditions in Beijing (Figure 9). The δvm positively correlated with H, and the trend is obvious. Actual experiences also showed that the deformation was well controlled when the level of earth excavation at each step, and the time without support, were reduced (Liu et al. [25]).

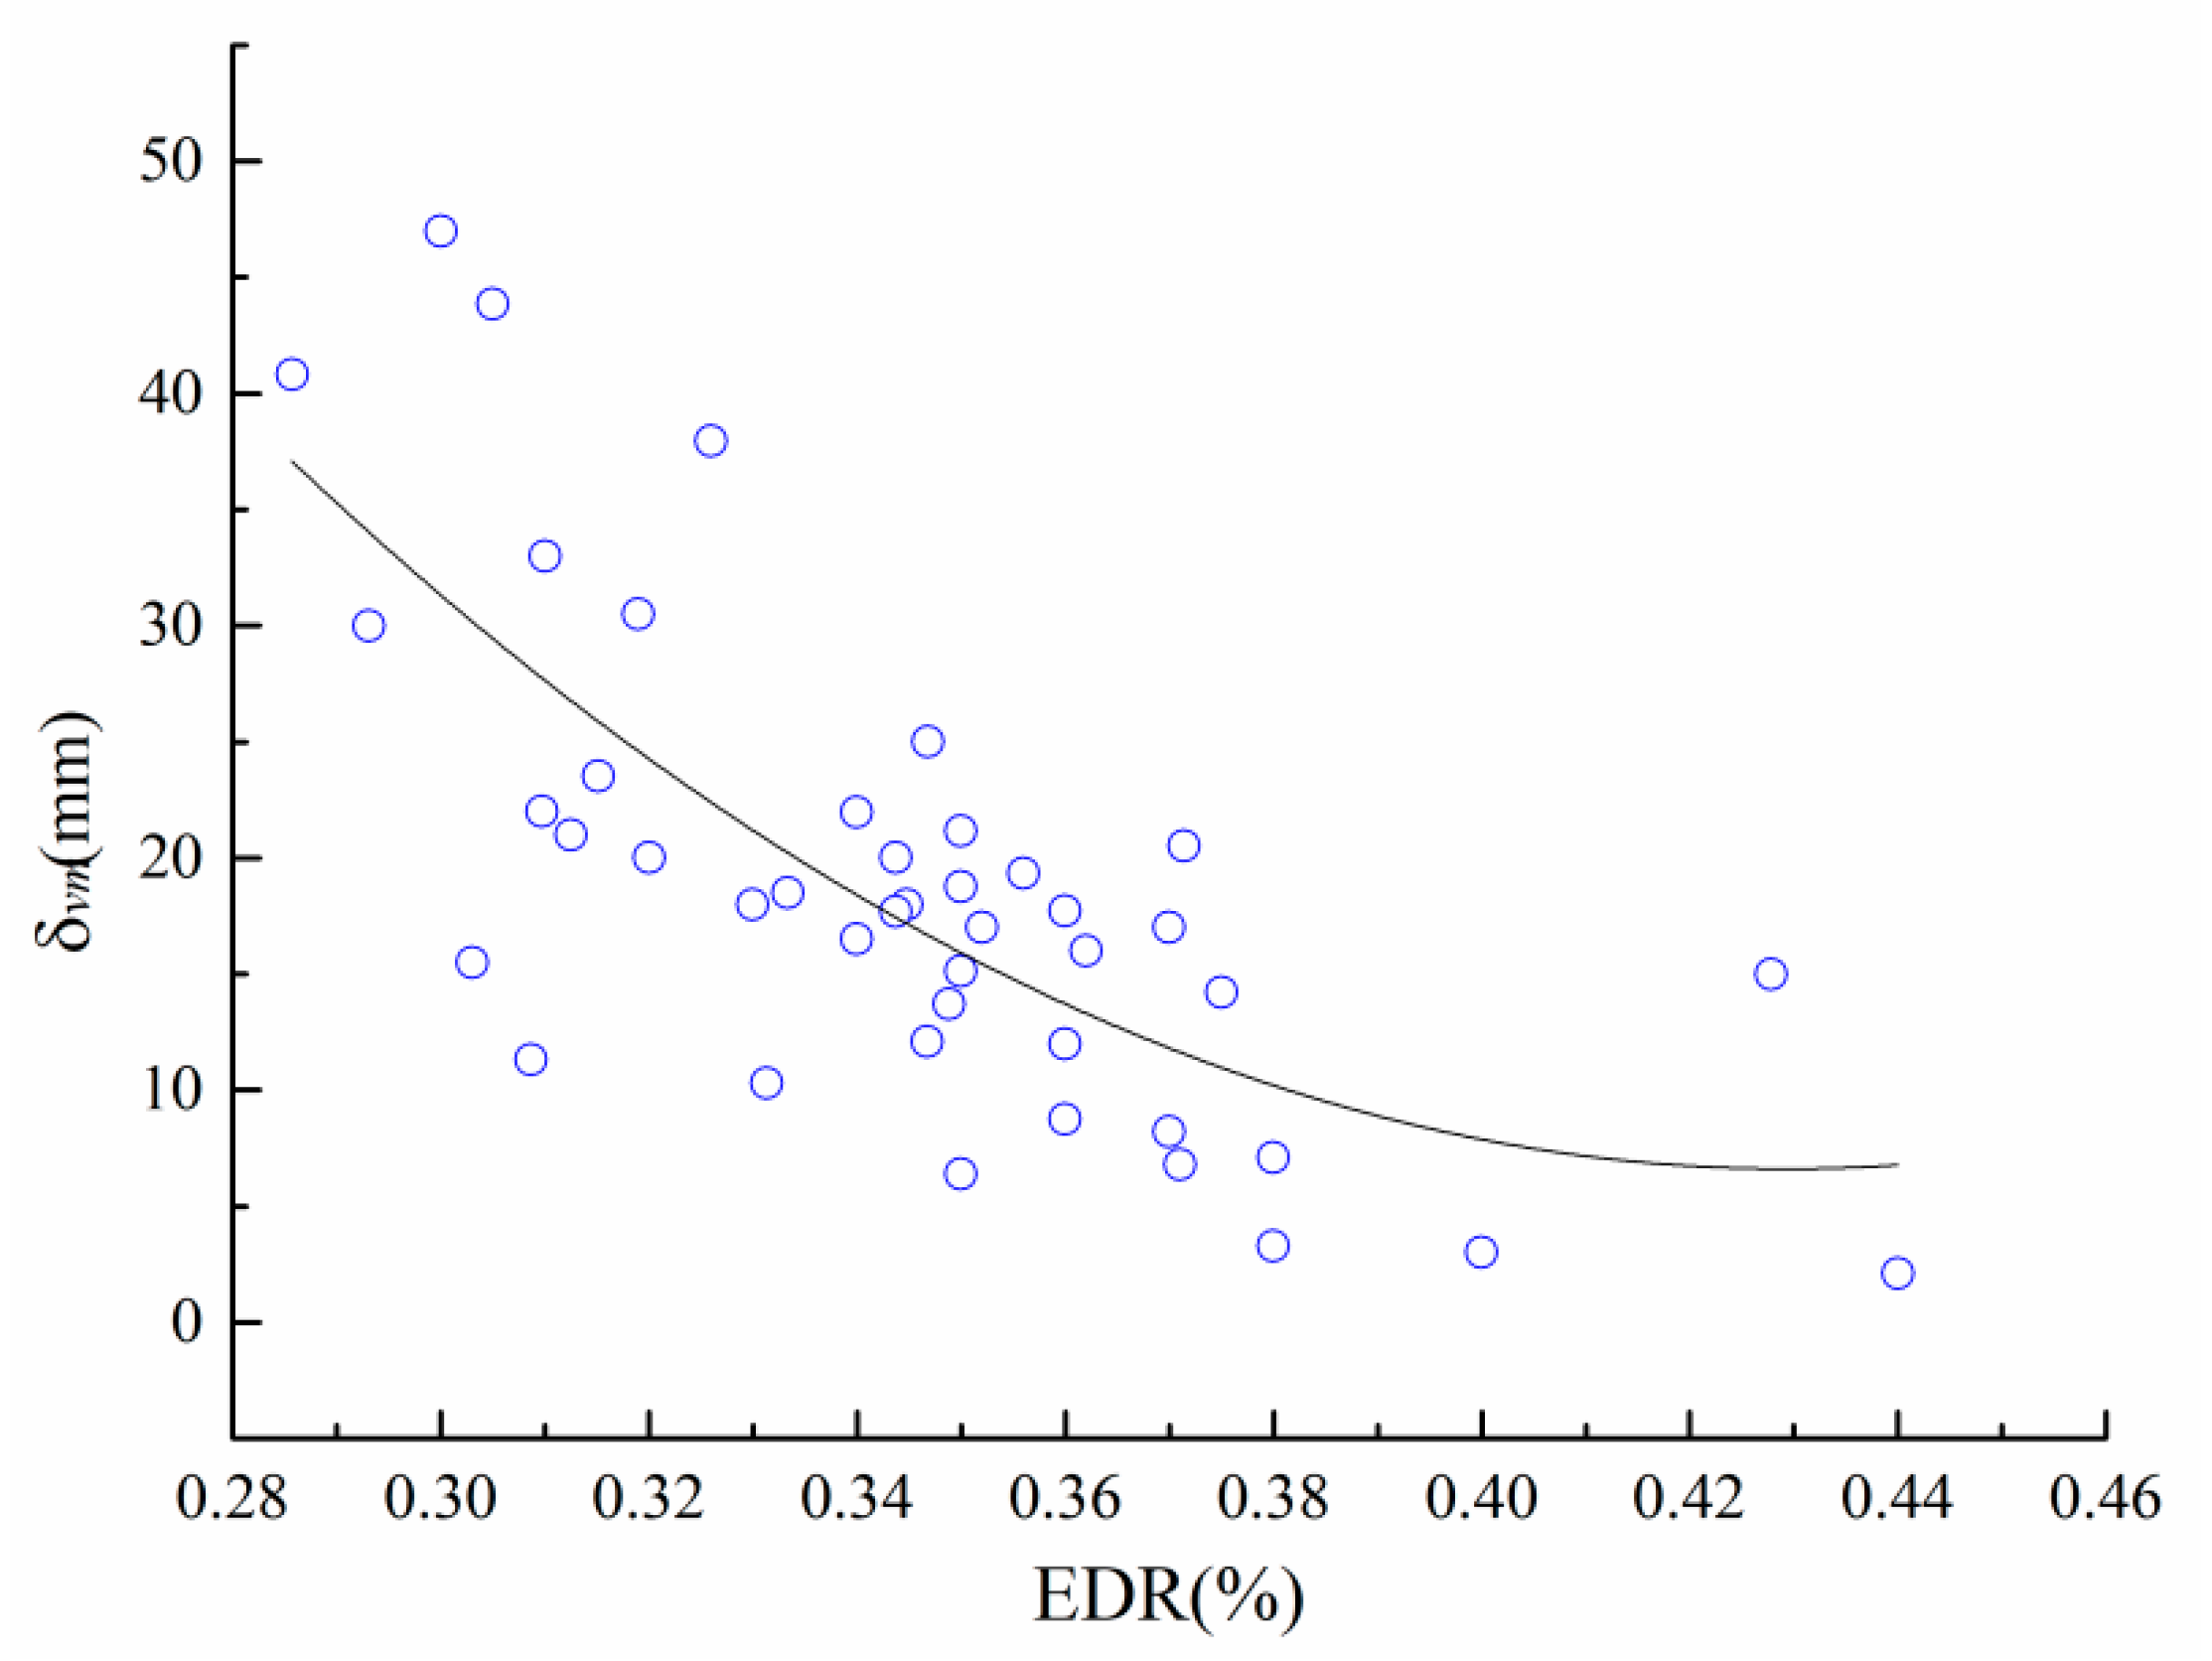
3.3.3. Embedded Depth Ratio

The embedded depth ratio (EDR), as defined by Wang et al., concerns the ratio of the embedded depth below the bottom of the excavation site to the excavation depth [1]. It is thought that by ensuring sufficient wall stiffness, and appropriately increasing the embedded depth of the pile, it could improve the anti-uplift stability coefficient and reduce the surface settlement [26]. Based on experience, in some cases, when the EDR is greater than 0.9, the prevention of the surface settlement is not prominent.
Figure 10 illustrates the relationship between the EDR and δvm. The EDR of deep foundation pits in Beijing is primarily concentrated in the range of 0.28 to 0.44, averaging at 0.36. The δvm decreases with the increase of EDR, which predominantly lies between 0.33 and 0.38. There are three stages that occur as the rate decreases. During the steep stage, when the EDR varies from 0.28 to 0.34, the δvm decreases rapidly and linearly. During the declining stage, the rate at which δvm decreases becomes slower than that of the previous stage, and during the stable stage, there is an inflection point in the curve, and the effect of EDR on reducing the surface settlement is not notable. It is evident that for an ultra-deep foundation pit, when the EDR reaches a certain value, the effect is not prominent, but the project cost will significantly increase. Therefore, it is not advisable to blindly increase the EDR.

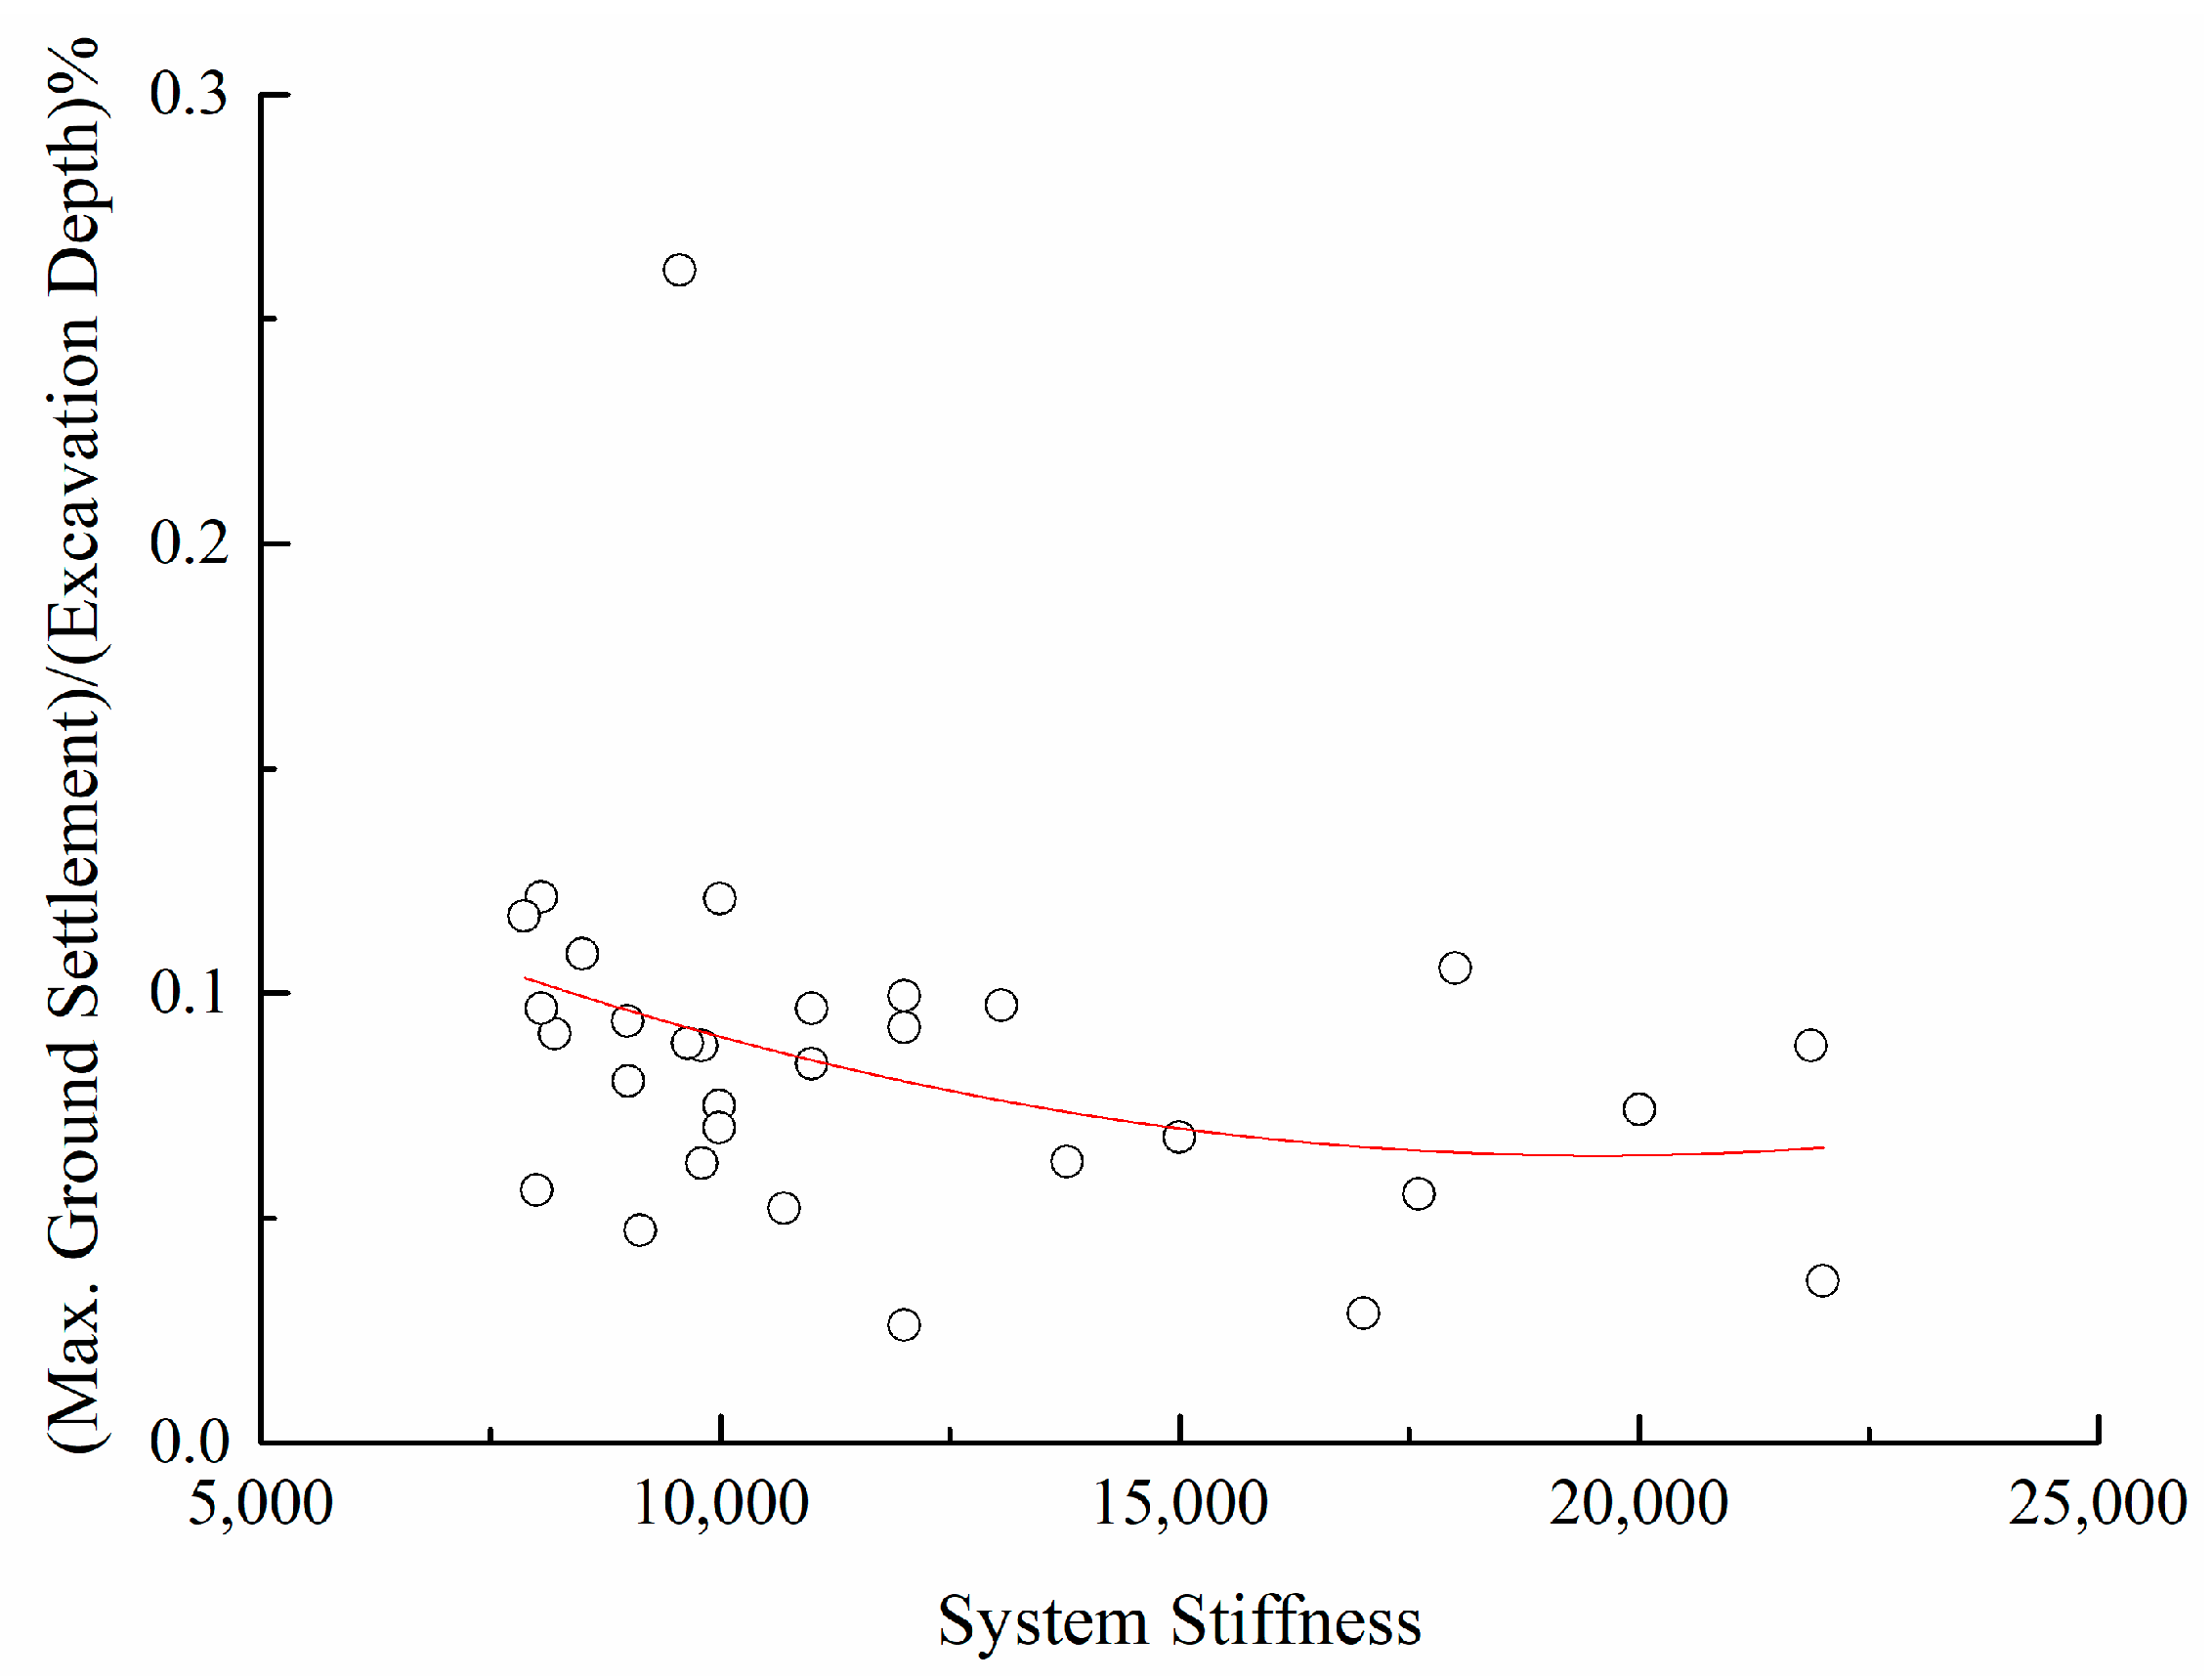
3.3.4. Support System Stiffness

System stiffness is defined by Clough et al. [8], and it is expressed as follows:
K = E w I r w h 4
where I = t 3 12 , Ew is the wall’s Young’s modulus, I is second moment of inertia of the wall section, h is the average vertical prop spacing of a multi-propped support system, t is the wall thickness, and r w is the unit weight of water that is introduced as a normalizing factor. The system stiffness (K) is a dimensionless factor covering the wall bending stiffness ( E w I ) and prop spacing (h), implying that the behavior of the retaining system is similar to a structural beam resting upon several supporting points.
In accordance with the principle of equal stiffness, the stiffness of the retaining wall is equivalent to that of the underground diaphragm wall, and it is expressed as follows:
1 12 ( D + s ) t 3 = 1 64 π D 4
where t = 0.838 D 1 1 + s D 3 , D is the diameter of the bored pile, and s is the net distance between piles.
Figure 11 shows the relationship between the stiffness and dimensionless maximum surface settlement. The data in the figure exclude the intermediate working conditions. The stiffness of the supporting system is mainly between 7000 and 11,000, up to 22,000, and it can be increased by decreasing prop spacing or increasing the number of internal struts. This is the main reason why excavations that are supported by bored piles are deeper than those supported by other systems, and bored piles can be applied to all soil types with relatively small dimensionless maximum surface settlements. The maximum surface settlement decreases as stiffness increases. Until the support system has achieved a certain stiffness (>20,000), the effect on reducing foundation pit deformation is not obvious when stiffness is increased, but the construction cost is significantly increased.

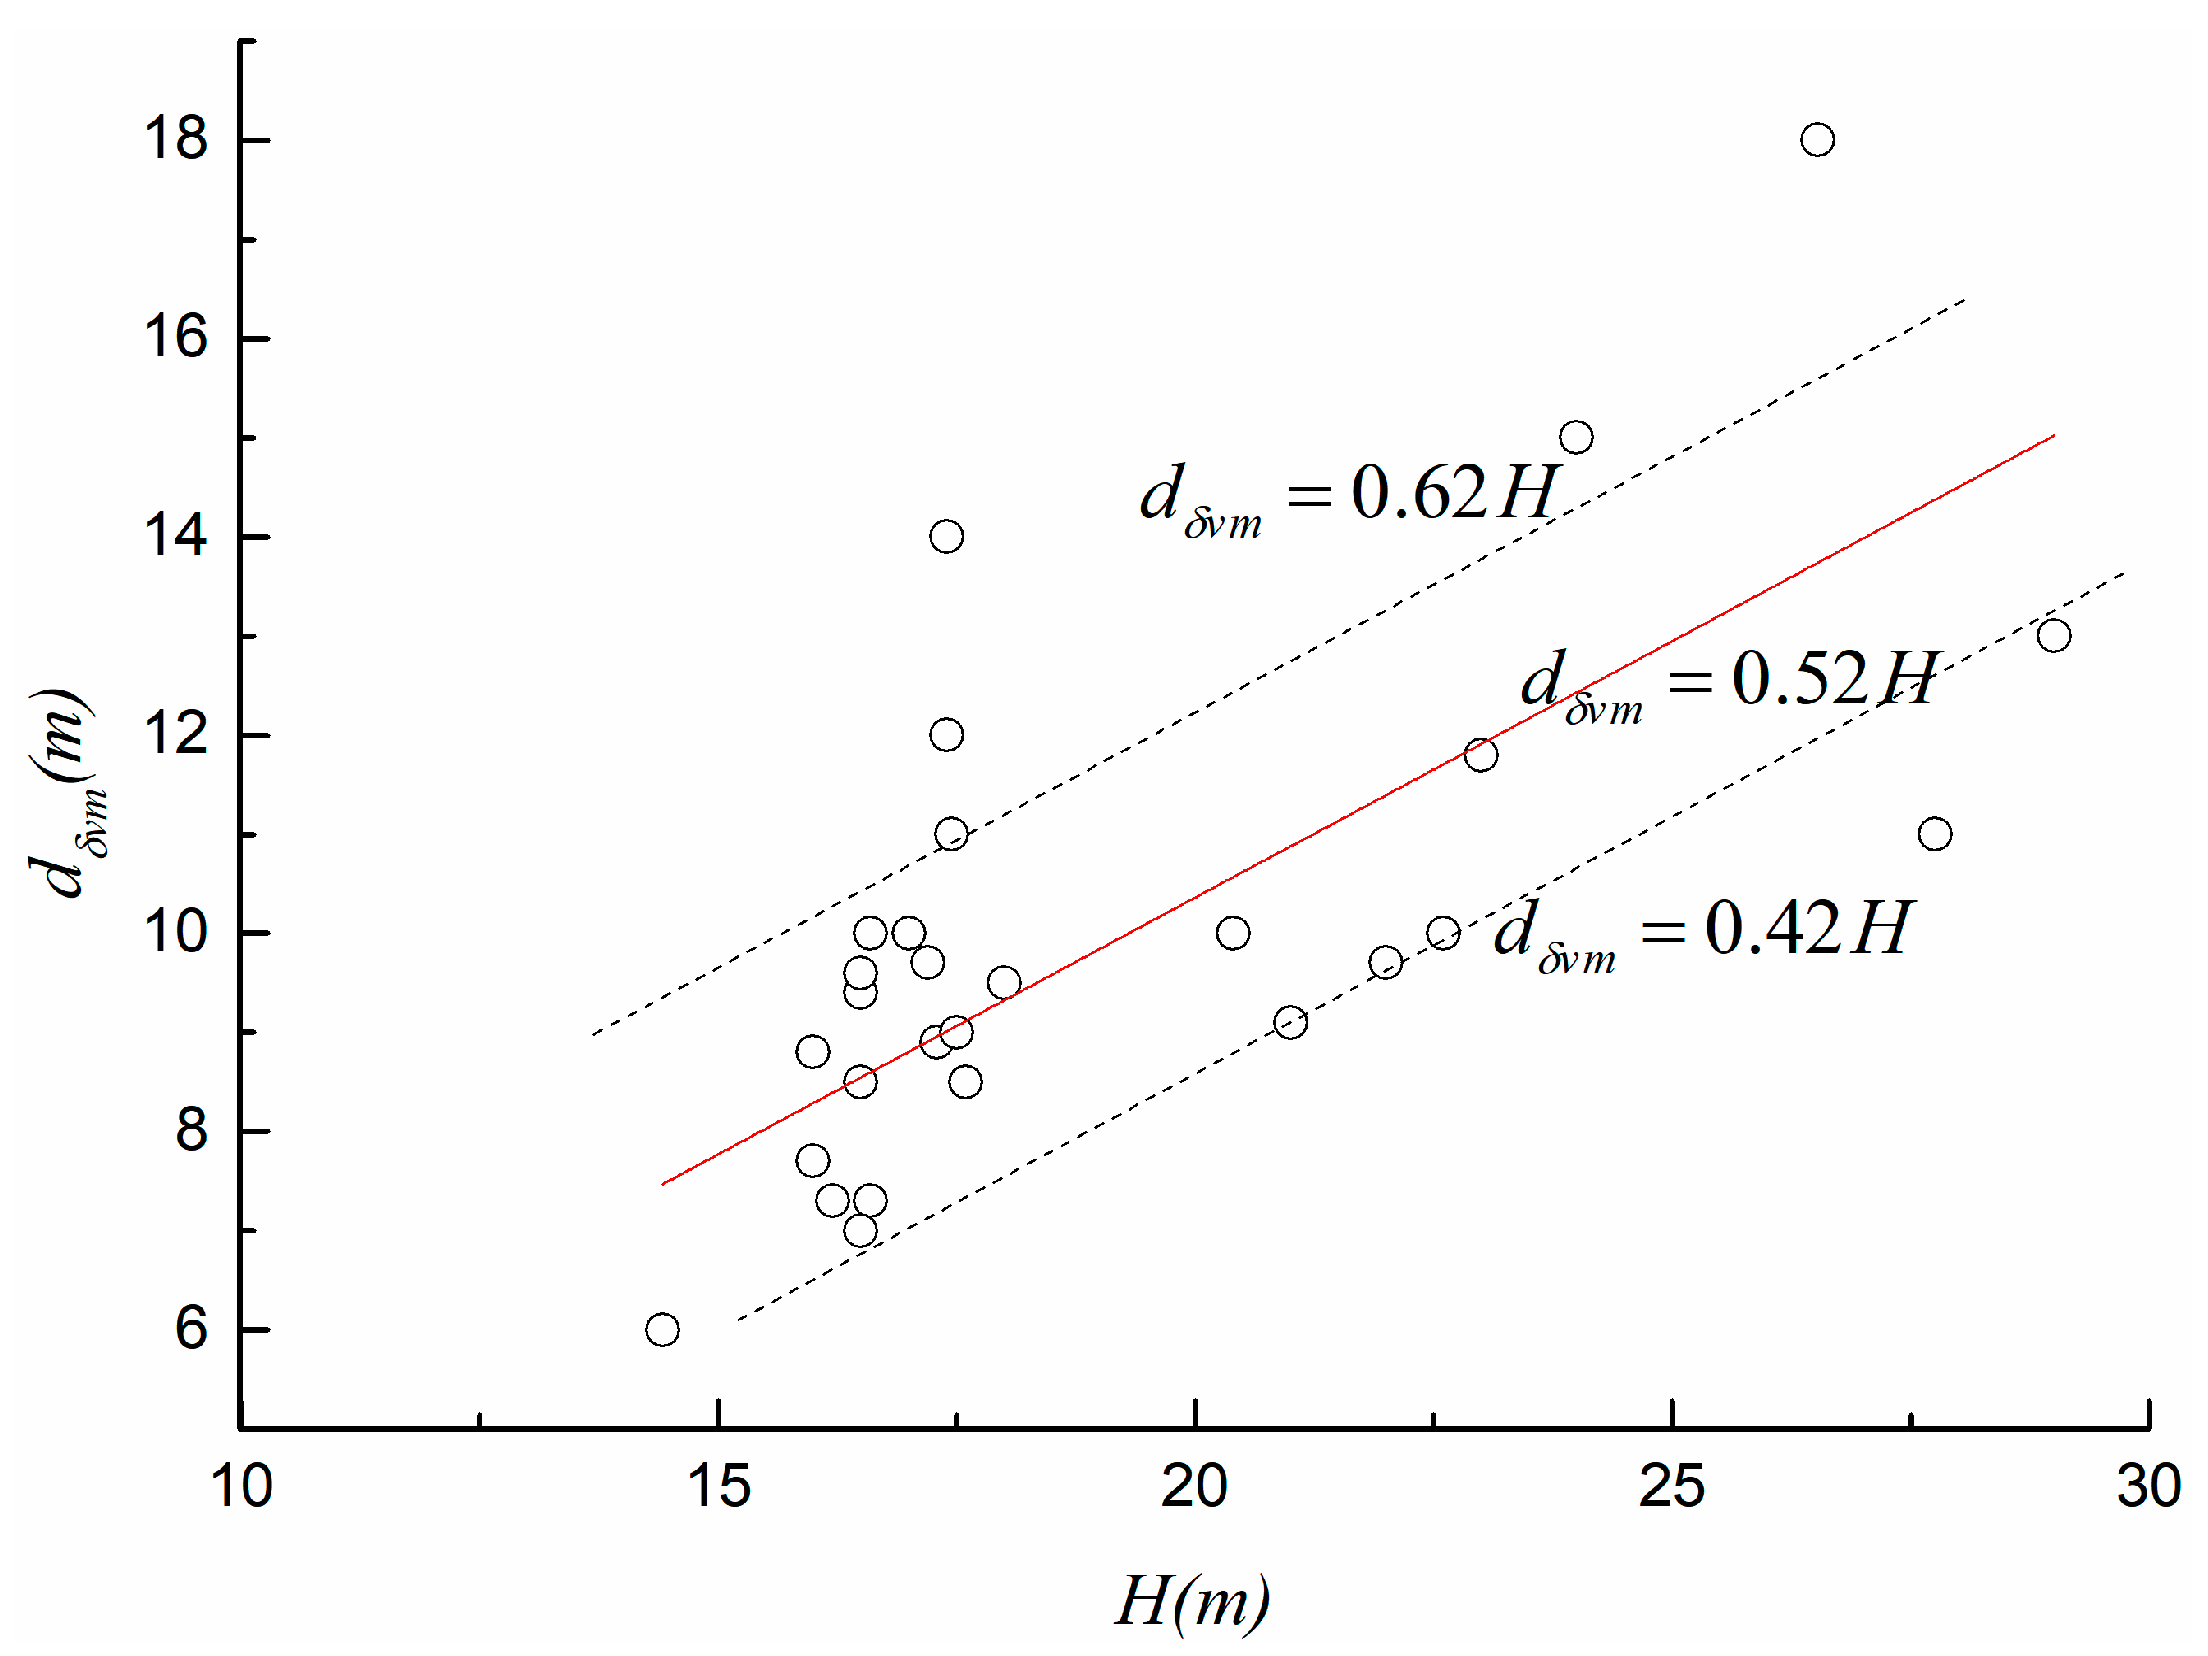
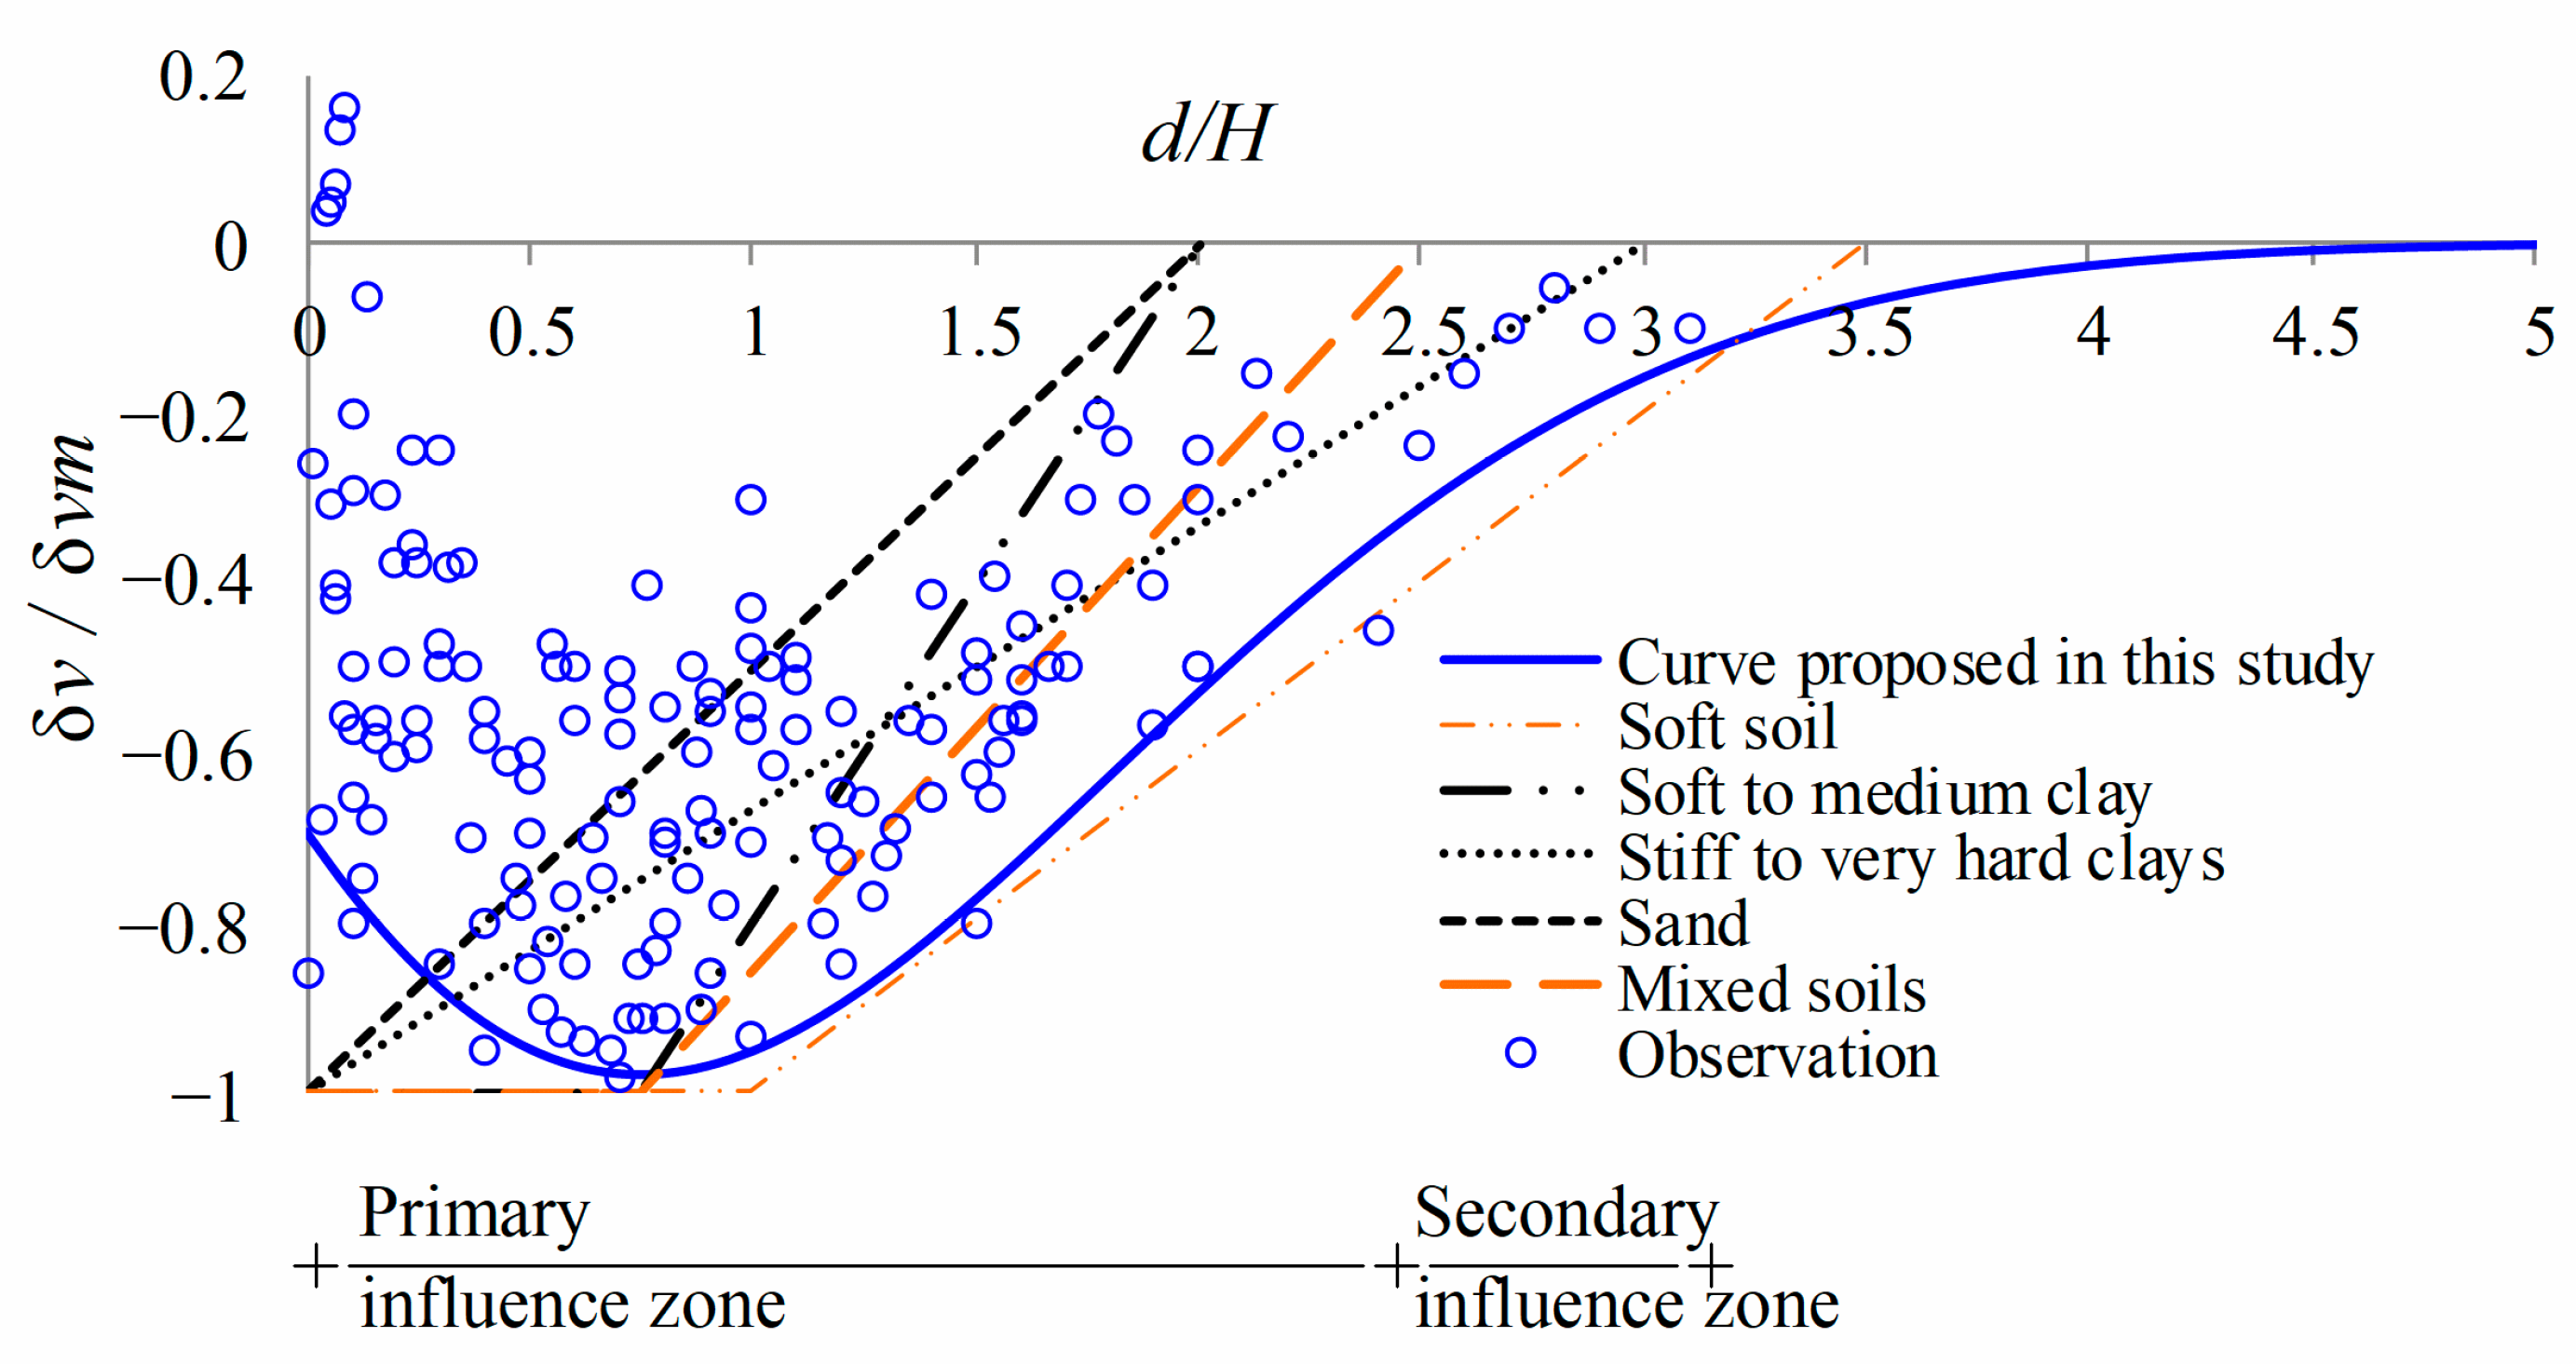
3.4. Deformation Model

Figure 12 depicts the relationship between the location of the maximum surface deformation (dδvm) and the depth of excavation. Figure 12 shows that the position of dδvm moves far away from the edge as the excavation depth increases. However, it is concentrated in areas of 0.42H–0.62H.
Normalized ground deformation, as well as the trends that have been compared with other cases, are shown in Figure 13. The ground deformation varies from 0.2δvm to −0.7δvm, and it is mainly distributed around the wall. The maximum δv exists in areas that are 0.5H–0.75H off the wall. Similar to previous studies, a boundary of deformation distribution is proposed for excavations in Beijing, and the concave deformation profile is described using a polynomial curve. Downward vertical displacement can be observed up to approximately 3H outside the edge, but beyond a distance of 2.5H, the vertical displacement can become small. On the basis of Saint Venant’s principle, the envelope can be divided into two zones, as follows: the primary zone (0 ≤ d/H ≤ 2.5), wherein ground movement is influenced by excavating and supporting procedures, appears to be moderate; the secondary zone (2.5 ≤ d/H ≤ 3), wherein the influence on ground movement is relatively mild, seems to be negligible. The primary zone in Beijing aligns with other corresponding mixed ground profiles [2,15]. It is slightly wider than the trapezoidal boundaries found in soft to medium clay and in sand [7]. However, the secondary zone is more convergent compared with the trapezoidal boundaries observed in stiff to very hard clay, resembling that of soft soils [1].

4. Discussion

Ground performances associated with excavation mainly exhibit themselves in terms of surface settlements, 83.9% of which generally range from 0 mm and −30 mm, and slight upheavals were found near the corner. Since deep foundation pits are excavated in a hard stratum, soils at the bottom will rise due to the unloading effect, which also drives the surrounding soil upward together. Moreover, the lateral soil of a foundation pit produces a movement trend of displacement and sinking. However, because of the support system, this trend is restrained. The two motions interact with each other. Upheaval predominantly appears in terms of upward movements. We can observe a noticeable reduction in settlements adjacent to the wall that have been embraced locally. This may be attributed to the friction and potential intermingling occurring along the interface between the contiguous pile wall and soil [15].
In this study, maximum surface settlements appear more convergent than those in cases from other areas. δvm develops with increasing H, and it generally ranges from 0.04%H to 0.12%H, with an average value of 0.089%H (generally< 30 mm). The magnitude of δvm is similar to the records in cases involving a certain thickness of soft soils overlying stiff and hard strata, such as stiff clays, residual soils, sands, and weathered rocks [2,7,8,14,15], or in stiff strata [20]. The geological condition of bottom strata may determine the influence of the overlying soft soil of a certain thickness on δvm as stiffer materials predominate, otherwise, the δvm is much lower than that in soft soils or in mixed soil conditions; this is because soft materials predominate, since soil has a high reference strength when particles are uncrushable or strong [21]. The support stiffness and EDR can also affect the δvm, and the opposite tends to occur when the maximum ground surface settlement is exhibits an increasing EDR and support stiffness. The restriction of the angular particle movement in granular soils may be stronger under the same support force [22]. The δvm decreases until it is not obvious, which is when the EDR reaches 0.4, or the support system has achieved a certain stiffness (>20,000). It seems that a further increase in stiffness for support, nor the penetration depth of the wall, can influence the performance of the excavation, since the stability of excavation is guaranteed. The EDR and support stiffness increase the bearing capacity factor to an extent, and the effect may diminish beyond it [27,28]. It is suggested that an increase in the EMR and support stiffness cannot contribute to a corresponding decrease in settlement if the excavation has become stable. In Shanghai soft soil areas, the maximum EDR was 1.52, the minimum was 0.45, and the average value was 0.88. In Hong Kong, there is a maximum EDR of 1.6, a minimum of 0.28, and an average value of 0.96. The average EDR of 13 foundation pits in the sandy soil stratum was 0.47, whereas that of the clay stratum was 0.44 in Japan. The average EDR of 14 foundation pits in Chinese Taipei was 0.65. In this study, the maximum and minimum EDR of bored piles in the collected foundation pits are 0.44 and 0.28, respectively. Numerous studies have shown that the EDR is greatly affected by strata conditions [29]. The main soil layers in Beijing are silty soil, silty clay, medium-coarse sand, and gravel, which have a strong embedded effect upon pile toes, and they provide more support against the base upheaval [7,30]. As the strength of a dense specimen increases with an increase in particle size when particles are uncrushable or strong (have a high reference strength), at the microscale, the relationship between strength and particle size is positively related to the friction utilization ratio. This means that it has the capacity to resist interparticle sliding. This ratio generally increases with the increase in particle size, which results in an increasing peak shear strength [21]. Otherwise, the strength of a dense specimen, as well as the friction utilization ratio, reduces as the particle size becomes smaller. Moreover, damage onset, damage development, and failure may occur during the entire process wherein soft clay is subjected to loading during the support system’s construction. The total volume and number of pores increase, and the distributions within the soil, comprising aggregated particles and pores, become looser due to loading, which may also lead to the destruction of the soil fabric [22,23,24]. The embedded depth ratio is much lower than that of Shanghai soft soil [31], Hong Kong mixed soil, and Taipei soil clay [2], which is closer to that of silty clay and clay soils in Japan [30].
The final deformation for different strata conditions in different sites varies, but ground movements are relatively consistent in all cases [32]. Ground movements have obvious temporal and spatial laws. The deformation is reduced from the middle transect to the corner. Although the influencing zone is influenced by the excavation level to an extent, and it reaches a distance of about 2.5H–3H (approximately 25–40 m), the location of δvm seems not to be influenced by workmanship, and generally, it shows a progressive trend in locations where the value is 0.42–0.62H (approximately 10–15m), and when it’s position moves away from the wall. Little variation in terms of settlement is found outside of the range during excavation. Analogical results were found in other sites, which also seem to be independent. Throughout all stages of excavation, stress consistently accumulates in the soil surrounding the retaining wall and near the surface being excavated [3]. This may explain why the position of the deformation on the maximum ground surface seems to not be moving in accordance with the excavating depth. The maximum surface settlement occurs when the 1~2 struts above the bottom plate are removed. The removal of the brace can result in significant ground movements [33]. In this study, the removal of bottom supports (i.e., struts) to construct the internal structure, induces additional surface settlements and an inward bulging of the wall; this is because of the large soil pressure on the pit wall and the low stiffness of the internal structure. With the completion of the internal structure, it has greater stiffness, and gradually and effectively, it bears the soil pressure acting upon it. Thus, the deformation is reduced and it converges. Since the removal of the struts of the upper half, the wall system exhibited adequate lateral stiffness with the presence of a few slabs, resulting in minimal additional settlements. Some minor upheaval appears during post-excavation, which may be partly attributed to the rebound of both soil and wall due to the reduced vertical load [15]. The deformation at the corner is restrained by the soil and maintenance structure on both sides, whereas the buttressing effect of the excavation corner helps reduce settlements.
Groove patterns are found on the ground surface around deep excavations in Beijing. During the initial phase of excavation, there is minimal lateral displacement observed in the wall due to the presence of adequate lateral support or sufficient stiffness in its upper section. However, as the excavation progresses, the upper part of the wall becomes constrained, and it experiences inward deformation around the excavation site (significant inward movement). Consequently, there is a predominance of inward movement in deeper sections of the wall, compared with that occurring in its upper portion [2]. It is important to mention that the proposed boundary for the distribution of deformation bears resemblance to the one suggested by Leung and Ng for excavations in mixed ground conditions. However, it should be noted that the influence zone shows slightly patulous, approximately equivalent to zones comprising stiff to very hard clay [7], yet it is still more convergent than soft clay. This discrepancy may arise from the fact that the Beijing mixed stratum is primarily composed of silty soil, silty clay, medium-coarse sand, and gravel. Notably, the relationship between the peak shear strength and particle size depends on the crushability of particles and the relative density of specimens. When the crushability of particles is high, the strength decreases in accordance with the particle size [21]. Medium-coarse sand and gravel exhibit less stiffness than volcanic and granitic rocks. The stiffness of these materials could potentially impact the influenced extent of deformation by limiting the number of surfaces that fail [20]. Deformation is equally influenced by stratum conditions, and it does not solely rely upon support from system stiffness [15].

5. Conclusions

Based on data from 88 cases, characteristics of surface deformation caused by excavations have been studied. The following provides a summary of the field measurements and our findings:
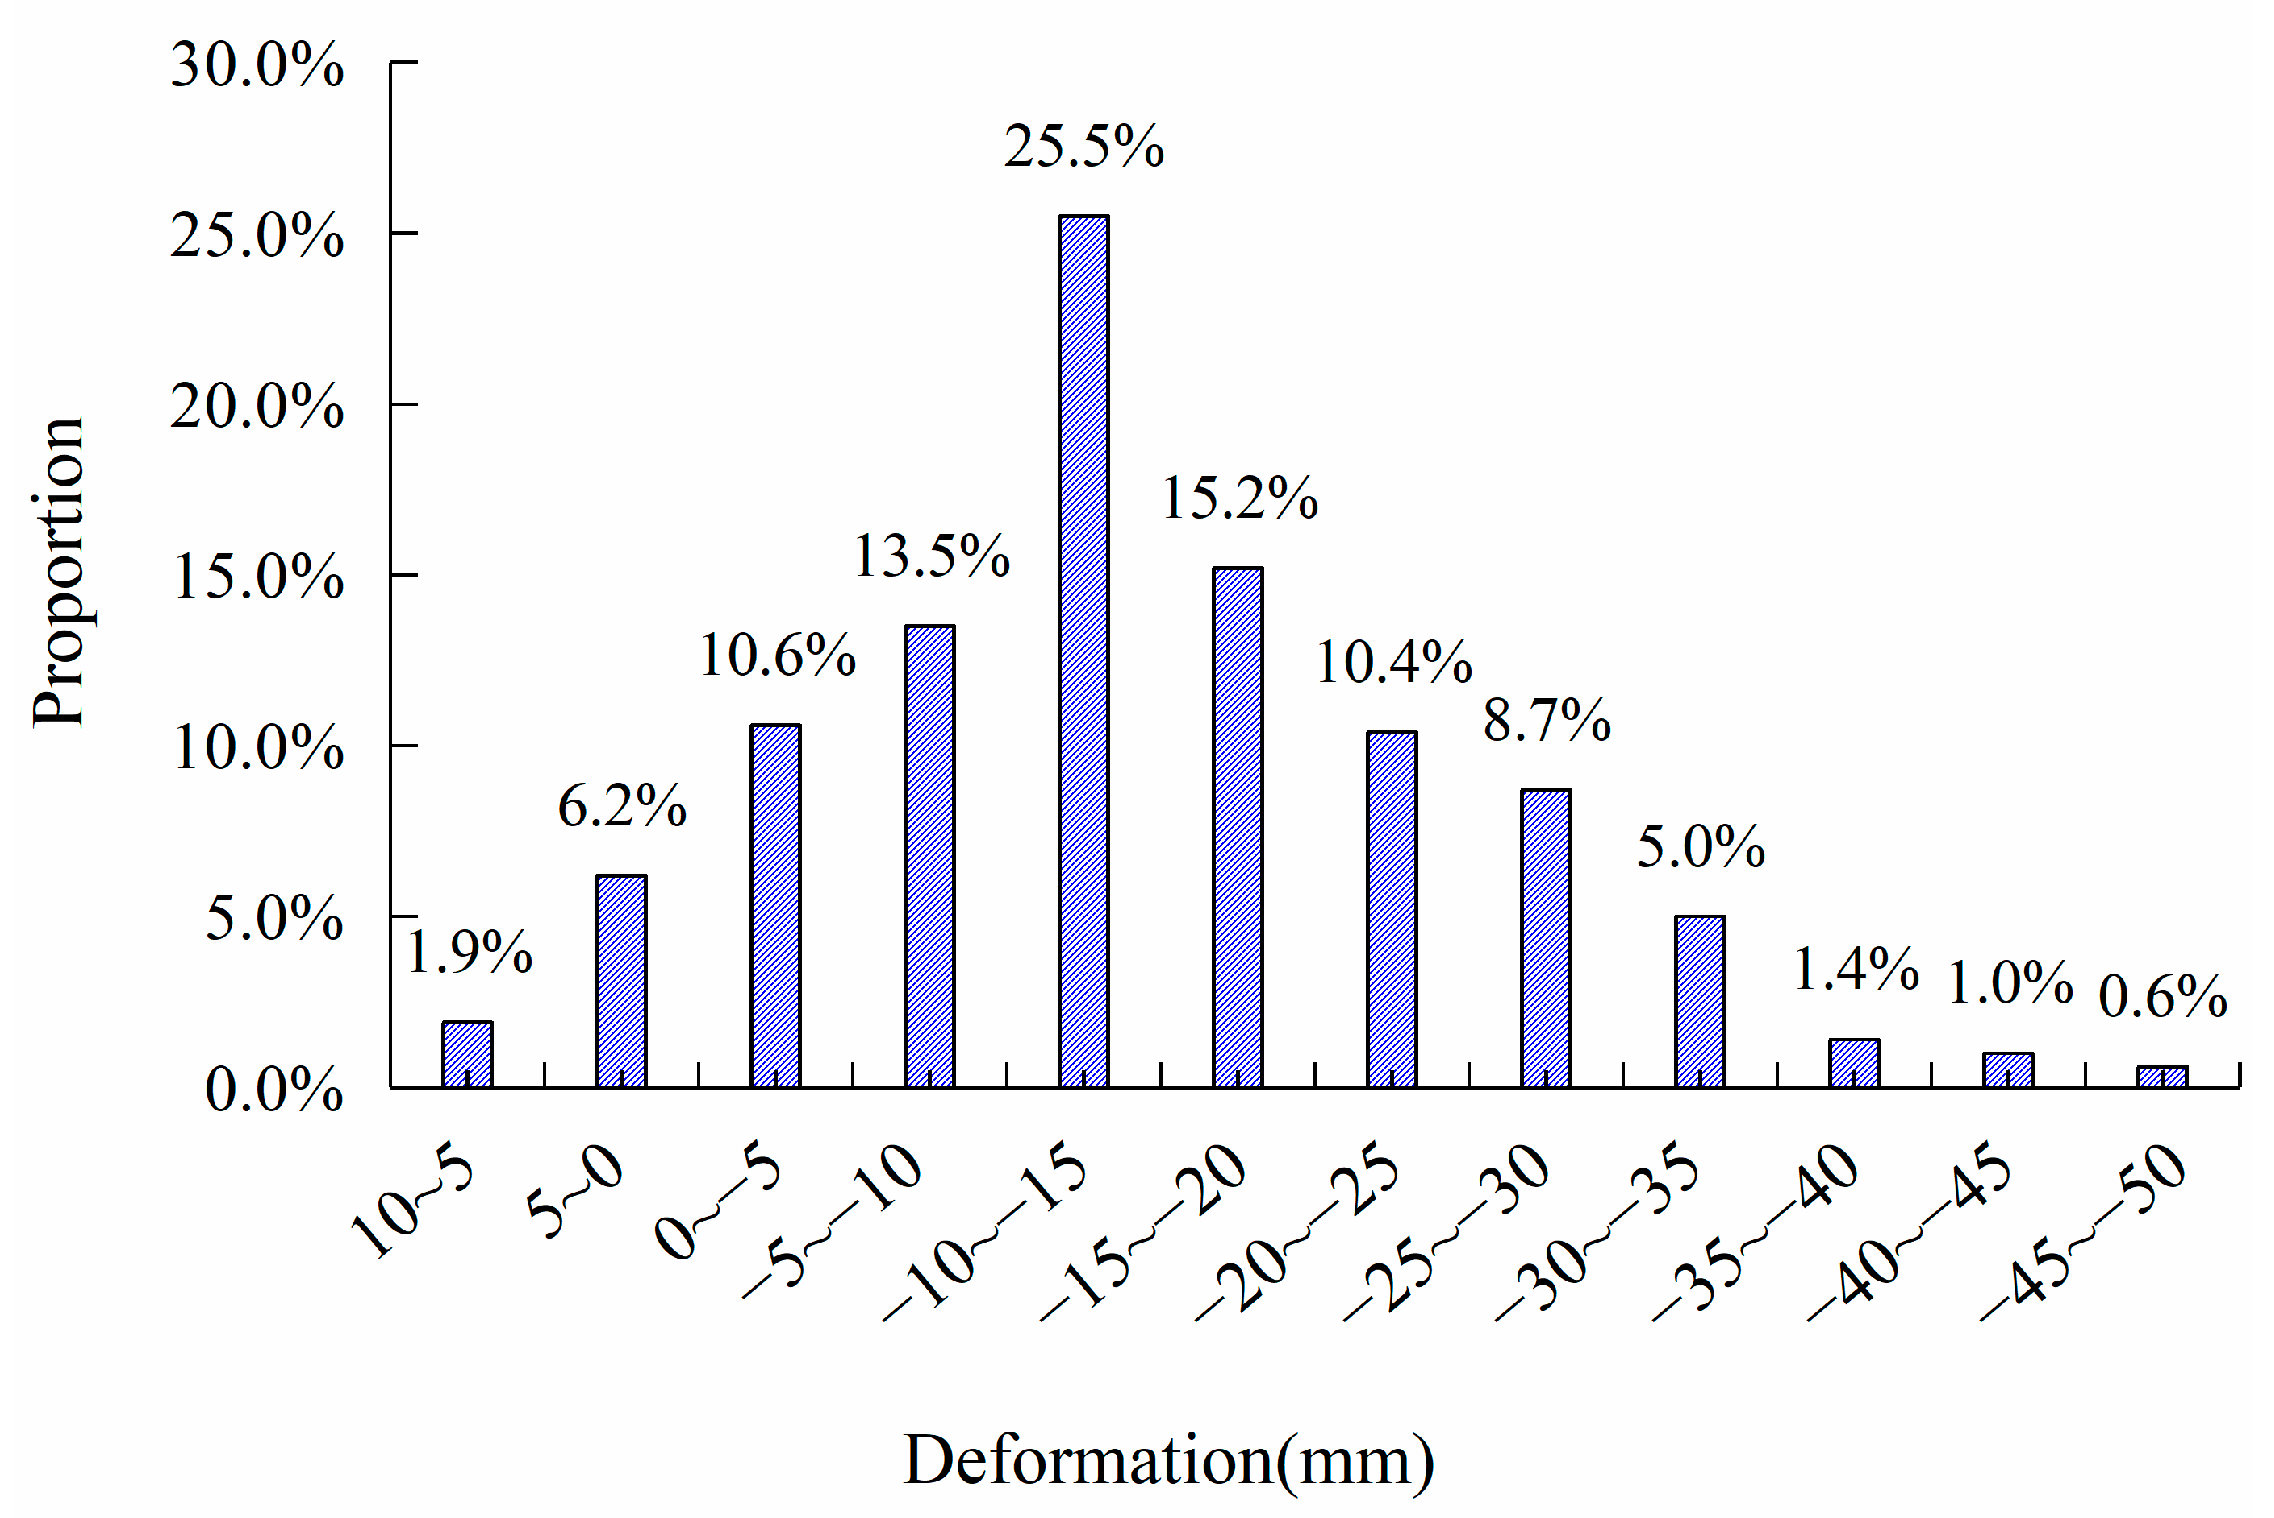
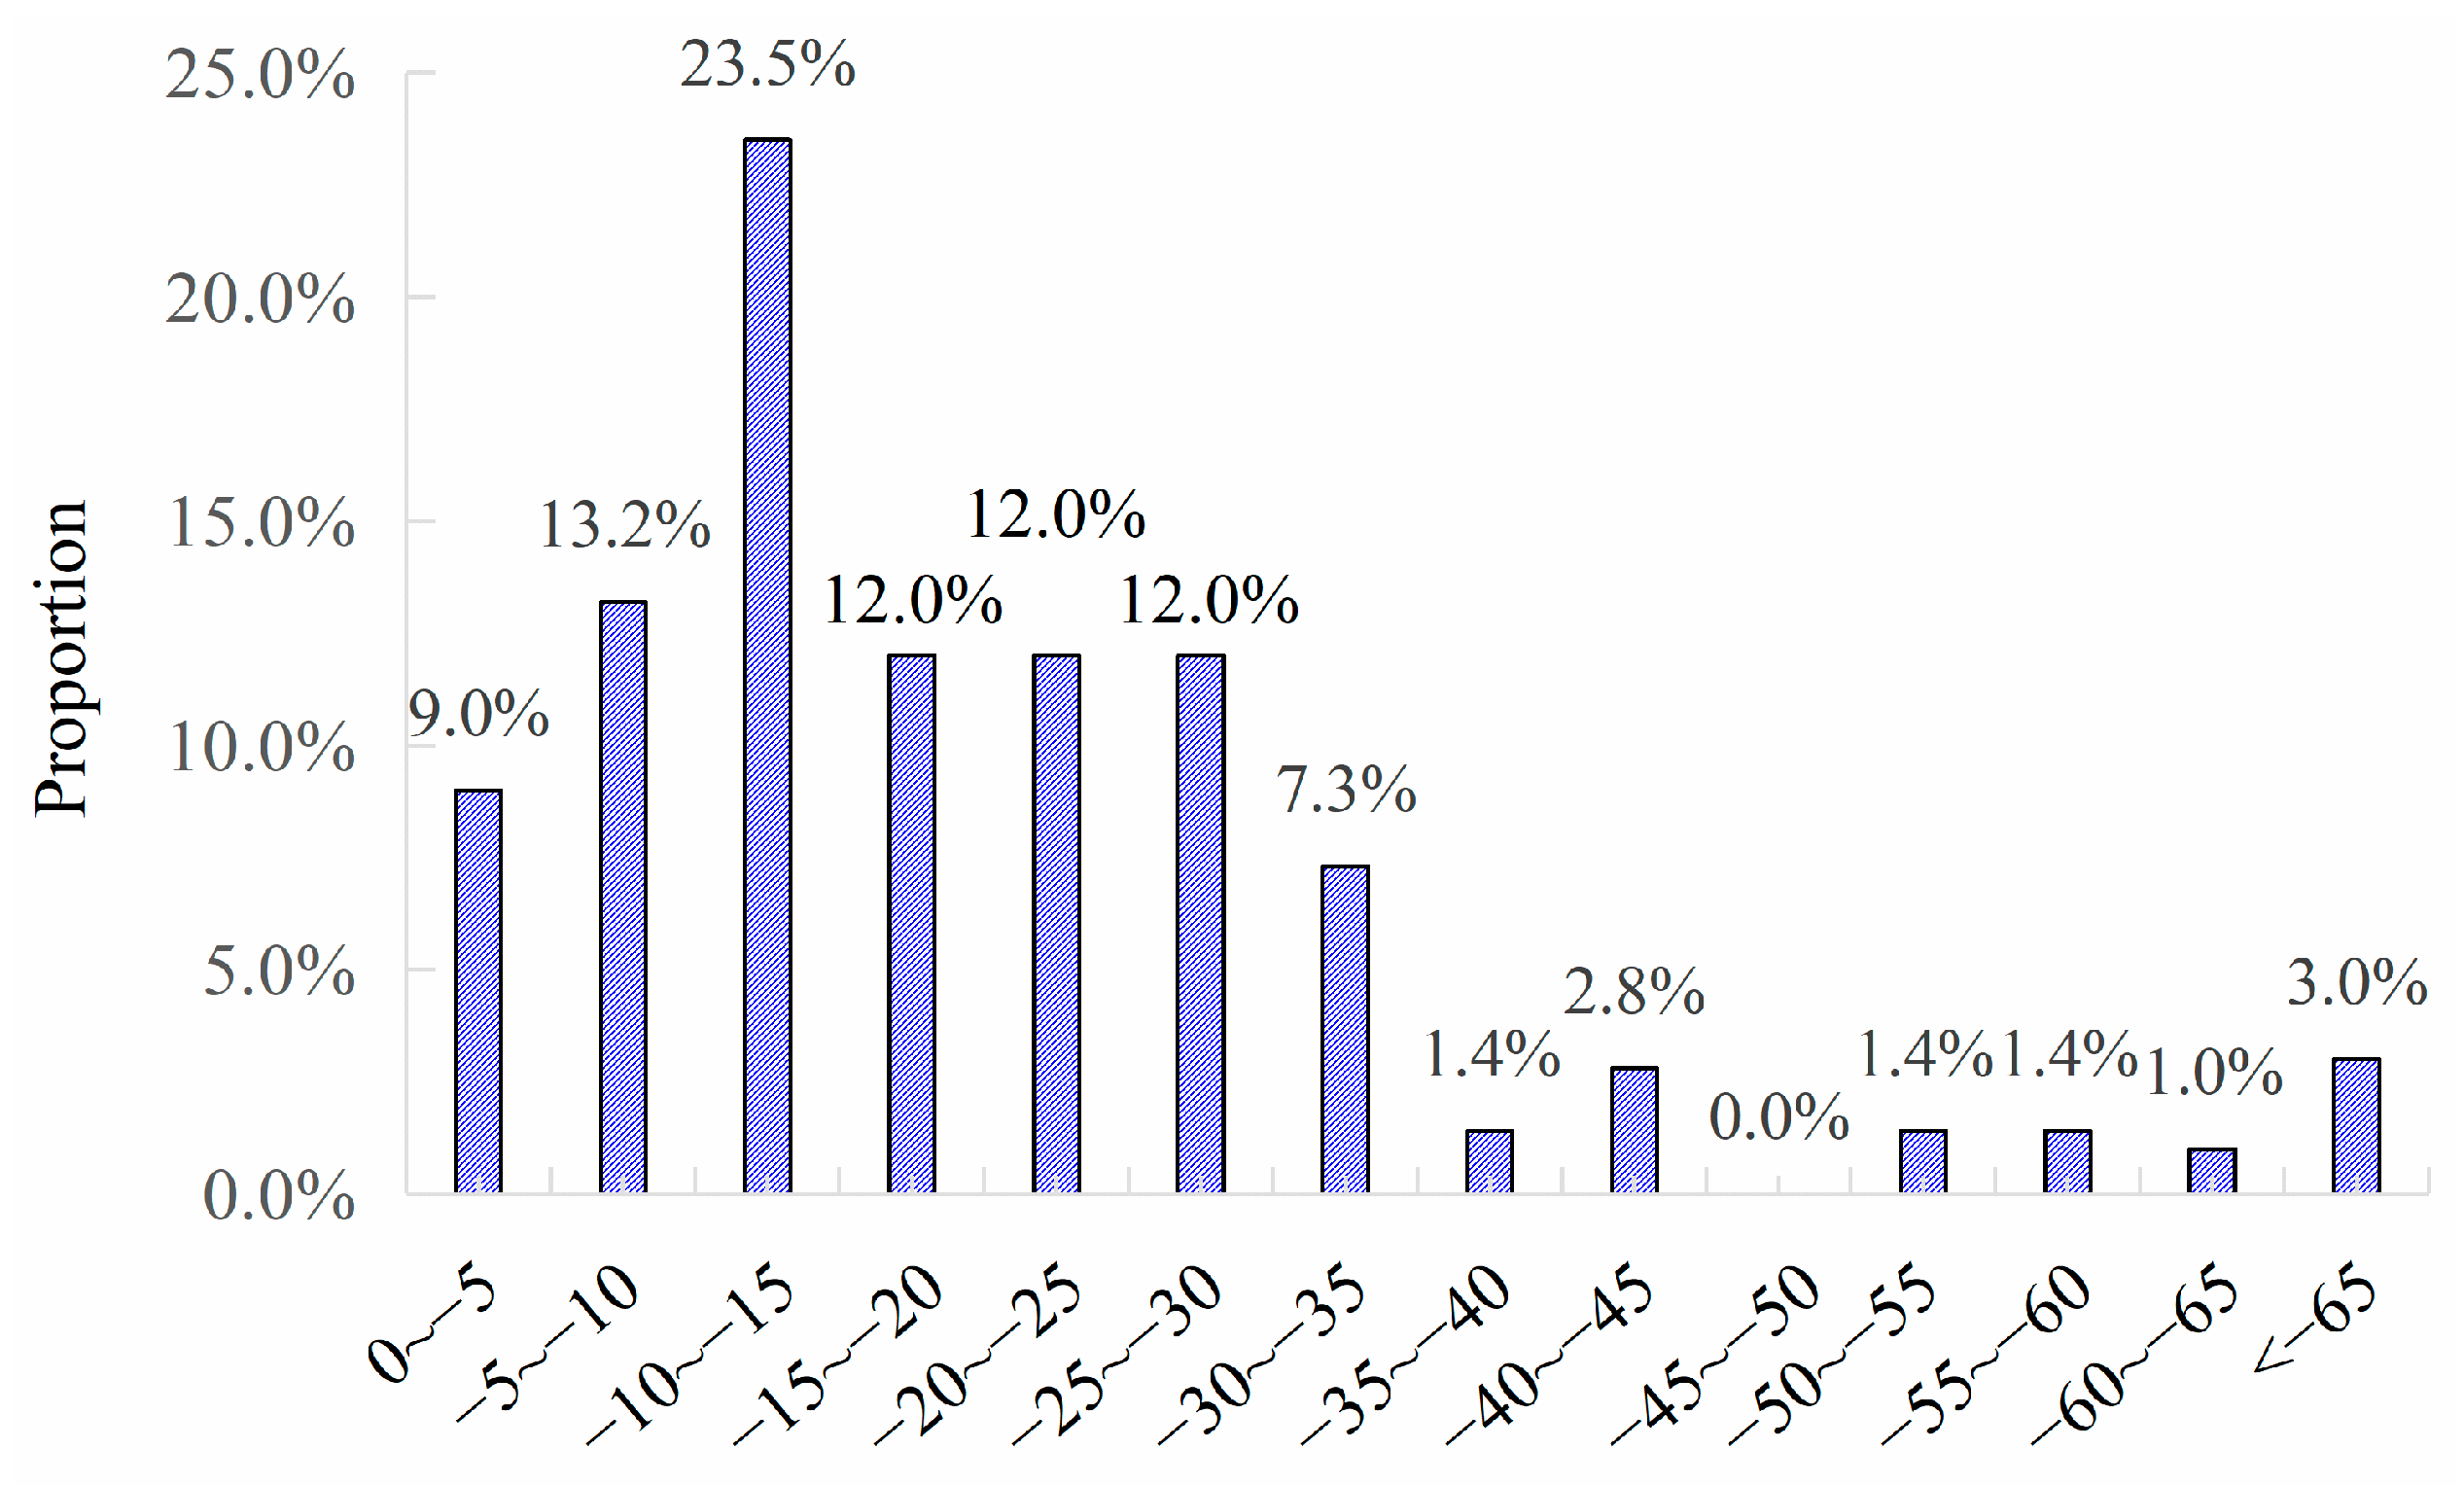
  • Long strip pits are susceptible to considerable deformation, which increases with the length–width ratio. The typical range of surface deformations that occur due to deep excavations is between 0 and −30 mm, accounting for approximately 83.9% of the total. Only 8% of measurement points exhibited settlements with values greater than −30 mm. Points indicative of upheaval represent 8.1% of the points. Deep excavations can lead to both surface settlement and ground upheaval. Minor upheavals were observed within a range of 5 m from the edge corners, which decreased in accordance with increased excavation levels, and they featured a few final data points.
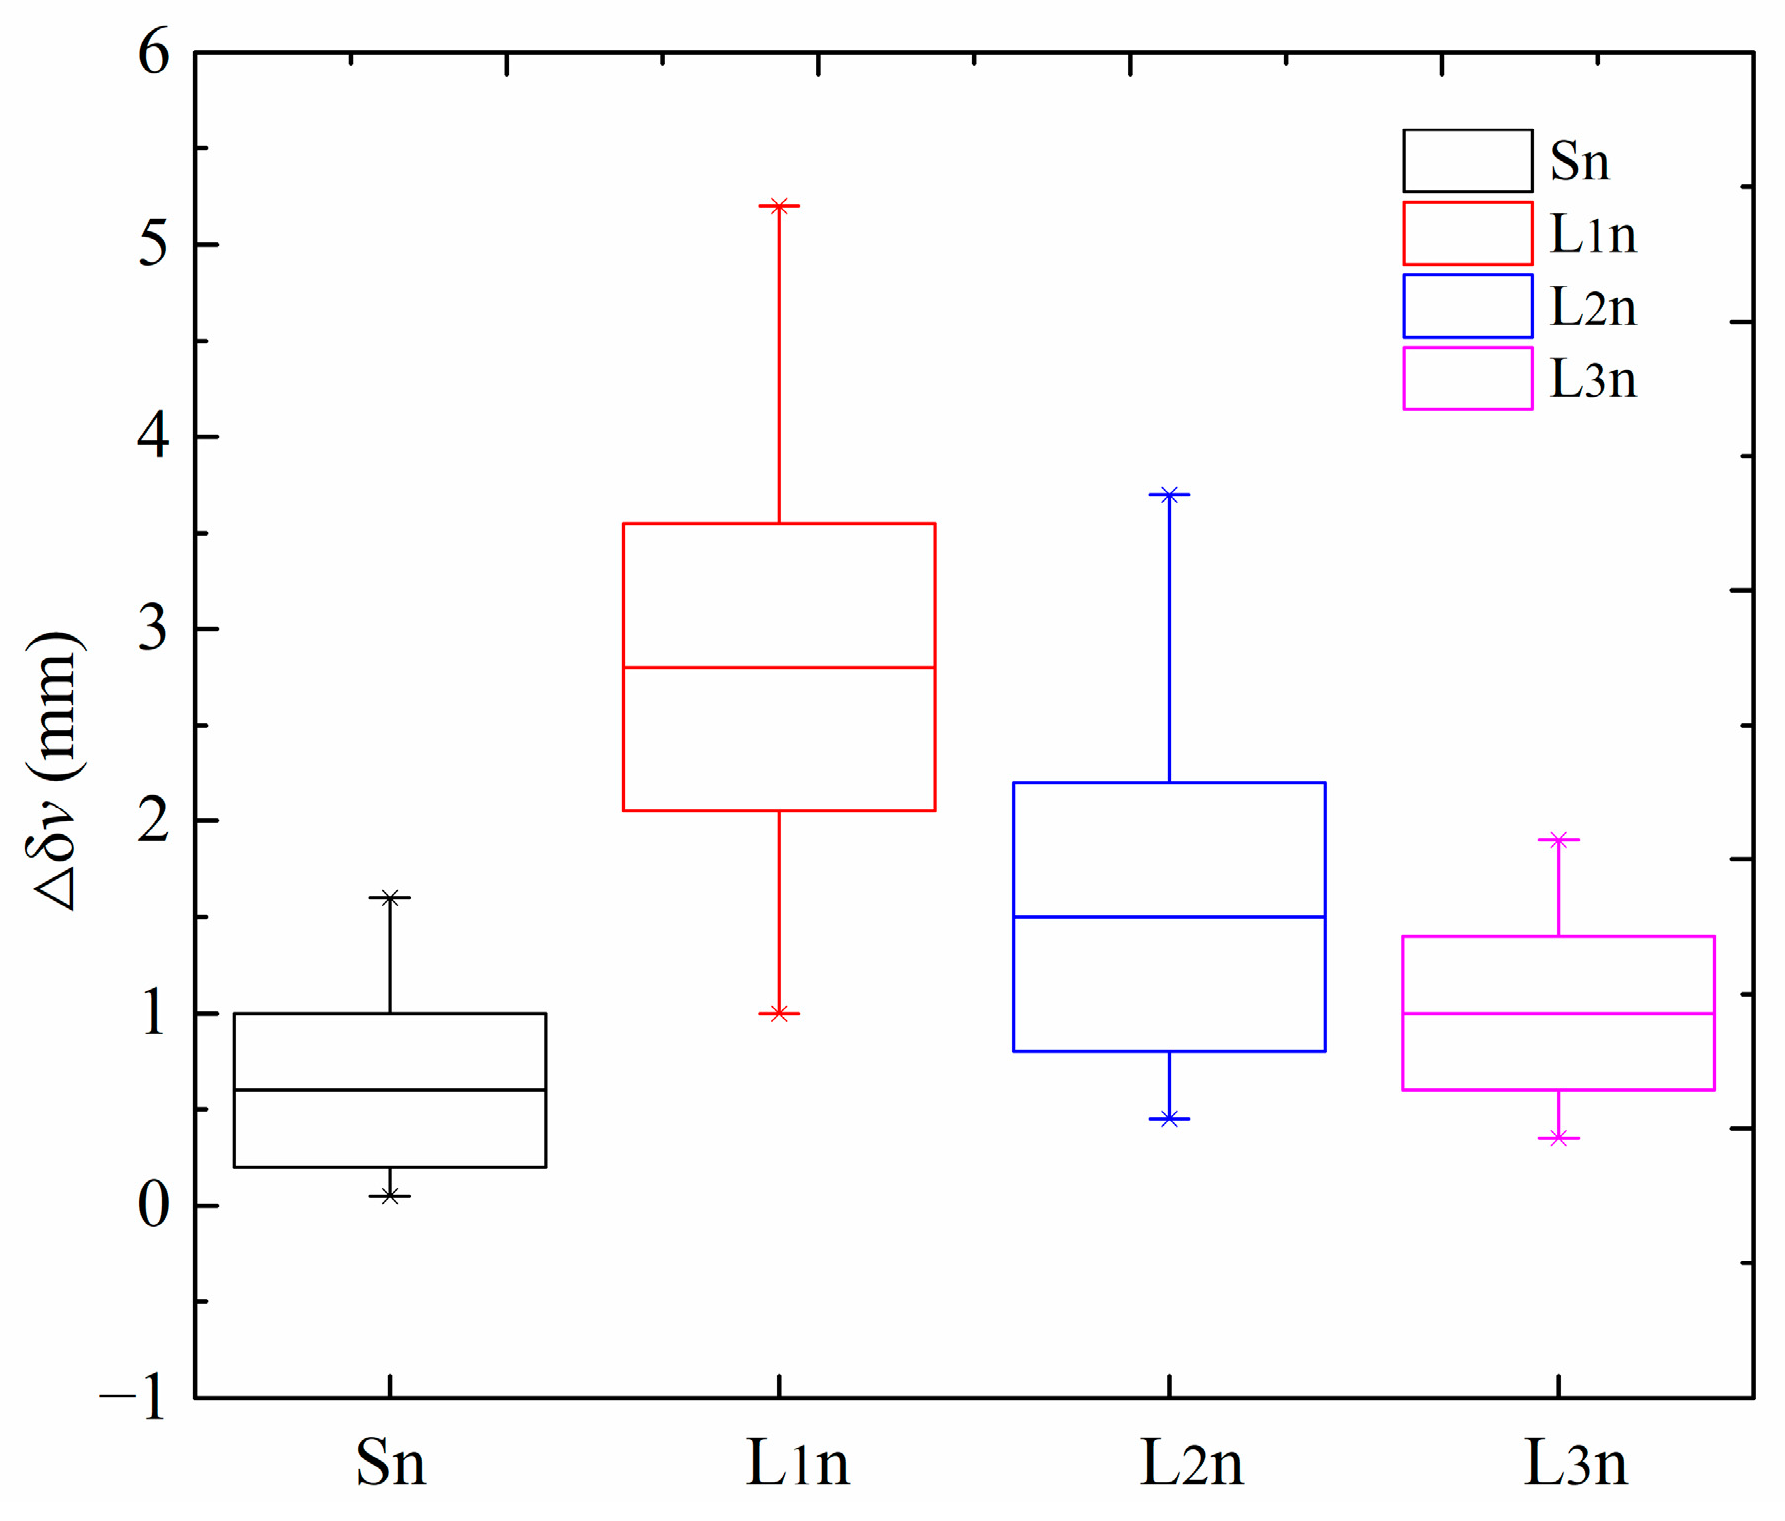
  • Maximum ground surface settlements are influenced by workmanship, they increase in accordance with the excavation depth, and they decrease as the embedded depth ratio (EDR) increases. The average values for these are 0.089%H (typically under 30 mm) and 0.36, respectively. Settlements are affected both by ground conditions and support system stiffness, and they reduce in size as stiffness increases. However, an increase of 0.6 ± 0.4 mm~2.8 ± 0.75 mm occurred during the demolition of 1–2 struts above the base plate. The additional stress from this demolition was the result of substantial soil stress and a smaller internal structure stiffness. Unlike some studies in the literature, the maximum surface settlement was found to not always occur during excavations to the bottom level. It is suggested that temporary reinforcements should be utilized in deep and large excavations as to minimize distortion.
  • The deformation exhibits clear temporal and spatial effects. Each point’s settlement rate gradually increases with the progression of the excavation level over time, particularly at the start of drainage consolidation. However, once the internal structure is operating, the deformation tends to stabilize. Each wall tends to exhibit a depression behind it, with maximum deformations occurring in the middle of its long edge. Deformation is comparatively lower along the shorter side, and it reaches its minimum at the corners where stiffness is increased due to the additional constraints of the oil and support structures.
  • The “groove” patterns of the surface deformations are detected in excavations which have sufficient stiffness in Beijing, which are located at a distance of 0.5H–0.75H from the wall. The influence zones generally extend up to a maximum distance of 25–40 m (≤2.5–3H) from the excavation site, with few deformations occurring further than 25 m away the wall.

Author Contributions

S.L.: conceptualization, formal analysis, writing—original draft preparation, review and editing; C.G.: data curation, investigation, writing—review and editing; P.L.: investigation, data curation; M.Y.: conceptualization, review. All authors have read and agreed to the published version of the manuscript.

Funding

The authors gratefully acknowledge the financial support provided by the Natural Science Foundation of China under Grant No. 51978018, the “14th five-year plan” adult continuing education research project of the Chinese Adult Education Association, Grant No. 2021-330Y, the Science and Technology Subsidy Program of China Construction Second Bureau, No. 2021ZX000001, the Science and Technology Funding Scheme for Three Companies of China, and Construction Bureau II, No. CSCEC2b3c-2021-K-65.

Institutional Review Board Statement

Not applicable.

Informed Consent Statement

Not applicable.

Data Availability Statement

Data are contained within this article.

Conflicts of Interest

The authors declare no conflict of interest.

References

  1. Wang, J.H.; Xu, Z.H.; Wang, W.D. Wall and Ground Movements due to Deep Excavations in Shanghai Soft Soils. J. Geotech. Geoenviron. Eng. 2010, 136, 985–994. [Google Scholar] [CrossRef]
  2. Leung, E.H.Y.; Ng, C.W.W. Wall and ground movements associated with deep excavations supported by cast in situ wall in mixed ground conditions. J. Geotech. Geoenviron. Eng. 2007, 133, 129–143. [Google Scholar] [CrossRef]
  3. Ou, C.Y.; Hsieh, P.G.; Chiou, D.C. Characteristics of ground surface settlement during excavation. Can. Geotech. J. 1993, 30, 758–767. [Google Scholar] [CrossRef]
  4. Farzi, M.; Pakbaz, M.S.; Aminpour, H.A. Selection of support system for urban deep excavations: A case study in Ahvaz geology. Case Stud. Constr. Mater. 2018, 8, 131–138. [Google Scholar] [CrossRef]
  5. Peck, R.B. Deep excavation and tunneling in soft ground. In Proceedings of the 7th International Conference on Soil Mechanics and Foundation Engineering, State-of-the-Art-Volume, Mexico City, Mexico, 22–31 August 1969; pp. 225–290. [Google Scholar]
  6. Kishima, S.; Abe, Y. Ground settlement due to large scale excavation in soft clay. In Proceedings of the 12th Conference on Soil Mechanics, Singapore, 11–15 June 1977; pp. 1161–1164. [Google Scholar]
  7. Nicholson, D.P. The design and performance of the retaining wall at Newton Station. In Proceeding of the Singapore Mass Rapid Transit Conference, Singapore, 6–9 April 1987; pp. 147–154. [Google Scholar]
  8. Clough, W.; O’Rourke, D. Construction Induced Movements of In Situ Wall; Geotechnical Special Publication; Geo-Institute: Reston, VA, USA, 1990; pp. 439–470. [Google Scholar]
  9. Long, M. Database for retaining wall and ground movements due to deep excavations. J. Geotech. Geoenviron. Eng. 2001, 127, 203–224. [Google Scholar] [CrossRef]
  10. Moormann, C. Analysis of wall and ground movements due to deep excavations in soft soil based on a new worldwide database. Soils Found. 2004, 44, 87–98. [Google Scholar] [CrossRef]
  11. Liu, G.B.; Ng, C.W.W.; Wang, Z.W. Observed performance of a deep multi-strutted excavation in Shanghai soft clays. J. Geotech. Geoenviron. Eng. 2005, 131, 1004–1013. [Google Scholar] [CrossRef]
  12. Wang, Z.W.; Ng, C.W.W.; Liu, G.B. Characteristics of wall deflections and ground surf surface settlements in Shanghai. Can. Geotech. J. 2005, 42, 1243–1254. [Google Scholar] [CrossRef]
  13. Carder, D.R. Ground Movements Caused by Different Embedded Retaining Wall Construction Techniques; TRL Report, No.172; Transport Research Laboratory: Crowthorne, UK, 1995. [Google Scholar]
  14. Yoo, C. Behavior of braced and anchored walls in soils overlying rock. J. Geotech. Geoenviron. Eng. 2001, 127, 225–233. [Google Scholar] [CrossRef]
  15. Seo, M.W.; Olson, S.M.; Yang, K.S.; Kim, M.-M. Sequential Analysis of Ground Movements at Three Deep Excavation Sites with Mixed Ground Profiles. J. Geotech. Geoenviron. Eng. 2010, 136, 656–888. [Google Scholar] [CrossRef]
  16. Wong, I.H.; Poh, T.Y.; Chuah, H.L. Performance of excavations for depressed expressway in Singapore. J. Geotech. Geoenviron, Eng. 1997, 123, 617–625. [Google Scholar] [CrossRef]
  17. Zhe, L.; Di, H.; Mehrad, K.; Li, Y. Effects of soil spatial variability on structural reliability assessment in excavations. Undergr. Space 2020, 5, 71–83. [Google Scholar]
  18. Liu, W.; Li, T.; Wan, J. Deformation Characteristic of a Supported Deep Excavation System: A Case Study in Red Sandstone Stratum. Appl. Sci. 2022, 12, 129. [Google Scholar] [CrossRef]
  19. Xiao, H.; Zhou, S.; Sun, Y. Wall deflection and ground surface settlement due to excavation width and foundation pit classification. KSCE J. Civ. Eng. 2019, 23, 1537–1547. [Google Scholar] [CrossRef]
  20. Fernie, R.; Suckling, T. Simplified Approach for Estimating Lateral Movement of Embedded Walls in U.K. ground. In Geotechnical Aspects of Underground Construction in Soft Ground; City University: London, UK, 1996; pp. 131–136. [Google Scholar]
  21. Wang, P.; Yin, Z.Y.; Wang, Z.Y. Micromechanical Investigation of Particle-Size Effect of Granular Materials in Biaxial Test with the Role of Particle Breakage. J. Eng. Mech. 2021, 148, 04021133. [Google Scholar] [CrossRef]
  22. Yin, A.-Y.; Wang, P.; Zhang, F. Effect of particle shape on the progressive failure of shield tunnel face in granular soils by coupled FDM-DEM method. Tunn. Undergr. Space Technol. 2020, 100, 103394. [Google Scholar] [CrossRef]
  23. Sun, H.; Hou, M.X.; Chen, C.; Ge, X. Microstructure investigation of soft clay subjected to triaxial loading. Eng. Geol. 2020, 274, 105735. [Google Scholar] [CrossRef]
  24. Wang, P.; Yin, Z.-Y.; Hicher, P.-Y.; Cui, Y.-J. Micro-mechanical analysis of one-dimensional compression of clay with DEM. Int. J. Numer. Anal. Methods Geomech. 2023. [Google Scholar] [CrossRef]
  25. Liu, J.H.; Hou, X.Y. Handbook for Foundation Pit Engineering; China Architecture and Building Press: Beijing, China, 2009; p. 186. (In Chinese) [Google Scholar]
  26. O’Rourke, T.D. Ground movements caused by braced excavations. J. Geotech. Eng. Div. 1981, 107, 1159–1178. [Google Scholar] [CrossRef]
  27. Hsieh, P.G.; Ou, C.Y. Shape of ground surface settlement profiles caused by excavation. Can. Geotech. J. 1998, 35, 1004–1017. [Google Scholar] [CrossRef]
  28. Hashash, Y.M.A.; Osouli, A.; Marulanda, C. Central Artery tunnel Project Excavation Induced Ground Deformations. J. Geotech. Geoenviron. Eng. 2008, 134, 1399–1406. [Google Scholar] [CrossRef]
  29. Hsieh, H.; Huang, Y.; Hsu, W.; Ge, L. On the system stiffness of deep excavation in soft clay. J. GeoEng. 2017, 12, 21–34. [Google Scholar]
  30. Shlash, K.T.; Al-Neami, M.A.; Akoobi, S.I. Effect of Stress Level on Behavior of Bored Piles Embedded in Medium Sandy Soil. Eng. Technol. 2013, 31, 29–43. [Google Scholar] [CrossRef]
  31. Xu, Z.H.; Wang, J.H.; Wang, W.D. Deformation behavior of diaphragm walls in deep excavations in Shanghai. China Civ. Eng. J. 2008, 41, 81–86. [Google Scholar]
  32. Masada, T. Behavior of Deep Excavation with Diaphragm Wall. Master’s Thesis, Massachusetts Institute of Technology, Cambridge, MA, USA, 1993. [Google Scholar]
  33. Fuentes, R.; Devriendt, M. Ground Movements around Corners of Excavations: Empirical Calculation Method. J. Geotech. Geoenviron. Eng. 2010, 136, 1414–1424. [Google Scholar] [CrossRef]
Figure 1. Diagram of the layered and segmental construction method in Beijing.
Applsci 13 09579 g001
Figure 2. Typical support system in Beijing. (a) Bored pile wall with steel struts in Beijing Subway Line 6; (b) Bored pile wall with an anchor in Beijing Subway Line 8.
Applsci 13 09579 g002
Figure 3. Distributions of excavation length, width, and depth.
Applsci 13 09579 g003
Figure 4. Probability histogram of the final ground surface deformation.
Applsci 13 09579 g004
Figure 5. Probability distribution of the final ground surface deformation.
Applsci 13 09579 g005
Figure 6. Time series of monitoring ground surface deformations; time is normalized during the construction period. (a) Layout of monitoring points; (b) Time-history curve of the deformation process.
Applsci 13 09579 g006
Figure 7. Box-plots of ∆δvm values of different sites.
Applsci 13 09579 g007
Figure 8. Effect of the excavation depth on maximum ground surface settlement.
Applsci 13 09579 g008
Figure 9. Effect of the length–width ratio on maximum ground surface settlement.
Applsci 13 09579 g009
Figure 10. Effect of the embedded depth ratio (EDR) on maximum ground surface settlement.
Applsci 13 09579 g010
Figure 11. Effect of support system stiffness on the normalized maximum surface settlement.
Applsci 13 09579 g011
Figure 12. Relationship between the position of dδvm and the excavation depth (H).
Applsci 13 09579 g012
Figure 13. Final ground deformation normalized by the maximum settlement. Note: the design settlement profiles for sand, clays, and mixed soil were proposed by Clough et al. (1990) and Leung et al. (2007).
Applsci 13 09579 g013
Table 1. Physical and mechanical characteristics of soils.
SoilElastic
Modulus
(MPa)
Poisson’s
Ratio
(MPa)
Cohesion
(kPa)
Friction
Angle
(°)
Density
(g/cm3)
Backfill soil8–150.382081.6
Silt13–250.3421427.52.03
Silty clay9–160.34233.314.51.97
Silty sand20–400.3360322.0
Gravel70–1200.2630382.15
Sand25–450.3360402.05
Table 2. Information about Beijing subway lines.
Line No.Service TimeMileage
/km
Station No.Open Cut MethodProportion
/%
5200727.6231773.9
10200824.722940.9
4200928.2241250.0
9201116.514750
7201423.7201575
14201547.3372157
6202152.9352366
8202151.6352263
Total 272.521012660
Table 3. Comparison of maximum ground settlements worldwide.
StudyCase
Number
Ground ConditionSupport
System
δvm/H
(%)
EMR
(%)
Clough, O’Rourke22Sand, Stiff clay Multiprop0.15-
Carder-UK largely stiffer soilMultiprop
high, moderate, low stiffness
0.125, 0.2,
0.4
-
Fernie-UK stiffer soil-0.15-
Hashash3Fill, Clay, Glacial soilInternal struts0.05~0.15-
Leung14Hong Kong Mixed soilInternal strut0.02~0.120.28~1.6,
0.96
Long41Soft clay < 0.6H
Overlay stiff soil
Internal strut, Anchor0.12, 0.15-
Long21Soft clay > 0.6H
Overlay stiff soil
Internal strut, Anchor0.5, 0.14-
Long24Soft clay > 0.6HInternal strut, Anchor0.8, 0.25-
Moormann512Soft clayMultiprop1.07-
Masuda52SandMultiprop 0.47
Clay 0.44
Ou10Taipei Soft clayInternal strut, Anchor0.5~0.70.65
Peck-UK soilMultiprop1~2
Wang, Xu 300Soft clayInternal struts0.420.45~1.52, 0.88
Wong-Soft soil < 0.9H Overlay Decomposed rockStruts or anchors0.5-
Wong-Soft soil < 0.6H Overlay Decomposed rockStruts or anchors0.2-
This study88Beijing Mixed soilInternal Strut, Soil mail, Anchor0.089-
Disclaimer/Publisher’s Note: The statements, opinions and data contained in all publications are solely those of the individual author(s) and contributor(s) and not of MDPI and/or the editor(s). MDPI and/or the editor(s) disclaim responsibility for any injury to people or property resulting from any ideas, methods, instructions or products referred to in the content.

