Article

Soil Quality in Rehabilitated Coal Mining Areas

1
Department of Chemistry, Physics and Environmental and Soil Sciences, Universitat de Lleida, Avinguda Alcalde Rovira Roure 191, E-25198 Lleida, Spain
2
Independent Researcher, Avenida Santiago Arata Gandolfo 4085, Arica 1000000, Chile
*
Author to whom correspondence should be addressed.
Appl. Sci. 2023, 13(17), 9592; https://doi.org/10.3390/app13179592
Submission received: 12 July 2023 / Revised: 31 July 2023 / Accepted: 20 August 2023 / Published: 24 August 2023
(This article belongs to the Special Issue Soil Rehabilitation Due to Land Uses)

Abstract

:
In arid and semiarid environments, the sustainability of rehabilitation actions in degraded areas is a matter of concern. It has not been extensively researched. In a Spanish coal mining area, new soils to support vegetation were created (Technosols) using mine spoils and different organic wastes. Eight years after the establishment of rehabilitation measures, the quality of the works was assessed. Soil properties (organic matter, microbial biomass, structural stability and porosity) were evaluated as quality indicators. Thermogravimetric analysis differentiated between organic-C and other mineral-C sources. The degree of aggregation and the presence of interconnected pores and organic matter with different degrees of decomposition were identified by micromorphological techniques. Microbial biomass and water-stable aggregates satisfactorily traced the early pedogenesis of mine spoils, resulting in good indicators of the quality of new Technosols. Substrates prepared with sludges promoted soil development better than those created using pig slurries, primarily by favoring a higher porosity and organic matter content. Despite that, both treatments demonstrated, after 8 years, their ability to support the ecosystem services of biomass production, carbon sequestration, and organic matter recycling they were planned for, therefore ensuring their sustainability.

1. Introduction

The rehabilitation of coal extraction mine areas aims to integrate the affected surfaces into the surrounding landscape and to promote the recovery of former soil functions [1]. The recovery of degraded areas is one of the key points of the United Nations’ effort against desertification [2]. In some cases, the original soil has disappeared (in our case, linked to former mining activities) and new soil must be created during the rehabilitation process to comply with the environmental regulations, because it is difficult, or not economically viable, to restore or return to the original condition of the land. In these cases, spoil materials from mining activities or residual by-products from sur-rounding areas have been used to make a new soil to minimize the costs. Since these materials are considered as artifacts [3], the resulting soils, of which the properties and pedogenesis are dominated by their technical origin (artefacts or technical hard material) are classified as Technosols [3].
In arid and semi-arid areas, rehabilitation is much more constrained than in humid environments because of the high solar radiation combined with the scarce and erratic rainfall, which creates severe water stress for plants. Additionally, torrential events contribute to soil erosion and desertification. Furthermore, the physical (high bulk density and poor soil structure), chemical (salinity, low organic matter content), and biological properties (poor biological activity) of natural soils or/and parent materials limit the establishment of vegetation in restored areas [4]. Despite these facts, the efficiency of soil rehabilitation methods in arid areas has not been a matter of extensive research [5]. The use of animal manure, waste composts, and sludges as organic matter sources, mainly in carbonate-rich parent materials, is of interest [6], also because the bioavailability of heavy metals they might contain will be reduced in basic pH soils. Furthermore, farmers in these areas can develop an important animal-rearing activity, as is the case in the NE of Spain, where waste management is a critical environmental issue [7]. Sewage sludge is widely available and linked to wastewater treatment plants [8]. Thus, mine rehabilitation arises as an additional alternative use for sludge in the context of the need for recirculating nutrients from these organic residues [9].
The pedogenesis process in Technosols requires the enhancement of soil fertility, vegetation establishment and biomass productivity [10]. Plant biomass production also contributes to an additional organic carbon increase in the soil [11,12,13]. The quality of created Technosols and the success of different rehabilitation techniques should be evaluated through indicators [14,15].
Soil organic carbon (SOC) content is one of the best indicators of soil quality. However, in coal mining areas, SOC must be firstly differentiated from other carbon types that are also present, such as the one coming from the coal itself or as the inorganic carbon contained in carbonates [16].
In fact, environmental services provided by the soil depend on the high levels of quality descriptors related to soil organic matter (SOM), such as total porosity and aggregate stability [17]. Thus, soil structure properties can be used as some of the indicators of the success of the rehabilitation process. The micromorphology of undisturbed soil samples, in particular those assessing structure and porosity, is used for such studies. Microscopic techniques allow for the observation of soil organization [18] and the identification of its constituents, among which pores and aggregates stand out [19]. Pores have been defined by Fitzpatrick [20] as soil spaces (soil atmosphere) filled or partially filled with a water solution. Aggregates, from the point of view of micromorphology, have been defined as groups of different soil particles. Differences in structural stability between similar textured soils are also explained by their organic matter content [21]. As a result, soils offer a differential resistance to particle dispersion or implosion of aggregates, due to the impact of raindrops or slaking [22]. Runoff and erosion of dispersed materials cause soil degradation, so it is important to prevent them in the rehabilitation process [23]. Besides, the effect of the slaking process on saturated hydraulic conductivity reduction is important in the top layer of semi-arid soils [24]. Sediment loss is inversely related to SOM content, but it is directly related to the increase in silt and fine sand in textural fractions [25].
In this context, the present study was developed in a semi-arid environment, where the rehabilitation of degraded mining areas was carried out using organic materials (pig slurries and sludges) and other by-products from the coal mining activity. The hypothesis is that the different rehabilitation procedures, with different mixtures and proportions of organic materials, affect the quality of the newly implemented Technosols. The aim of the present research was to evaluate the sustainability of the rehabilitation procedures, 8 years after the initial works, through some indicators: i) the identification, distribution, and quantification of SOM content in the developed Technosols; and ii) the characterization of soil structure (porosity and structure stability) using different techniques. The significance of this research extends beyond its local implications, since it is relevant to comparable circumstances within coal mines located in arid regions on calcareous materials. This is particularly crucial due to the scarcity of comprehensive research addressing these conditions [5].

2. Materials and Methods

2.1. Site Description and Climate

This research was carried out in a rehabilitated area of formerly abandoned dumps of coal mining spoil materials (coal, gypsum, limestones, and marls). The dumps were situated in the north-eastern part of Spain (41°21′13″ N; 0°21′40″ E). From them [26], dumps oriented to the West with a 30% (16.7°) slope were chosen for this study, 8 years after the initial rehabilitation works.
The climate of the area is semi-arid Mediterranean, with an average annual temperature of 16 °C and an average annual rainfall of 373 mm. The water deficit is especially severe in the summer months of July and August.
Sclerophyllous vegetation predominates due to long drought periods. The association of Rosmarino-Ericion with the dominance of Rosmarinus officinalis L., Thymus vulgaris, Globularia maritima, Sedum sediforme and larger shrub species such as Pistacea lentiscus L. and Juniperus oxycedrus, as well as trees such as Pinus halepensis Mill. are present in the landscape [27].

2.2. The Rehabilitation Process

The materials used to carry out the rehabilitation were coal mine tailings, identified as silt and coarse-sand materials (Table 1), and organic amendments such as pig slurry and sludge (Table 2). Straw from cereals was also used in some experimental plots.
The following analytical methods were used for the characterization of organic materials (Table 2): pH by potentiometry, gravimetric dry matter content at 105 °C, organic-C by calcination at 550 °C, total-N and organic-N by the Kjeldahl method, and ammonium-N by distillation and titration according to methods 4500-NH3B-C from APHA [28]. Total phosphorus and potassium were analyzed by acid digestion (wet) and further determined using inductively coupled plasma atomic emission spectrometry [29].
In order to improve the suitability of the spoils for plant growth, an amended material (treated silt) was created by mixing a 0.1 m layer of the silt material (Table 1) with 865 m3 ha−1 of slurry (PSsub, Table 2) and 21 Mg ha−1 of chopped straw. The mixing works were performed over a period of two months.
Ten plots (7 m wide, 13 m long, 0.25 m depth), with different proportions of the available materials, were prepared (Table 3). The plot treatments included sludge (wS), pig slurry (wP), or none of the described materials in the controls (nS, nP, respectively). They were mixed at different proportions with the mine spoils (1:3:1, sludge:coarse-sand:silt; 1:2 treated-silt:coarse-sand; 1:1, treated-silt:coarse-sand).
West-oriented plots were aligned from North to South line according to the following sequence: wSnP 1:3:1-wSwP 1:3:1-wSnP 1:3:1-wSwP 1:3:1-wSnP 1:3:1-wSwP 1:3:1-nSwP 1:1-nSwP 1:2-nSnP 1:1-nSnP 1:2. They were identified in the simplest way according to the field plot sequence from 1-F to 10-F (Table 3).

2.3. Samplings and Analysis

Eight years after the plot establishment, three composite samples (0–0.15 m depth) were obtained along the experimental plots. Each of them included five sampled points, following an imaginary zig-zag line from top to bottom of the plot. The analytical methods used for SOC evaluation were: dry combustion in an analyzer (TruSpec® Micro Elemental Series from Leco, St. Joseph, MO, USA), based on the Dumas method [30] and after the removal of carbonates [31]; calcination at 560 °C [32]; wet oxidation [33]; and thermogravimetry [34] using a TGA/SDTA851 apparatus from Mettler-Toledo (Cornellà, Spain). Calcium carbonate equivalent (CaCO3 eq) was quantified following the calcimeter method [35] and using a Bernard calcimeter from Pobel (Reference 10CABE6256, Madrid, Spain).
The carbon content of soil microbial biomass was determined by the fumigation–extraction UNE 77310-2 method [36]. For this analysis, two composite samples from each plot were used. Analyses were done in triplicate for each composite sample.
The implemented test for water-stable aggregates (WSA) was the single-sieve (0.25 mm) method [37]. The bulk density of each plot was obtained by the excavation method [38]. The hole was covered by a plastic bag and filled with water to determine the volume of the excavated sample. Coarse fragments within the sample were screened out and weighed. The volume of coarse mineral fragments was determined from dry mass, assuming a particle density of 2.65 Mg m−3. Bulk densities of mineral soil samples were calculated as the mass of dry, coarse fragment-free soil per volume of field-moist soil, where volume was also calculated on a coarse fragment-free basis.
Micromorphology techniques were used for pore, aggregate and SOM distribution studies. A prism (6 cm depth × 9 cm thick × 19 cm long) was obtained from a representative surface of plots 4-F, 5-F, 8-F, and 9-F. Vertically thin sections (5 cm wide × 13 cm long × 30 µm thick) were prepared. Their description was done using an Olympus BX51 polarizing microscope (Evident, Tokyo, Japan) and according to the terminology and concepts developed by Stoops [39,40].
The percentage of the area (from the total thin section of 65 cm2) occupied by pores and aggregates was obtained. The procedure started with the selection of 30 sectors, 1.75 × 1.3 cm in size, per thin section. Each observed sector was photographed under plain-polarized light (PPL) and cross-polarized light (XPL) with a resolution of 3072 × 2304 pixels. Both PPL and XPL images from each sector were combined to generate ten color gradation pictures (Figure S1) which allowed us to eliminate interference, clearly identify pores (Figure S2) and aggregates (Figure S3), and calculate the area occupied by them. The edge effect in the measurements was avoided through the definition of a reference frame within each field (1.4 × 1.1 cm) to minimize the errors encountered when measuring the pores in contact with the edges, according to the criteria of Ringrose-Voase [41].
Soil organic matter observed in thin sections was discriminated into highly and slightly decomposed SOM. Slightly decomposed SOM had recognizable tissue remains but presented evidence of decomposition caused by microflora or fauna, and its image analysis was like the one followed for porosity (Figure S4). For highly decomposed SOM, with very few recognizable plant remains, all opaque elements (black) were selected in PPL as in XPL and separated by shape, discriminating between amorphous (organic matter) and those with defined forms (coal).

2.4. Statistics

Statistical analyses were done using the statistical package SAS V 9.4 [42], assuming random samples drawn from normally distributed populations. This assumption was verified using the Univariate procedure. Student’s t-Test was employed through the Proc ttest, which calculates the t statistic based on the assumption of equal variances between the two compared groups. If the p-value was below the predetermined alpha level (0.05), we determined that there was a significant difference between the means being compared.

3. Results

3.1. Soil Organic Matter, Microbial Biomass Content and Water Stable Aggregates

The analyses of the thermographs show three peaks of weight loss, corresponding to three temperature ranges (210–375 °C, 430–580 °C, and 650–850 °C) that we attributed to organic matter, coal, and calcium carbonate, respectively. These ranges were used to quantify these three fractions by thermogravimetry.
The Dumas and calcination methods for SOC analyses yielded the highest values (Table 4), while the ones obtained by thermogravimetry were the lowest (Table 4).
The trend on microbial carbon biomass showed that the plots with sludge presented the highest values except when additional slurry was applied on the surface (Table 4). In this latter case (wSwP) no differences could be found with plots without sludges, irrespective of the proportion of material in the substrate (1:1 or 1:2).
When organic carbon data from thermogravimetry and plots with sludges (1:3:1 plots) were compared with data from plots without sludges (the rest), the former presented a significantly higher organic content (37 g kg−1) than the rest (26 g kg−1). They also showed significantly higher water-stable aggregates (Table 5). However, bulk density showed erratic variability, with values ranging from 1.11 Mg m−3 up to 1.30 Mg m−3 (Table 5).

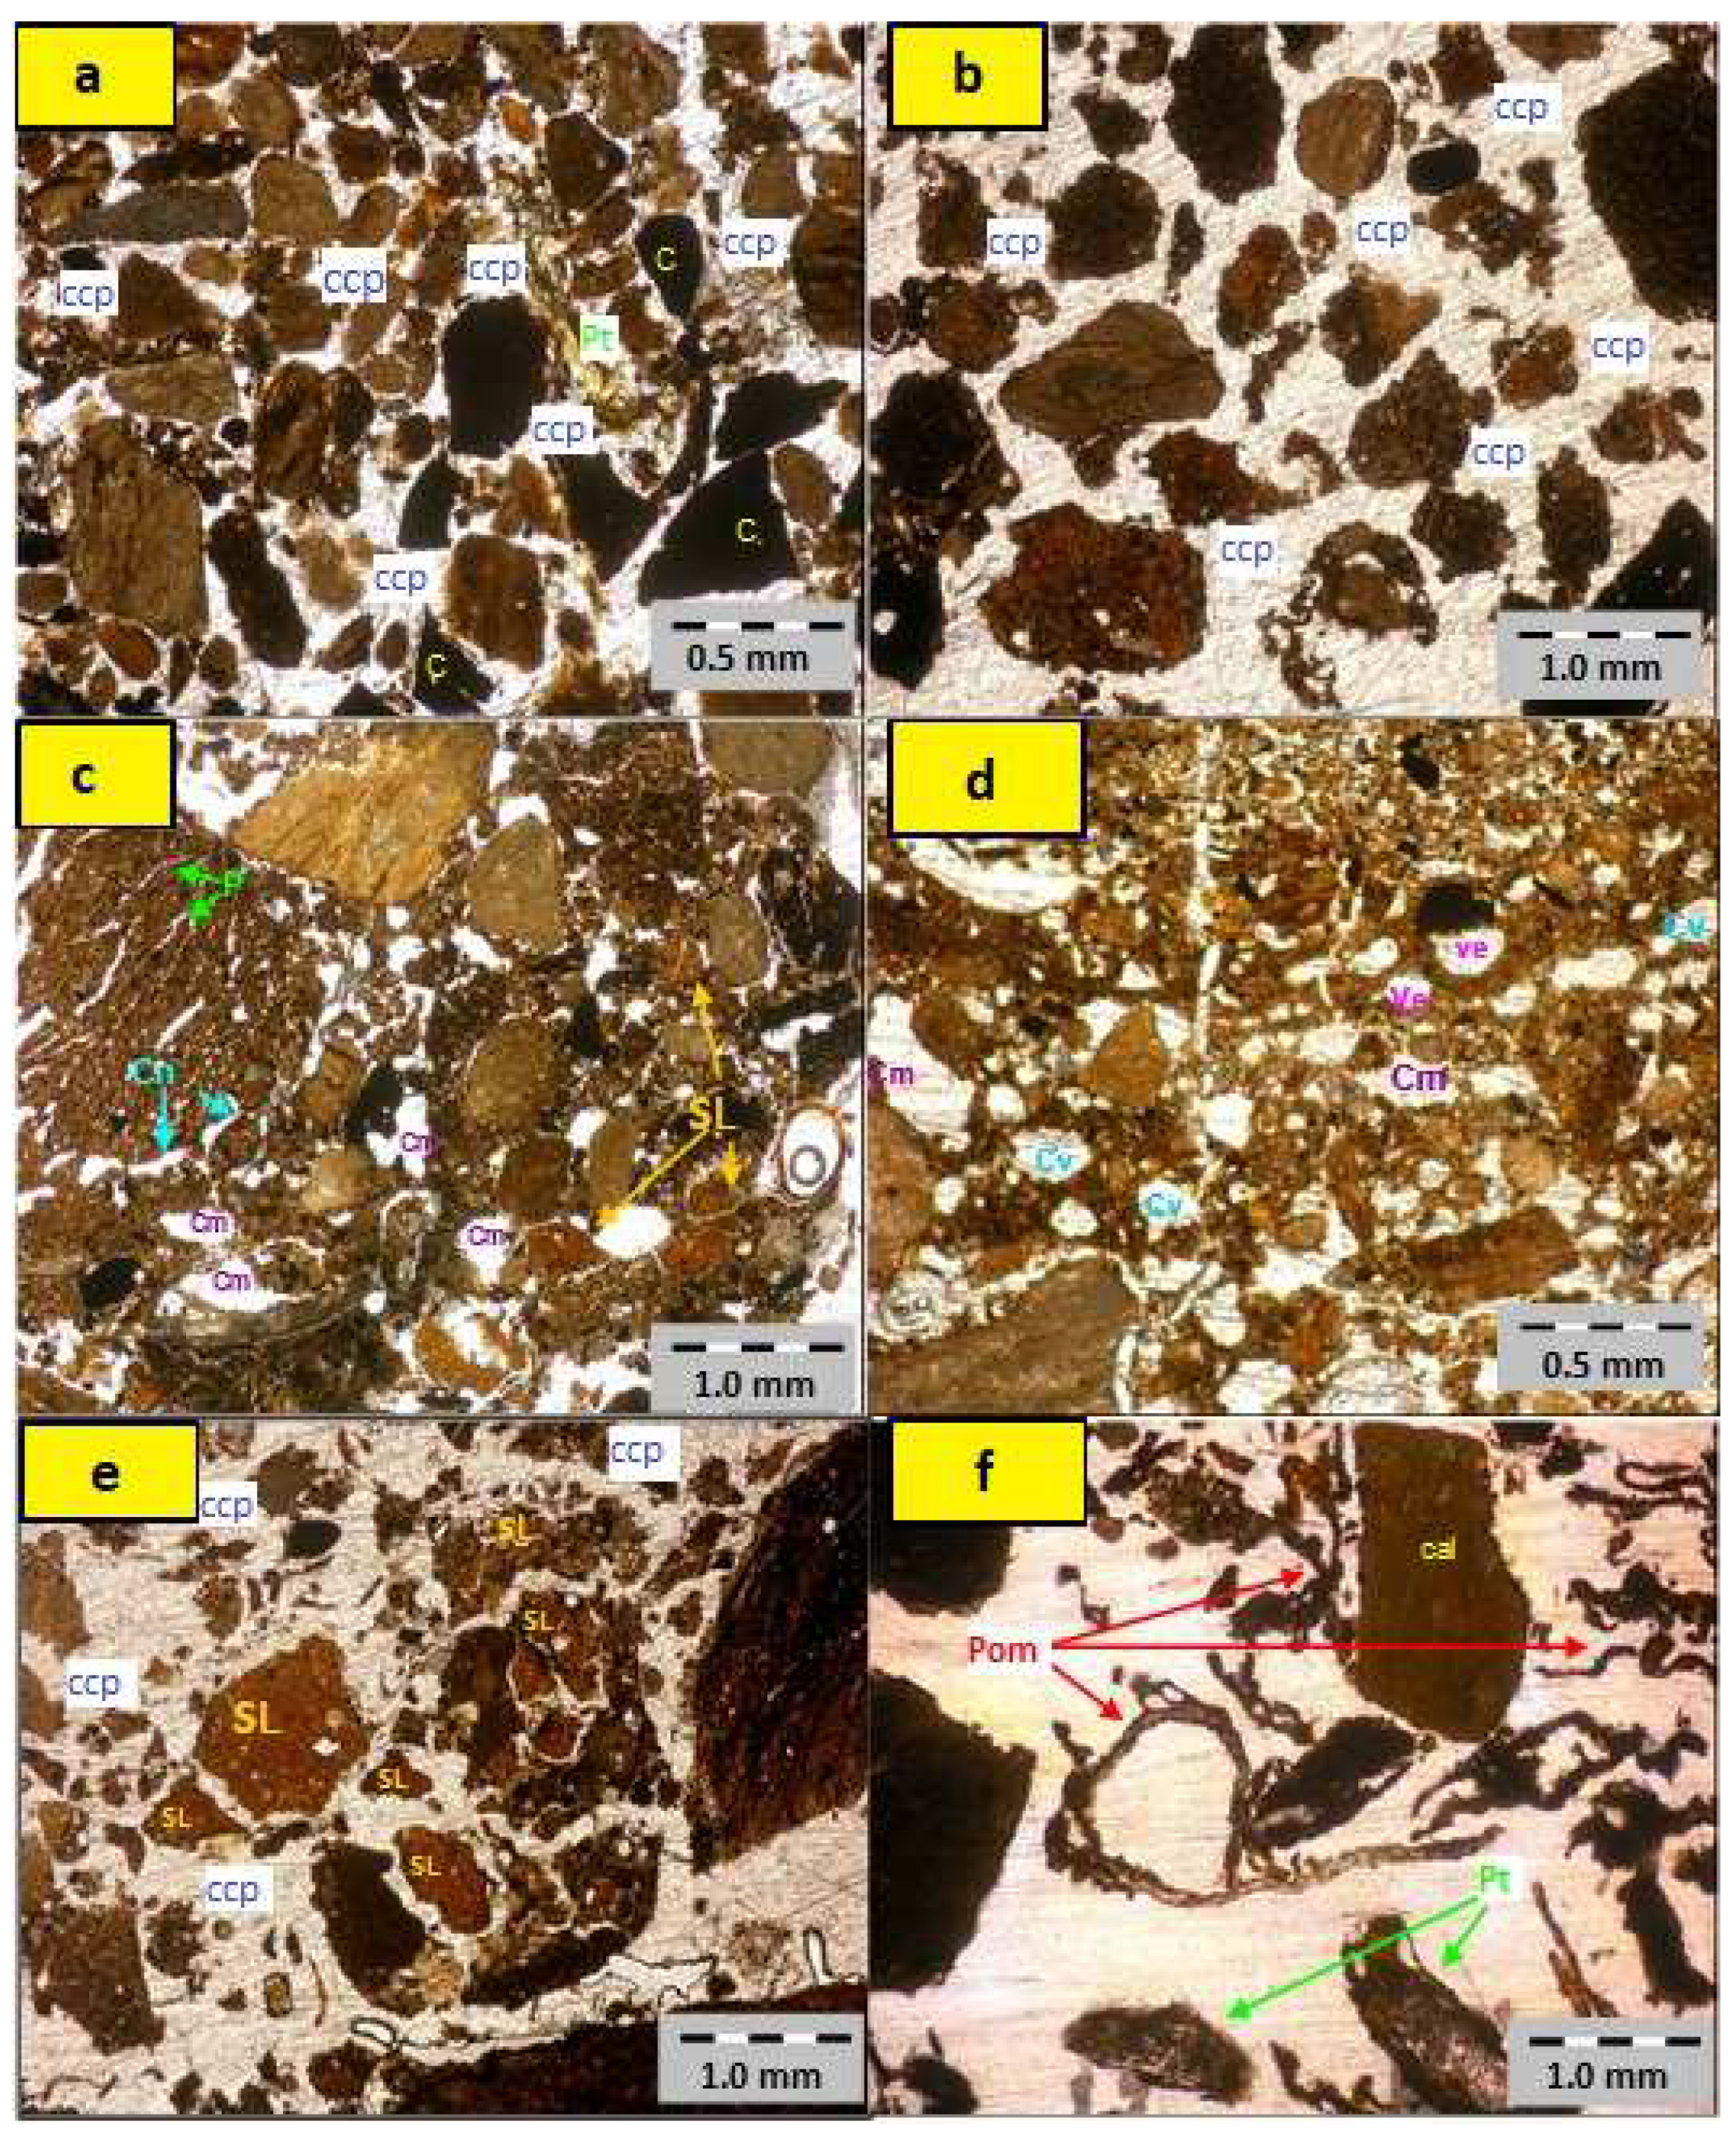
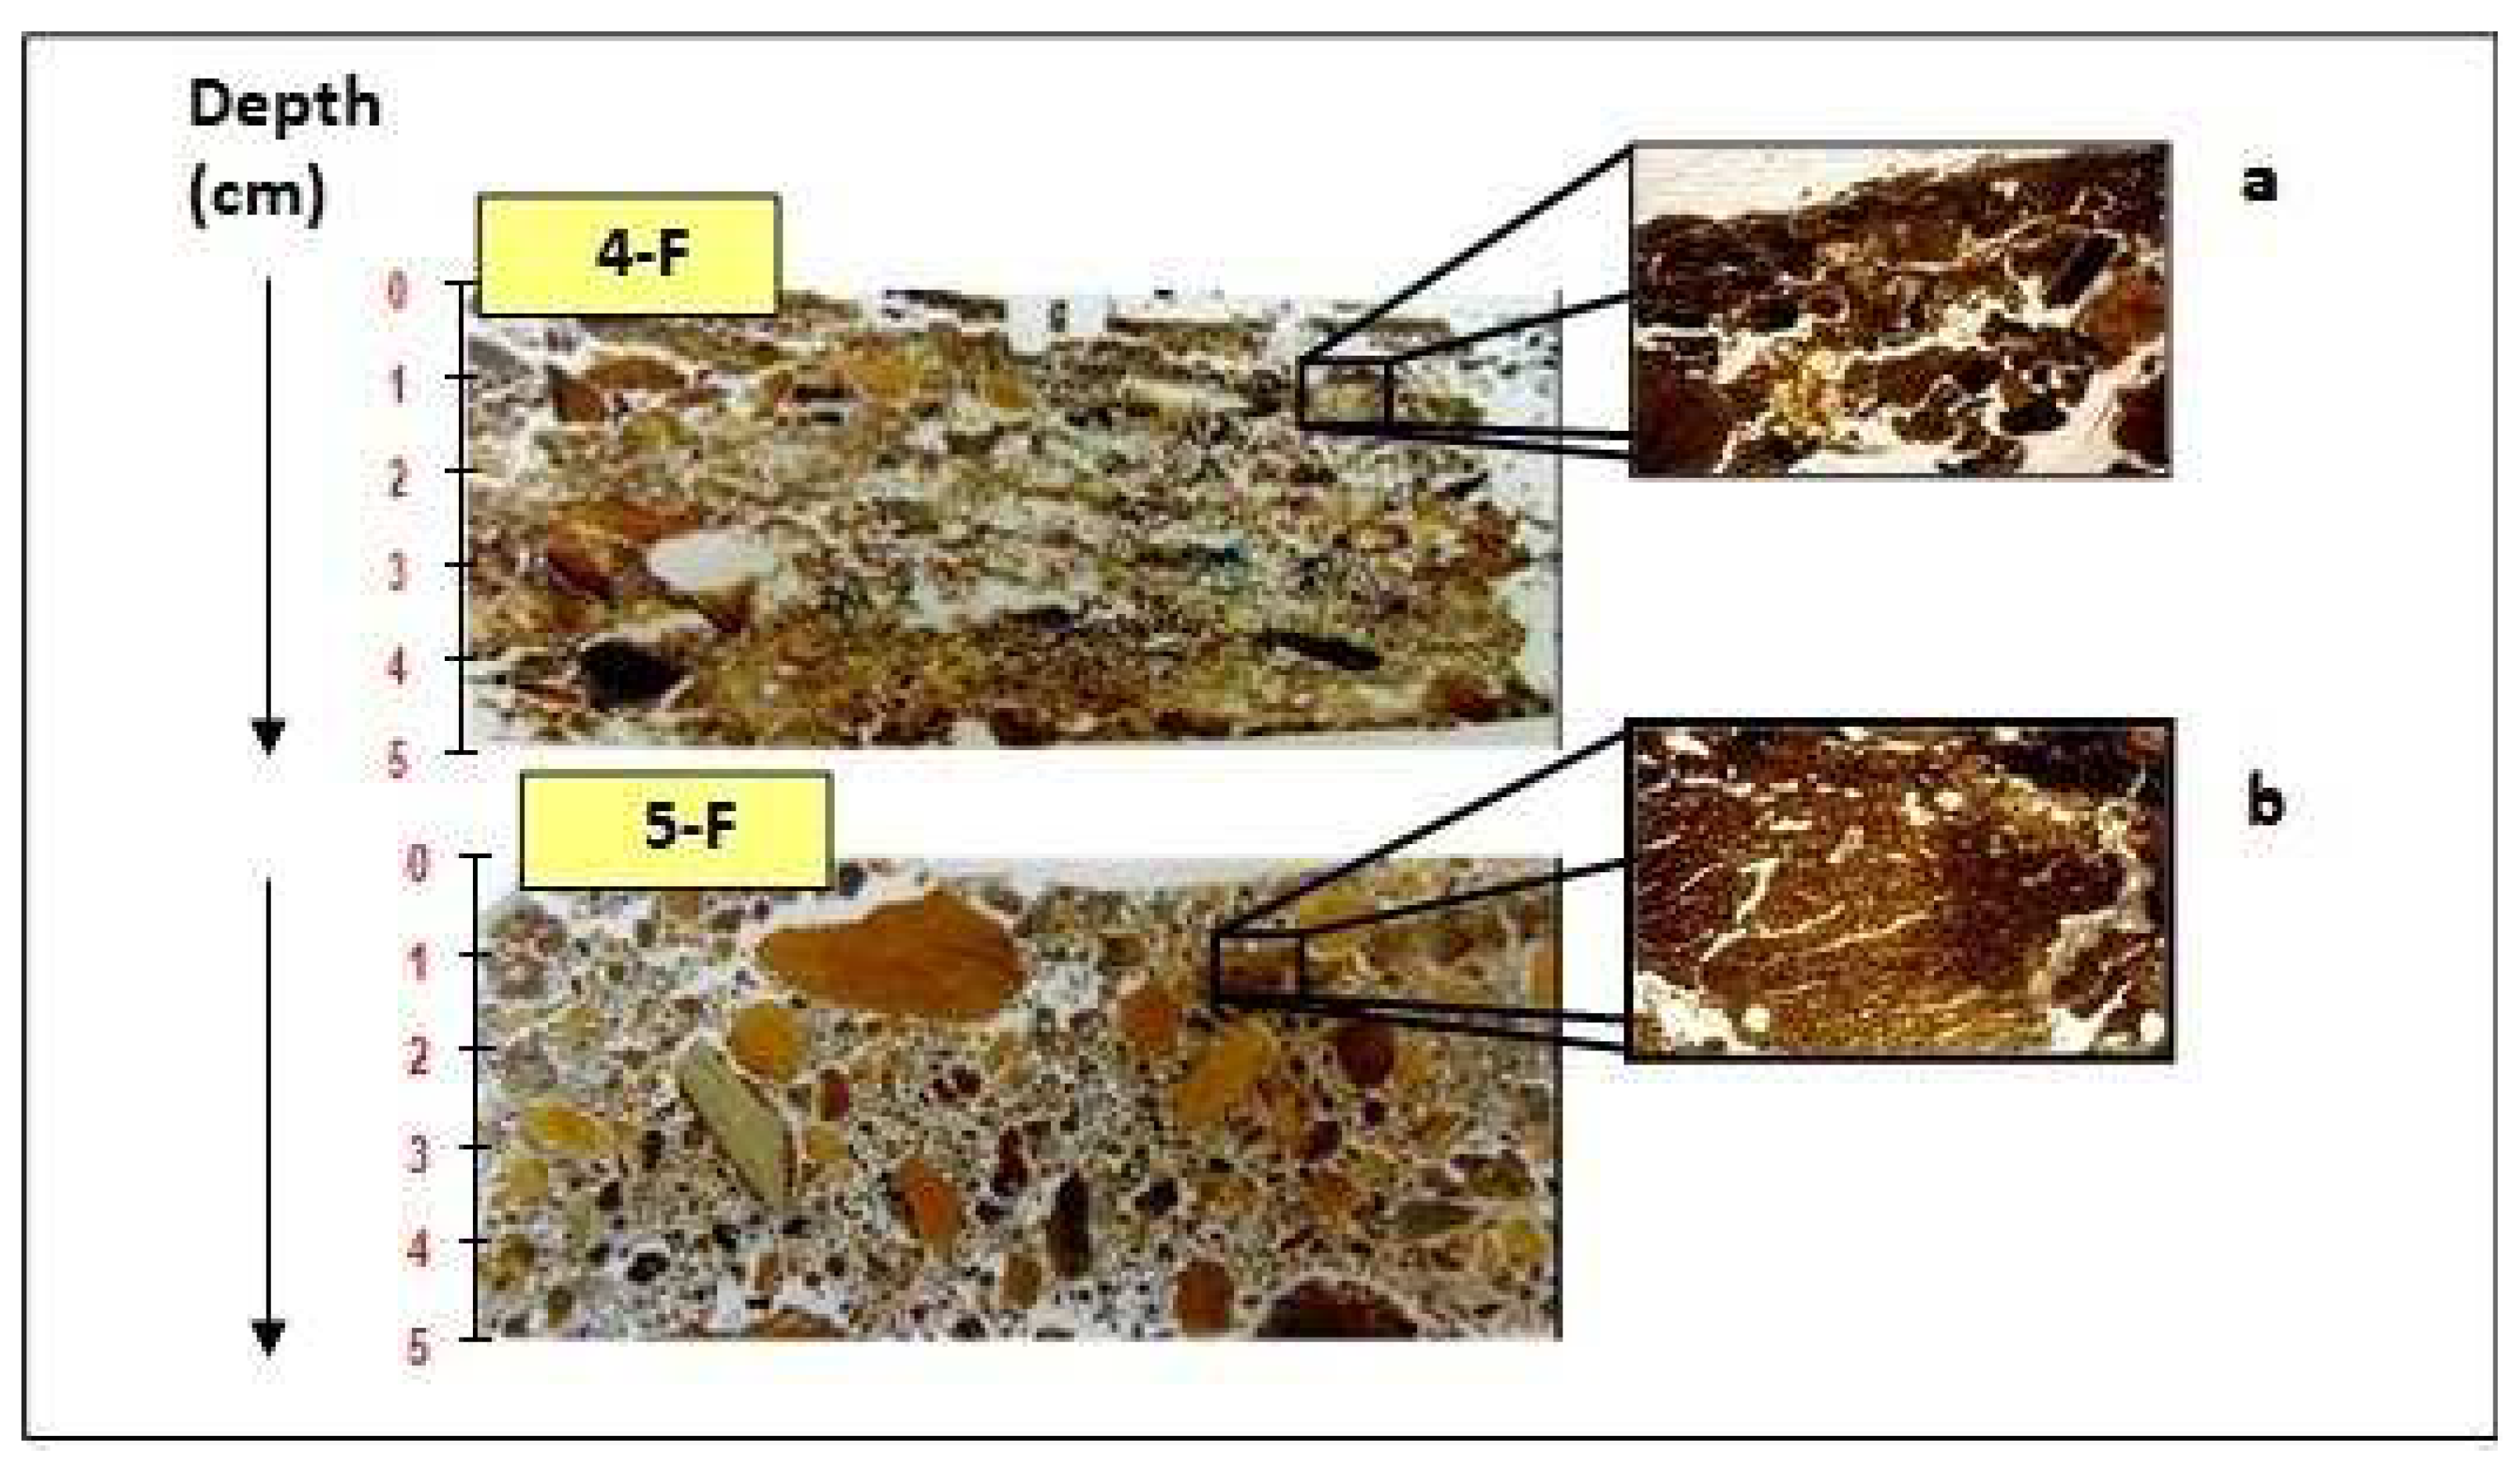
3.2. Organic Matter, Aggregates, and Porosity Distribution in Soil Thin Sections

In the thin sections, the coarse fraction mainly consisted of medium and coarse sand and gravels, made of rounded smooth spherical and subangular calcilutite fragments, together with subangular rounded spherical coal fragments and subangular smooth spherical quartz grains. Those plots treated with sewage sludge had also rounded wavy spherical fragments of this material. Calcilutites and coal show alterations such as fissures and fractures. The fine fraction mostly presented a grayish brown color, with some black spots that, under incident light, became dark brown, and with a crystallitic b-fabric. Pedofeatures were excremental and crystallitic, such as continuous gypsum infilling and isolated crystals or intergrown crystals larger than 20 µm, which could be assumed to have been formed in situ.
In all thin sections, the distribution of coarse vs. fine material (c/f) was mainly single enaulic (Figure 1a), but double enaulic (Figure 1b) and chitonic (Figure 1c) distributions were also visible in patches. Aggregates were porous, subrounded and highly separated. The predominant pores were compound packing pores, randomly distributed and poorly accommodated (Figure 1a,b,e). Vesicles, chambers, channels, and planes (Figure 1c) were also present.
In the first few centimeters of the soil, SOM was mainly randomly distributed. In plots with sludge, it was identified as brown-orange polymorphic organic materials. They mainly surrounded mineral components and parts of them were incorporated into soil aggregates (Figure 1e). Plant tissues and organic materials, in smaller quantities, were mainly found surrounding mineral components and soil aggregates (Figure 1a,f). Furthermore, the presence of pig slurry and cereal straw (used as amendments in some plots) were not identified in thin sections, probably because they were totally degraded or in the process of degradation.
Regarding the potential influence of pig slurry surface applications over sludge substrates, the thin sections of 4-F (wSwP 1:3:1) and 5-F (wSnP 1:3:1) plots were compared (Figure 2). In both sections the porosity was low in the first centimeters, conforming to a very thin surface layer that tended to have, in some areas, a platy structure. However, it did not cover the total surface, which means that it did not form a true surface crust.
Highly decomposed organic matter predominated. Amounts were higher in the 4-F field plot than in the rest, with the 9-F plot showing the lowest value. No significant differences in slightly decomposed organic matter were found between the analyzed plots (Figure 3).
The pore area was also the highest in the 4-F field plot, followed by 5-F, which also significantly differed from 9-F. The area occupied by aggregates was also higher in 5-F than in plots without sludges (Figure 4).

4. Discussion

Carbonates comprised a large part of substrates, with half of their weight (from 50 to 58%) corresponding to calcium carbonate equivalent, and from 30% to 38% when using thermogravimetry (Table 4). The Bernard calcimeter® [43] is a very simple method to use, but it has the drawback that it gives values higher than the real content by up to 2.9% [44]. However, this did not fully explain the recorded differences. They could be explained because of the presence of organic material together with calcium carbonate, which lowers the temperature threshold at which carbonates start to decompose [45]; it means that some of the weight loss attributed to mineral coal could already be from calcium carbonate. Nevertheless, both methods agree with the predominant presence of carbonates in the substrates.
The carbon values obtained by the Dumas (Cdry) and calcination methods reached the highest values (Table 2), with Cdry being slightly higher than that obtained by calcination. Results might have included some carbonates that were not eliminated in the previous treatment with an acid solution. They may also have included some mineral coal, especially in the Dumas method, because samples were subjected to very high temperatures (1000–1300 °C). Data from wet oxidation was also higher than the carbon values obtained by thermogravimetry, probably because it did not fully discriminate organic-C from coal, as can be seen in the initial analysis of the silt material (Table 1), which originated from coal fine particles. Thus, the use of thermogravimetry in these semi-arid environments (with high soil carbonate content or coal, as in this research) must be preferred when precise results are needed to obtain a soil quality index, as in organic-C balances. Thermogravimetry does not mask organic carbon and can discriminate it from the content of the two other carbon fractions. However, wet oxidation could differentiate between substrates receiving slurries from the rest, with higher values for substrates receiving sludge [46].
The treatment with a base substrate formed by one volume of fine material and three volumes of coarse material with the application of one volume of sewage sludge turned out to be the best way to increase SOC content in the rehabilitated areas. Furthermore, it did not constrain the presence of microbial biomass-C since that was significantly higher than in the rest of the treatments in which no additional slurry was applied over the surface. In fact, adverse effects of high slurry rates applied once over the surface (>210 kg N ha−1) on soil microfauna have previously been observed by [47] in cultivated land. The N forms applied also have some importance, as, for instance, ammonia, the predominant N form in slurries, is highly toxic to mites [48]. On the other hand, a favorable effect was found on earthworm activity in calcareous Technosols with the highest doses of sewage sludge [49].
These findings appear to contradict the results presented in [50] within similar environments. This study indicate that urban compost exhibited superior performance compared to sludge concerning microbial activity and organic matter quality. However, the study also concludes that both treatments could serve as viable alternatives in the rehabilitation of mine soil.
The higher organic matter provided by sludges favored a higher aggregate stability against slaking than treatments without them (Table 5), in agreement with Kay [51]. In semiarid areas, the stabilization of soil macroaggregates is one of the key quality parameters to prevent erosion [52].
Micromorphology studies allowed us to go deeper into the quality parameters linked to aggregates and the associated porous space. Pores were highly interconnected (Figure 1a,b), so they facilitated the passage of air and water through the soil. It was also observed that there was a high activity of microorganisms in these soils, as shown by the action of micro and mesofauna in breaking down tissue fragments (Figure 1f). The action of larger organisms was also evident by the abundance of bio pores, which would confirm the lack of deleterious effects of sludge on soil fauna. All these characteristics show that rehabilitation has led to the pedogenesis of these materials mainly through the formation of pedogenic structures. The absence of a real crust (Figure 2) also indicates a positive effect of organic matter on soil structure development [53].
Sewage sludge favors the presence of water-stable aggregates, which might contribute to a reduction of erosion risk in rehabilitated areas. The improvement of this physical property is linked to the observation of a higher porosity compared with the plots without sludges. These beneficial effects of sludge in enhancing soil structure and promoting infiltration were likewise noted by [54] within comparable environments. All these structural changes are good indicators of Technosol development over the period from the initial treatment to the situation after 8 years, which ensures the long-term sustainability of the rehabilitation works. Moreover, sewage sludge is important for the rehabilitation of this type of soil as it promotes the presence of microbial biomass, thus indirectly favoring a better soil structure.
As the main conclusions of our study, we propose that TGA (thermogravimetric analysis) should be adopted as the preferred method for quantifying the different sources of carbon when assessing soil organic carbon in rehabilitated soils from coal mines in calcareous, semi-arid areas. Furthermore, we find that the various tested mixtures (consisting of fine material, coarse material, sewage sludge, or pig slurry in different proportions) can be distinguished in terms of quality through the measured parameters. Notably, the proportion of 1:3:1 (fine:coarse:sludge) emerged as the most favorable one concerning organic matter, structure, and biological activity in the mid-term.
Our research demonstrates the technical feasibility of rehabilitating soils affected by coal mining in semi-arid areas using organic residues. Furthermore, we established that its effectiveness can be assessed and quantified in the mid-term through a combination of appropriate analytical techniques.

Supplementary Materials

The following supporting information can be downloaded at: https://www.mdpi.com/article/10.3390/app13179592/s1, Figure S1: Successive combined images (10) obtained from plane-polarized light and cross-polarized light and using the Olympus DP-SOFT software for image processing. Figure S2: Successive images obtained in the quantification of the area occupied by pore and using the Olympus DP-SOFT software for image processing: (a) image obtained with plain-polarized light (PPL), (b) image obtained with cross-polarized light (XPL), (c) image obtained after the adjustment of the contrast, tone, saturation and intensity of color of PPL and XPL combined images, and with the defined framework for porosity studies (green color), (d) pore shapes used for the measurement of pore area; Figure S3: Successive images obtained in the quantification of the area occupied by aggregates: (a) image obtained with plain-polarized light, (b) image obtained with cross-polarized light (XPL), (c) image obtained after the adjustment of the color contrast, and with the defined framework for aggregate studies (green color), (d) aggregate shapes (green area); Figure S4: Successive images obtained in the quantification of the area occupied by organic matter: (a) image obtained with plain-polarized light, (b) image obtained with cross-polarized light, (c) combined image obtained after the adjustment of the color contrast, and with the defined framework for organic matter studies (green color), (d) organic matter shapes (blue area).

Author Contributions

Conceptualization and methodology, A.D.B.-S. and R.M.P.; samplings and formal analysis, J.C.; draft preparation, J.C.; writing—review and editing, A.D.B.-S. and R.M.P. All authors have read and agreed to the published version of the manuscript.

Funding

This research was funded by the former Environmental Department from Generalitat de Catalunya (Spain). The Ph.D. studies of Javier Ismael Cruz Zárate were founded by AECI (Spanish Agency for International Cooperation).

Institutional Review Board Statement

Not applicable.

Informed Consent Statement

Not applicable.

Data Availability Statement

Data are available from R.M.P. ([email protected]) upon reasonable request.

Acknowledgments

The authors thank Esteve Serra, and Carlos Verdiell from Carbonífera del Ebro SA for their technical support. They also thank Lydia Arroyo for edition support.

Conflicts of Interest

The authors declare no conflict of interest.

References

  1. Ussiri, D.A.N.; Lal, R.; Jacinthe, P.A. Soil properties and carbon sequestration of afforested pastures in reclaimed minesoils of Ohio. Soil Sci. Soc. Am. J. 2006, 70, 1797–1806. [Google Scholar] [CrossRef]
  2. UNCCD (United Nations Convention to Combat Desertification). The UNCCD 2018–2030 Strategic Framework. Available online: https://www.unccd.int/resources/other/unccd-2018-2030-strategic-framework (accessed on 19 June 2023).
  3. IUSS Working Group WRB. World Reference Base for Soil Resources: International Soil Classification System for Naming Soils and Creating Legends for Soil Maps, 4th ed.; International Union of Soil Sciences: Vienna, Austria, 2022; Available online: https://www.isric.org/sites/default/files/WRB_fourth_edition_2022-12-18.pdf (accessed on 19 June 2023).
  4. Jorba, M.; Oliveira, G.; Josa, R.; Vallejo, R.V.; Alcañiz, J.M.; Hereter, A.; Cortina, J.; Correia, O.; Ninot, J.M. Manual per a la Restauració de Pedreres de Roca Calcària en Clima Mediterrani; Generalitat de Catalunya: Barcelona, Spain, 2010; ISBN 978-84-393-7672-9. [Google Scholar]
  5. Salom, A.T.; Kivinen, S. Closed and abandoned mines in Namibia: A critical review of environmental impacts and constraints to rehabilitation. S. Afr. Geogr. J. 2020, 102, 389–405. [Google Scholar] [CrossRef]
  6. Peñaranda Barba, M.A.; Alarcón Martínez, V.; Gómez Lucas, I.; Navarro Pedreño, J. Methods of soil recovery in quarries of arid and semiarid areas using different waste types. Span. J. Soil Sci. 2020, 10, 101–122. [Google Scholar] [CrossRef]
  7. Idescat (Instituto de Estadística de Cataluña). Utilización del Suelo en Cataluña en 2021. Available online: https://www.idescat.cat/indicadors/?id=anuals&n=10547&tema=terri&lang=es (accessed on 19 June 2023).
  8. Ministerio de Medio Ambiente y Medio Rural y Marino. Caracterización de los Lodos de Depuradoras Generados en España; Ministerio de Medio Ambiente y Medio Rural y Marino: Madrid, Spain, 2009; ISBN 978-84-491-0956-0. Available online: https://www.miteco.gob.es/es/calidad-y-evaluacion-ambiental/publicaciones/lodos_depuradoras_tcm30-185077.pdf (accessed on 21 June 2023).
  9. Harder, R.; Giampietro, M.; Smukler, S. Towards a circular nutrient economy. A novel way to analyze the circularity of nutrient flows in food systems. Resour. Conserv. Recycl. 2021, 172, 105693. [Google Scholar] [CrossRef]
  10. Ussiri, D.A.N.; Lal, R.; Jacinthe, P.-A. Post-reclamation land use effects on properties and carbon sequestration in minesoils of southeastern Ohio. Soil Sci. 2006, 103, 261–271. [Google Scholar] [CrossRef]
  11. Lal, R. Soil carbon sequestration impacts on global climate change and food security. Science 2004, 304, 1623–1627. [Google Scholar] [CrossRef]
  12. Akala, V.A.; Lal, R. Potential of mine land reclamation for soil organic carbon sequestration in Ohio. Land Degrad. Dev. 2000, 11, 289–297. [Google Scholar] [CrossRef]
  13. Akala, V.A.; Lal, R. Soil organic carbon pools and sequestration rates in reclaimed minesoils in Ohio. J. Environ. Qual. 2001, 30, 2098–2104. [Google Scholar] [CrossRef]
  14. Alcañiz, J.M.; Ortiz, O. Avaluació de treballs de rehabilitació de sòl en àrees afectades per activitats extractives a Catalunya: Criteris de qualitat de la restauració. Orsis 2003, 18, 63–75. Available online: https://raco.cat/index.php/Orsis/article/view/24463 (accessed on 19 June 2023).
  15. Kim, M.-S.; Min, H.-G.; Kim, J.-G. Integrating amendment and liquid fertilizer for aided-phytostabilization and its impacts on soil microbiological properties in arsenic-contaminated soil. Appl. Sci. 2020, 10, 3985. [Google Scholar] [CrossRef]
  16. Ussiri, D.A.N.; Lal, R. Method for determining coal carbon in the reclaimed minesoils contaminated with coal. Soil Sci. Soc. Am. J. 2008, 72, 231–237. [Google Scholar] [CrossRef]
  17. Miralles, I.; Ortega, R.; Almendros, G.; Sánchez-Marañón, M.; Soriano, M. Soil quality and organic carbon ratios in mountain agroecosystems of South-east Spain. Geoderma 2009, 150, 120–128. [Google Scholar] [CrossRef]
  18. Porta, J.; López-Acevedo, M.; Poch, R.M. Introducción a la Edafología: Uso y Protección del Suelo; Mundi–Prensa: Madrid, Spain, 2008. [Google Scholar]
  19. Poch, R.M.; Stoops, G. Soil micromorphology. In Encyclopedia of Soils in the Environment, 2nd ed.; Academic Press: Cambridge, MA, USA, 2022. [Google Scholar] [CrossRef]
  20. Fitzpatrick, E.A. Micromorfología de Suelos; Compañía Editorial Continental: Mexico City, Mexico, 1990; pp. 159–345. [Google Scholar]
  21. Buschiazzo, D.E.; Aimar, S.B.; Quiroga, A.R. Influencia de cementantes inorgánicos sobre la estabilidad estructural de suelos de la región semiárida pampeana central. In Proceedings of the XIII Congreso Argentino de la Ciencia del Suelo, Bariloche, Argentina, 8–12 April 1991. [Google Scholar]
  22. Bosch-Serra, À.D.; Yagüe, M.R.; Poch, R.M.; Molner, M.; Junyent, B.; Boixadera, J. Aggregate strength in calcareous soil fertilized with pig slurries. Eur. J. Soil Sci. 2017, 68, 449–461. [Google Scholar] [CrossRef]
  23. Ojeda, G.; Alcañiz, J.M.; Ortiz, O. Runoff and losses by erosion in soils amended with sewage sludge. Land Degrad. Dev. 2003, 14, 563–573. [Google Scholar] [CrossRef]
  24. Tanner, S.; Katra, I.; Argaman, E.; Ben-Hur, M. Mechanisms and processes affecting aggregate stability and saturated hydraulic conductivity of top and sublayers in semi-arid soils. Geoderma 2021, 404, 115304. [Google Scholar] [CrossRef]
  25. Wischmeier, W.H.; Smith, D.D. Predicting Rainfall Erosion Losses: A Guide to Conservation Planning; USDA: Hyattsville, MD, USA, 1978. [Google Scholar]
  26. Salazar, M.; Poch, R.M.; Bosch, A.D. Reclamation of steeply coal spoil banks under Mediterranean semi-arid climate. Aust. J. Soil Res. 2002, 40, 827–845. [Google Scholar] [CrossRef]
  27. Escuer, J.L. L’Aiguabarreig dels Rius Cinca i Segre; Institut d’Estudis del Baix Cinca—I.E.A.: Fraga, Spain, 1998. [Google Scholar]
  28. APHA. Nitrogen (ammonia): 4500-NH3B, preliminary distillation step and 4500-NH3C, titrimetric method. In Standard Methods for the Examination of Water and Wastewater, 22nd ed.; Rice, E.W., Bridgewater, L., Eds.; American Public Health Association, American Water Works Association, Water Environment Federation: Washington, DC, USA, 2012; pp. 4–110+111. [Google Scholar]
  29. Kovar, J.L. Methods of determination of P, K, Ca, Mg and trace elements. In Recommended Methods of Manure Analysis; publ., A3769; Peters, J., Ed.; University of Wisconsin-Madison: Madison, WI, USA, 1992; pp. 39–47. Available online: https://datcp.wi.gov/Documents/NMManureAnalysisUWEX.pdf (accessed on 19 June 2023).
  30. ISO 13878:1998; Soil Quality—Determination of Total Nitrogen Content by Dry Combustion (“Elemental Analysis”). International Organization for Standardization: Vernier, Geneva, Switzerland, 1998.
  31. Harris, D.; Horwáth, W.R.; van Kessel, C. Acid fumigation of soils to remove carbonates prior to total organic carbon or carbon-13 isotopic analysis. Soil Sci. Soc. Am. J. 2001, 65, 1853–1856. [Google Scholar] [CrossRef]
  32. Margesin, R.; Schinner, F. Manual of Soil Analysis: Monitoring and Assessing Soil Bioremediation; Springer: Berlin, Germany, 2005. [Google Scholar] [CrossRef]
  33. Nelson, D.W.; Sommers, L.E. Total carbon, organic carbon and organic matter. In Methods of Soil Analysis: Part 3, Chemical Methods; Sparks, D.L., Page, A.L., Helmke, P.A., Loeppert, R.H., Soltanpour, P.N., Tabatabai, M.A., Johnston, C.T., Sumner, M.E., Eds.; Soil Science Society of America and American Society of Agronomy: Madison, WI, USA, 1996; pp. 961–1010. [Google Scholar]
  34. Maharaj, S.; Barton, C.D.; Karathanasis, T.A.D.; Rowe, H.D.; Rimmer, S.M. Distinguishing “new” from “old” organic carbon in reclaimed coal mine sites using thermogravimetry: I. Method Development. Soil Sci. 2007, 172, 292–301. [Google Scholar] [CrossRef]
  35. Porta, J.; López-Acevedo, M.; Rodríguez, R. Técnicas y experimentos en Edafología; Col·legi Oficial d’Enginyers Agrònoms de Catalunya: Barcelona, Spain, 1986. [Google Scholar]
  36. UNE 77310-2; Calidad del Suelo. Determinación de la Biomasa Microbiana del Suelo. Parte 2: Método de Extracción-Fumigación. AENOR: Madrid, Spain, 2003.
  37. Kemper, W.D.; Rosenau, R.C. Aggregate stability and size distribution. In Methods of Soil Analysis: Part 1, Physical and Mineralogical Methods, 2nd ed.; Klute, A., Ed.; Soil Science Society of America: Madison, WI, USA, 1986; Volume 9, pp. 425–442. [Google Scholar] [CrossRef]
  38. Grossman, R.B.; Reinsch, T.G. Bulk density and linear extensibility. In Methods of Soil Analysis: Part 4, Physical Methods; Dane, J.H., Topp, G.C., Eds.; Soil Science Society of America: Madison, WI, USA, 2002; pp. 201–254. [Google Scholar] [CrossRef]
  39. Stoops, G. Guidelines for Analysis and Description of Soil and Regolith Thin Sections; Soil Science Society of America: Madison, WI, USA, 2020. [Google Scholar] [CrossRef]
  40. Bullock, P.; Fedoroff, N.; Jongerius, A.; Stoops, G.; Tusina, T.; Babel, U. Handbook for Soil Thin Section Description; Waine Research: Wolverhampton, UK, 1985. [Google Scholar]
  41. Ringrose-Voase, A.J. Micromorphology of soil structure: Description, quantification, application. Aust. J. Soil Res. 1991, 29, 777–813. [Google Scholar] [CrossRef]
  42. SAS Institute. Statistical Analysis System, SAS/TAT; Software V 9.4; SAS Institute Inc.: Cary, NC, USA, 2014; Available online: https://support.sas.com/software/94/ (accessed on 19 June 2023).
  43. Hülsemann, J. On the routine analysis of carbonates in unconsolidated sediments. J. Sediment. Res. 1966, 36, 622–625. Available online: https://pubs.geoscienceworld.org/sepm/jsedres/article/36/2/622/95929/on-the-routine-analysis-of-carbonates-in (accessed on 19 June 2023).
  44. Lamas, F.; Irigaray, C.; Oteo, C.; Chacón, J. Selection of the most appropriate method to determine the carbonate content for engineering purposes with particular regard to marls. Eng. Geol. 2005, 81, 32–41. [Google Scholar] [CrossRef]
  45. Singh, N.B.; Singh, N.P. Formation of CaO from thermal decomposition of calcium carbonate in the presence of carboxylic acids. J. Therm. Anal. Calorim. 2007, 89, 159–162. [Google Scholar] [CrossRef]
  46. Carabassa, V.; Ortiz, O.; Alcañiz, J.M. Sewage sludge as an organic amendment for quarry restoration: Effects on soil and vegetation. Land Degrad. Dev. 2018, 29, 2568–2574. [Google Scholar] [CrossRef]
  47. Bosch-Serra, À.D.; Padró, R.; Boixadera-Bosch, R.R.; Orobitg, J.; Yagüe, M.R. Tillage and slurry over-fertilization affect oribatid mite communities in a semiarid Mediterranean environment. Appl. Soil Ecol. 2014, 84, 124–139. [Google Scholar] [CrossRef]
  48. Moursi, A.A. Toxicity of ammonia on soil arthropods. Bull. Entomol. Soc. Egypt 1970, 4, 241–244. [Google Scholar]
  49. Barrera, I.; Andrés, P.; Alcañiz, J.M. Sewage sludge application on soil: Effects on two earthworm species. Wat. Air Soil Poll. 2000, 129, 319–332. [Google Scholar] [CrossRef]
  50. Rodríguez-Berbel, N.; Ortega, R.; Lucas-Borja, M.E.; Solé-Benet, A.; Miralles, I. Long-term effects of two organic amendments on bacterial communities of calcareous Mediterranean soils degraded by mining. J. Environ. Manag. 2020, 271, 110920. [Google Scholar] [CrossRef]
  51. Kay, B.D. Soil structure and organic carbon: A review. In Soil Processes and the Carbon Cycle; Lal, R., Kimble, J.M., Follett, R.F., Stewart, B.A., Eds.; CRC Press: Boca Raton, FL, USA, 1998; pp. 169–197. [Google Scholar]
  52. Barthès, B.; Roose, E. Aggregate stability as an indicator of soil susceptibility to runoff and erosion; validation at several levels. Catena 2002, 47, 133–149. [Google Scholar] [CrossRef]
  53. Kooistra, M.J.; Tovey, N.K. Effects of compaction on soil microstructure. In Soil Compaction in Crop Production, 1st ed.; Soane, B.D., van Ouwerkerk, C., Eds.; Elsevier Science: Amsterdam, The Netherlands, 1994; Volume 11, pp. 91–111. [Google Scholar]
  54. Luna, L.; Vignozzi, N.; Miralles, I.; Solé-Benet, A. Organic amendments and mulches modify soil porosity and infiltration in semiarid mine soils. Land Degrad. Dev. 2018, 29, 1019–1030. [Google Scholar] [CrossRef]
Figure 1. Images showing the characteristics of the pores and the different forms of OM found: (a) single space enaulic c/f related distribution, compound packing pores (cpp), plant tissue (Pt); (b) double space enaulic related distribution, compound packing pores (cpp); (c) chitonic c/f related distribution ratio, chamber (cm), cavity or vugh (Cv), channel (Cn), plane (P), sludge (SL); (d) vesicles (ve), chamber (cm); (e) compound packing pores (cpp), sludge (SL); (f) calcilutite (cal), polymorphic organic matter (Pom), plant tissue (Pt). All images are under plain polarized light.
Applsci 13 09592 g001
Figure 2. Section of 4-F and 5-F plots. Plot references are described in Table 3. All images are under plain-polarized light and with a 2× magnification in (a,b) images.
Applsci 13 09592 g002
Figure 3. Average (n = 30) of the area occupied (as a percentage) by highly or slightly decomposed soil organic matter. Columns for each studied variable, and with different letters, show significant differences in their values (p-value < 0.05) between field plots. The full plot description is in Table 3.
Applsci 13 09592 g003
Figure 4. Average (n = 30) of the area occupied (as a percentage) by pores or aggregates. Columns for each studied variable, and with different letters, show significant differences in their values (p-values < 0.05) between field plots. The fullull plot description is in Table 3.
Applsci 13 09592 g004
Table 1. Coarse fraction, particle size distribution and chemical characteristics of the soil fraction with an apparent diameter (ø) < 2 mm of two mine tailing materials.
CharacteristicsSilt MaterialCoarse-Sand Material
Coarse fraction (g kg−1)0890
Sand (0.05 < ø < 2 mm, g kg−1)166623
Silt (0.002 < ø < 0.05 mm, g kg−1)633276
Clay (<0.002 mm, g kg−1)201101
pH (potentiometry, 1:2.5)7.67.5
EC (saturated soil extract, dS/m)6.36.3
Oxidizable organic carbon (Walkley-Black, g kg−1)81136
CaCO3 equivalent (Bernad calcimeter, g kg−1)510520
P (Olsen, mg kg−1)32
K (NH4OAc, mg kg−1)4233
Total-N (Kjeldahl, g kg−1)2.12.8
Table 2. Chemical characteristics (over dry matter) of sludge, and pig slurry used in substrates (PSsub) and the one applied over the surface of some plots (PSover).
CharacteristicsSludgePSsubPSover
pH8.58.58.7
Dry matter (g kg−1, over fresh matter)4983934
Total organic carbon (g kg−1)291601672
Total-N (g kg−1)51114143
Organic-N (g kg−1)333734
NH4-N (g kg−1)1877109
P (g kg−1)211412
K (g kg−1)3011089
Table 3. Description of substrate characteristics for the different referenced field plots.
ReferenceSubstrate Characteristics
wSnP 1:3:1Substrate was created with sludge (wS) but without pig slurry on the surface (nP). It was obtained by mixing 1 volume of sludge, 3 volumes of coarse sand material, and 1 volume of silt material (1:3:1) (Table 2 and Table 3). Three experimental plots (1-F, 3-F, and 5-F) were set up.
wSwP 1:3:1Substrate was created with sludge (wS), and pig slurry (wP) was spread over the surface at a rate of 90 m3 ha−1. The ratio of materials (1:3:1) was similar to wSnP plots. Three experimental plots (2-F, 4-F and 6-F) were set up.
nSwP 1:1Plot (7-F) without sludge (nS). Substrate (1:1) was created by mixing 1 volume of coarse sand and 1 volume of treated-silt material. Pig slurry was spread over the surface as in wSwP plots.
nSwP 1:2Plot (8-F) without sludge (nS). Substrate (1:2) was created by mixing 2 volumes of coarse sand and 1 volume of treated-silt material. Pig slurry was spread over the surface as in wSwP plots.
nSnP 1:1Plot (9-F) without sludge (nS) and without pig slurry applied over the surface (nP). Substrate (1:1) was created as in nSwP 1:1 plot.
nSnP 1:2Plot (10-F) without sludge (nS) and without pig slurry applied over the surface (nP). Substrate (1:2) was created as in nSwP 1:2.
Table 4. Averages 1 plus standard deviation (numbers in brackets) in each plot 2 of carbon microbial biomass (Cmb), calcium carbonate equivalent (CaCO3 eq), carbon by dry combustion (Cdry), carbon by calcination at 560 °C (Ccal), and carbon by wet oxidation (Cwet). Carbon fractions by thermogravimetry (one sample per plot): carbonates (CO32−T), organic-C (COT), and mineral-C (CminT) are also included.
Plot 2 ReferenceCmbCaCO3 eqCdryCcalCwetCO32−TCOTCminT
(mg kg−1) (g kg−1)
wSnP 1:3:1 (1-F)703 (27) c521 (13) cd167 (3) a156 (6) a102 (6) b341347
wSwP 1:3:1 (2-F)319 (74) efg543 (21) bc171 (4) a156 (3) a109 (3) a365369
wSnP 1:3:1 (3-F)798 (45) b528 (20) bcd166 (4) a154 (7) ab101 (2) b297389
wSwP 1:3:1 (4-F)336 (29) ef517 (13) bcd167 (5) a151 (7) ab107 (4) a3463710
wSnP 1:3:1 (5-F)896 (37) a533 (17) bc157 (5) b149 (4) ab100 (2) b348418
wSwP 1:3:1 (6-F)317 (37) efg554 (30) ab166 (3) a156 (2) a88 (2) c348358
nSwP 1:1 (7-F)314 (36) efg548 (25) bc156 (7) b155 (3) ab71 (1) e343279
nSwP 1:2 (8-F)378 (34) e504 (16) d157 (4) b156 (2) a76 (3) d352262
nSnP 1:1 (9-F)272 (41) fg526 (20) bcd158 (5) b150 (9) ab68 (1) e341268
nSnP 1:2 (10-F)287 (65) fg581 (5) a165 (4) ab146 (2) b76 (3) d376257
1 Averages of every two groups being compared without any letter in common are different (p-values < 0.05) according to Student’s t-test. 2 Plot references are described in Table 3. The order in a column (number in brackets) matches the sequence, from north to south, of west-oriented field plots.
Table 5. Averages plus standard deviation (numbers in brackets) of water stable aggregates (WSA) 1 in each plot (ordered from north to south,) and according to its substrate characteristics (plot reference 2). The bulk density (Bd) and the ratio of mineral (ø < 2 mm) vs. coarse material are included.
Plot Reference
(Plot Order)
wSnP 1:3:1
(1-F)
wSwP 1:3:1
(2-F)
wSnP 1:3:1
(3-F)
wSwP 1:3:1
(4-F)
wSnP 1:3:1
(5-F)
wSwP 1:3:1
(6-F)
nSwP 1:1
(7-F)
nSwP 1:2
(8-F)
nSnP 1:1
(9-F)
nSnP 1:2
(10-F)
Bd (Mg m−3)1.271.221.151.241.261.301.261.111.251.23
Mineral/coarse ratio0.470.450.480.430.490.440.430.470.480.47
WSA (g kg−1)407 (18) ab412 (27) ab395 (54) ab429 (12) a377 (26) b399 (26) ab251 (3) c248 (1) c218 (8) c221 (7) c
1 Averages of every two groups being compared without any letter in common are different (p-values < 0.05) according to Student’s t-test. 2 Plot references are described in Table 3.
Disclaimer/Publisher’s Note: The statements, opinions and data contained in all publications are solely those of the individual author(s) and contributor(s) and not of MDPI and/or the editor(s). MDPI and/or the editor(s) disclaim responsibility for any injury to people or property resulting from any ideas, methods, instructions or products referred to in the content.

