Article

Electroencephalographic Characterization by Covariance Analysis in Men with Parkinson’s Disease Reveals Sex- and Age-Related Differences

by
Gabriela González-González
1,
Víctor Manuel Velasco Herrera
2 and
Alicia Ortega-Aguilar
1,*
1
Departamento de Bioquímica, Facultad de Medicina, Universidad Nacional Autónoma de México, Mexico City 04510, Mexico
2
Instituto de Geofísica, Universidad Nacional Autónoma de México, Mexico City 04510, Mexico
*
Author to whom correspondence should be addressed.
Appl. Sci. 2023, 13(17), 9618; https://doi.org/10.3390/app13179618
Submission received: 31 May 2023 / Revised: 16 August 2023 / Accepted: 18 August 2023 / Published: 25 August 2023

Abstract

:
Parkinson’s disease (PD) is the fastest growing neurological disease associated with ageing; its symptomatology varies between sexes. Several quantitative electroencephalography analyses have been used to study the early stages and progression of PD. In this study, we aim to characterize the brain activity by considering the five brainwaves in an eyes-closed resting state, using covariance wavelet analysis (CWA) of electroencephalographic records (EEGs) to analyze the influence of sex and age. To effectively eliminate artifacts from the EEG dataset and extract pertinent brain activity, we employ the inverse wavelet analysis. EEGs from men with PD were divided into two age groups (PD < 60 and PD > 60 years old) with their respective age-matched controls (CL). Brain activity patterns in frequency and power domains were analyzed with the CWA. Main frequency profiles, global wavelet curves, power anomalies, and power per brainwave were used to illustrate the CWA patterns. Power anomalies were used to generate anteroposterior power gradients. In PD < 60 men, frequency and power for the α brainwave decreased, while the δ brainwave increased. The θ brainwave increased and was dominant over the α brainwave in PD > 60 men. The anteroposterior power gradient in PD < 60 men had a positive slope, but it was negative in CL. In both PD and CL > 60 men, the anteroposterior gradient was negative. In PD > 60 men, the θ brainwave increased and became dominant. Men with PD had twice the θ brainwave increase. An inverse relationship between α and δ brainwaves was detected in a PD < 60 sex comparison. A conventional EEG spectral analysis using CWA indicated significant differences in brain activity patterns in the PD/CL groups affected by sex and age, yielding previously unknown information.

1. Introduction

Parkinson’s disease (PD) is the fastest growing neurological disorder in people, with a 57% increase from 6 M cases in 2016 to 9.4 M cases in 2020, according to the Global Burden of Disease study [1]. The aging population contributes substantially to the prevalence rates of PD [2,3]; therefore, it is a concern for present-day and future public health, considering that in most industrialized developing countries, the population > 60 years of age was greater than that of children < 5 years old in 2020 [4]. Only 4% of PD patients are diagnosed at age < 40 and are related to genetic mutations; idiopathic PD accounts for the majority of diagnoses at age > 60 [5]. It is confirmed that PD is about 1.5 times more frequent in men than women, and this ratio has not changed substantially over any period studied so far.
Recent studies have shown that men and women have distinctive non-motor and motor symptoms in PD. Men with PD have early motor symptoms and accelerated neurodegeneration during late stages with severe postural and mobility issues [6,7]. Men also have worse general cognitive impairment shown through verbal fluency assessments, specifically, in tests of category fluency and category switch [8]. Furthermore, men take longer to complete inhibition tests (a section of the color word interference test) and have a significant deficit in cognitive flexibility in processing speed tests. It has also been observed that men with PD present greater deficits in frontal executive abilities such as attention [8]. The diagnosis of the early stages of PD has been challenging to neurologists, and it is a current main aim to uncover its origin through animal and human models that replicate some aspects of the symptomatology of the disease. Evidence has shown that PD initially affects the brain in multiple nuclei, such as the motor nucleus of the vagus, raphe nuclei, locus coeruleus, pedunculopontine nucleus, parabrachial nucleus, and the ventral tegmental area. These brain nuclei are associated with the non-motor symptomatology of PD. In the later stages of the disease, the progressive degeneration of the dopaminergic neurons in the nigrostriatal pathway of the substantia nigra pars compacta impairs movement regulation, being the standard observation for clinical diagnosis [9].
The etiology of 90% of PD cases is unknown, while the remaining 10% is related to genetic mutations of specific proteins, mainly α-Synuclein, a ubiquitous protein synthetized by several tissues such as brain (neurons and glia) [10], skeletal muscle [11,12] and blood cells [13]. Although a specific mutation of α-Synuclein (A53T) accounts for most cases of PD arising at <40 years of age [14,15], aggregated α-Synuclein is found in most PD postmortem brains studied, regardless of its genetic or sporadic origin [7]. How non-mutated α-Synuclein is present in sporadic PD and how it alters brain proteostasis is yet to be uncovered. In any case, genetic or sporadic, PD involves non-motor and motor symptoms. Major motor symptoms include tremors, rigidity, and bradykinesia [9]. Non-motor symptoms typically appear long before motor disorders, and they include autonomic symptoms, anosmia, pain, depression, anxiety, sleep disturbances and cognitive impairment [7,16]. The symptoms related to the earlier stage of PD (non-motor symptoms) are difficult to differentiate from other psychiatric syndromes by clinical means [7]. Several imaging techniques, such as single photon emission computed tomography (SPECT), positron emission tomography (PET), functional magnetic resonance imaging (fMRI), and transcranial echography, are helpful for confirming the clinical diagnosis of PD and for differentiating from Parkinsonism [17,18,19]. However, these techniques are not useful in detecting the neurological non-motor symptoms preceding the late-stage movement disorders that characterize the clinical onset of PD.
All PD symptoms correspond to abnormal neuronal firing rates or the segregation/synchronization of neurons from specific circuits and loops between basal ganglia, thalamus, limbic areas, and specific cortical lobes [20]. Therefore, techniques such as quantitative electroencephalography (qEEG) with the use of event-related potentials and somatosensorial-evoked potential tests have been proposed to detect the aforementioned abnormalities in brain activity and identify cognitive impairment in the early stages of PD [21,22]. These abnormalities describe variations in brainwave power: δ (0–4 Hz), θ (4–8 Hz), α (8–13 Hz), β (13–30 Hz), and γ (>30 Hz). The spectral covariance wavelet analysis (CWA) of electroencephalographic records (EEG) was first used in data from women with PD to determine electroencephalographic differences when these were compared to control groups [23]. The CWA showed information undiscernible in a standard analysis of EEG, revealing differences in brain activity (in an eyes-closed resting state) between healthy women and women with PD when compared to age-matched groups (<60 and >60 years old) [23].
In this research, we employed a new advanced signal analysis technique, the Wavelet Transform (WT), which is an intelligent algorithm, to extract the spectral information of an EEG. It is important to highlight that the choice of WT over other methodologies, such as the probabilistic analysis provided by machine learning/deep learning (ML/DL), bears significant implications. Unlike ML/DL, WT operates as a spectral analysis method, rendering it highly robust and stable. Consequently, upon repeating the WT algorithms, the results remain consistent and robust, a feature not shared by ML/DL approaches.
The inherent stability of WT is of paramount importance, as it enables us to identify and characterize EEG biomarkers that exhibit invariance across multiple clinical analyses. Such biomarkers hold immense potential for clinical applications, facilitating reliable and reproducible assessments of neurological conditions. Moreover, the invariant nature of these biomarkers lends them additional credibility, enhancing their suitability for longitudinal studies, disease progression monitoring, and treatment response evaluation.
The Wavelet spectral analysis approach confers distinct advantages, as it allows us to discern subtle variations in the EEG across specific frequency bands. The frequency-specific patterns are of particular relevance in understanding various neurological phenomena, such as brain rhythms, oscillatory dynamics, and event-related or triggered responses. By harnessing the power of the WT, we have unlocked valuable insights into EEG characteristics, laying the foundation for improved diagnostic accuracy, personalized therapeutic interventions, and hence a deeper understanding of neurological disorders.
Consequently, the WT not only aids in the identification of stable and reliable biomarkers, but also contributes to the understanding of the underlying neural processes.
The specific goal of this study was to apply the CWA to an EEG obtained originally for clinical purposes from men diagnosed with PD. Through this analysis, we aim to characterize age-related differences in the brain activity between men with PD and control men, and we aim to compare these data with data previously obtained and reported from women with PD and control women [23].

2. Materials and Methods

This research is a retrospective study based on previously conducted EEG of volunteers diagnosed with PD from the National Institute of Neurology and Neurosurgery (INNN) in Mexico. All clinical methods were carried out in accordance with the INNN guidelines and regulations and did not involve any new EEGs performed by any of the authors. Data analysis protocol was authorized by the Research and Ethical Committee of the Research Division, Faculty of Medicine, National Autonomous University of Mexico under number 018/2023.

2.1. Electroencephalographic Records

Two groups of EEG data were used in this research: data from seven voluntary men diagnosed with idiopathic PD and data from eight voluntary healthy men (CL), both recorded in an eyes-closed resting state. The data were obtained at a sampling rate of 1000 Hz; bandwidth from 0.1 to 100 Hz, and impedance below 5 kΩ, with a Neuroscan SynAmps RT 64-channel Amplifier (RRID:SCR_015818) and CURRY software (RRID:SCR_009546).
For this study, 21 electroencephalographic channels (Fp1, Fpz, Fp2, F7, F3, Fz, F4, F8, T7, C3, Cz, C4, T8, P7, P3, Pz, P4, P8, O1, Oz and O2) were used, in agreement with the international 10–20 system with the A1 channel as reference. The EEG obtained was used for methodological and didactical purposes to ultimately promote the search for new mathematical models that can enhance data analysis by using a standard technique as we have previously reported [23].

2.2. Volunteers Overview

Men with both PD and CL were of urban residence and between 40 and 70 years old. Exclusion criteria for men with PD included secondary PD or Parkinsonism associated with other pathologies or drugs. No cognitive impairment was reported in any group.
The EEG from men with PD were obtained under the effects of pharmacological treatment. These men were medicated in correspondence to the time of progression of the disease and included Levodopa (dopamine precursor) and Carbidopa or Benserazide (inhibitors of the DOPA-decarboxylase) [24], Pramipexol (dopaminergic agonist) [25] and Rasagiline (monoamine Oxidase B inhibitor) [26] alone or in combination.
The volunteer groups were subdivided based on age, that is, under and over 60 years of age (<60 and >60), to perform the age-related analysis. Then, they were labeled as PD < 60 (n = 4) and PD > 60 (n = 3) groups for men diagnosed with PD and CL < 60 (n = 4) and CL > 60 (n = 4) for control groups. PD < 60 group was 47.2 ± 6.6 years old [mean ± standard deviation], and PD > 60 group was 71.0 ± 3.6 years old; CL < 60 group was 57.2 ± 1.7 years old, and CL > 60 was 66.7 ± 3.2 years old. The mean duration of PD for < 60 group was 5.1 ± 3.1 years, and for > 60, it was 5.7 ± 1.6 years.

2.3. Covariance Wavelet Analysis and Wavelet Transform

The CWA uses the wavelet transform as a base. The continuous form of the wavelet transform (CWT) is expressed as the following Equation (1):
W n X s = n 1 N x n ψ n n δ t s
where xn is the time series, ψ is the Morlet mother function, (*) indicates the complex conjugate, n is the number of points, s is the wavelet scale, and δ t is the localized time index [27]. The power to the CWT for a time series given (X) is defined as follows in Equation (2):
| W n X ( s ) | 2
The CWA takes the information obtained by the CWT to find patterns of activity in time-frequency spaces by means of the cross-wavelet transform (XWT), as previously described in detail [23].

2.4. Data Preprocessing

To eliminate artifacts from the EEG and extract relevant brain activity while minimizing potential noise, we employed the inverse WT as robust method. Briefly, we applied CWT to the original data and used the inverse Continuous Wavelet Transform (iCWT) to reconstruct signals. The iCWT is considered as a band-pass filter; hence, we could reconstruct the signals in a specific frequency range [28], from 2 to 50 Hz. We removed high-frequency noises and the powerline interference generated by electrical devices, mainly the 60 Hz frequency, by establishing an upper threshold of 50 Hz. The baseline and the pulse artifacts (lower frequencies than 1.5 Hz) were eliminated when we established the lower limit at 2 Hz. Muscle artifacts can share frequencies with neurological signals mainly in the α band; however, they are generally 1 to 2 orders of magnitude larger; these kinds of artifacts were visually inspected and eliminated.
The application of the iCWT ensured the removal of all non-relevant signals and was able to effectively isolate signals within the δ, θ, α, β, and γ frequency bands of interest while removing any extraneous signals, whether originating internally or externally [28].
If certain artifacts persisted after preprocessing, we were confident that they did not alter the results due to the employment of the XWT as a part of the CWA. For a more comprehensive understanding of the methodology and technical details, see [29] and please refers to Appendix A.

2.5. Continuous Wavelet Transform and Cross-Wavelet Transform

After the filtering process, we eliminated the first and the last seconds of each time series to avoid edge effects. Then, 21 periods of artifact-free 90 s intervals were intercepted for each CL and PD group. We again applied the CWT to all these periods.
Figure 1 shows two representative continuous wavelet spectra from the Fp1 channel. Figure 1A exemplifies a CL man, and Figure 1B a man diagnosed with PD. On the spectra, the original time series is shown at the upper panel. The central panel shows the power wavelet spectrum (PWS), where the cone of influence is represented by the black curved line. The cone of influence limits the sections on the PWS where the edge effects can be ignored. The color bar on the top represents the normalized continuous wavelet power, where red represents the highest power and blue represents the lowest power. The right panel shows the global wavelet spectrum (GWS), where the continuous line (global wavelet curve) represents the normalized power in each period value and the dotted line denotes the 95% confidence level for the power. The confidence level in wavelet analysis is related to the red noise power level at the 95% confidence interval, which refers to the range of confidence about a given value [27]. Figure 1C corresponds to the zoom of the GWS in frequency, highlighting the power of the brainwaves from the CL man and the man diagnosed with PD. The brainwave frequency ranges used in this research were as follows (in Hz): δ (2–3.9), θ (4–7.9), α (8–12.9), β (13–29.9) and γ (30–50).
To perform the CWA, we used the spectral information obtained by the CWT and applied multiple XWT to pairs within each group (PD < 60 and >60; CL < 60 and >60) to eliminate individual features. The pairs were performed while taking into consideration a symmetric square matrix per group, such as was previously described [23]. In each group, the possible pairs were six for CL < 60, six for CL > 60, six for PD < 60, and three for PD > 60. For each pair, 21 XWT were applied, which corresponded to each one of the 21 electroencephalographic channels used in this research. Thus, after executing the XWT within the groups, 126 cross wavelet spectra (XWS) were obtained for CL < 60, 126 for CL > 60, 126 for PD < 60, and 63 for PD > 60.

2.6. Global Wavelet Profiles

From each XWS, the GWS was used, and four global wavelet profiles were constructed for each group [23]. The main frequencies profile revealed the most characteristic brainwave and their frequencies in each channel, as well as their distribution. The global wavelet curves profile revealed the power level of each brainwave per channel as well as the mean global wavelet curve, highlighting the characteristic brainwaves for the group. The power anomalies profile showed positive (increasing) and negative (decreasing) values of power in terms of Z-value, revealing the power relationship of the five brainwaves analyzed per channel. To quantify the anteroposterior power gradient, a linear regression was performed. The brainwave power profile of each group was performed with the mean power of each brainwave obtained by the arithmetic mean of the power (areas under the curve) of each channel. This profile was presented in bar graphs with standard errors indicated.
All EEG data were processed with the MATLAB software (version 9.7.0.1471314, R2019b; RRID:SCR_001622).

2.7. Statistical Analysis

The results obtained were compared by condition (with PD vs. CL) according to age range. We compared the mean global wavelet curves, the brainwave power profiles, and the anteroposterior power gradients from power anomalies profiles. The morphology of the mean global wavelet curves was contrasted with Pearson’s correlation coefficients using a significance level of 95%, and the most representative brainwaves of each group were compared for frequency and power. The Pearson’s correlation coefficients gave values regarding the similarity of the curves, indicating if the brain activity of the five brainwaves oscillated in a similar or different way between the groups. To assess the brainwave power profiles, ANOVA analyses were performed on the mean power values of each brainwave, using a significance level of 95%. ANOVA revealed if there were statistically significant differences between the values of the compared groups. The anteroposterior gradients were evaluated according to their y-intercept and slope values. The differences in slope gave information about the rate of change of power between anterior and posterior brain regions of each group, where a larger slope means a larger rate of change. The y-intercept values gave information about the power dispersion range in standard deviations (SD) corresponding to the brain activity from all the EEG channels for each group.
Statistical analyses were also performed between our results and our previous analysis from women with PD and age-matched controls acquired with the same method [23].
It is important to mention that due to the data dispersion, we also obtained median curves for the global wavelet curve profiles (curves not shown) and compared their characteristics with the mean curves. According to ANOVA analysis, there were no statistically significant differences between the mean and median curves: CL < 60 group (F = 0.01, prob > F = 0.9396), PD < 60 group (F = 0.06, prob > F = 0.8095), CL > 60 group (F = 0.03, prob > F = 0.8619) and PD > 60 group (F = 0, prob > 0.9476). Pearson’s correlation coefficients also were used to compare the curves. For all cases, coefficients were greater than 0.99: CL < 60 = 0.998; CL > 60 = 0.998; PD < 60 = 0.996; PD > 60 = 0.999, using a significance level of 95%.
The brainwave power profiles were also additionally assessed with a Kruskal–Wallis test due to data dispersion. The test results showed two cases with differences with respect to the ANOVA analysis based on mean values. In the comparison between men and women CL < 60 groups, ANOVA showed in the δ brainwave significant differences, while the Kruskal–Wallis test showed no differences (Chi-sq = 2.47, prob > Chi-sq = 0.1159). In the comparison between male and female PD groups, ANOVA showed significant differences in the θ brainwave results, while the Kruskal–Wallis test showed no differences (Chi-sq = 2.02, prob > Chi-sq = 0.1552).
All the statistical analyses were performed with the MATLAB software (version 9.7.0.1471314, R2019b; RRID:SCR_001622).

3. Results

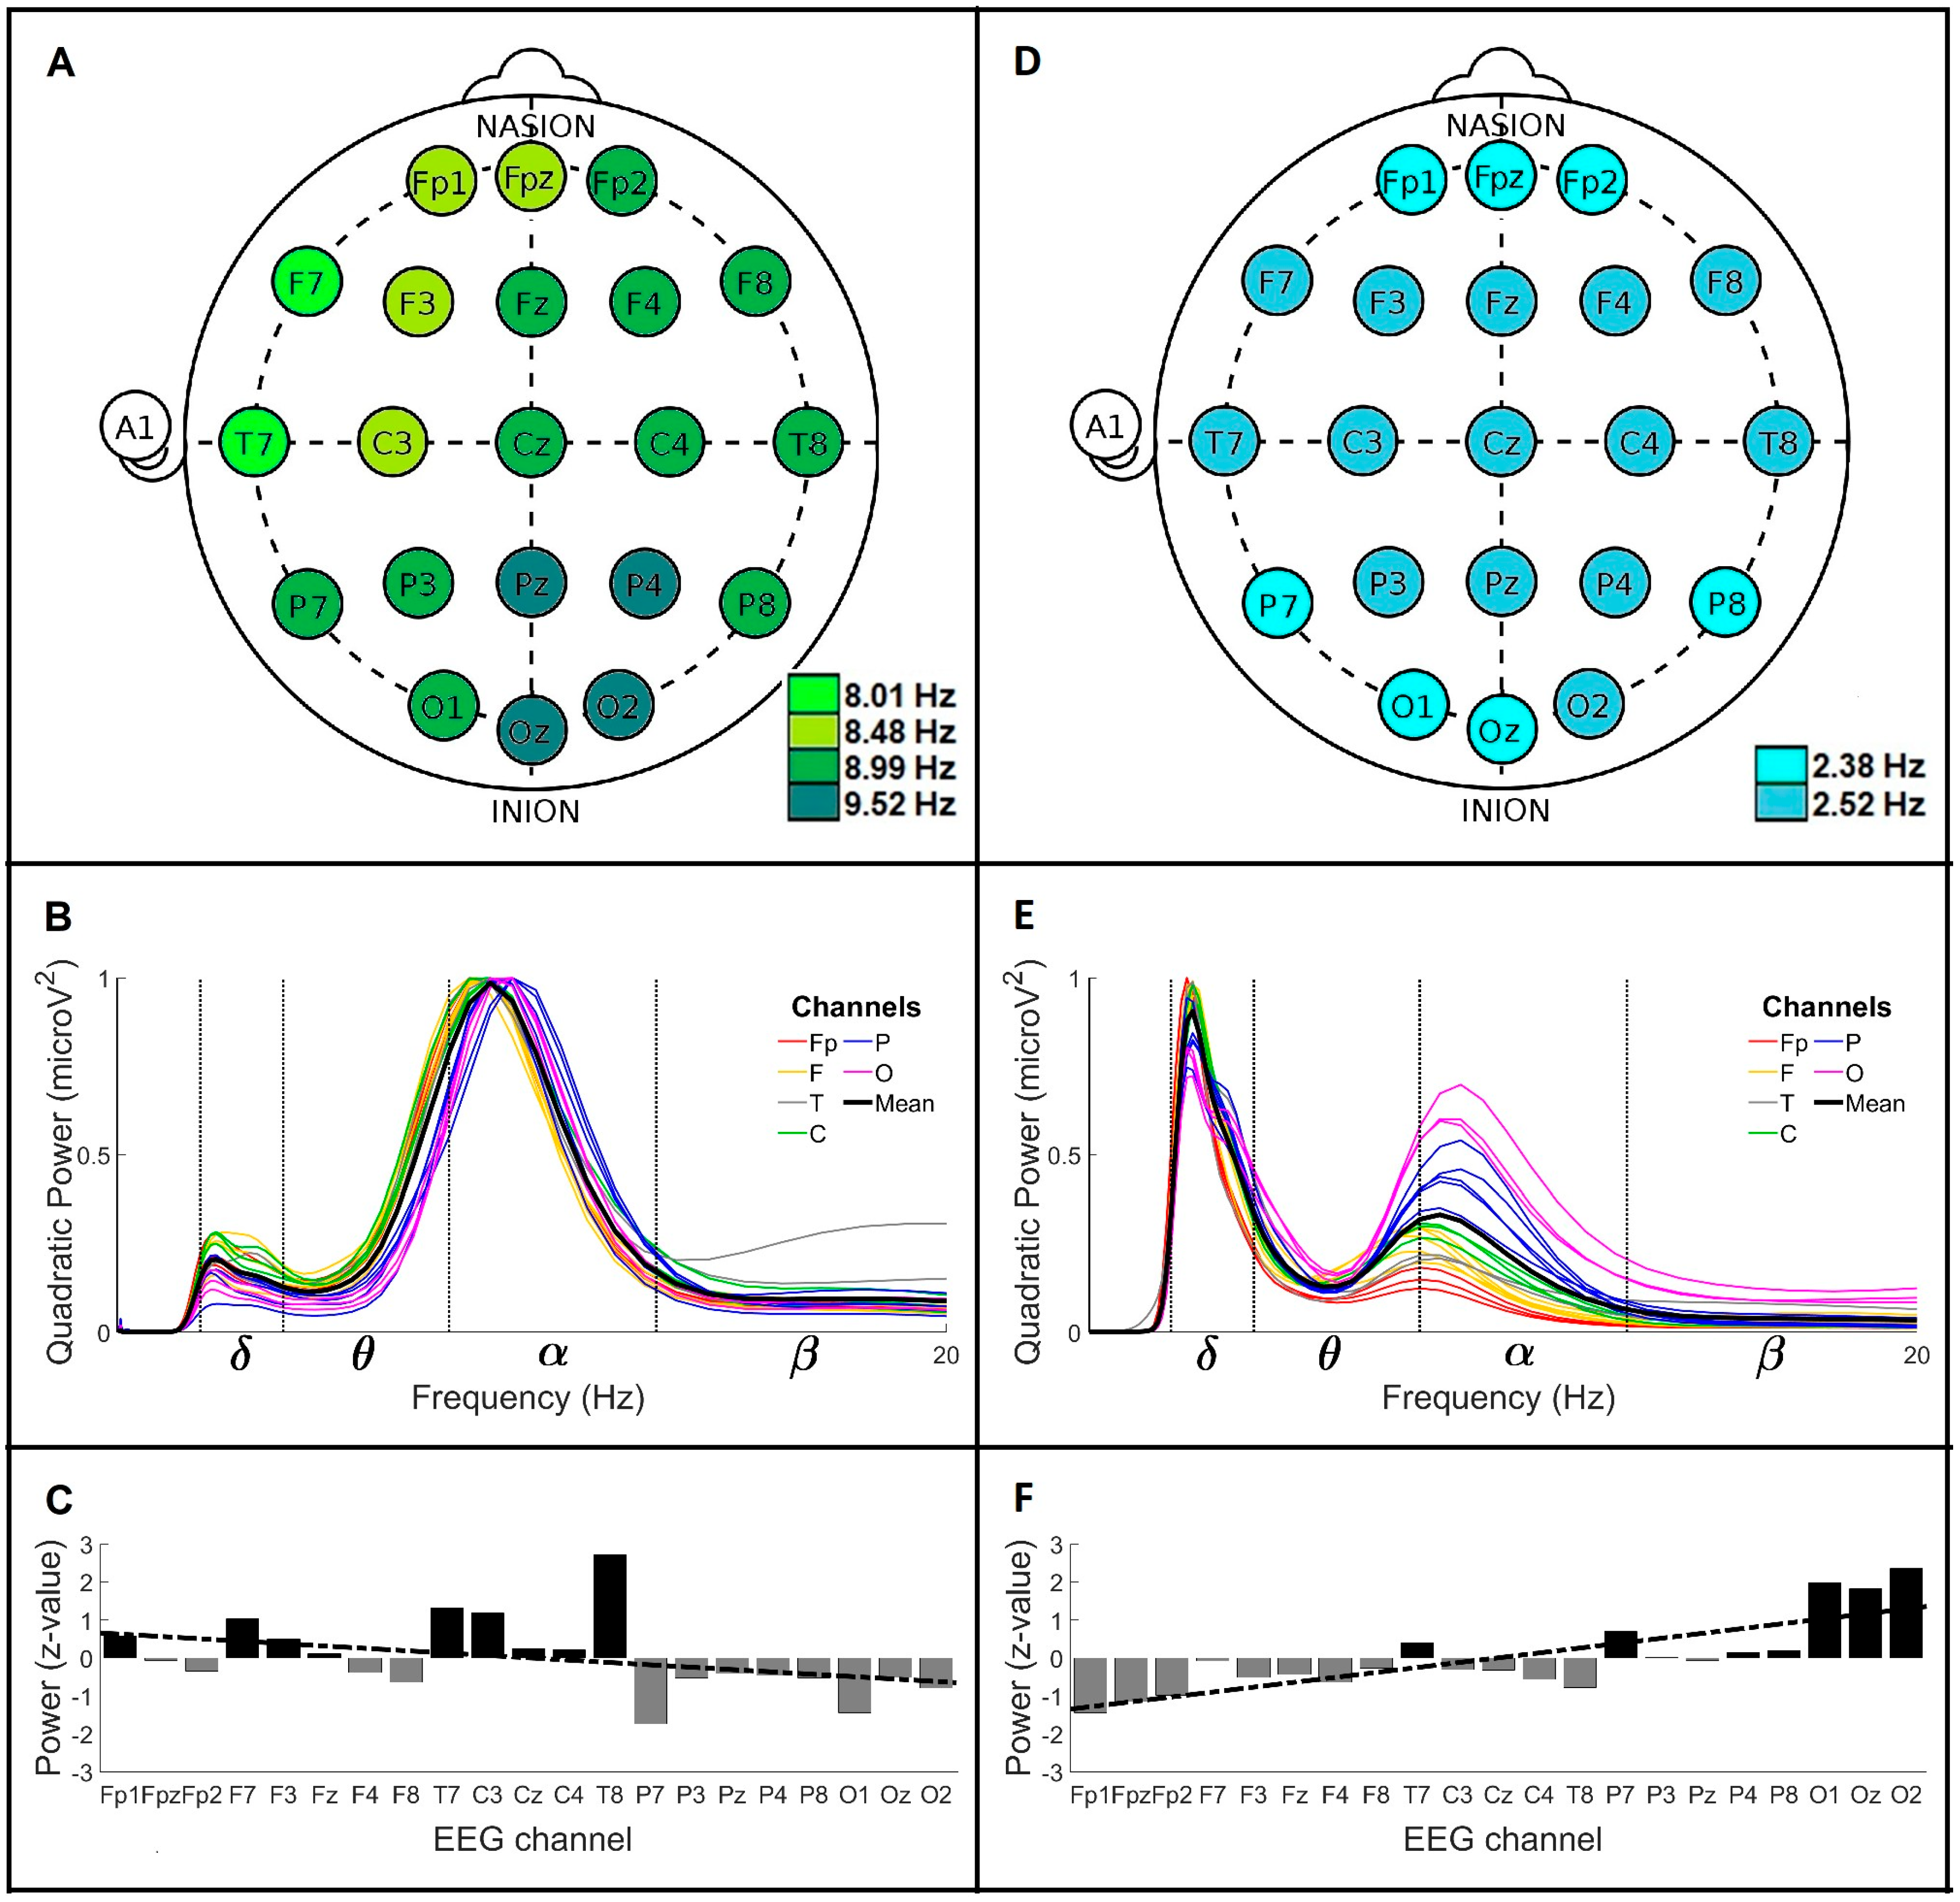
3.1. Global Wavelet Profiles of Control and Parkinson’s Disease Men under 60 Years Old (<60)

Figure 2 shows the global wavelet profiles of the CL and PD groups < 60. Figure 2A shows the main frequencies profile for CL < 60, where the main brainwave registered was α with frequencies of 8.01, 8.48, 8.99, and 9.52 Hz. The 8.99 Hz frequency was observed mainly in the right anterior region (Fp2, Fz, F4, F8, Cz, C4, T8 and P8 channels) and in the left posterior region (P3, P7 and O1 channels). The 8.01 and 8.48 Hz were localized mainly in the left anterior region (F7 and T7 channels, and Fp1, Fpz, F3 and C3 channels, respectively). The 9.52 Hz was found in four central posterior channels: Pz, P4, Oz and O2. The frequencies observed in this group show that the brain activity for CL < 60 fluctuates between 8 and 9.5 Hz. In posterior channels, higher frequencies were found. Figure 2B shows the global wavelet curves profile for CL < 60 (n = 6 crossings per channel). In this group, the mean global wavelet curve shows a main α brainwave with a frequency of 8.99 ± 1.86 Hz and a power of 0.98 microV2. The α power dispersion range was observed between the C3 channel (1.81 SD above average power) and the P7 channel (1.64 SD below average power). A secondary δ brainwave was observed with a frequency of 2.38 ± 0.50 Hz and a power of 0.20 microV2. The δ power dispersion range was identified between the F7 channel (1.65 SD above average power) and the P7 channel (2.02 SD below average power). Figure 2C represents the power anomalies profile for CL < 60. In this group, the mean power value of the F, T and C channels corresponded to positive anomalies, and the mean power of the P and O channels corresponded to negative anomalies. The mean power of the Fp channels was near zero. The observed anteroposterior power gradient for this group was decreasing (slope = −0.06; y-intercept = 0.69 SD).
Figure 2D shows the main frequencies profile for PD < 60, where the main brainwave was δ with frequencies of 2.38 and 2.52 Hz. The 2.38 Hz frequency was distributed on the Fp channels and some posterior regions (P7, P8, O1 and Oz channels). The 2.52 Hz frequency was observed in almost all brain regions (F, T, C, P3, Pz, P4 and O2 channels). The frequencies observed in this group show that the main brain activity for men PD < 60 corresponds to slow waves of around 2.4 Hz. Figure 2E represents the global wavelet curves profile for PD < 60 (n = 6 crossings per channel). The mean global wavelet curve shows a main δ brainwave with a frequency value of 2.52 ± 1.05 Hz and a power of 0.90 microV2. The δ power dispersion range was identified between the F7 channel (1.70 SD above average power) and the O2 channel (2.24 SD below average power). The secondary brainwave observed was α, with a frequency value of 8.48 ± 2.22 Hz and a power of 0.33 microV2. The α power dispersion range was identified between the O2 channel (2.35 SD above average power) and the Fp1 channel (1.20 SD below average power). Figure 2F shows the power anomalies profile for PD < 60. The mean power values of the P and O channels showed positive anomalies, while the mean power values of the Fp, F, T, and C channels presented negative anomalies. The observed anteroposterior power gradient was increasing (slope = 0.13; y-intercept = −1.4 SD).

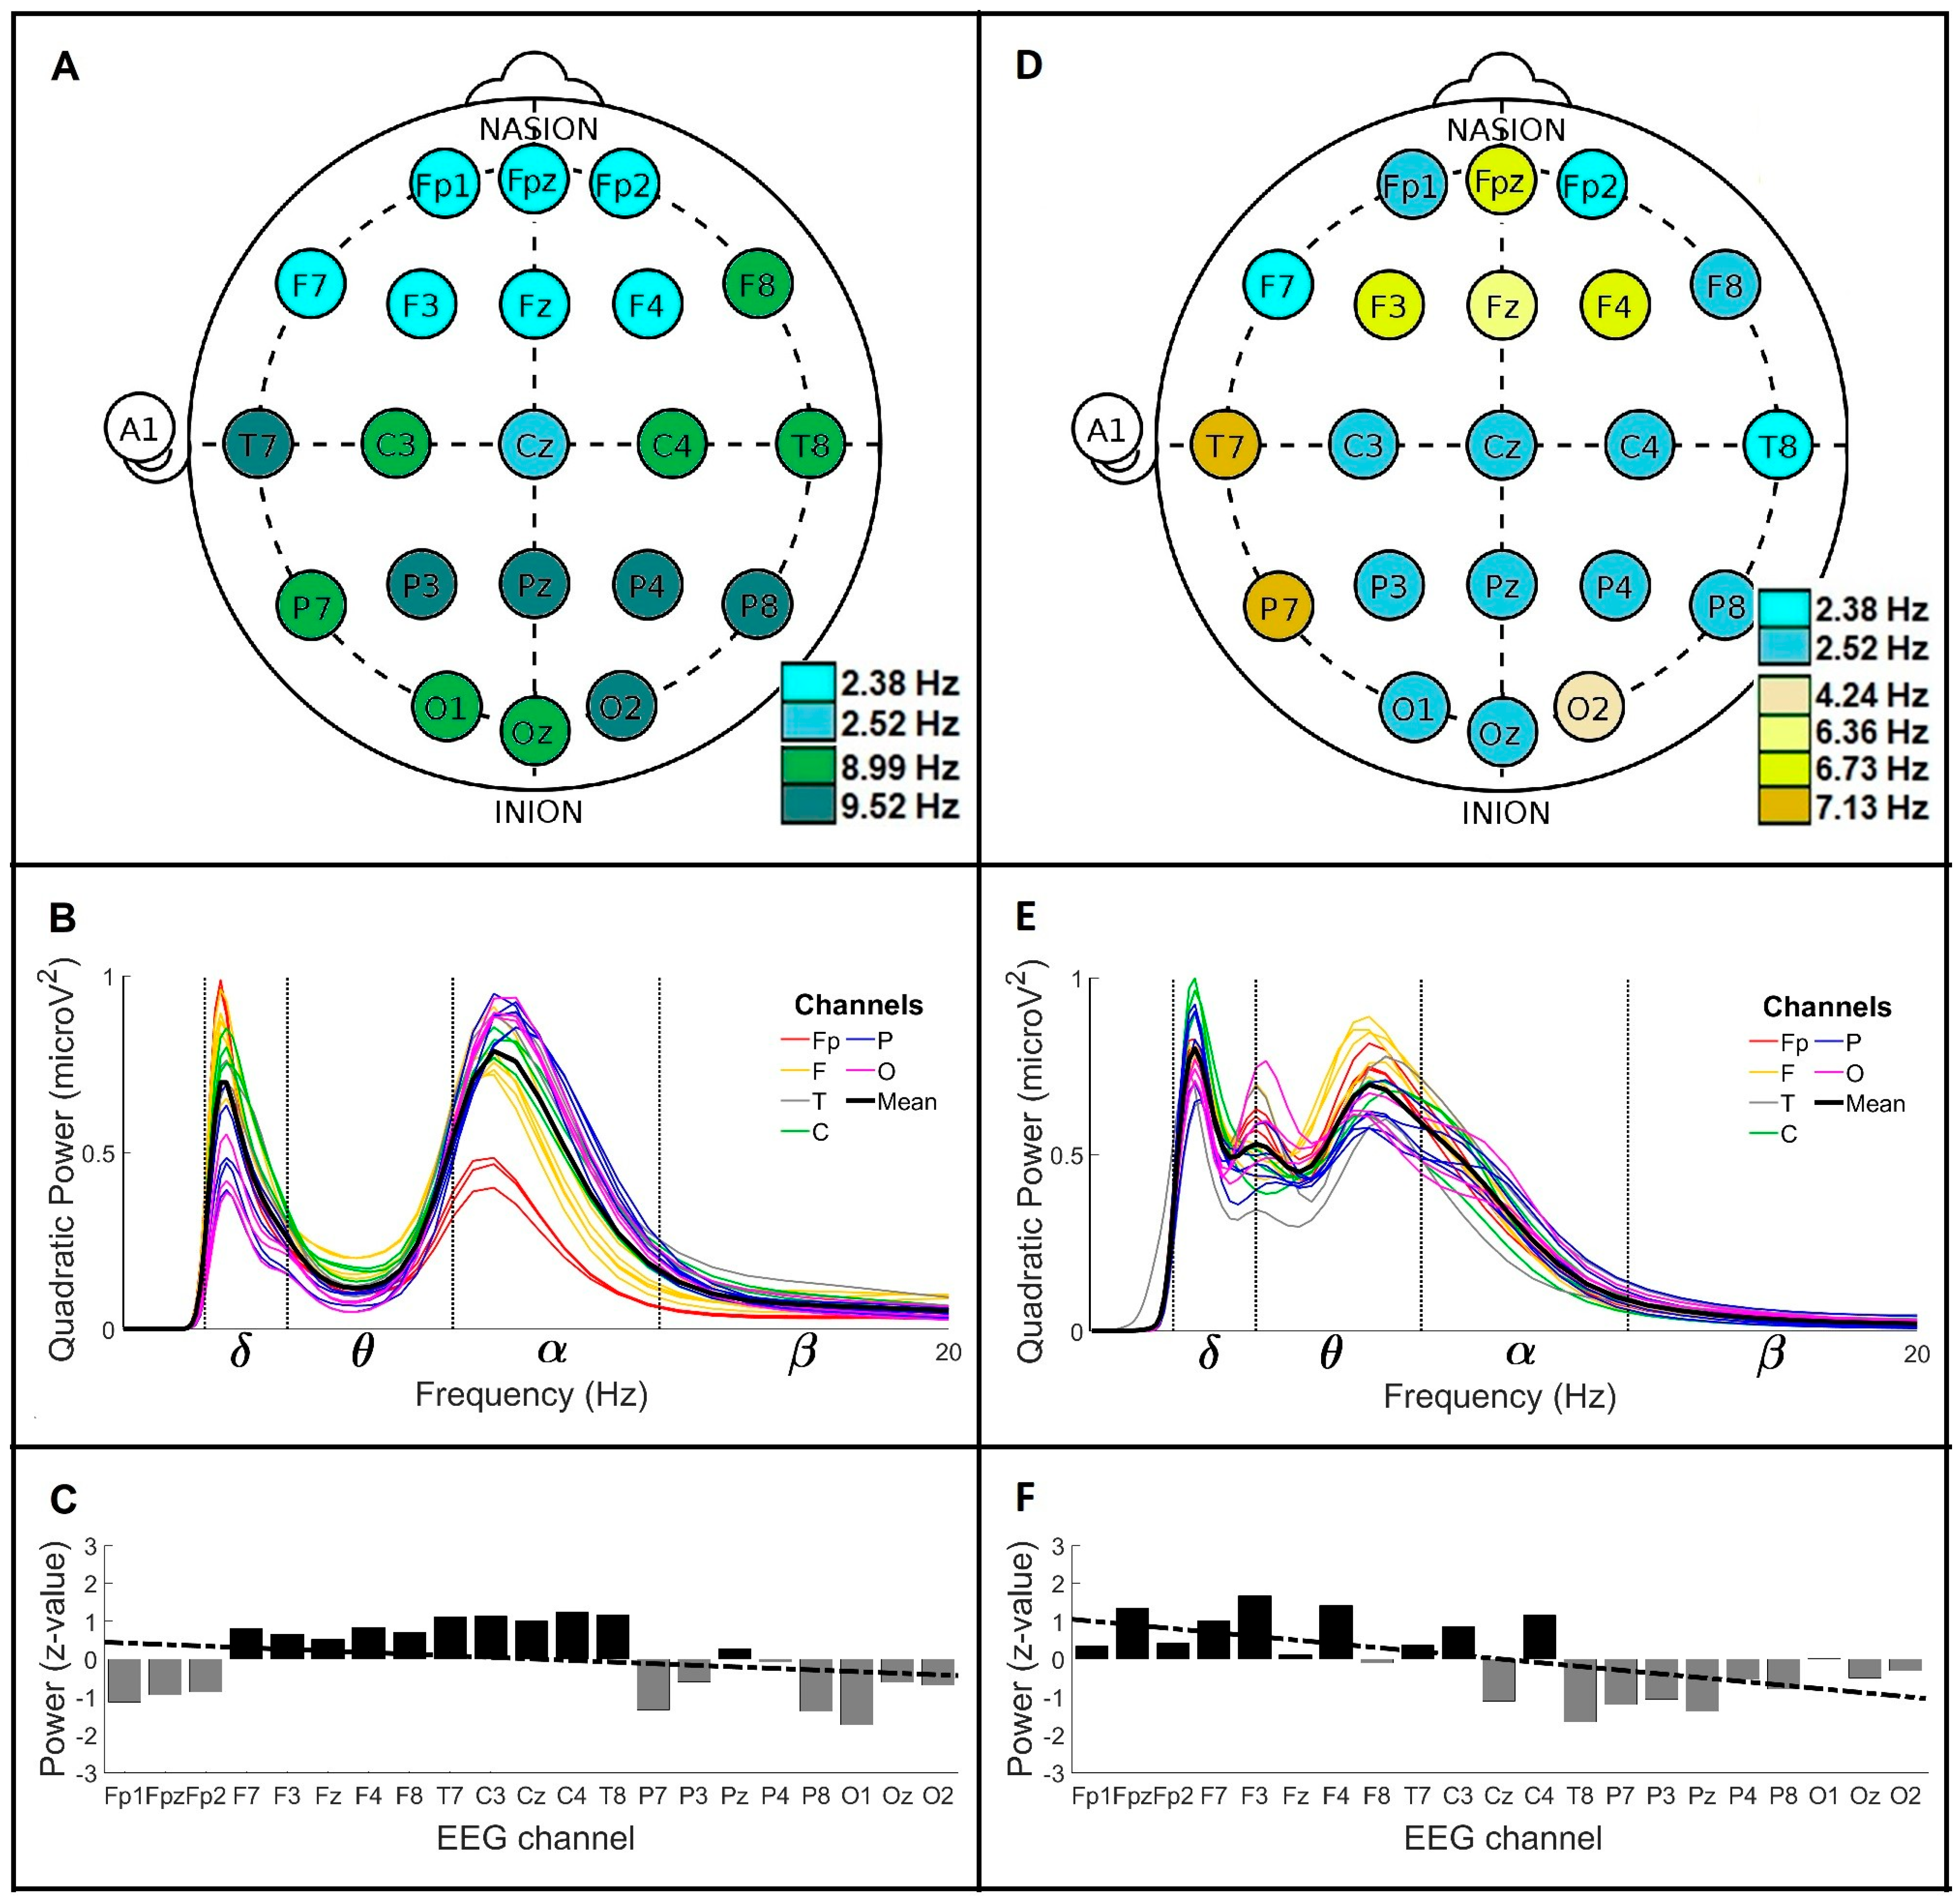
3.2. Global Wavelet Profiles of Control and Parkinson’s Disease Men over 60 Years Old (>60)

Figure 3 shows the general wavelet profiles of the CL and PD groups > 60. Figure 3A shows the main frequencies profile for CL > 60, where two main brainwaves were observed, δ and α. The δ brainwave was registered on anterior channels with frequency values of 2.38 and 2.52 Hz. The 2.38 Hz frequency was found through all Fp and F channels, except channel F8. The 2.52 Hz frequency was only observed in the Cz channel. The α brainwave was mainly found on the middle and posterior channels with frequency values of 8.99 and 9.52 Hz. Both α frequencies were very spread out; the 8.99 Hz was observed on the F8, C3, C4, T8, P7, O1 and Oz channels, and the 9.52 Hz frequency was registered on the T7, P3, Pz, P4, P8 and O2 channels. These observations indicate that the brain activity for men CL > 60 is slower on anterior channels (around 2.4 Hz) and faster on posterior channels (around 9 Hz). Figure 3B is the global wavelet curves profile for CL > 60 (n = 6 crossing per channel). In this group, the mean global wavelet curve shows notably δ and α brainwaves with similar power values, 0.69 and 0.78 microV2, respectively. The frequency value for the δ brainwave was 2.52 ± 0.98 Hz, and for the α brainwave, it was 8.99 ± 2.34 Hz. In this profile, the δ power dispersion range was identified between the F7 channel (1.36 SD above average power) and the O1 channel (1.78 SD below average power). The α power dispersion range was found between the O2 channel (0.90 SD above average power) and the Fp1 channel (2.27 SD below average power). Figure 3C represents the power anomalies profile for CL > 60. The mean power value of the F, T and C channels had positive anomalies, and the mean power value of the Fp, P and O channels had negative anomalies. The observed anteroposterior power gradient was decreasing (slope = −0.04; y-intercept = 0.46 SD).
Figure 3D is the main frequencies profile for PD > 60. In this group, two slow brainwaves were observed, δ and θ. The δ brainwave showed frequency values of 2.38 and 2.52 Hz, while the θ brainwave showed frequency values of 4.24, 6.36, 6.73 and 7.13 Hz. The 2.38 Hz frequency was only observed on the Fp2, F7 and T8 channels. The 2.52 Hz frequency was widely distributed on the Fp1, F8, C, P3, Pz, P4, P8, O1 and Oz channels. The 4.24 Hz frequency was only observed on the O2 channel, and the 6.36 Hz frequency was only observed on the Fz channel. The 6.73 Hz frequency was localized on the Fpz, F3 and F4 channels, and the 7.13 Hz frequency was found on the T7 and P7 channels. These observations showed that the brain activity for men PD > 60 oscillates mainly in δ frequencies around 2.4 Hz, however, it also presents θ frequencies scattered in different brain regions with values from 4.24 to 7.13 Hz. Figure 3E is the global wavelet curves profile for PD > 60 (n = 3 crossings per channel). The mean global wavelet curve showed, interestingly, three main frequency values, one for the δ brainwave and two for the θ brainwave. The δ brainwave had a frequency value of 2.52 ± 0.47 Hz with a power of 0.79 microV2, and its power dispersion range was identified between the C4 channel (1.78 SD above average power) and the P7 channel (2.14 SD below average power). The θ frequency values were 4.00 ± 0.70 and 6.73 ± 3.27 Hz, with powers of 0.53 and 0.69 microV2, respectively. The power dispersion range of the 4 Hz frequency oscillated between the O2 channel (2.54 SD above average power) and the T8 channel (2.30 SD below average power). The power dispersion range of the 6.73 Hz frequency fluctuated between the F3 channel (1.98 SD above average power) and the T8 channel (1.76 SD below average power). Figure 3F shows the power anomalies profile for PD > 60. The mean power of the Fp, F and C channels showed positive anomalies, while the mean power of the T, P and O channels had negative anomalies. The anteroposterior power gradient was decreasing (slope = −0.10; y-intercept = 1.1 SD).

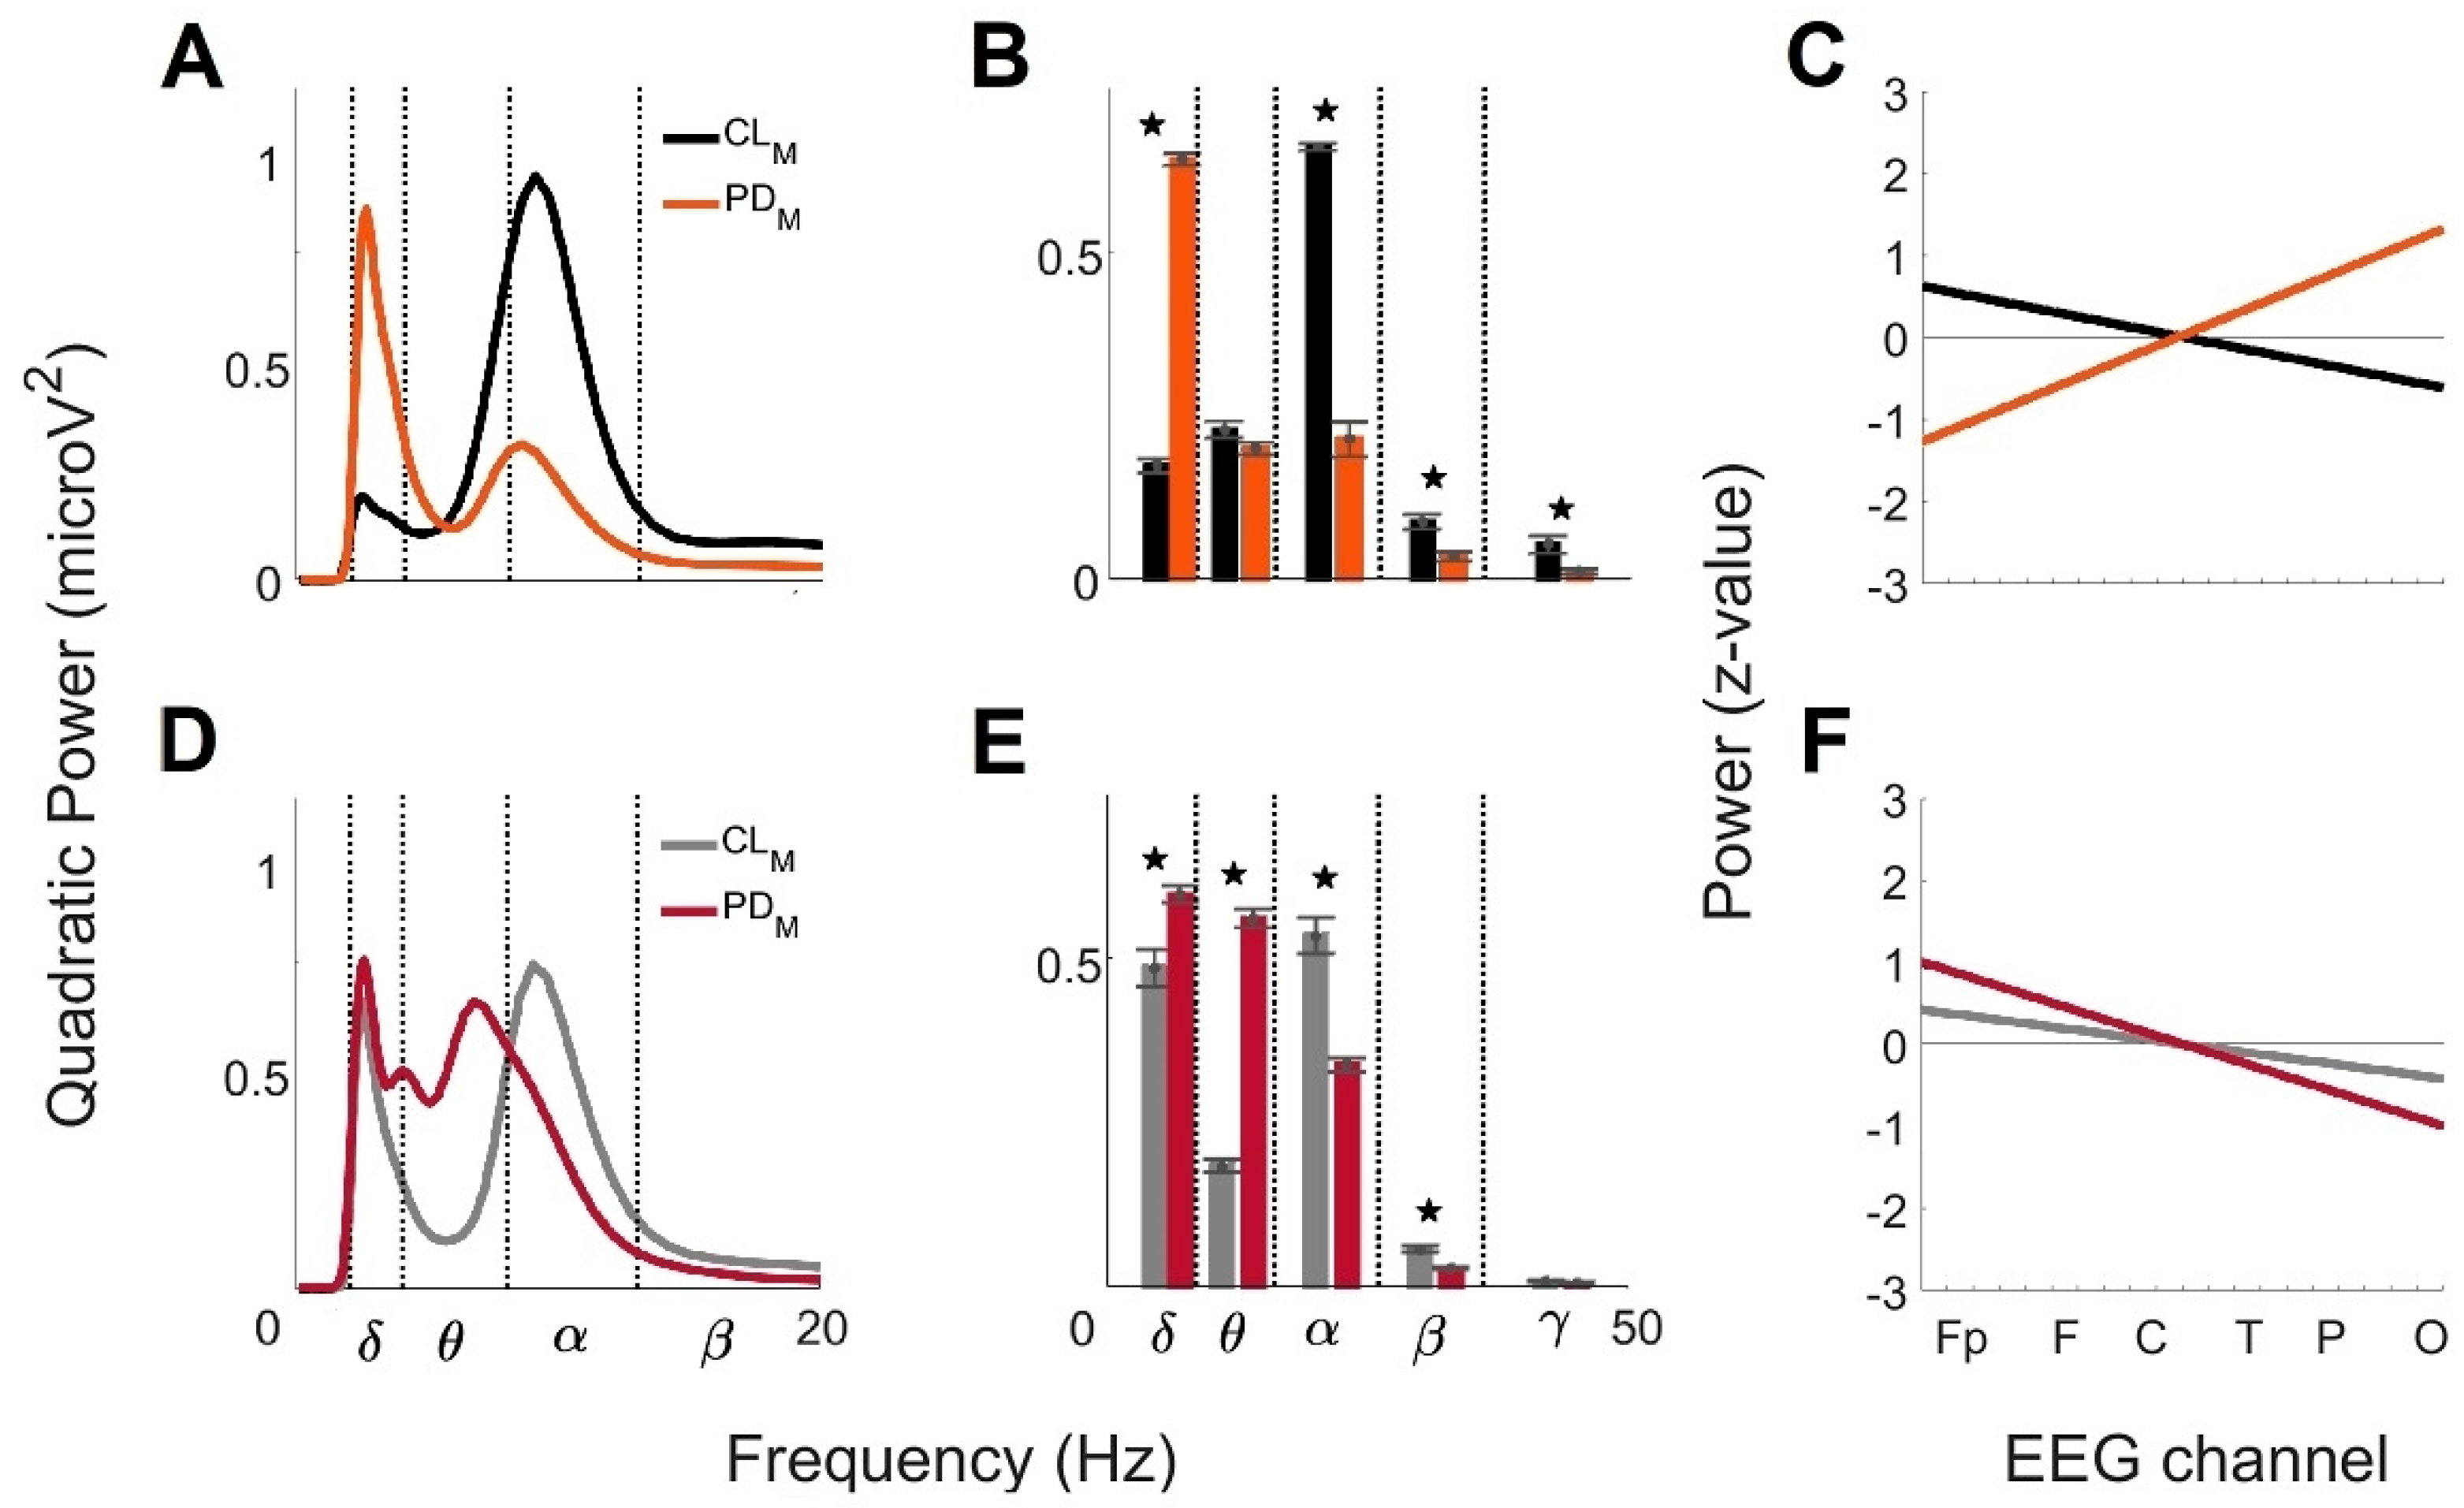
3.3. Comparison of the Global Wavelet Profiles from Control and Parkinson’s Disease Men under 60 Years Old (<60) and over 60 Years Old (>60)

Figure 4 shows the comparison of the mean global wavelet curves, the brainwave power profiles, and the anteroposterior power gradients from CL < 60 and PD < 60 and from CL > 60 and PD > 60. Figure 4A represents the comparison of the mean global wavelet curves from CL < 60 and PD < 60. The similarity of the curves estimated by Pearson’s correlation coefficient was 0.21. The differences were mainly related to the higher frequency and power values of the α brainwave in CL < 60 (8.99 Hz; 0.98 microV2) compared to in PD < 60 (8.48 Hz; 0.33 microV2), and to the lower frequency and power values in the δ brainwave observed in CL < 60 (2.38 Hz; 0.20 microV2) compared to PD < 60 (2.52 Hz; 0.90 microV2). These features marked an inverse relationship between the α and δ brainwaves in the brain activity of the groups. Figure 4B shows the comparison of the brainwave powers profile from CL < 60 and PD < 60. ANOVA analysis showed four brainwaves with significant differences between the groups: δ (F = 1076.8, prob > F = 1.53 × 10⁻³⁰), α (F = 265.64, prob > F = 2.91 × 10⁻¹⁹), β (F = 16.52, prob > F = 2 × 10⁻⁴), and γ (F = 8.18, prob > F = 6.7 × 10⁻³). Figure 4C shows the anteroposterior power gradients from CL < 60 and PD < 60. The tendency of the gradient for PD < 60 (increasing; slope = 0.13; y-intercept = −1.4 SD) was the opposite of that for CL < 60 (decreasing; slope = −0.06; y-intercept = 0.69 SD). The slope values revealed that the rate of change between anterior and posterior brain regions was larger for PD < 60, and the y-intercept showed that the gradient in CL < 60 was set to a range of 1.38 SD, while in men with PD < 60, it was higher (2.8 SD).
Figure 4D represents the comparison of the mean global wavelet curves across CL > 60 and PD > 60. The similarity of the curves estimated by Pearson’s correlation coefficient was of 0.71. The similarity was clearly observed in the δ brainwave. The differences were related to the switch between α brainwave activity, clearly observed for CL > 60 but not for PD > 60, and θ brainwave activity; it was not identified for CL > 60 but was present at two main frequencies for PD > 60. Figure 4E shows the comparison of the brainwave powers profiles from CL > 60 and PD > 60. According to the ANOVA analysis, four brainwaves were significantly different between the groups: δ (F = 13.27, prob > F = 8 × 10⁻⁴), θ (F = 503, prob > F = 2.87 × 10⁻²⁴), α (F = 45.21, prob > F = 4.55 × 10⁻⁸) and β (F = 30.49, prob > F = 2.2 × 10⁻⁶). Figure 4F shows the anteroposterior power gradients from CL > 60 and PD > 60. The tendency of the gradients was decreasing in both groups; however, the y-intercept and the slope were lower for CL > 60 (0.46 SD and −0.04) than for PD > 60 (1.1 SD and −0.10). According to the above, the gradient for CL > 60 fluctuates in a range less than 1 SD, while for PD > 60, it oscillates in a range of 2.2 SD. Additionally, the rate of change between anterior and posterior brain regions is larger for PD > 60 than for CL > 60.

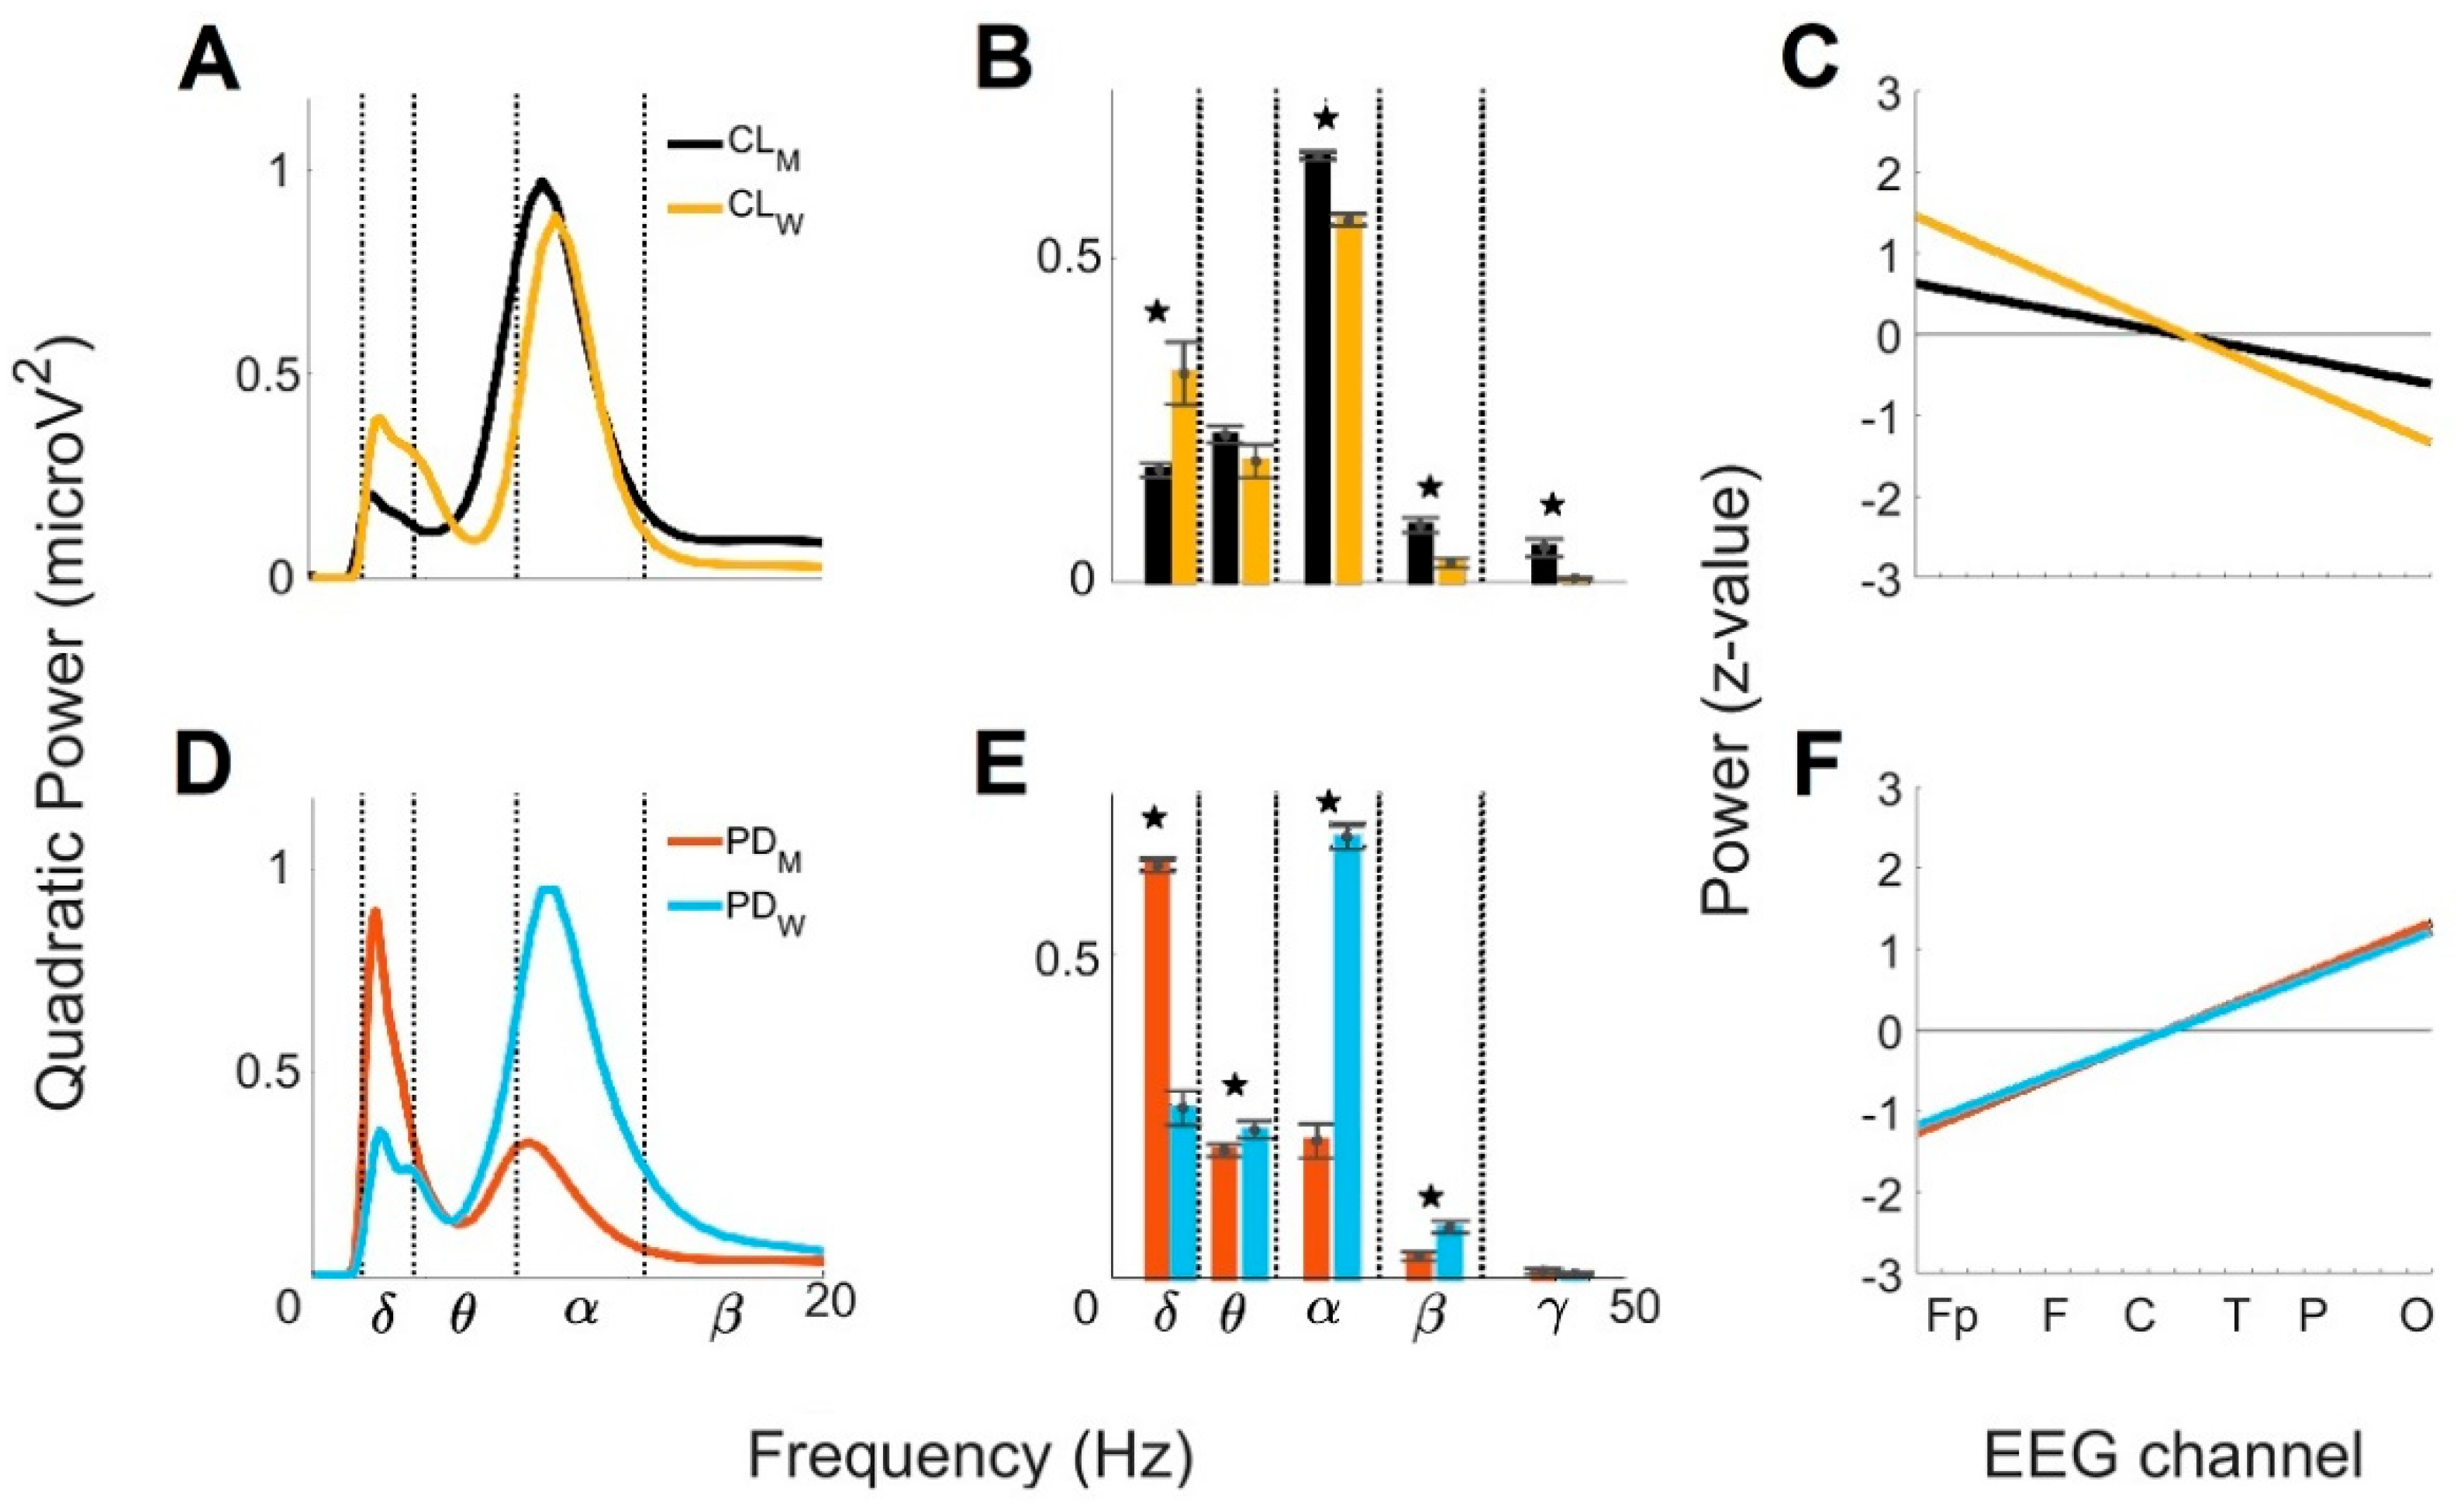
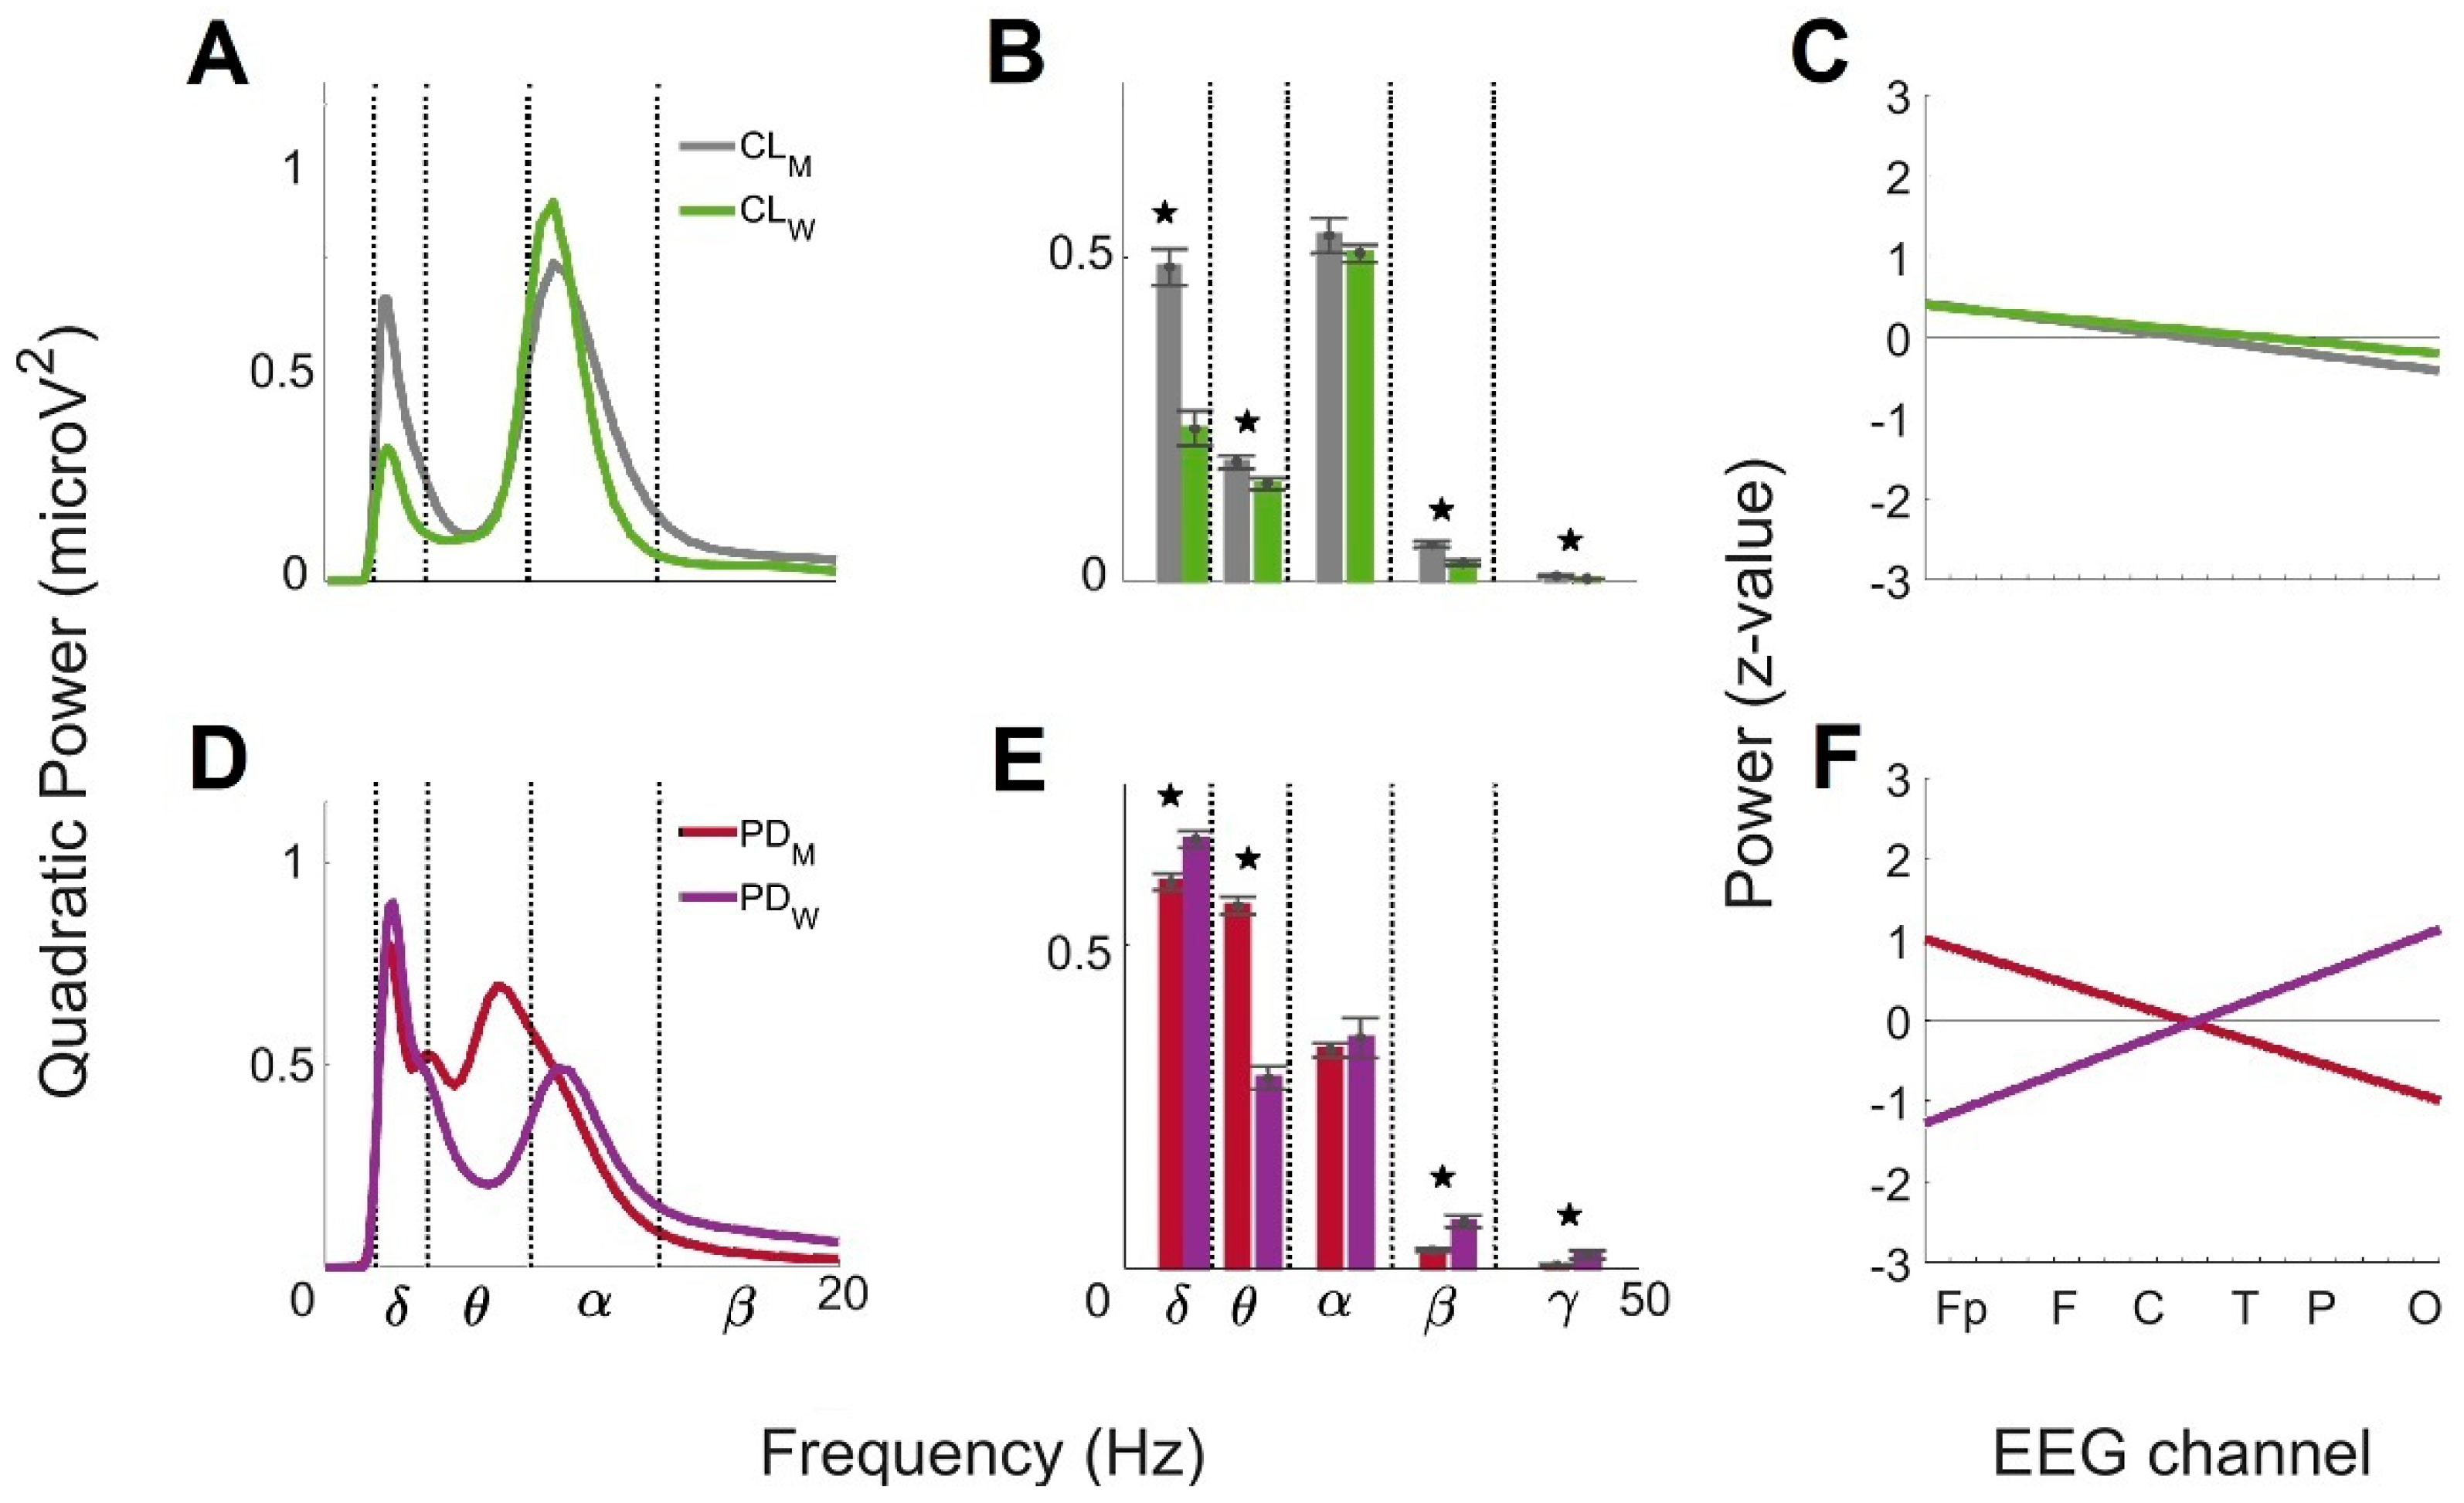
3.4. Sex Differences of the Global Wavelet Profiles from Control and with Parkinson’s Disease under 60 Years Old (<60)

Figure 5 shows the comparison of the mean global wavelet curves, the brainwave power profiles, and the anteroposterior power gradients from the CL < 60 and PD < 60 men obtained in the present study and from the CL < 60 and PD < 60 women obtained previously [23]. Figure 5A represents the comparison of the mean global wavelet curves from the CL men < 60 and CL women < 60. The Pearson’s correlation coefficient for this comparison was 0.82. The differences were related to the main frequency of the α brainwave in men (8.99 Hz), which was lower than in women (9.52 Hz), and to the power, which was higher in men (0.98 microV2) than in women (0.89 microV2). Additionally, the main frequency and power values of the δ brainwave were lower in men (2.38 Hz; 0.20 microV2) than in women (2.67 Hz; 0.39 microV2). Figure 5B shows the contrast of the brainwave powers profiles from CL men < 60 and CL women < 60. ANOVA analysis showed δ (F = 9.04, prob > F = 4.5 × 10⁻³), α (F = 89.35, prob > F = 9.5 × 10⁻¹²), β (F = 18.77, prob > F = 9.6 × 10⁻⁵), and γ (F = 12.35, prob > F = 1.1 × 10⁻³) brainwaves with significant differences. Figure 5C shows the anteroposterior power gradients from the CL men < 60 and CL women < 60. The tendency of the gradients was decreasing in both groups; however, the slope and the y-intercept were lower in men (−0.06 and 0.69 SD) than in women (−0.14 and 1.6 SD). The above revealed a rate of change larger between anterior and posterior brain regions in women than in men and a gradient for women fluctuating in a larger range (3.2 SD) than men (1.38 SD).
Figure 5D represents the comparison of the mean global wavelet curves from men with PD and women with PD < 60. The Pearson’s correlation coefficient was 0.38 for this comparison. The differences were observed in the α brainwave, where the frequency and power values were lower in men (8.48 Hz; 0.33 microV2) than in women (9.52 Hz; 0.95 microV2). Additionally, for the δ brainwave, the main frequency value in men (2.52 Hz) was lower than in women (2.67 Hz), while the power value was higher in men (0.90 microV2) than in women (0.35 microV2). Figure 5E shows the contrast of the brainwave power profiles from men with PD and women with PD < 60. According to the ANOVA analysis, four brainwaves showed significant differences: δ (F = 178.66, prob > F = 2.4 × 10⁻¹⁶), θ (F = 4.17, prob > F = 0.04), α (F = 217.89, prob > F = 8.82 × 10⁻¹⁸) and β (F = 15.46, prob > F = 3 × 10⁻⁴). Figure 5F shows the anteroposterior power gradients from men with PD and women with PD < 60. The gradients were increasing for both groups. Interestingly, the slope and the y-intercept values were nearly the same for men (0.13 and −1.4 SD) than for women (0.12 and −1.3 SD), indicating nearly the same rates of change between anterior and posterior brain regions for men and women and gradients ranging around 2.8 SD.

3.5. Sex Differences of the Global Wavelet Profiles from Control and Parkinson’s Disease Group over 60 Years Old (>60)

Figure 6 shows the comparison of the mean global wavelet curves, the brainwave power profiles, and the anteroposterior power gradient between men CL > 60 and PD > 60, and between women CL > 60 and with PD > 60 obtained previously [23]. Figure 6A represents the comparison of the mean global wavelet curves from CL men > 60 and CL women > 60. The Pearson’s correlation coefficient revealed a value of 0.87. The differences observed were associated with the power values of the α and δ brainwaves because the frequency values were the same in both groups. The power value of the α brainwave for men (0.78 microV2) was lower than for women (0.93 microV2)m, and the power value of the δ brainwave for men (0.69 microV2) was higher than for women (0.33 microV2). Figure 6B shows the contrast of the brainwave power profiles from CL men > 60 and CL women > 60. According to the ANOVA analysis, the δ (F = 41.98, prob > F = 1.00 × 10−07), θ (F = 5.93, prob > F = 0.01), β (F = 21.01, prob > F = 4.4 × 10−05) and γ (F = 7.02, prob > F = 0.01) brainwaves showed significant differences. Figure 6C are the anteroposterior power gradients from CL men > 60 and CL women > 60. The tendency of the gradients was decreasing in both groups, and the slope and y-intercept values were similar in men (−0.04 and 0.46 SD) and in women (−0.03 and 0.42 SD). These results show similar behavior in the rate of change between anterior and posterior brain regions and gradients oscillating in less than 1 SD.
Figure 6D is the comparison of the mean global wavelet curves between men with PD > 60 and women with PD > 60. The Pearson’s correlation coefficient for this comparison was 0.84. The differences were related to the switch between α brainwave activity, clearly observed for women but not for men, and θ brainwave activity, not identified for women but presents with two main frequencies for men. Figure 6E shows the brainwave powers comparison between men with PD and women with PD > 60. According to the ANOVA analysis, significant differences were observed in δ (F = 12.79, prob > F = 9 × 10⁻⁴), θ (F = 137.75, prob > F = 1.56 × 10⁻¹⁴), β (F = 22.17, prob > F = 2.9 × 10⁻⁵) and γ (F = 5.61, prob > F = 2.2 × 10⁻²) brainwaves. Figure 6F shows the anteroposterior power gradients from men with PD > 60 and women with PD > 60. The tendency of the gradients was opposite for the groups, but the slope values were similar for men (−0.10) and women (0.12). These values showed a similar rate of change between anterior and posterior brain regions, but in opposite directions. Interestingly, the y-intercept value for men (1.1 SD) was lower than for women (−1.4 SD) so that the gradient for men oscillated around 2.2 SD, and for women, around 2.8 SD.
A summary of the results described in this study are shown in Table 1 for men and in Table 2 for women.

4. Discussion

The CWA offered detailed information about the brain activity in frequency, time, and power domains when the five brainwaves were analyzed simultaneously, revealing the influence of one wave over the other. We observed, in an eyes-closed resting state, clear differences between groups (CL and with PD): (1) differences between CL and PD men groups < 60 years old; (2) differences between CL and PD men groups > 60 years old; (3) sex-related differences between CL and PD groups < 60 years old; and (4) sex-related differences between CL and PD groups > 60 years old.

4.1. Differences between Men with PD and CL Groups at Age < 60

Significant differences in frequency, dispersion and power occur in α and δ brainwaves with PD. A decrement in the frequency and power of the α brainwave and an increment in δ brainwaves per channel were also reported for PD groups using the AR Burg method and the wavelet packet entropy method [30]. In our study, we additionally observe details in frequency and power dispersion within α and δ brainwaves. In the CL group, low α frequencies were identified in the main frequencies profile of the left anterior region. The power for all α frequencies was high and had similar dispersion in the global wavelet curves profile. The above indicates that the differential frequency values of the α brainwaves in this group do not modify their contribution in the signals; however, it can reveal differential brain function in the frontal lobe associated with structural and physiological changes related to normal aging. Previous studies have shown alterations in the frontal lobe with aging associated with decreases in cognitive processes and alterations in the language areas from the left hemisphere [31,32]. For the PD group, the global wavelet curves profile showed heterogenicity in frequency and power dispersion for the α brainwave, detailing not only decrements in power, but also remarkable changes in the brain activity, mainly in the anterior regions. A high dispersion in the α brainwaves was also observed in women with PD using CWA [23], and it was related to an alteration in the neuronal membrane properties, whose normal activity oscillates in these frequencies, and in a loss of intracortical synchronization of the pyramidal cells inside the brain circuitry [33,34]. For the δ brainwave, interestingly, the power dispersion does not change with the increase in power due to the disease, and the brain activity oscillated mainly in a frequency value (2.38 Hz). Similar features were first identified in women’s EEG data, in the CL and with PD, using CWA [23]. The increment of the δ brainwaves in PD has been associated with reduced cholinergic input from the nucleus basalis that communicates the basal forebrain and the cortex [35]. In PD, this structure undergoes neuronal loss resulting in cognitive function deficits [36]. The decrement in power we observed in the β brainwaves in the PD groups has been previously reported and is associated with neuronal uncoupling within the cortical layers throughout the brain lobes [30,33,37]. The decrement in power of the γ brainwaves in the PD groups has been reported previously in EEG analyzed by CWA in women with PD [23]. The γ brainwave in PD was reported to have an increment in power when recorded from the subthalamic nucleus; however, these results do not contrast with our results, but they offer information about the γ brainwave (from 30 to 50 Hz) in the cortical activity of PD [38]. The decrement in the γ brainwaves we observed could be related to an impairment in the dopaminergic system. The dopaminergic ventral tegmental area fibers that reach the cortex are deteriorated in PD, which has been related to non-motor symptoms such as depression, anxiety, and executive functions [33,39]. The low powers in the θ brainwaves observed in both the CL and PD groups was expected since it is a characteristic of an eyes-closed resting state. The hippocampus, entorhinal cortex, and the related cortical projections are associated with the θ brainwave. These structures are linked to functions such as memory and spatial navigation and are notably not altered in the early stages of PD in men [40]. The anteroposterior power gradient increases in PD, which reflects a lower power of frontal channels opposite to the high power of frontal channels seen in the CL group. A deficit in frontal executive abilities, such as attention, reported in men with PD may be associated with the decrement in the anteroposterior power gradient observed in this study, also present in women with PD [8,23]. The differences in the rate of change of the anteroposterior power gradient (slope) and the power dispersion (higher in men with PD) could be reflected in the progression from non-motor to motor symptoms, which characterizes the disease. The anteroposterior change rates observed in men with PD can be a result of impairments involving the dopaminergic, cholinergic, serotonergic, glutamatergic, and GABAergic systems, which modify the horizontal neural communication across the cortical layers and the vertical neural communication with deeper structures [41].

4.2. Differences between Men with PD and CL Groups at Age > 60

We observed an increase in δ brainwaves in the CL group, as previously described in normal aging from standard EEG [42]. In the main frequencies profile, δ frequency values also occur in frontal regions, possibly related to major physiological changes with aging [31]. This group was on average one decade older than the CL < 60 group, and we could identify changes in the frequency values of their brain activity. Additionally, we found details of the δ increase in the global wavelet curves profile, where the increase in power was 3 times more when compared to the CL < 60 group. In this profile, the anterior regions (Fp, F and C) increased their power more so than the posterior channels, corresponding to the change from the α to δ brainwave observed in the anterior regions of the main frequencies profile. For the α brainwave, we observed a decrease in power as a function of age, as was previously described using a predetermined toolbox of the EEGLAB software [43]. The CWA shows that this decrease corresponds to 1.2 times less power and identified an increase in the dispersion of frequencies and power in the α brainwave. The α brainwave destabilization in PD > 60 was associated with alterations in the thalamus or thalamus-cortical circuits due aging in the frontal regions, considered as generators of this brainwave [44], caused by aging mainly in the frontal regions [45]. The Fp channel’s power fell ≈ 1 SD below average, while the O channels were not modified. Although the δ and θ brainwaves were detected as the most relevant in the main frequencies profile of the PD > 60 group, the α brainwave power increased 1.5 times with aging and PD progression, possibly due to the continuous use of Levodopa, since there is evidence that Levodopa enhances α brainwave power in central, temporal, and parietal EEG channels [46]. It is interesting to note that the α brainwave’s main frequency was lost from the mean global wavelet curve, a characteristic that has been related to the progression of PD and to cortical pyramidal cell and circuitry alterations [33,34], hence, the increment in θ brainwave power observed in the mean global wavelet curve in PD > 60. The θ brainwave and the θ frequency increase (considered as pathological θ) in the main frequencies profile were related to changes in PD cortical brain activity, resulting in cognition, memory and spatial navigation disorders described using intracranial EEG [39]. Although the θ brainwave is not expected in an EEG obtained with an eyes-closed resting state, as has been previously reported [47], using CWA θ brainwave data was clearly observed.
Statistically significant differences in β brainwave power were observed in both the CL and PD groups. The β power in CL > 60 was decreased when compared to CL < 60. Age-related changes in the β brainwave at rest have not been previously reported. In this research, we observed the decrement in β power and associated it with changes in attentional and motor functions (movement preparation and execution) caused by control aging [42,48]. The detailed β brainwave information in an eyes-closed resting state obtained in this study was possible since the CWA simultaneously evaluates information contained in the five brainwaves. Regarding the γ brainwave, no differences in power were found with aging in the PD group; however, in the CL groups, there was a decrease in γ power with age. This decrement is associated with normal aging, as has been described [49]. The anteroposterior power gradients in CL and PD > 60 decreased in both cases; however, the highest rate of change (slope) and the highest range of power dispersion between anterior and posterior regions were found in men with PD. It is also important to consider that the tendency of the power gradient from PD > 60 is generated with the high power of the θ brainwave, characteristic of the disease [39]. For CL, the power gradient is generated with the high power of the α brainwave, characteristic of the eyes-closed resting state in control participants [47].

4.3. Sex-Related Differences between Control and PD Groups < 60

The mean global wavelet curves in the CL groups for both sexes showed major brain activity in the α and δ brainwaves. In another study, the α brainwave in middle-aged people was dominant [50]. The balance between α and δ brainwaves obtained by the CWA in an eyes-closed resting state in both groups was related to functional communication from cortical cells and their projections to structures of the middle brain, mainly through the thalamo-cortical circuits and the cholinergic ways, which are considered as generators of both oscillations [33,35]. In the simultaneous five brainwave analysis, we observed higher power for α, β, and γ brainwaves and lower power for δ brainwaves in men compared to women. For θ2 frequencies (6–8 Hz) and higher (α1, α2, β1, and β2 brainwaves), our observations were opposite to the ones reported previously [51], but for θ1 frequencies (4 −6 Hz) and lower (δ brainwave), we obtained the same results. The dissimilar results compared to previous research can be associated with differences in the age range analyzed. In our study, we considered EEG data from CL between 40 and 60 years of age (groups < 60), while a wider age range (from 20 to 70 years old) was analyzed in previous research [52]. Differences in brain activity by age must be considered [43]. These changes can be observed in the global wavelet curves of male and female groups [23], where under the same physiological state, the contribution per region of each brainwave is different. The δ power contribution in men is similar for the 21 channels, but the δ power contribution in women is higher for anterior and central channels than for posterior channels, resulting in a higher power for δ brainwave in women.
Regarding the γ brainwave, there was no equivalent analysis to compare our observations since it is not generally detected in an eyes-closed resting state in either CL or PD in quantified electroencephalography. Decreasing anteroposterior power gradients observed in CL men and women < 60 showed a rate change and range of dispersion to be higher in women, suggesting greater differences between anterior and posterior brain activity. Although we do not find studies to compare each one of the gradients we obtained, our results confirm previous observations regarding differences in power between brain regions [53].
The variability of symptoms previously described for men and women with PD < 60 can be related to the variability in brainwave impairment with the disease [6]. Our results for PD show that the main brainwave in women is α, as in CL women, while in PD men, δ is the main brainwave. The presence of low frequencies in the brain activity of men with PD is related to an earlier onset of motor symptoms and the presence of characteristic non-motor symptoms [6]. The conserved brain activity in women, as well as the increase in α brainwave power, are signs of less functional damage in the cortical layers and thalamic structures linked to motor pathways [33]. In addition, Levodopa has been reported to affect the α brainwave, which must be considered because all the PD groups in this study were under Levodopa medication [46]. Interestingly, the increase in the anteroposterior power gradients observed in the PD groups had equal slope and y-intercepts in men and women. This last feature must be carefully interpreted because it only states that the lowest powers of anterior regions (Fp and F channels) change with an equivalent rate and similar power range in relation to the highest power of the posterior regions (O channels). However, central, temporal, and parietal channels are not detailed, and they can a have similar or contrary power inside the groups. In this regard, men have lower power than women in the temporal and parietal channels [23]. Conversely, PD women had an increasing anteroposterior gradient, contrary to CL women. This reveals that PD women are affected in a different way when compared to men. Also, we observed the highest power for the θ brainwave in women, which is mainly related to mood disturbances (non-motor symptoms of the PD), seen in early stages of PD [6].

4.4. Sex-Related Differences between Controls and PD Groups > 60

In the older CL groups, the brain activity remains mostly in the α and δ brainwaves, but the changes related to age were confirmed mainly by the increase in δ brainwaves in the CL men. The dominant brainwave for these groups > 60 was α, as it was previously observed for an elderly group [47]. Sex differences showed higher values of power for men in the δ, θ, and β brainwaves, while the α brainwave shows no statistically significant differences. Our observations of δ brainwaves were consistent with the previously described for an elderly group, where higher power among men was observed [48]. Compared to the CL < 60 groups one decade later, we observed for the δ, θ and α brainwave new power dynamics in CL > 60, which can be associated with new changes in the brain structures associated with aging [53], mainly in the thalamus, the thalamo-cortical circuits and the hippocampus, regions considered as generators of these frequency bands [33].
For CL > 60 groups, the power for α2 showed results similar to those in previous studies; however, for the other brainwaves, the differences by sex were inverted [52]. These differences can be attributed to the procedure used to obtain the power information of the EEG channels. In this study, data acquisition was conducted with a monopolar montage instead of a bipolar montage [47,52].
In both men and women with PD > 60, a similar decreasing anteroposterior power gradient was present, suggesting that the rate of change and dispersion range are comparable. The most relevant changes were identified in the anteroposterior power gradient of women when it was compared to CL < 60. This could be attributed to physiological changes in the frontal area, such as cognitive dysfunction [31], and in the occipital area, such as alterations in the primary visual cortex [54] associated with aging.
Interestingly, the global wavelet curve of PD women > 60 was similar for PD men < 60, suggesting that abnormalities in the brain activity observed in men in the early stages of the disease correlate with the advanced stages of the disease in women > 60 with the corresponding delay of symptoms [6]. The increment in θ power and the decrement in α power observed confirm the severity of the non-motor symptoms, which correlates with the clinical differentiation outcome by sex [6,33]. In the case of men with PD > 60, we observed a new morphology in the global wavelet curve not seen in women, showing the progress and severity of motor and non-motor symptoms in men. The increase in θ brainwave power and the decrement in the power of higher brainwaves modifies the direction of the anteroposterior gradient, which might express a new functional relationship between anterior and posterior brain regions.

4.5. Comparison of Different Intelligent Algorithms in EEG Analysis

In this section, we conducted a comprehensive comparison of intelligent algorithms to analyze EEG. The primary aim was to identify the most optimal method that could effectively extract new information from the data and improve our understanding about brain activity, as well as to select the most appropriate algorithm for different research questions and clinical applications [55,56,57,58]. The algorithms under scrutiny included the independent components analysis (ICA), the WT algorithm, the inverse WT, and the machine learning/deep learning (ML/DL) approaches. Each algorithm possessed distinct characteristics that make them well-suited for specific aspects of EEG analysis. The comparison was a vital step in advancing our knowledge of brain activity because we gain insights into their strengths and limitations.

4.5.1. Comparison between ICA and the Inverse WT in EEG Analysis

ICA is a technique used to eliminate artifacts from the EEG, ensuring a cleaner and more reliable signal. It separates the mixed EEG in independent components, allowing the identification and elimination of unwanted noise and interference. Following the application of ICA, the EEG undergoes further preprocessing steps to enhance the quality of the signals [55,56].
The inverse WT reconstructed the signal employing an elliptic band-pass filter to attenuate any residual noise and interference, optimizing the removal of internal or external artifacts and noise from the EEG. The utilization of the inverse WT as a robust method played a pivotal role in enhancing the accuracy of our findings, ensuring the elimination of all non-relevant signals and preserving only the pertinent frequency bands. This filtering process selectively preserves the frequency bands of interest while efficiently removing any unwanted frequencies that might obscure the brain signals to analyze [28].
The integration of the inverse WT in EEG analysis allowed us to obtain a refined and more representative signal of the targeted brain activity, enhancing the overall quality and reliability of the data analyzed in the study. By effectively filtering out unwanted components, we focused on identifying and extracting essential biomarkers related to specific brain functions or pathologies. Robust preprocessing steps were essential to achieve accurate and reliable results in our investigation, enhancing not only the scientific rigor of our study, but also paving the way for broader applications, ranging from clinical neurology to educational neuroscience.

4.5.2. Comparison between ML/DL and Wavelet Algorithms in EEG Analysis

Advancements in medical and clinical analysis have integrated artificial intelligence (AI) models like Machine Learning (ML) and Deep Learning (DL) algorithms. Both, being probabilistic in nature, offer a powerful tool for pattern recognition and classification tasks. ML/DL can identify subtle patterns and complex relationships in the EEG, enabling the detection of abnormalities or specific brain signatures associated with certain neurological conditions. Nevertheless, a prevailing challenge with many AI models lies in their characterization as “black boxes”, signifying the lack of transparency and interpretability in their decision-making processes [57,58,59,60,61,62]. Consequently, users, particularly healthcare professionals, face difficulties in comprehending and rationalizing the outcomes generated by these models, impeding their integration into clinical practice.
Conversely, the intelligent WT algorithm emerges as a promising alternative in the realm of EEG analysis. Unlike AI models, where outcomes primarily rely on probabilistic predictions, the WT approach uncovers intrinsic patterns within EEG. Through spectral analysis, the WT algorithm decomposes EEG into distinct frequency components, revealing specific brain activity patterns associated with various neurological phenomena. These patterns provide essential insights into brain dynamics and function, facilitating a comprehensive understanding of neural activities in both health and disease [63,64,65,66,67,68,69]. The inherent interpretability of WT results confers significant advantages in the clinical context, where accurate and transparent diagnoses are pivotal. Healthcare professionals can confidently rely on the WT outcomes, as they furnish explicit information about the brain electrical activity, enhancing the reliability and informed decision-making in patient care.
Furthermore, the transparent nature of the WT algorithm renders it a valuable educational tool. Its interpretable results aid in effectively teaching and training medical students, neuroscientists, and researchers. By facilitating the visualization and explication of brain signals, the WT approach fosters a deeper comprehension of neurophysiology and brain function [65].

5. Conclusions

Quantified electroencephalography by standard spectral analyses has provided novel information about brain activity in both health and disease. The CWA showed advantages to uncovering information inside of an EEG through the simultaneous analysis of the five brainwaves and identifying the influence between them. This information is observed in the global wavelet spectra, where the values of frequency and power with respect to time are shown. To conserve the information of the simultaneous five brainwaves, it is important to avoid continuous filtering processes or segmentation in the frequency of the EEG, which occurs when the brainwaves are individually analyzed. Also, it is very relevant to mention that we could eliminate physiological and external artifacts in the EEG initially with the iCWT and later with the XWT. The frequency and power information for the brainwaves obtained by other spectral analyses represents sections of physiological states and does not consider continuous activity. In this research, we applied the CWA to uncover temporal information of a standard EEG and identify the differences or similarities between pathophysiological states, sex, or age. The method showed well-defined changes in frequency, dispersion, and power gradients for men with PD as well as for the CL age-matched group, mainly characterized by decrements of α and increments of δ brainwaves. The progress of PD associated with aging demonstrated an increment in the θ brainwave in men with PD at an older age. Comparative analysis of an EEG from men with PD and women with PD as well as with their respective CL age-matched groups provides evidence that men with PD < 60 had drastic changes in the global wavelet profile when compared to women with PD < 60 who have less symptoms at the same age. Our results confirm sex-related differential abnormalities in the brain activity of PD, which could be clinically related to the presence of earlier motor symptoms presented in men. The CWA of the EEG in women with PD > 60 showed global wavelet profiles similar to men with PD < 60, indicating a potential delay in the progress of motor symptoms observed clinically in women. The observations we obtained in this study are complementary to the age-related study of women with PD. In both, we highlight the benefits offered by the CWA applied to quantitative electroencephalography. Brainwave characterization with this method can reveal brain activity impairments in the early stages of neurodegenerative processes.
Finally, it is important to mention that the findings of this study also contribute to the advancement of EEG analysis methods, leading to more accurate and reliable results, significantly impacting the clinical diagnosis, treatment, and monitoring of neurological disorders. The identification of relevant biomarkers through this sophisticated methodology holds significant promise for future clinical analyses, contributing to the development of more targeted and effective diagnostic and therapeutic approaches in the field of neuroscience. The disadvantage of the CWA is that it is a less understood and applied method in EEG or biomedical timeseries, which requires great knowledge of signal theory and spectral analysis. Hence, currently, it is not applied in the biomedical area.

Author Contributions

G.G.-G.: conceptualization, methodology, formal analysis, data curation, writing original draft. V.M.V.H.: conceptualization, methodology, formal analysis, validation. A.O.-A.: conceptualization, formal analysis, writing-review and editing, supervision, project administration. All authors have read and agreed to the published version of the manuscript.

Funding

Gabriela González-González is a doctoral student from the Programa de Doctorado en Ciencias Biomédicas, Universidad Nacional Autónoma de México (UNAM) and has received a CONACyT fellowship CVU771755. This study was partially supported by grants DGAPA-IN215123 (A.O.A) and DGAPA-IT102410 (V.M.V.-H.) (Dirección General del Personal Académico, Universidad Nacional Autónoma de México (UNAM)).

Institutional Review Board Statement

This article is a retrospective study based on previously conducted EEGs and does not involve any new EEG data from human or animal subjects obtained by any of the authors. Data analysis was authorized by the Research and Ethical Committee of the Research Division, Faculty of Medicine, National Autonomous University of Mexico under number 018/2023.

Informed Consent Statement

Not applicable.

Data Availability Statement

Mathematical data details are available upon request from the authors.

Acknowledgments

We thank Rodolfo Solis for providing the EEG obtained from the Instituto Nacional de Neurología y Neurocirugía, Mexico (INNN), and Alina Santillán from the Faculty of Electronics, UPAEP, Mexico, for her contribution of EEGs to further validate patterns from control individuals. Finally, we thank Dan López Vazquez for productive discussions, the Thematic Network: Proteínas, Priones y Enfermedades Nurodegenerativas—Consejo Nacional de Ciencia y Tecnología (PRyEND-CONACyT-280087) network member (A.O.A.), and Ibrahim A. Ramirez-Soto for proofreading the manuscript.

Conflicts of Interest

The authors declare that they have no competing interest.

List of Abbreviations

PDParkinson’s Disease
EEGElectroencephalographic records
FpFrontopolar
FFrontal
TTemporal
CCentral
PParietal
OOccipital
CWTContinuous Wavelet Transform
XWTCross Wavelet Transform
PWSPower Wavelet Spectrum
GWSGlobal Wavelet Spectrum

Appendix A. Covariance Wavelet Analysis

The Covariance Wavelet Analysis (CWA) constitutes a valuable method based on the Wavelet Transform (WT) specifically designed for the analysis of non-linear, spatially non-homogeneous, and non-stationary power timeseries, for example EEG data. This transformative technique operates within the time–frequency space through a multi-resolution analysis, as documented in previous studies [70,71,72]. The Wavelet Transform (WT) harnesses elementary wavelet functions, also known as mother functions, distinguished by their temporal (t) and frequency (ω) characteristics, enabling the extraction of localized features of the signal in both time and frequency domains. Among the mother wavelet functions, the complex Morlet function emerges as an optimal choice for the analysis of biomedical data, given its commendable balance between temporal localization and frequency resolution. Moreover, its remarkable power resolution further accentuates its suitability for such applications [72,73]. The complex Morlet mother wavelet function (ψ) exhibits its capacity to faithfully reconstruct the signal or focus on a particular frequency band, underscoring its versatility and efficiency in capturing the pertinent attributes of the data.
ψ(η) = π−1/4eiω0 ηe−1/2η2
By leveraging the Covariance Wavelet Analysis (CWA) based on the complex Morlet mother wavelet function, researchers can adeptly investigate complex EEG data, enabling the exploration of subtle yet crucial temporal and spectral patterns inherent in such neurophysiological signals.
The Covariance Wavelet Analysis (CWA) is based on the Continuous Wavelet Transform (CWT), defined as the convolution between the timeseries and the mother function, which performs a multi-resolution analysis, scaling and translating it in time and frequency with flexible resolution [73]. The CWT is normalized to have a power unit and is expressed as follows:
W n X s = δ t s n 1 N x n ψ 0 n n δ t s
where xn is the timeseries, ψ0 is the Morlet function, N is the number of points, s is the wavelet scale, and n is the localized time index [27]. The power of the CWT is given by
| W n X ( s ) | 2
The Cross Wavelet Transform (XWT) analyzes the covariance of two time series using the information from the CWT. It measures time–frequency areas with high common powers [27]. Given two time series, X and Y, with their respective CWTs, WX (s) and WY (s), the XWT is defined as
W X Y s = W X s W Y * ( s )
where W Y * ( s ) is the complex conjugate of W Y ( s ) [27].
The power of the XWT is defined as
W n X Y ( s ) 2
The Covariance Wavelet Analysis (CWA) generalizes the XWT to analyze n > 2 timeseries and is used to identify local symmetries and study inter-relations in multiple time series [29,74]. The CWA is based on the Einstein’s cross-function [75], defined as
M(∆) = ⟨x(t)y(t + ∆)〉
where x(t) and y(t) are timeseries, and ∆ denotes delayed time.
To build the CWA, WT is applied to the Einstein’s cross-function with ∆ = 0, and the Hadamard product (⨂) for matrices uxv is invoked [27,29], as shown in the following equation:
W(Mxy) = ⟨Wxy(t, s)[t, s] = ⟨Wx(t, s) ⊗ Wy (t, s)⟩[t, s]
To evaluate n > 2 time series, we consider Wx(t, s) and W y (t, s) as the matrices XXT whose elements are given by
M = X X T = x 1 ( t ) x 1 ( t ) x 1 ( t ) x 2 ( t ) x 1 ( t ) x n ( t ) x 2 ( t ) x 1 ( t ) x 2 ( t ) x 2 ( t ) x 2 ( t ) x n ( t ) x n ( t ) x 1 ( t ) x n ( t ) x 2 ( t ) x n ( t ) x n ( t )
where ⟨xixj⟩ = ⟨xi(t)xj(t)⟩.
Applying the Continuous Wavelet Transform (CWT) to each element of the matrices X and XT, we obtain the multiple cross-wavelet spectrum Ω as follows:
Ω = ⟨W[X] ⊗ W[XT]⟩[t, s]
where
Ω = W [ x 1 ( t ) ] W [ x 1 ( t ) ] W [ x 1 t ] W [ x 2 ( t ) ] W [ x 2 ( t ) ] W [ x 2 ( t ) ] W [ x n ( t ) ] W [ x n t ] W [ x n t ] [ t , s ] W [ x 1 * ( t ) ] W [ x 2 * ( t ) ] W [ x n * t ] W [ x 1 * ( t ) ] W [ x 2 * ( t ) ] W [ x n * ( t ) ] W [ x 1 * ( t ) ] W [ x 2 * ( t ) ] W [ x n * t ] [ t , s ] = W 11 W 12 W 1 n W 21 W 22 W 2 n W n 1 W n 2 W n n [ t , s ] = W 11 [ t , s ] W 12 [ t , s ] W 1 n [ t , s ] W 21 [ t , s ] W 22 [ t , s ] W 2 n [ t , s ] W n 1 [ t , s ] W n 2 [ t , s ] W n n [ t , s ]
Each element Wij of the multiple cross-wavelet spectrum is a Cross Wavelet Trans-form (XWT). The symbol (*) indicates the complex conjugated form of the wavelet coefficients.
Finally, the Covariance Wavelet Analysis (CWA) is defined by considering the elements of Ω above the main diagonal, resulting in a partial matrix denoted as Ωpartial. This partial matrix expresses the shared features between the n elements of a group of signals n > 2 [29]:
Ω p a r c i a l = 1 W 12 [ t , s ] W 1 n [ t , s ] W 21 [ t , s ] 1 W 2 n [ t , s ] W n 1 [ t , s ] W n 2 [ t , s ] 1

References

  1. Maserejian, N.; Vinikoor-Imler, L.; Dilley, A. Estimation of the 2020 Global Population of Parkinson’s Disease (PD). In Proceedings of the MDS Virtual Congress 2020, Virtual, 12–16 September 2020; Volume 35. Available online: https://www.mdsabstracts.org/abstract/estimation-of-the-2020-global-population-of-parkinsons-disease-pd/ (accessed on 14 March 2023).
  2. Phillipson, O.T. Management of the aging risk factor for Parkinson’s disease. Neurobiol. Aging 2014, 35, 847–857. [Google Scholar] [CrossRef] [PubMed]
  3. Reeve, A.; Simcox, E.; Turnbull, D. Ageing and Parkinson’s disease: Why is advancing age the biggest risk factor? Ageing Res. Rev. 2014, 14, 19–30. [Google Scholar] [CrossRef] [PubMed]
  4. World Health Organization. Ageing and Health. 2021. Available online: https://www.who.int/news-room/fact-sheets/detail/ageing-and-health. (accessed on 23 January 2023).
  5. Orozco, J.L.; Valderrama-Chaparro, J.A.; Pinilla-Monsalve, G.D.; Molina-Echeverry, M.I.; Pérez Castaño, A.M.; Ariza-Araújo, Y.; Prada, S.I.; Takeuchi, Y. Parkinson’s disease prevalence, age distribution and staging in Colombia. Neurol. Int. 2020, 12, 8401. [Google Scholar] [CrossRef]
  6. Cerri, S.; Mus, L.; Blandini, F. Parkinson’s Disease in Women and Men: What’s the difference? J. Park. Dis. 2019, 9, 501–515. [Google Scholar] [CrossRef] [PubMed]
  7. Bloem, B.; Okun, M.; Klein, C. Parkinson’s disease. Lancet 2021, 397, 2284–2303. [Google Scholar] [CrossRef] [PubMed]
  8. Reekes, T.H.; Higginson, C.I.; Ledbetter, C.R.; Sathivadivel, N.; Zweig, R.M.; Disbrow, E.A. Sex specific cognitive differences in Parkinson disease. NPJ Park. Dis. 2020, 6, 7. [Google Scholar] [CrossRef]
  9. Kalia, L.V.; Lang, A.E. Parkinson’s disease. Lancet 2015, 386, 896–912. [Google Scholar] [CrossRef] [PubMed]
  10. Braak, H.; Sastre, M.; Del Tredici, K. Development of α- Synuclein immunoreactive astrocytes in the forebrain parallels stages of intraneuronal pathology in sporadic Parkinson’s disease. Acta Neuropathol. 2007, 114, 231–241. [Google Scholar] [CrossRef]
  11. Askanas, V.; Engel, W.K.; Alvarez, R.B.; McFerrin, J.; Broccolini, A. Novel immunolocalization of α- Synuclein in human muscle of inclusion-body myositis, regenerating and necrotic muscle fibers, and at neuromuscular junctions. J. Neuropathol. Exp. Neurol. 2000, 59, 592–598. [Google Scholar] [CrossRef]
  12. Ramirez-Soto, R.; Ortega-Aguilar, A. Skeletal Muscle is a Source of α-Synuclein with a Sarcolemmal Non-Lipid Raft Distribution. Cell Physiol. Biochem. 2022, 56, 382–400. [Google Scholar]
  13. Tian, C.; Liu, G.; Gao, L.; Soltys, D.; Pan, C.; Stewart, T.; Shi, M.; Xie, Z.; Liu, N.; Feng, T.; et al. Erythrocytic α- Synuclein as a potential biomarker for Parkinson’s disease. Transl. Neurodegener. 2019, 8, 15. [Google Scholar] [CrossRef] [PubMed]
  14. Peelaerts, W.; Bousset, L.; Van der Perren, A.; Moskalyuk, A.; Pulizzi, R.; Giugliano, M.; Van den Haute, C.; Melki, R.; Baekelandt, V. Synuclein strains cause distinct synucleinopathies after local and systemic administration. Nature 2015, 522, 340–344. [Google Scholar] [CrossRef] [PubMed]
  15. Teravskis, P.J.; Covelo, A.; Miller, E.C.; Singh, B.; Martell-Martínez, H.A.; Benneyworth, M.A.; Gallardo, C.; Oxnard, B.R.; Araque, A.; Lee, M.K.; et al. A53T mutant alpha-synuclein induces Tau-dependent postsynaptic impairment independently of neurodegenerative changes. J. Neurosci. 2018, 38, 9754–9767. [Google Scholar] [CrossRef] [PubMed]
  16. Gallagher, D.A.; Lees, A.J.; Schrag, A. What are the most important nonmotor symptoms in patients with Parkinson’s disease and are we missing them? Mov. Disord. 2010, 25, 2493–2500. [Google Scholar] [CrossRef] [PubMed]
  17. Brooks, D.J.; Pavese, N. Imaging biomarkers in Parkinson’s disease. Prog. Neurobiol. 2011, 95, 614–628. [Google Scholar] [CrossRef] [PubMed]
  18. NICE. National Institute for Health and Care Excellence Guideline. In Parkinson’s Disease in Adults; NICE: Manchester, UK, 2020. [Google Scholar]
  19. Secretaría de Salud. Diagnóstico y Tratamiento de la Enfermedad de Parkinson Inicial y Avanzada en el Tercer Nivel de Atención; Secretaría de Salud: Mexico City, Mexico, 2010. [Google Scholar]
  20. DeLong, M.R.; Wichmann, T. Circuits, and circuit disorders of the basal ganglia. Arch. Neurol. 2007, 64, 20–24. [Google Scholar] [CrossRef] [PubMed]
  21. Cozac, V.V.; Gschwandtner, U.; Hatz, F.; Hardmeier, M.; Rüegg, S.; Fuhr, P. Quantitative EEG and cognitive decline in Parkinson’s disease. Park. Dis. 2016, 2016, 9060649. [Google Scholar] [CrossRef] [PubMed]
  22. Shirahige, L.; Berenguer-Rocha, M.; Mendonça, S.; Rocha, S.; Rodrigues, M.C.; Monte-Silva, K. Quantitative electroencephalography characteristics for Parkinson’s disease: A systematic review. J. Park. Dis. 2020, 10, 455–470. [Google Scholar] [CrossRef]
  23. González-González, G.; Velasco-Herrera, V.M.; Ortega-Aguilar, A. Use of Covariance Analysis in Electroencephalogram Reveals Abnormalities in Parkinson’s Disease. Appl. Sci. 2021, 11, 9633. [Google Scholar] [CrossRef]
  24. Iwaki, H.; Nishikawa, N.; Nagai, M.; Tsujii, T.; Yabe, H.; Kubo, M.; Ieiri, I.; Nomoto, M. Pharmacokinetics of levodopa/benserazide versus levodopa/carbidopa in healthy subjects and patients with Parkinson’s disease. Neurol. Clin. Neurosci. 2015, 3, 68–73. [Google Scholar] [CrossRef]
  25. Stathis, P.; Konitsiotis, S.; Antonini, A. Dopamine agonists early monotherapy for the delay of development of levodopa-induced dyskinesias. Expert. Rev. Neurother. 2015, 15, 207–213. [Google Scholar] [CrossRef] [PubMed]
  26. Rascol, O.; Fitzer-Attas, C.J.; Hauser, R.; Jankovic, J.; Lang, A.; Langston, J.W.; Melamed, E.; Poewe, W.; Stocchi, F.; Tolosa, E.; et al. A double-blind, delayed-start trial of rasagiline in Parkinson’s disease (the ADAGIO study): Prespecified and post-hoc analyses of the need for additional therapies, changes in UPDRS scores, and non-motor outcomes. Lancet Neurol. 2011, 10, 415–423. [Google Scholar] [CrossRef] [PubMed]
  27. Torrence, C.; Compo, G.P. A practical guide to wavelet analysis. Bull. Am. Meteorol. Soc. 1998, 79, 61–78. [Google Scholar] [CrossRef]
  28. Postnikov, E.B.; Lebedeva, E.A.; Lavrova, A.I. Computational implementation of the inverse continuous wavelet transform without a requirement of the admissibility condition. Appl. Math. Comput. 2016, 282, 128–136. [Google Scholar] [CrossRef]
  29. Velasco, V.M.; Soon, W.; Velasco, G.; Traversi, R.; Horiuchi, K. Generalization of the cross-wavelet function. New Astron. 2017, 56, 86–93. [Google Scholar] [CrossRef]
  30. Han, C.X.; Wang, J.; Yi, G.S.; Che, Y.Q. Investigation of EEG abnormalities in the early stage of Parkinson’s disease. Cogn. Neurodyn. 2013, 7, 351–359. [Google Scholar] [CrossRef] [PubMed]
  31. Zanto, T.P.; Gazzaley, A. Aging of the frontal lobe. In Handbook of Clinical Neurology; Elsevier: Amsterdam, The Netherlands, 2019; Volume 163, pp. 369–389. [Google Scholar]
  32. Rotte, M. Age-related differences in the areas of Broca and Wernicke using functional magnetic resonance imaging. Age Ageing 2005, 34, 609–613. [Google Scholar] [CrossRef]
  33. Lopes da Silva, F.H. Neural mechanisms underlying brain waves: From neural mechanisms to networks. Electroencephalogr. Clin. Neurophysiol. 1991, 79, 81–93. [Google Scholar] [CrossRef]
  34. Bollimunta, A.; Chen, Y.; Schroeder, C.; Ding, M. Mechanisms of cortical alpha oscillations in awake-behaving macaques. J. Neurosci. 2008, 28, 9976–9988. [Google Scholar] [CrossRef]
  35. Buzsaki, G.; Bickford, R.; Ponomareff, G.; Thal, L.; Mandel, R.; Gage, F. Nucleus basalis and Thalamic Control of Neocortical Activity in the Freely Moving Rat. J. Neurosci. 1988, 8, 4007–4026. [Google Scholar] [CrossRef]
  36. Liu, A.K.L.; Chang, R.C.C.; Pearce, R.K.B.; Gentleman, S.M. Nucleus basalis of Meynert revisited: Anatomy, history and differential involvement in Alzheimer’s and Parkinson’s disease. Acta Neuropathol. 2015, 129, 527–540. [Google Scholar] [CrossRef] [PubMed]
  37. Stanzione, P.; Marciani, M.G.; Maschio, M.; Bassetti, M.A.; Spanedda, F.; Pierantozzi, M.; Semprini, R.; Bernardi, G. Quantitative EEG changes in non-demented Pakinson’s disease patients before and during L-dopa therapy. Eur. J. Neurol. 1996, 3, 354–362. [Google Scholar] [CrossRef]
  38. Weinberger, M.; Hutchison, W.D.; Lozano, A.M.; Hodaie, M.; Dostrovsky, J.O. Increased gamma oscillatory activity in the subthalamic nucleus during tremor in Parkinson’s disease patients. J. Neurophysiol. 2009, 101, 789–802. [Google Scholar] [CrossRef] [PubMed]
  39. Alberico, S.L.; Cassell, M.D.; Narayanan, N.S. The Vulnerable Ventral Tegmental Area in Parkinson’s Disease. Basal Ganglia 2015, 5, 51–55. [Google Scholar] [CrossRef] [PubMed]
  40. Zhang, H.; Jacobs, J. Traveling Theta Waves in the Human Hippocampus. J. Neurosci. 2015, 35, 12477–12487. [Google Scholar] [CrossRef] [PubMed]
  41. Moghaddam, H.S.; Zare-Shahabadi, A.; Rahmani, F.; Rezaei, N. Neurotransmission systems in Parkinson’s disease. Rev. Neurosci. 2017, 28, 509–536. [Google Scholar] [CrossRef] [PubMed]
  42. Klass, D.W.; Brenner, R.P. Electroencephalography of the Elderly. J. Clin. Neurophysiol. 1995, 12, 116–131. [Google Scholar] [CrossRef]
  43. Scally, B.; Burke, M.R.; Bunce, D.; Delvenne, J.F. Resting state EEG power and connectivity are associated with alpha peak frequency slowing in healthy aging. Neurobiol. Aging. 2018, 71, 149–155. [Google Scholar] [CrossRef]
  44. Hughes, S.W.; Crunelli, V. Thalamic mechanisms of EEG alpha rhythms and their pathological implications. Neuroscientist 2005, 11, 357–372. [Google Scholar] [CrossRef]
  45. Hughes, E.J.; Bond, J.; Svrckova, P.; Makropoulos, A.; Ball, G.; Sharp, D.J.; Edwards, A.D.; Hajnal, J.V.; Counsell, S.J. Regional changes in thalamic shape and Vol. with increasing age. NeuroImage 2012, 63, 1134–1142. [Google Scholar] [CrossRef]
  46. Melgari, J.M.; Curcio, G.; Mastrolilli, F.; Salomone, G.; Trotta, L.; Tombini, M.; di Biase, L.; Scrascia, F.; Fini, R.; Fabrizio, E.; et al. Alpha and beta EEG power reflects L-dopa acute administration in parkinsonian patients. Front. Aging Neurosci. 2014, 6, 302. [Google Scholar] [CrossRef] [PubMed]
  47. Kan, D.P.X.; Croarkin, P.E.; Phang, C.K.; Lee, P.F. EEG differences between eyes-closed and eyes-open conditions at the resting stage for euthymic participants. Neurophysiology 2017, 49, 432–440. [Google Scholar] [CrossRef]
  48. Ishii, R.; Canuet, L.; Aoki, Y.; Hata, M.; Iwase, M.; Ikeda, S.; Nishida, K.; Ikeda, M. Healthy and pathological brain aging: From the perspective of oscillations, functional connectivity, and signal complexity. Neuropsychobiology 2017, 75, 151–161. [Google Scholar] [CrossRef] [PubMed]
  49. Murty, D.V.P.S.; Manikandan, K.; Kumar, W.S.; Ramesh, R.G.; Purokayastha, S.; Javali, M.; Rao, N.P. Gamma oscillations weaken with age in healthy elderly in human EEG. NeuroImage 2020, 215, 116826. [Google Scholar] [CrossRef] [PubMed]
  50. Giaquinto, S.; Nolfe, G. The EEG in the normal elderly: A contribution to the interpretation of aging and dementia. Electroencephalogr. Clin. Neurophysiol. 1986, 63, 540–546. [Google Scholar] [CrossRef] [PubMed]
  51. Polunina, A.G.; Leftrova, N.P. Gender differences in resting state electroencephalography characteristics. Curr. Trends Neurol. 2012, 6, 51–60. [Google Scholar]
  52. Brenner, R.P.; Ulrich, R.F.; Reynolds, C.F. EEG spectral findings in healthy, elderly men and women- sex differences. Electroencephalogr. Clin. Neurophysiol. 1995, 94, 1–5. [Google Scholar] [CrossRef]
  53. Sang, F.; Chen, Y.; Chen, K.; Dang, M.; Gao, S.; Zhang, Z. Sex Differences in Cortical Morphometry and White Matter Microstructure During Brain Aging and Their Relationships to Cognition. Cereb. Cortex 2021, 31, 5253–5262. [Google Scholar] [CrossRef]
  54. Simmonite, M.; Carp, J.; Foerster, B.R.; Ossher, L.; Petrou, M.; Weissman, D.H.; Polk, T.A. Age-related declines in occipital GABA are associated with reduced fluid processing ability. Acad. Radiol. 2019, 26, 1053–1061. [Google Scholar] [CrossRef]
  55. Hyvarinen, A. Fast and robust fixed-point algorithms for independent component analysis. IEEE Trans. Neural Netw. 1999, 10, 626–634. [Google Scholar] [CrossRef]
  56. Morabito, F.C. Independent component analysis and feature extraction for NDT data. Mater. Eval. 2000, 58, 85–92. [Google Scholar]
  57. Islam, M.S.; Hussain, I.; Rahman, M.M.; Park, S.J.; Hossain, M.A. Explainable Artificial Intelligence Model for Stroke Prediction Using EEG Signal. Sensors 2022, 22, 9859. [Google Scholar] [CrossRef]
  58. Surya, S.; Yamini, B.; Rajendran, T.; Narayanan, K. A Comprehensive Method for Identification of Stroke using Deep Learning. Turk. J. Comput. Math. Educ. 2021, 12, 647–652. [Google Scholar]
  59. Miller, A.; Blott, B.; Hames, T. Review of neural network applications in medical imaging and signal processing. Med. Biol. Eng. Comput. 1992, 30, 449–464. [Google Scholar] [CrossRef] [PubMed]
  60. Subasi, A. Automatic recognition of alertness level from EEG by using neural network and wavelet coefficients. Expert. Syst. Appl. 2005, 28, 701–711. [Google Scholar] [CrossRef]
  61. Djemili, R.; Bourouba, H.; Korba, M.A. Application of empirical mode decomposition and artificial neural network for the classification of normal and epileptic EEG signals. Biocybern. Biomed. Eng. 2016, 36, 285–291. [Google Scholar] [CrossRef]
  62. Subasi, A. Automatic detection of epileptic seizure using dynamic fuzzy neural networks. Expert. Syst. Appl. 2006, 31, 320–328. [Google Scholar] [CrossRef]
  63. Subasi, A. EEG signal classification using wavelet feature extraction and a mixture of expert model. Expert. Syst. Appl. 2007, 32, 1084–1093. [Google Scholar] [CrossRef]
  64. Adeli, H.; Zhou, Z.; Dadmehr, N. Analysis of EEG records in an epileptic patient using wavelet transform. J. Neurosci. Methods 2003, 123, 69–87. [Google Scholar] [CrossRef]
  65. Akay, M. Wavelet applications in medicine. IEEE Spectr. 1997, 34, 50–56. [Google Scholar] [CrossRef]
  66. Subasi, A. Epileptic seizure detection using dynamic wavelet network. Expert. Syst. Appl. 2005, 29, 343–355. [Google Scholar] [CrossRef]
  67. Alturki, F.A.; AlSharabi, K.; Abdurraqeeb, A.M.; Aljalal, M. EEG Signal Analysis for Diagnosing Neurological Disorders Using Discrete Wavelet Transform and Intelligent Techniques. Sensors 2020, 20, 2505. [Google Scholar] [CrossRef] [PubMed]
  68. Yong, Y.; Hurley, N.; Silvestre, G. Single-trial EEG classification for brain-computer interface using wavelet decomposition. In Proceedings of the European Signal Processing Conference, Antalya, Turkey, 4–8 September 2005; pp. 1–4. [Google Scholar]
  69. Khan, Y.U.; Rafiuddin, N.; Farooq, O. Automated seizure detection in scalp EEG using multiple wavelet scales. In Proceedings of the 2012 IEEE International Conference on Signal Processing, Computing and Control, Solan, India, 15–17 March 2012; pp. 1–5. [Google Scholar]
  70. Sheng, Y. Wavelet Transform. In The Transforms and Applications Handbook; Poularikas, A., Ed.; CRC Press: Boca Raton, FL, USA, 1996; pp. 747–828. [Google Scholar]
  71. Jevrejeva, S.; Moore, J.; Grinsted, A. Influence of the Arctic Oscillation and El Niño-Southern Oscillation (ENSO) on ice conditions in the Baltic Sea: The wavelet approach. J. Geophys. Res. 2003, 108, 4677. [Google Scholar] [CrossRef]
  72. Grinsted, A.; Moore, J.; Jevrejeva, S. Application of the cross wavelet transform and wavelet coherence to geophysical time series. Nonlinear Process. Geophys. 2004, 11, 561–566. [Google Scholar] [CrossRef]
  73. Hramov, A.; Koronovskii, A.; Makarov, V.; Pavlov, A.; Sitnikova, E. Wavelets in Neuroscience; Springer-Verlag: Berlin, Heidelberg, 2015; p. 331. [Google Scholar]
  74. Velasco Herrera, V.M.; Perez-Peraza, J.; Soon, W.; Márquez-Adame, J.C. The quasi-biennial oscillation of 1.7 years in ground level enhancement events. New Astron. 2017, 60, 7–13. [Google Scholar] [CrossRef]
  75. Einstein, A. Method for the determination of the statistical values of observations concerning quantities subject to irregular fluctuatƒions. Arch. Des Sci. Nat. 1914, 37, 254–256. [Google Scholar]
Figure 1. Representative continuous wavelet spectra of Fp1 channel from CL and PD men. (A) Continuous wavelet spectrum from a CL man. (B) Continuous wavelet spectrum from a man with PD. (C) Zoom corresponding to the global wavelet spectra in frequency of CL and PD men, respectively, indicated.
Applsci 13 09618 g001
Figure 2. Global wavelet profiles of CL and PD men groups < 60. For CL, (A) the main frequencies profile, (B) the global wavelet curves profile, and (C) the power anomalies profile (linear regression y = −0.062x + 0.69). For men with PD, (D) the main frequencies profile, (E) the global wavelet curves profile, and (F) the power anomalies profile (linear regression y = 0.13x − 1.4). Channel labels: Fp (frontopolar), F (frontal), C (central), T (temporal) and O (occipital).
Applsci 13 09618 g002
Figure 3. Global wavelet profiles of CL and PD men groups > 60. For CL: (A) the main frequencies profile, (B) the global wavelet curves profile, and (C) the power anomalies profile (linear regression y = −0.042 x + 0.46). For men with PD: (D) the main frequencies profile, (E) the global wavelet curves profile, and (F) the power anomalies profile (linear regression y = −0.1 x + 1.1). Channel labels: Fp (frontopolar), F (frontal), C (central), T (temporal) and O (occipital).
Applsci 13 09618 g003
Figure 4. Comparison of the global wavelet profiles across male CL and PD age groups. For CL and PD men < 60 years old: (A) mean global wavelet curves, (B) brainwave powers profiles, and (C) linear regressions from the anteroposterior power gradients. For CL and PD men > 60 years old: (D) mean global wavelet curves, (E) brainwave powers profiles, and (F) linear regressions from the anteroposterior power gradients. Standard error bars are shown on the brainwave powers and statistically significance differences between the groups are marked by the star symbol (★).
Applsci 13 09618 g004
Figure 5. Comparison by sex of the global wavelet profiles from CL and PD groups < 60. For CL men and women: (A) mean global wavelet curves, (B) brainwave powers profiles, and (C) linear regressions from the anteroposterior power gradients. For PD men and women: (D) mean global wavelet curves, (E) brainwave powers profiles, and (F) linear regressions from the anteroposterior power gradients. Standard error bars are shown on the brainwave powers and statistically significance differences between the groups are marked by the star symbol (★).
Applsci 13 09618 g005
Figure 6. Comparison by sex of the global wavelet profiles from CL and PD groups > 60. For CL men and women: (A) mean global wavelet curves, (B) brainwave powers profiles, and (C) linear regressions from the anteroposterior power gradients. For PD men and women: (D) mean global wavelet curves, (E) brainwave powers profiles, and (F) linear regressions from the anteroposterior power gradients. Standard error bars are shown on the brainwave powers and statistically significance differences between the groups are marked by the star symbol (★).
Applsci 13 09618 g006
Table 1. Summary of brain activity characteristics of CL and PD men.
Group
(Men)
MF a
(Hz)
GWC bPA cLR d
(Slope/y-Intercept)
BP e
(μV2)
Mean Frequencies
(Mean ± SD; Hz)
Power
(μV2)
+≈0δθαβγ
(Brain Regions)
CL < 608.01
8.48
8.99
9.52
8.99 ± 1.86
2.38 ± 0.50
0.98
0.20
F
T
C
P
O
Fp−0.06/0.60.170.220.650.080.05
CL > 602.38
2.52
8.99
9.52
8.99 ± 2.34
2.52 ± 0.98
0.78
0.69
F
T
C
Fp
P
O
-−0.04/0.40.480.180.530.057.9 × 10−3
PD < 602.38
2.52
8.48 ± 2.22
2.52 ± 1.05
0.33
0.90
8.48 ± 2.22
2.52 ± 1.05
0.33
0.90
P
O
Fp
F
T
C
-0.13/−1.40.640.190.210.030.01
PD > 602.38
2.52
4.24
6.36
6.73
7.13
4.00 ± 0.70
6.73 ± 3.27
2.52 ± 0.47
0.53
0.69
0.79
Fp
F
C
T
P
O
-−0.10/1.10.590.560.330.025.2 × 10−3
a MF = Main Frequencies; b GWC = Global Wavelet Curves; c PA = Power Anomalies, (+) positive anomalies, (−) negative anomalies, (≈0): anomalies close to zero, Fp: Frontopolar, F: Frontal, C: Central, T: Temporal, P: Parietal, O: Occipital. d LR = Linear regression; e BP = Brainwave power.
Table 2. Summary of brain activity characteristics of CL and PD women.
Group
(Women)
MF a
(Hz)
GWC bPA cLR d
(Slope/y-Intercept)
BP e
(μV2)
Mean Frequencies
(mean ± SD; Hz)
Power
(μV2)
+≈0δθαβγ
(Brain Regions)
CL < 608.99
9.52
10.09
9.52 ± 1.81
2.67 ± 0.55
0.89
0.39
Fp
F
T
P
O
C−0.14/1.60.320.180.560.024.4 × 10−3
CL > 608.48
8.99
8.99 ± 1.36
2.52 ± 0.46
0.93
0.33
Fp
T
O
F
C
P
-−0.03/0.40.230.150.500.022.9 × 10−3
PD < 608.99
9.52
10.09
9.52 ± 1.96
2.67 ± 0.49
0.95
0.35
T
P
O
Fp
F
C
-0.12/−1.30.260.230.680.078.5 × 10−3
PD > 602.38
2.52
2.67
8.99
8.99 ± 2.41
2.67 ± 0.61
0.49
0.90
T
P
O
FpF
C
0.12/−1.40.660.290.350.070.02
a MF = Main Frequencies; b GWC = Global Wavelet Curves; c PA = Power Anomalies, (+) positive anomalies, (−) negative anomalies, (≈0): anomalies close to zero, Fp: Frontopolar, F: Frontal, C: Central, T: Temporal, P: Parietal, O: Occipital. d LR = Linear regression; e BP = Brainwave power.
Disclaimer/Publisher’s Note: The statements, opinions and data contained in all publications are solely those of the individual author(s) and contributor(s) and not of MDPI and/or the editor(s). MDPI and/or the editor(s) disclaim responsibility for any injury to people or property resulting from any ideas, methods, instructions or products referred to in the content.

