Abstract
Aiming at the problems of difficult construction and occlusion of the initial structure of an automotive augmented reality head-up display (AR-HUD), a method to quickly build the initial structure of an automotive AR-HUD is proposed. Firstly, the position of the mirrors in the initial structure is calculated based on the Rodrigues rotation formula. Secondly, the position of the mirrors is restricted by constraints during optimization to prevent the problem of structural occlusion. Finally, a virtual image display system with a visual distance of 7.5 m and a field of view angle of 10° × 5° is designed. The image quality analysis of the optimized system shows that the light spots in each field of view are all within Airy spots. At the spatial cutoff frequency of the virtual image plane of the optical system, the modulation transfer function (MTF) value of the full field of view is basically greater than 0.5, and the distortion is less than 1%. Finally, using the image for simulation, the results of the simulation image are satisfying, which proves the validity and feasibility of the structural design. It provides a useful reference for the structural design of the remote head-up display system.
1. Introduction
With the development of the automobile industry, head-up display (HUD) technology has gradually been applied to car driving. It can project driving information as images to the front of the windshield of the car and provide drivers with real-time driving information, thus improving driving safety and comfort [1,2].
Augmented reality head-up displays (AR-HUDs) are a research hotspot that has arisen in recent years. Compared with traditional HUDs, AR-HUDs can achieve a longer projection distance and a larger field of view angle, superimpose virtual prompts in the real world, and describe and perceive information intuitively and clearly to achieve a friendly and natural interactive interface [3,4,5]. Aiming at the AR-HUD structure design, Huang Xingzhou [6] et al. designed an optical path structure with a virtual image visual distance of 7.5 m and a virtual image field of view angle of 9.8° × 5.5° by using a free-form surface and off-axis reflected optical path structure and analyzed the tolerance of the system. Chen Xiaowei et al. [7] designed a virtual image display light path with a virtual visual distance of 10 m and a field of view angle of 10° × 5° by using two free-form surfaces and an off-axis double reflection system and conducted simulation analysis on light damage. Finally, the display effect was simulated by UI images. However, the above design only analyzes the design index and results and lacks a detailed demonstration and derivation for the construction of the initial structure. In terms of initial HUD structure design, Ma Donglin et al. [8] proposed a HUD initial structure design method based on off-axis triple inversion and analyzed HUD structural constraints and optimization strategies. Zhang Yangliu et al. [9] conducted an initial design of a HUD optical system based on a seed curve expansion algorithm, verified the results, and analyzed the tolerance of the system. However, the above initial structure design method is only used for short-distance projection head-up display systems, and there is no mature design method suitable for long-distance display systems currently.
Existing methods lack a detailed demonstration and derivation for the construction of the initial AR-HUD structure. Inspired by the theory of the Rodrigues rotation formula, we propose a method to design the initial AR-HUD structure. To overcome the difficulty of structural occlusion, we take the example of an off-axis triple inverse structure.
Our contributions are as follows:
- (1)
- The design index is proposed according to the current industry AR-HUD standard.
- (2)
- A method of initial AR-HUD structure design based on the Rodrigues rotation formula is proposed, and combined with the characteristics of the off-axis triple inverse structure, the problem of structural occlusion in the optimization process is solved.
- (3)
- We design an example according to the above method and analyze the design results.
This article is organized as follows: Section 2 presents the basic theory and design objective, and Section 3 describes the proposed initial structure design based on the Rodrigues rotation formula and anti-occlusion optimization method. In Section 4, we design an example and discuss the experimental results. In Section 5, we summarize the content of this paper.
2. Basic Theory and Design Objective
2.1. Design Principle
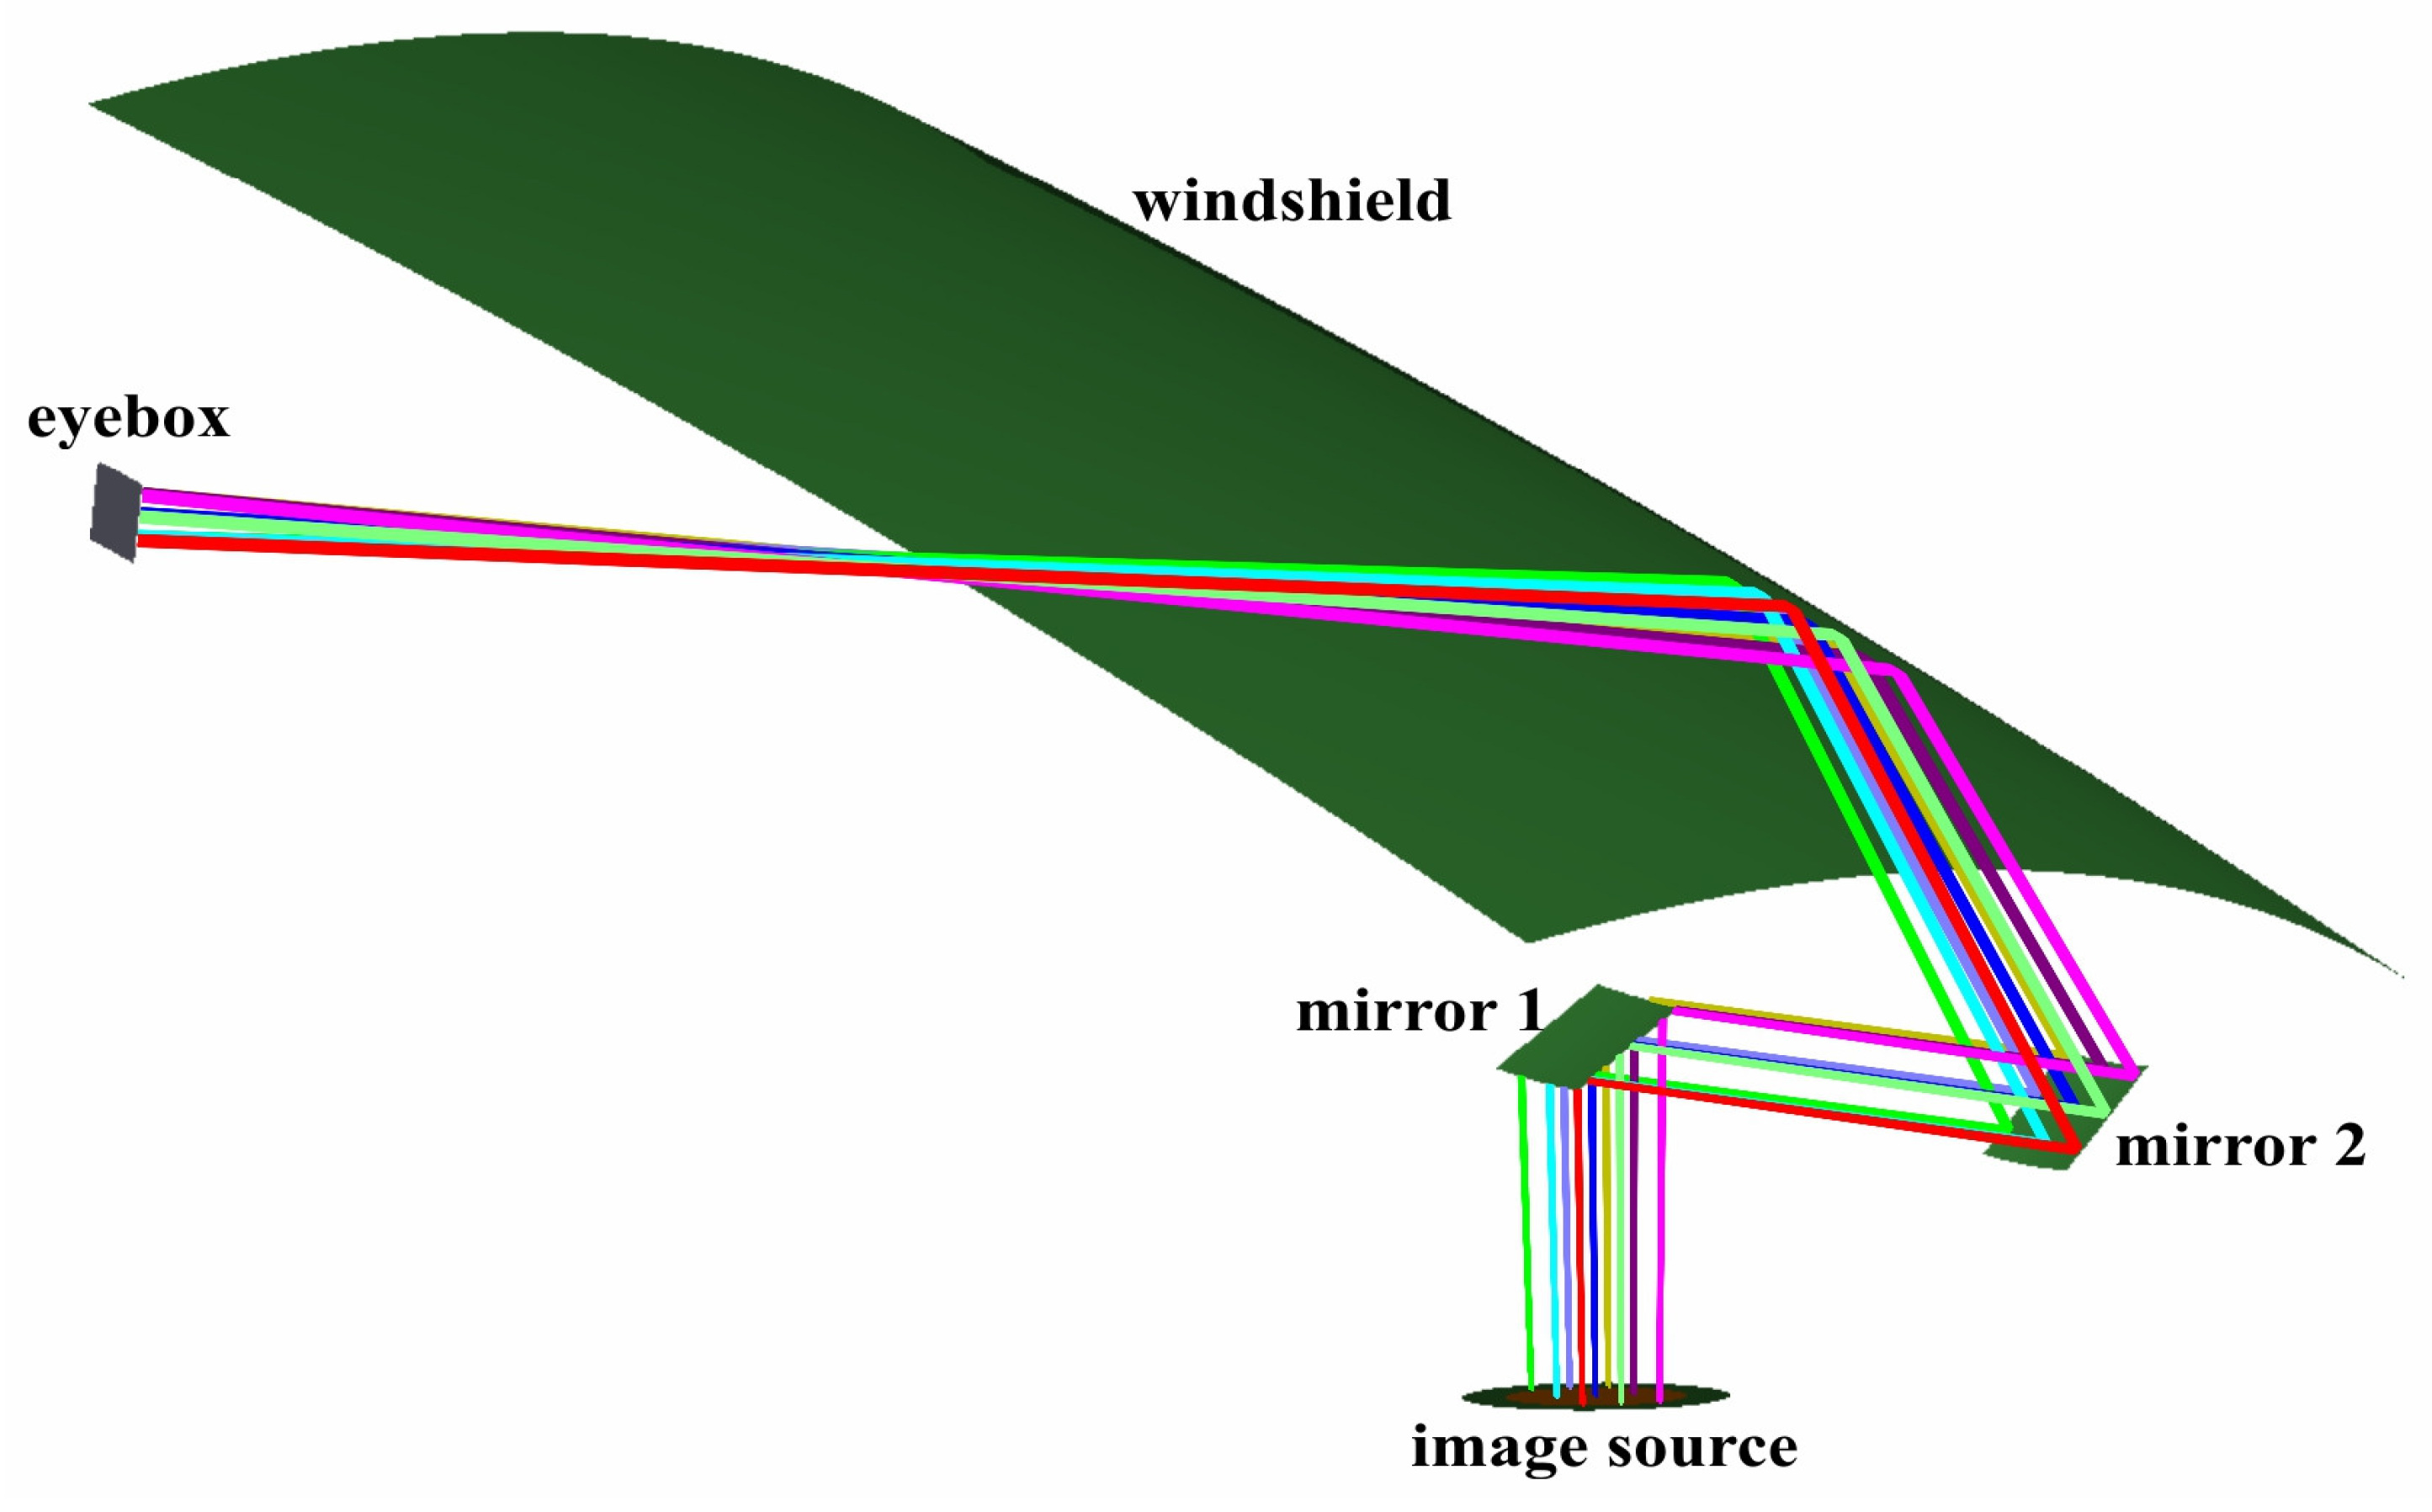
The light path diagram of the HUD structure includes five main parts: source image, reflectors M1 and M2, windshield, and eyebox. As shown in Figure 1, light is emitted from the source image at a certain divergence angle and enters the human eye after being reflected by reflectors M1 and M2 and the windshield. Finally, it converges at a certain distance to form a virtual image, which enables drivers to see driving information and the road at the same time.
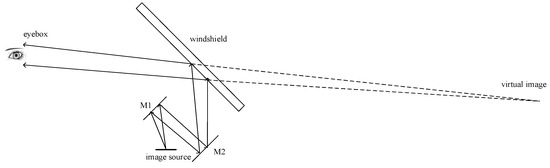
Figure 1.
Virtual image schematic diagram.
2.2. Design Parameter Analysis
In the process of AR-HUD design, the main design parameters include virtual image visual distance, field of view angle, eyebox size, source image size, and image quality requirements.
In the AR-HUD projection process, the projected image needs to be combined with the real scene. Considering driving comfort, the virtual visual distance of the AR-HUD required in the industry is between 7.5 m and 20 m [10]. This paper adopts the 7.5 m virtual visual distance commonly used in the industry as the design objective.
The field of view angle refers to the angle between the edge of the observed object and the center of the observation point, and in the head-up display system, it is just the angle between the edge of the formed virtual image and the center of the pupil of the human eye. The current industry standard for AR-HUD generally sets the field of view angle to about 10° × 5°.
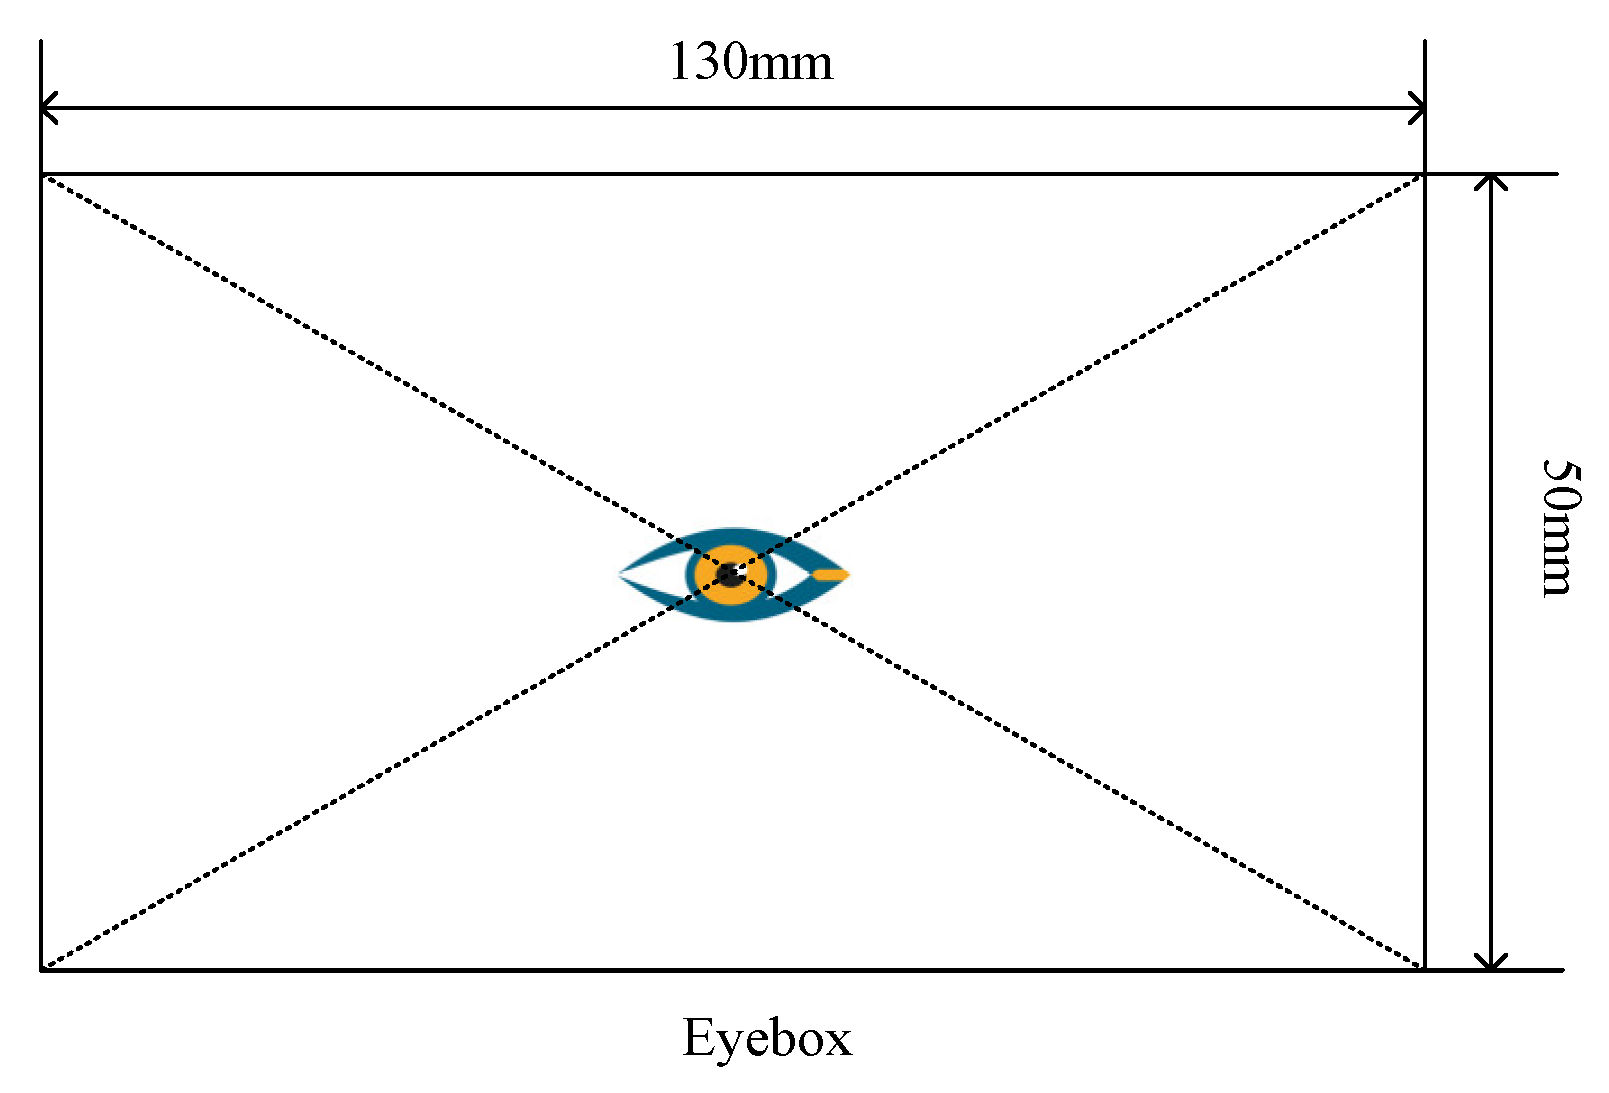
As shown in Figure 2 below, eyebox refers to the range through which the driver’s eyes can adjust during driving without affecting the sharpness of the virtual image. This data is an empirical statistical value, which is usually set according to relevant research and the demands of automobile manufacturers. In this paper, the empirical value is set at 130 mm × 50 mm.
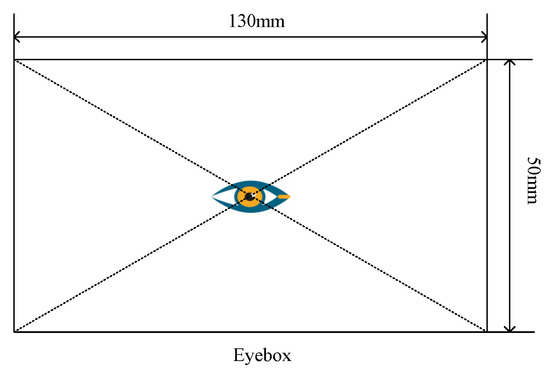
Figure 2.
Eyebox.
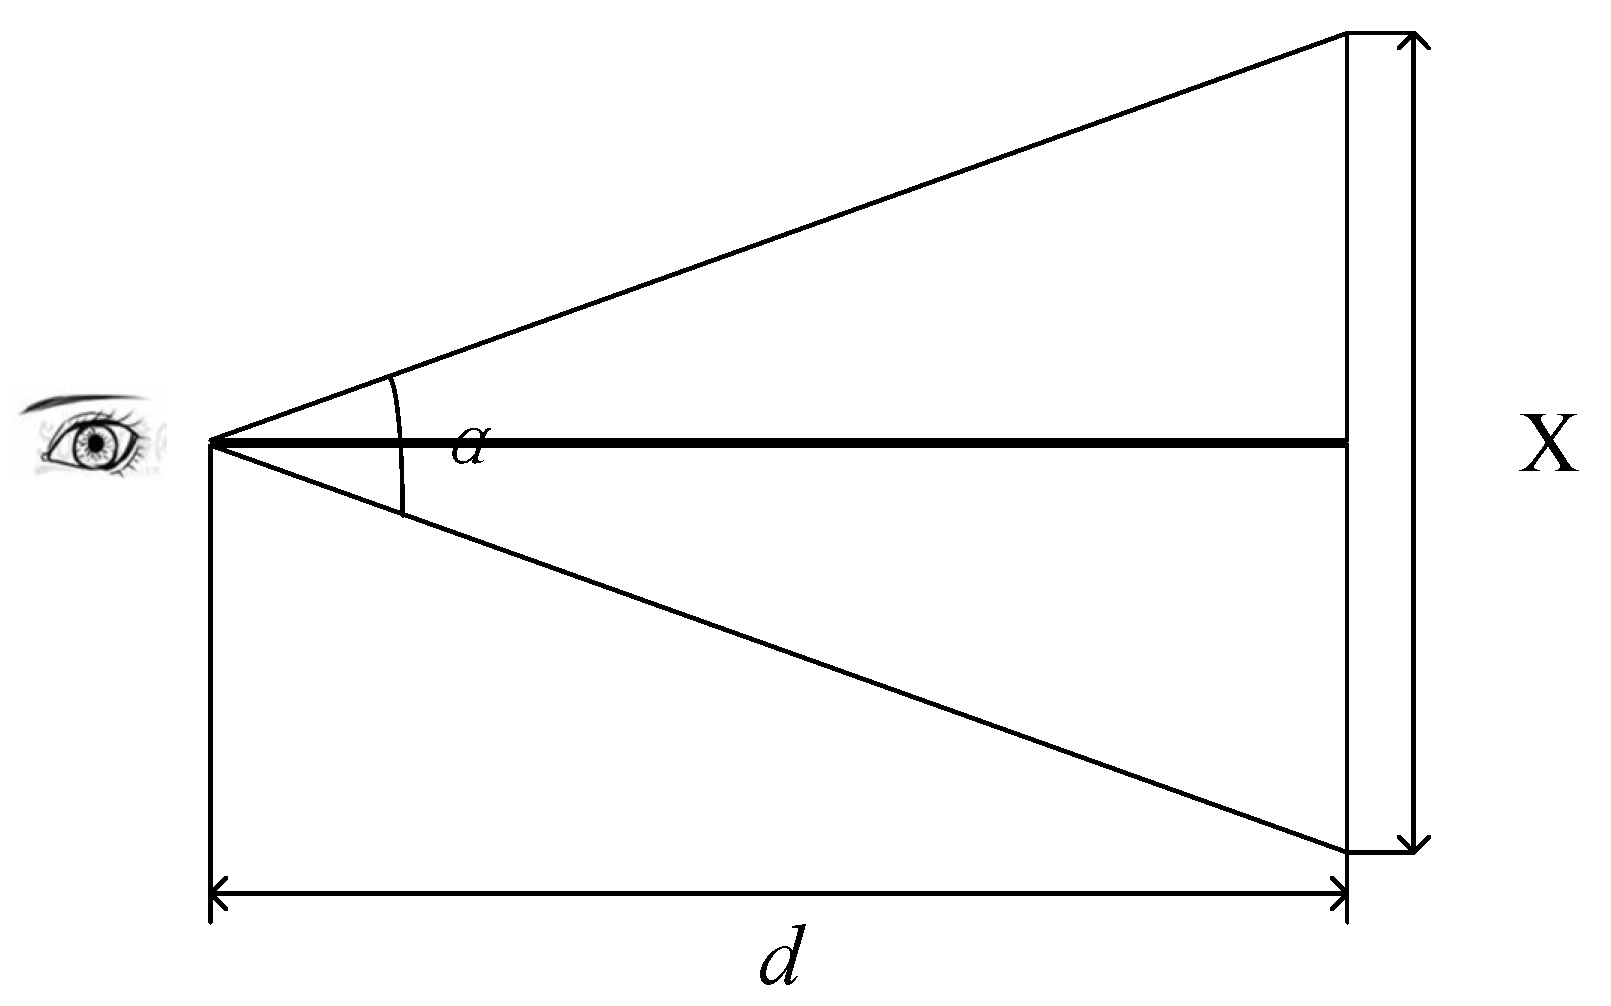
As shown in Figure 3 below, the visual distance of the virtual image is 7.5 m, and the field of view angle is set to 10° × 5°. The horizontal imaging size can be calculated as

Figure 3.
Virtual image size calculation diagram.
Similarly, the imaging size in the vertical direction can be calculated as 654.91 mm.
The typical resolution of the human eye is 1′. When the field of view angle is 10° × 5°, in order for the driver to clearly observe the virtual image generated by the HUD system, the image resolution is required to be greater than 600 × 300 pixels. In this paper, the DLP5530S-Q1 automotive digital micromirror device (DMD), produced by Texas Instruments, is selected as the source image module with a resolution of 1152 × 576 pixels, which can achieve a high-performance augmented reality HUD, gaining a wider field of view and greater driver eye movement range.
Based on the virtual image resolution of 1152 × 576 pixels, the size of each pixel of the horizontal virtual image μ can be calculated as
where is the horizontal imaging size and is the virtual image resolution at x direction. It can be calculated at about 1.14 mm.
To obtain the analytical modulation transfer function (MTF) value [6] of the optical transfer function, according to Nyquist’s sampling theorem, the resolution of the optical system in the virtual image space is at least
According to the analysis of the above technical indicators, considering the compact HUD structure, the machinability of a free-form surface in the later stage, and optimizing the layout, the specific parameters and indicators of the HUD system in this paper are shown in Table 1 below:

Table 1.
AR-HUD system parameter settings.
3. Proposed Methods
3.1. Initial Structure Design Based on the Rodrigues Rotation Formula
At present, the initial structural design of HUD is basically aimed at the short-distance display system, that is, the optical system with a virtual visual range of between 2 and 2.5 m. And there is no detailed design scheme for the long-distance projection AR-HUD. In this paper, based on the off-axis triple inverse structure, the following AR-HUD initial structure design method is proposed, combined with the HUD installation position and prototype volume constraints.
According to the internal structure size of the instrument panel, the maximum volume of the automotive HUD that can be installed is about 15 L. In the initial design, in order to prevent the occlusion of the lens in the later stage as much as possible, the reflector space should be extended as far as possible with a certain installation gap. The initial placement position is roughly shown in Figure 4. The spacing between the components can be measured according to the installation position.
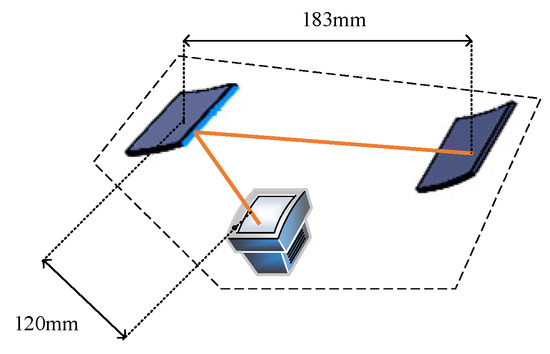
Figure 4.
HUD prototype.
When designing the initial structure of the HUD, it usually starts from the reverse, that is, the virtual image plane is regarded as the object plane, which is conducive to the construction of the initial light path. In order to facilitate the initial structural design, the source image, reflectors M1 and M2, and windshield are set in the same meridian plane as the main ray intersection. The optical path structure shown in Figure 5 can be obtained by pursuing the main ray. In the figure, the vertical axis always corresponds to the y axis.
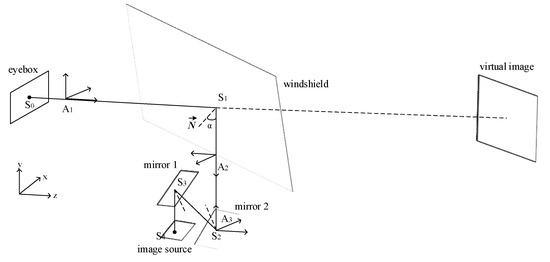
Figure 5.
Initial structure of the AR-HUD.
In Figure 5, are intersection points of the main ray with the eyebox, windshield, free-form surfaces M1 and M2, and source image surface, respectively. The tilt angle of the windshield surface can be measured in advance, and the direction vector can be calculated from the surface profile data. The reflection angle of the surface can be calculated as follows:
Given that the angle of reflection is equal to the angle of incidence, the reflected light can be calculated as
According to the HUD installation position measurement before the design, is about 230 mm, and then the vector can be calculated. According to the installation spacing of each surface in Figure 4, the reflection angle and reflected light vector parameter coordinates , of the surface can be calculated.
After calculating the reflection vector of each surface, it is necessary to calculate the rotation angle and tilt angle of each surface, including the three x, y, and z axis directions, which can help to calculate the rotation angles. Assuming that the direction unit vector of the surface before rotation is , and the direction vector after rotation is , then the rotation matrix satisfies
where represents each term of the rotation matrix . Assuming that the angle between vectors and is , the rotation matrix can be obtained according to the Rodrigues rotation formula [11]:
where is the unit matrix, and is the cross product matrix, which can be represented with :
Assuming that the angles between the rotation vector and the axis directions are , respectively, the rotation angle can be further derived as
Similarly, the rotation angle of the surplus surface in the initial structure can be calculated step by step according to the light path, such as mirror 1 and the image source. At this time, the position and deflection angle of each plane of the initial structure have been determined, and the initial system can be built.
3.2. Anti-Occlusion Optimization Method Based on the Off-Axis Triple Inverse Structure
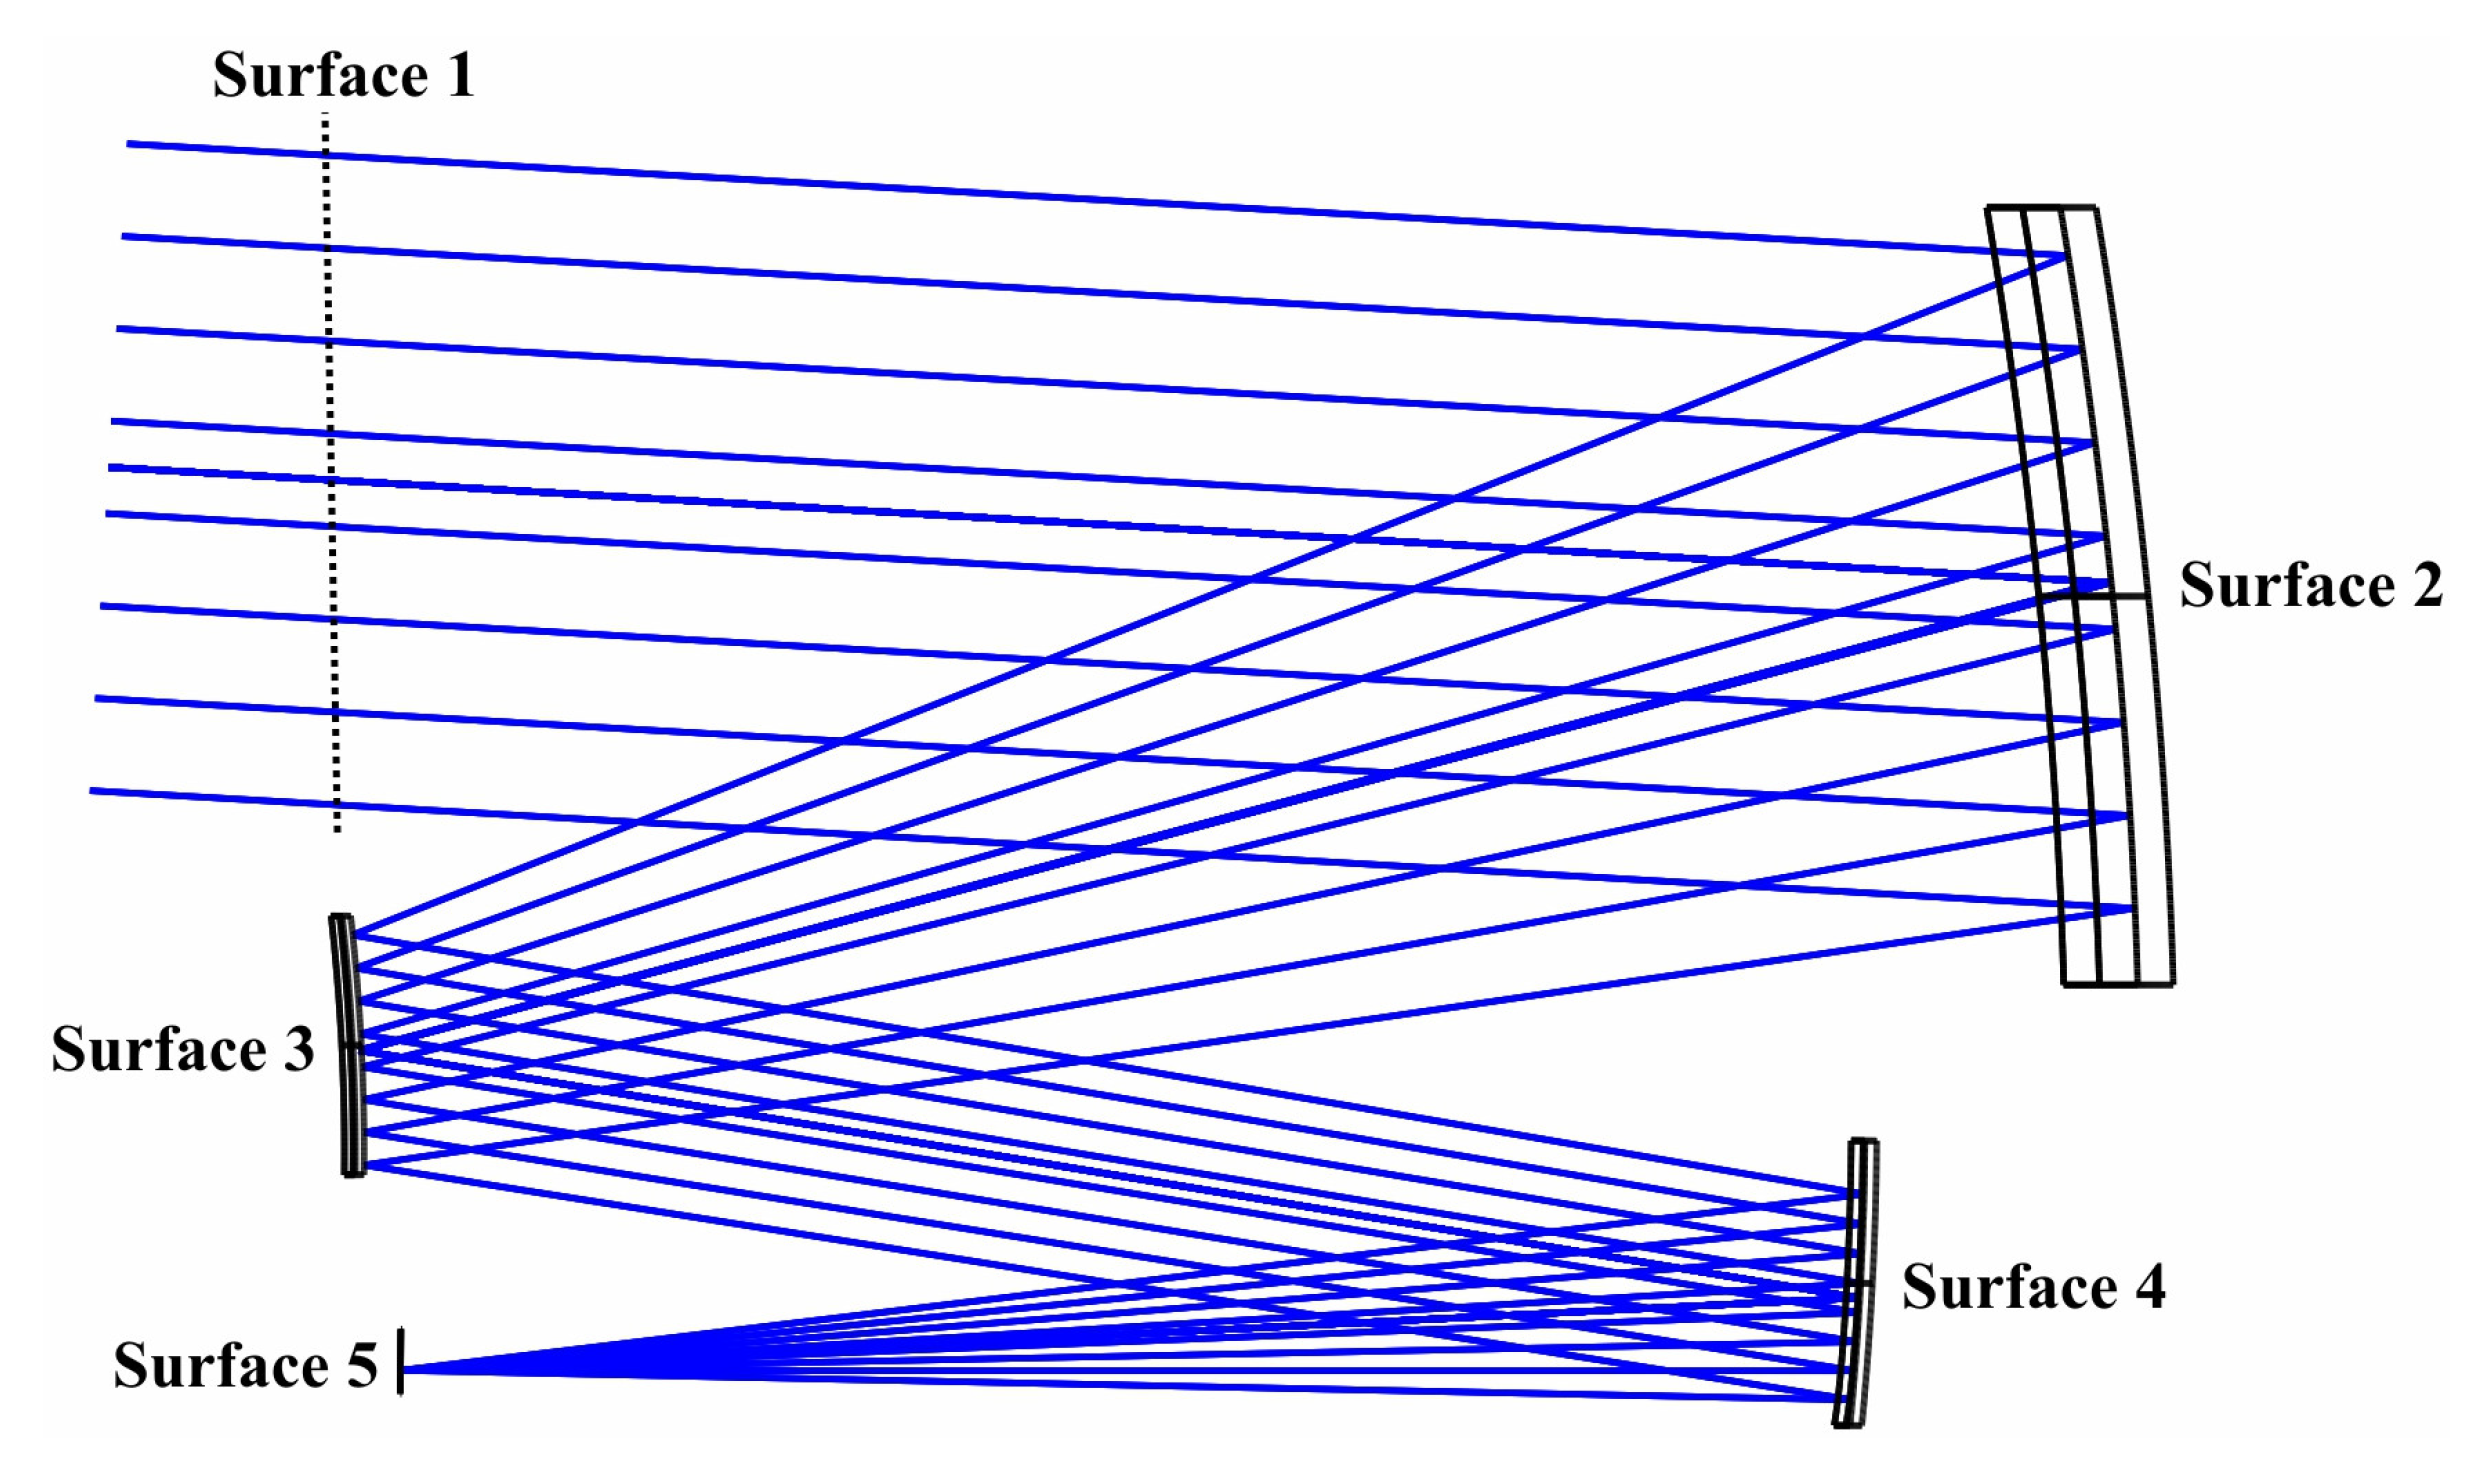
Due to the advantages of compact structure, no shading, a large field of view, and so on [12], the off-axis triple inversion is usually used as the initial structure for optimal design in the HUD design process. However, because its structure is very flexible, the eccentricity of a small distance or the adjustment of a small angle of rotation may bring about problems in the optimization process, such as structural occlusion. Inspired by the research on the off-axis three-reverse control occlusion method [13], as shown in Figure 6 below, by controlling the height of the light at the edge of the adjacent surface in the optimization process, the light occlusion problem in the optimization process can be prevented. The constraint conditions can be expressed as follows:
where denotes the th ordinate below the first surface, denotes the th ordinate above the first surface, and are constants.
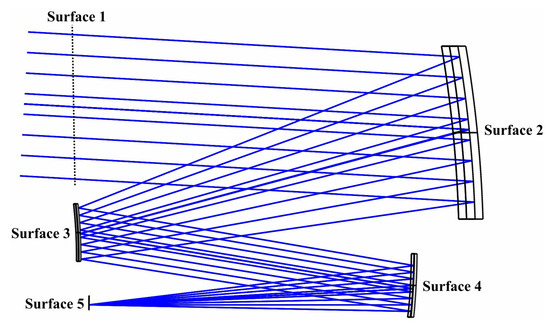
Figure 6.
Off-axis triple inverse structure.
In the structure of this paper, the source image plane in the HUD can be regarded as surface 5 in Figure 6, surface M1 as surface 3, surface M2 as surface 4, and the windshield can be regarded as surface 2. According to the relationship between the relevant structure and surface position, as shown in Figure 7, the following expression can be used to control the surface position:
where MF represents the value of the system optimization function, represents the weight of the th optimization, represents the actual value of the th optimization variable, represents the standard value of the th optimization variable, and represents the direction coordinate value of the . are constants and need to be determined according to the relative position of the HUD structure and the size of the reflection mirrors. In this experiment, they are set to 10 mm, 20 mm, and 200 mm, respectively.
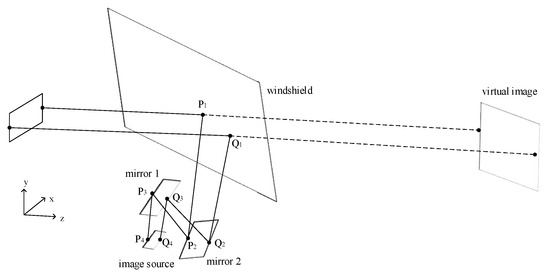
Figure 7.
Constraints of the occluded structure.
In Zemax, an optimization function is used to express the constraint condition (12), and the weight of the constraint term is set to limit the structure so as to prevent the mirror position from serious deviation, occlusion, and structure chaos during the optimization.
4. Simulation Design and Results
4.1. Design Example
In the design process, due to the irregularity of the windshield surface, the aberration introduced cannot be ignored, so it is necessary to fit the windshield surface in advance. The free-form surface expression XY extended polynomial in Zemax is used to fit the front windshield of the automobile. The XY extended polynomial is as follows:
where , , and represents the vector height difference in the direction of the z axis, represents the curvature, represents the conical surface constant, represents the polynomial coefficient, and and represent the corresponding and order, respectively.
The windshield point cloud data of a certain vehicle is extracted by LiDAR, and then the obtained data are fitted in Matlab using Formula (13). The windshield data after fitting is shown in Table 2.
Table 2.
Windshield fitting results.
After calculating the expression of the windshield, the initial structure is reverse-built according to the method proposed in Section 3.1. Considering the difficulty and processing requirements of the later processing of the free-form surface, the XY extended polynomial with stronger processability is used to design the two free-form mirrors. In the design process, in order to control aberration, only the even terms of the folded mirror M1 are set as variables to participate in optimization to reduce the complexity of the surface. The maximum degree of the main mirror M2 and the folded mirror M1 is set to 14 terms, that is, the maximum degree of the polynomial is 4. After the system is built, the M1 and M2 mirror curvature radius, cone coefficient, free-form surface type, and so on are optimized as variables.
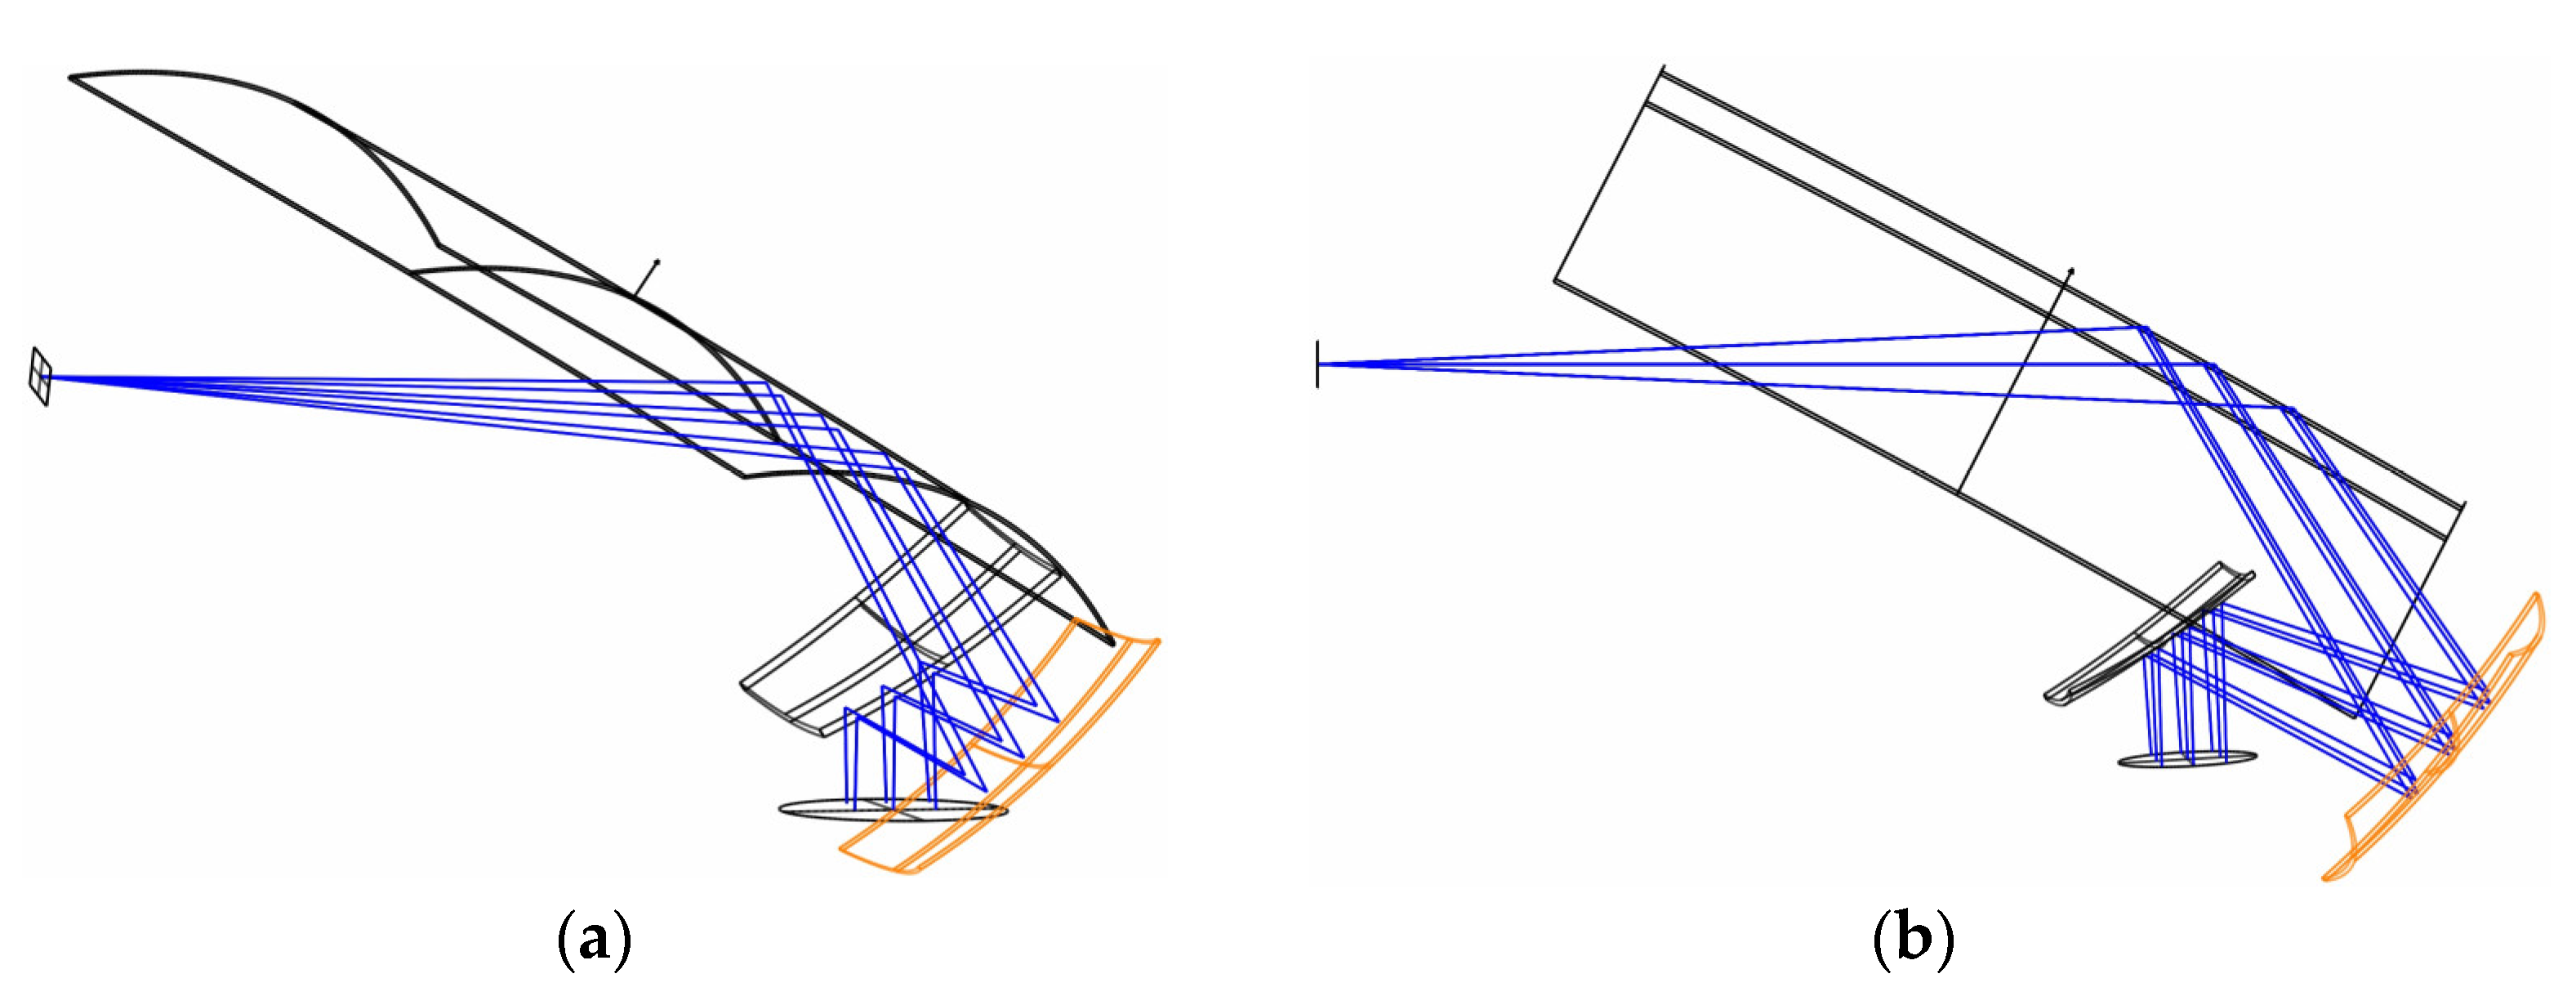
If the position and structure of the surface shape are not controlled during optimization, the structural occlusion problem, as shown in Figure 8a, may occur because the surface is very flexible. In Zemax, the occlusion problem of the structure is not easily discoverable because the occlusion problem of light is not considered. By using the optimization function to limit the edge position of the structure, the occlusion control effect, as shown in Figure 8b, can be achieved.
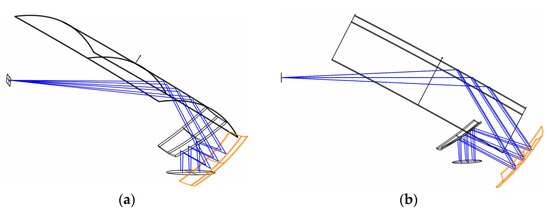
Figure 8.
Differences between before and after the addition of structural constraints: (a) optimization without restrictions; (b) optimization with restrictions.
In the process of optimization, it is necessary to always pay attention to the optical trace diagram and optical path structure of each surface. When it is found that the light deviation is too large, it is necessary to fine-tune the deflection angle and eccentricity of the free-form surface and correct the deviation caused by calculation errors and other factors in the initial structural design. However, the adjustment amount should not be too large; otherwise, the structure may be invalid. In the optimization process, the number of variables is gradually increased, or a part of the variables is fixed, and the result is gradually optimized until the structure and image quality meet the design requirements. After simple optimization, the partial structure diagram of the AR-HUD is shown in Figure 9 below.

Figure 9.
Optical path of the AR-HUD virtual image display.
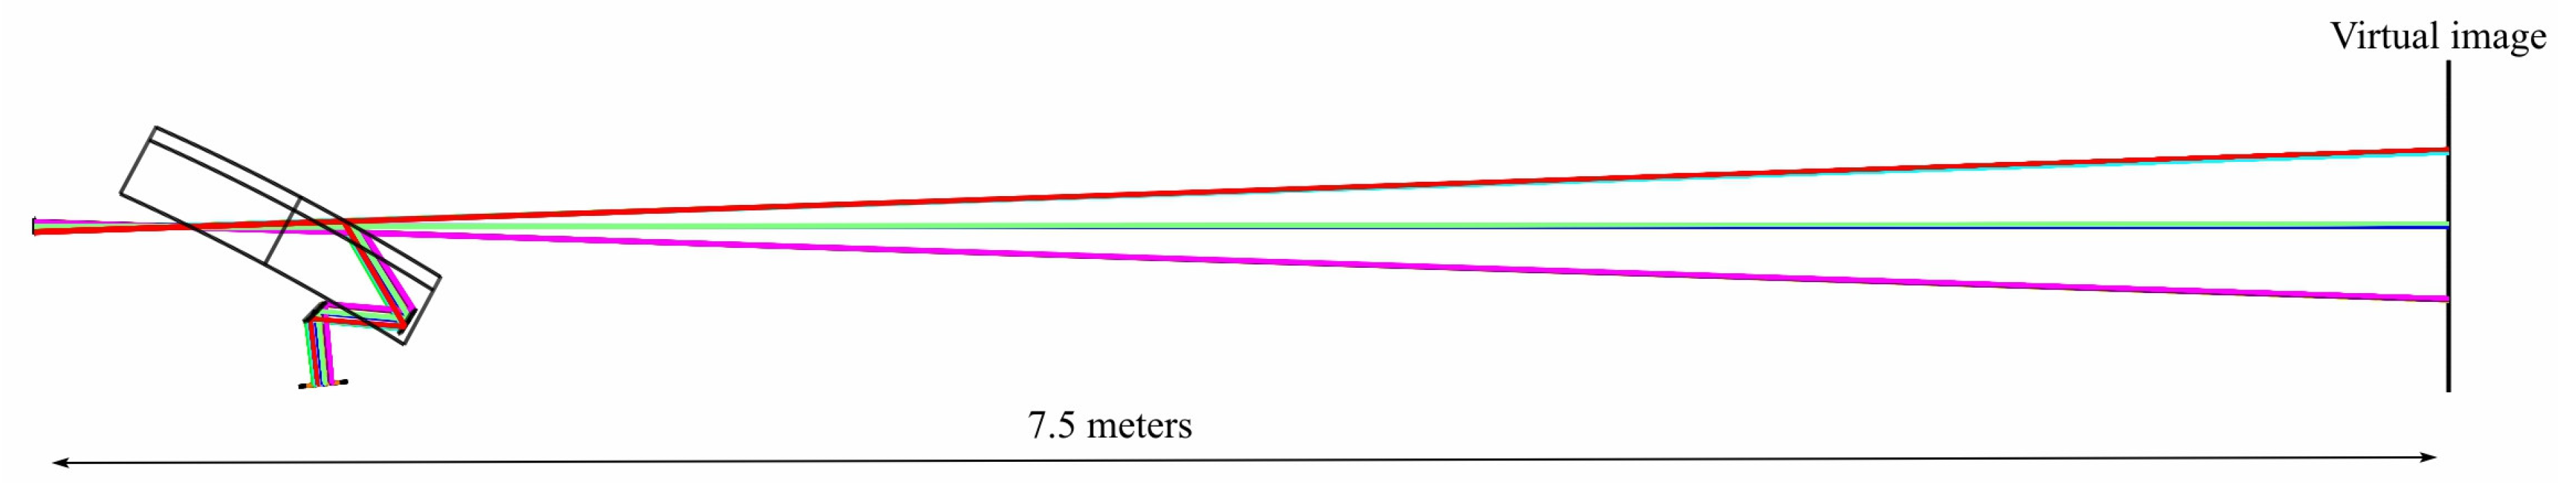
According to the system data, the visual distance of the virtual image of the optical path map is 7.5 m, and the imaging size of the virtual image is 1312.67 mm × 654.87 mm. The imaging position of the virtual image plane in the display of the optical path light map is shown in Figure 10 below.
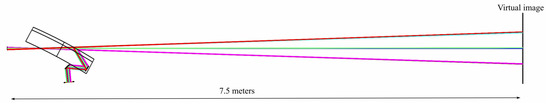
Figure 10.
Ray tracing map.
In the process of optical path structure design, the windshield is involved as a reflecting surface. Therefore, the surfaces to be designed and determined are folding mirror M1, main mirror M2, and the windshield. Among them, the spacing between each surface, the x and y axis rotation, and the y axis offset are the main parameters; the specific data are shown in Table 3 below. The optimized M1 and M2 profile data are shown in Table 4 and Table 5. Finally, the vision distance of the virtual image display optical path of the AR-HUD system is 7.5 m, and the virtual vision field angle is 10.145° × 5.072°, which accords with the design goal.
Table 3.
Optical path structure parameters.
Table 4.
Folding mirror M1 surface type and data.
Table 5.
Folding mirror M2 surface type and data.
4.2. Image Quality Analysis
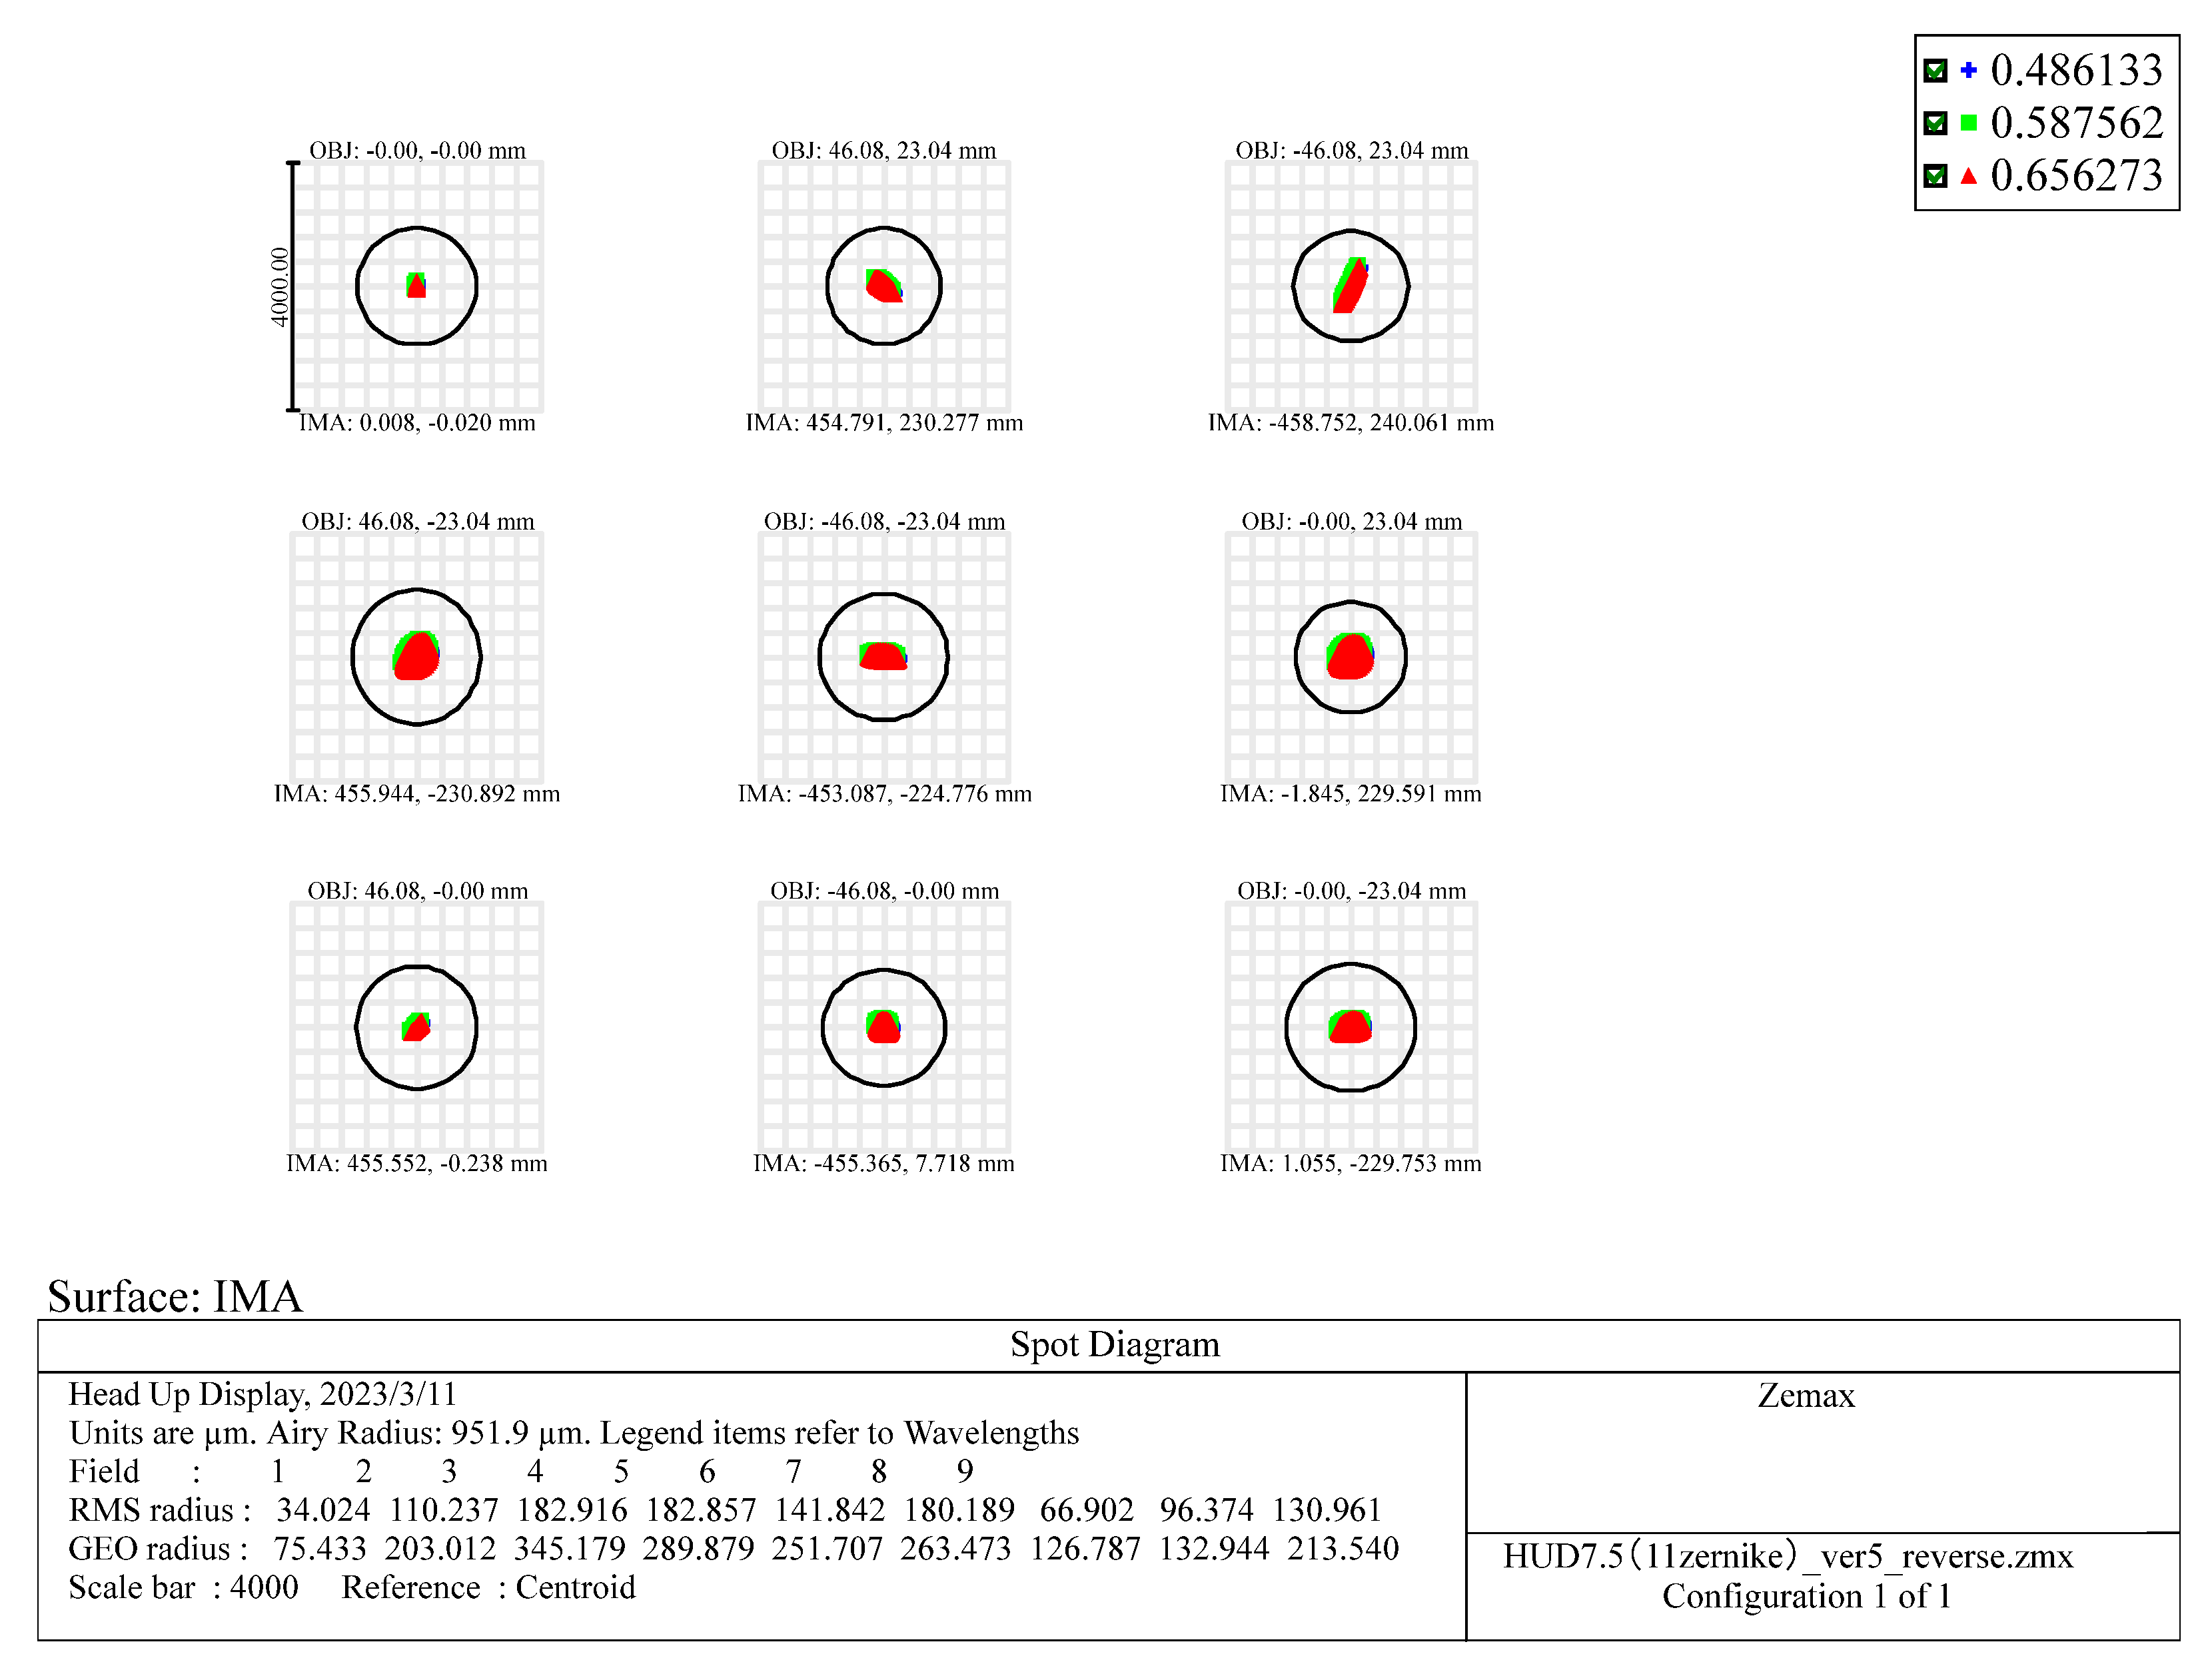
Imaging optical design must correct the aberration of the optical system, and the determination of aberration tolerance can effectively guide the optical design. In the process of HUD design, spot diagrams, optical modulation transfer functions, and distortion are usually used to evaluate the image quality.
Spot diagrams are tools that describe the image quality of an optical system, which refers to the distribution of the image obtained by imaging a point light source in the image plane. The size and shape distribution of the spot are directly related to the aberration of the optical system. The smaller the distribution area of the spots is, the smaller the aberration is. In addition, the more concentrated the spots are, the better the image quality of the system is. The pupil of the human eye is regarded as the aperture stop of the system, and the diameter of the pupil of the human eye is usually between 1 and 4 mm. In this paper, the diameter of the entrance pupil is set at 4 mm. The spot diagram distribution of each field of view on the image plane is shown in Figure 11 below. The RMS radius of the center field of view is 16.407 μm, and the maximum RMS radius of the edge field of view is only 89.011 μm, which is less than the experience value of AR-HUD design (100 μm). The distribution of visible light spots in the nine fields of view shows that they are all within Airy spots, the shape of the spots is relatively regular, and they are concentrated near the center of the circle, indicating that the whole system has small aberrations and good imaging quality.
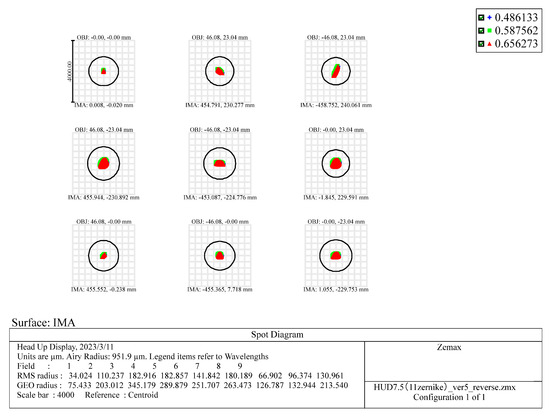
Figure 11.
Point spread function.
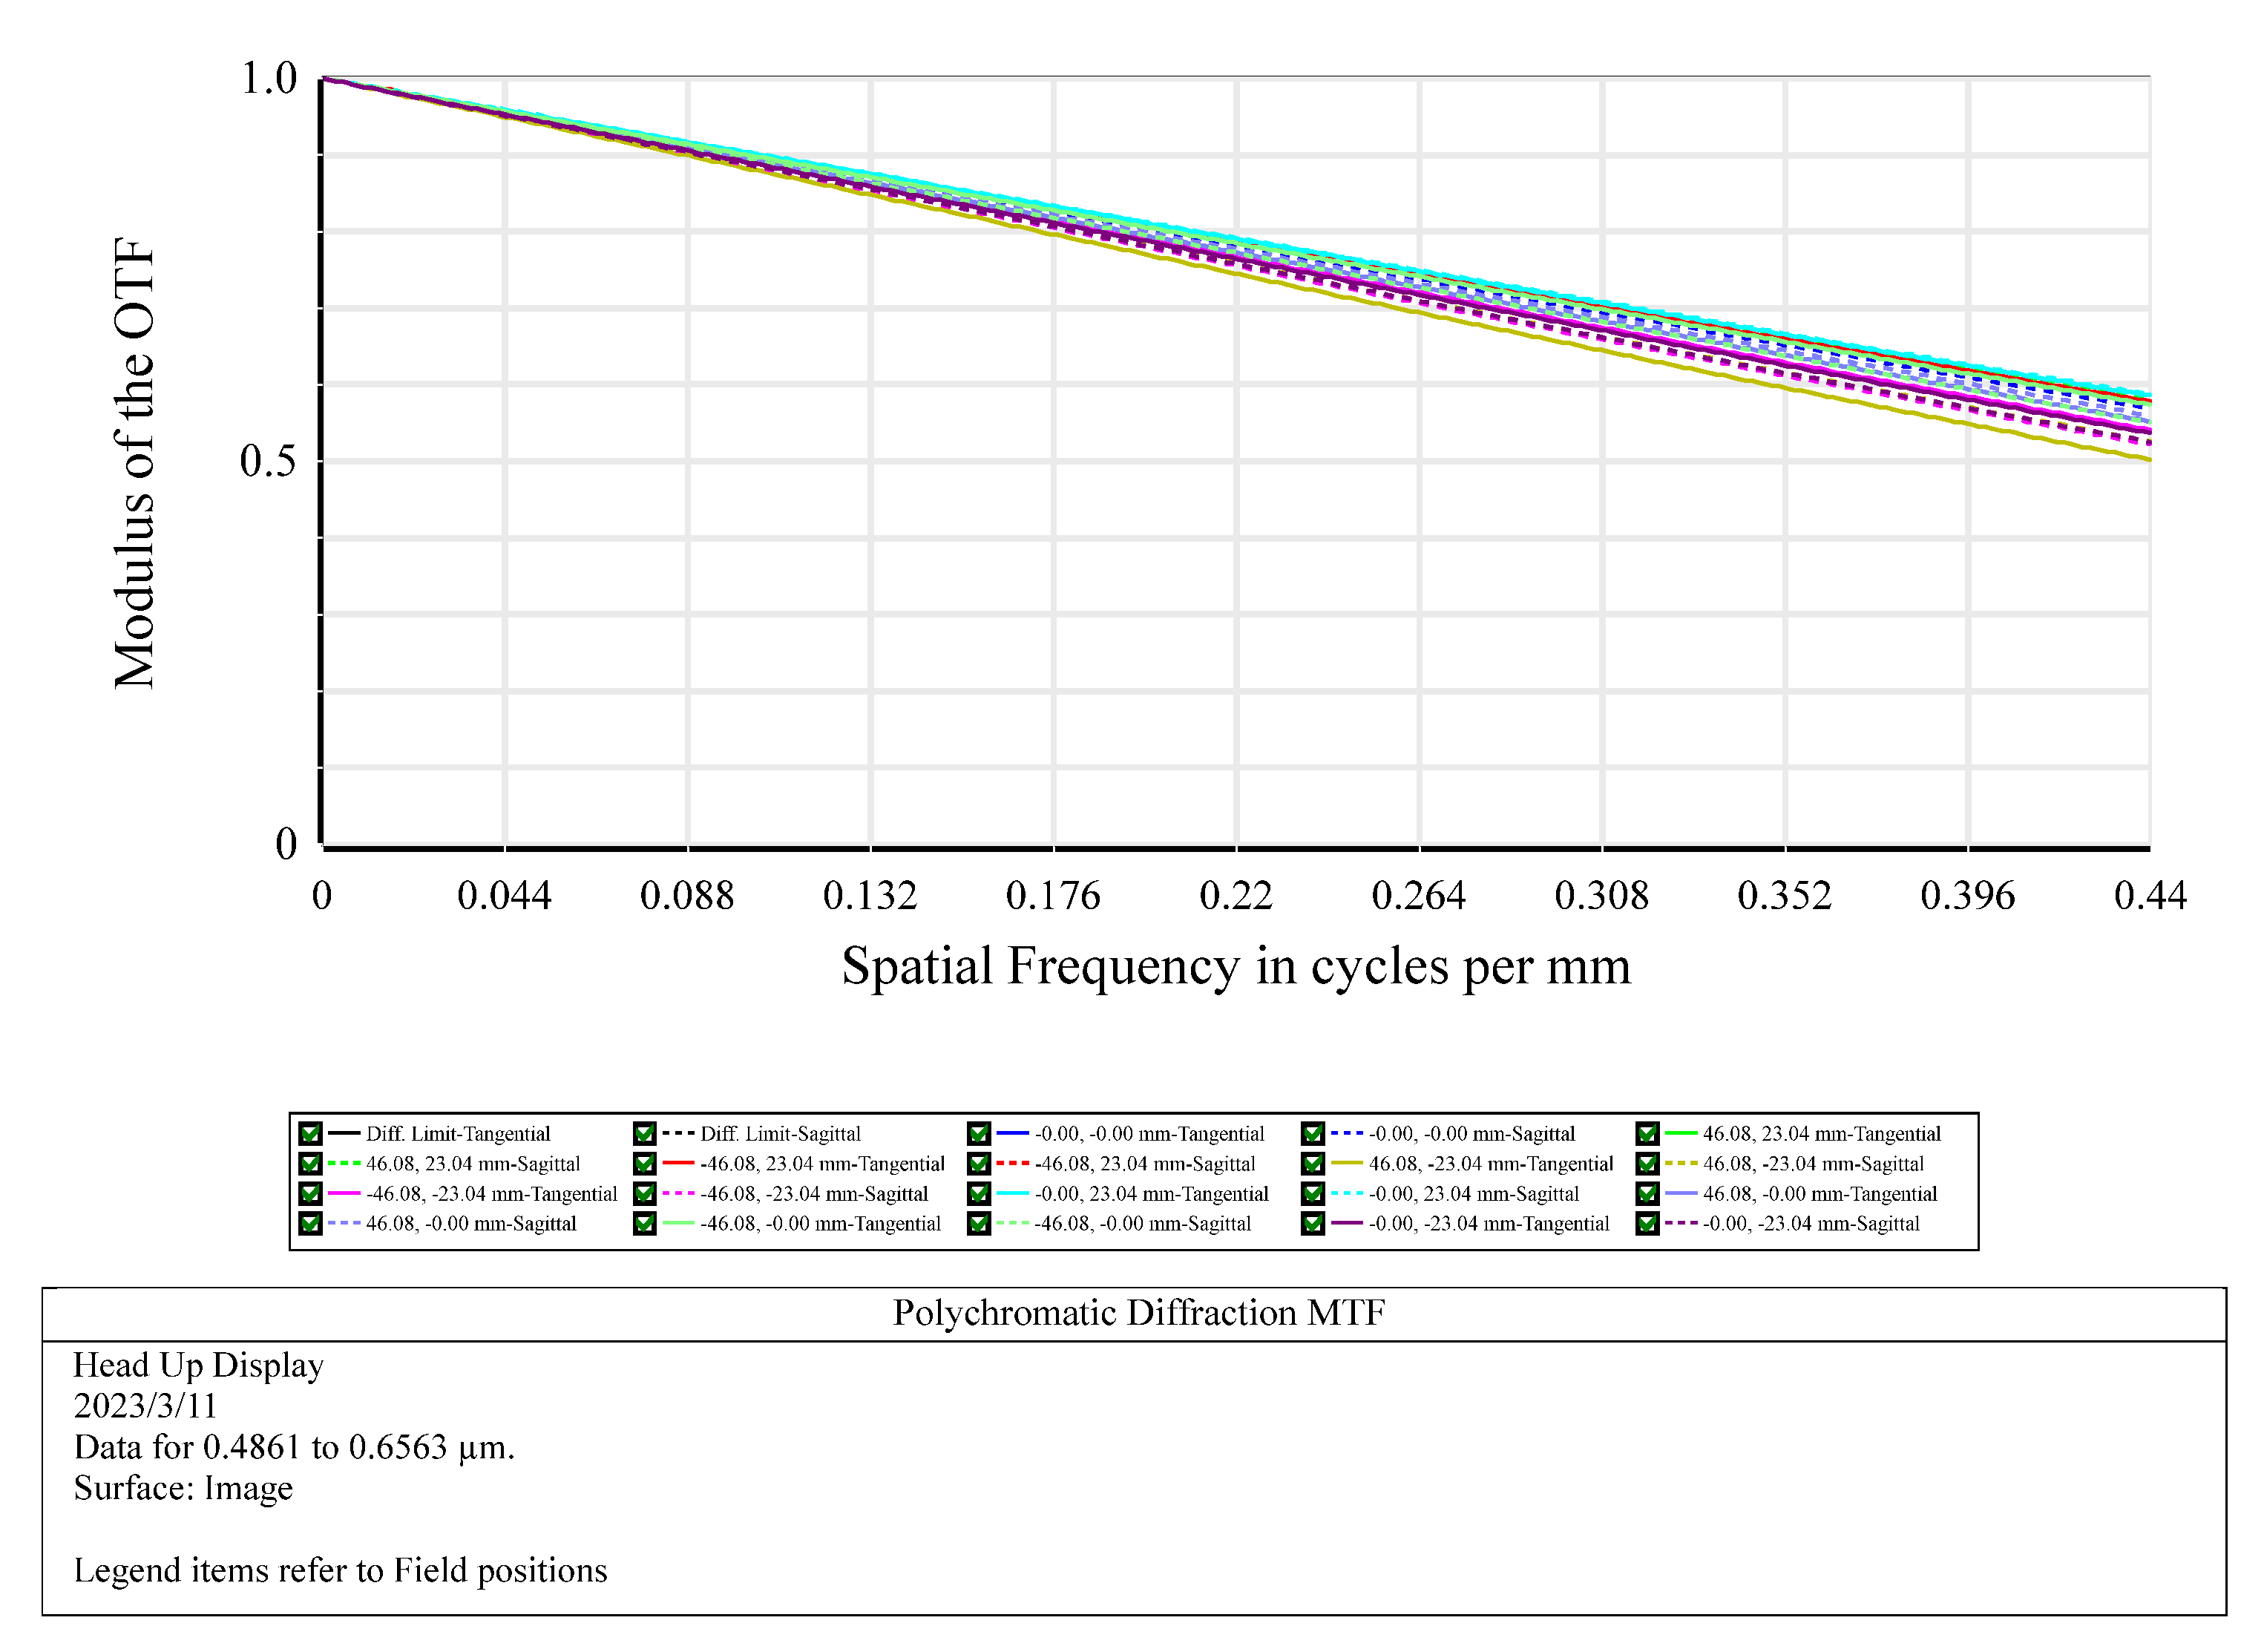
In optical systems, the modulation transfer function (MTF) can be used to describe factors such as image quality, contrast, resolution, and sharpness. The specific calculation process can be referred to in [14]. In general, the MTF curve is expressed as the response to the spatial frequency of the input signal, with a value between 0 and 1, indicating the ability of the system to transmit a certain spatial frequency component. High-quality optical systems typically have high MTF values, which means that they can efficiently transmit signals with a high spatial frequency component, thus providing higher resolution and better image quality. The MTF curve of the AR-HUD system designed in this paper in the image square space is shown in Figure 12 below. The MTF curve of the full field of view is basically greater than 0.5 at the maximum Nyquist frequency of 0.44 lp/mm, and the performance of the entire curve is close to the diffraction limit, indicating that the overall imaging quality is good.
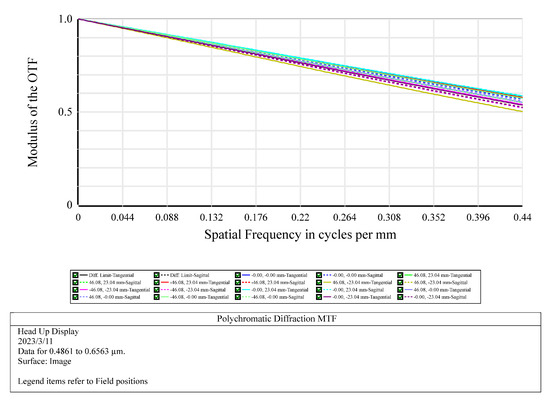
Figure 12.
Modulation transfer function curve of system.
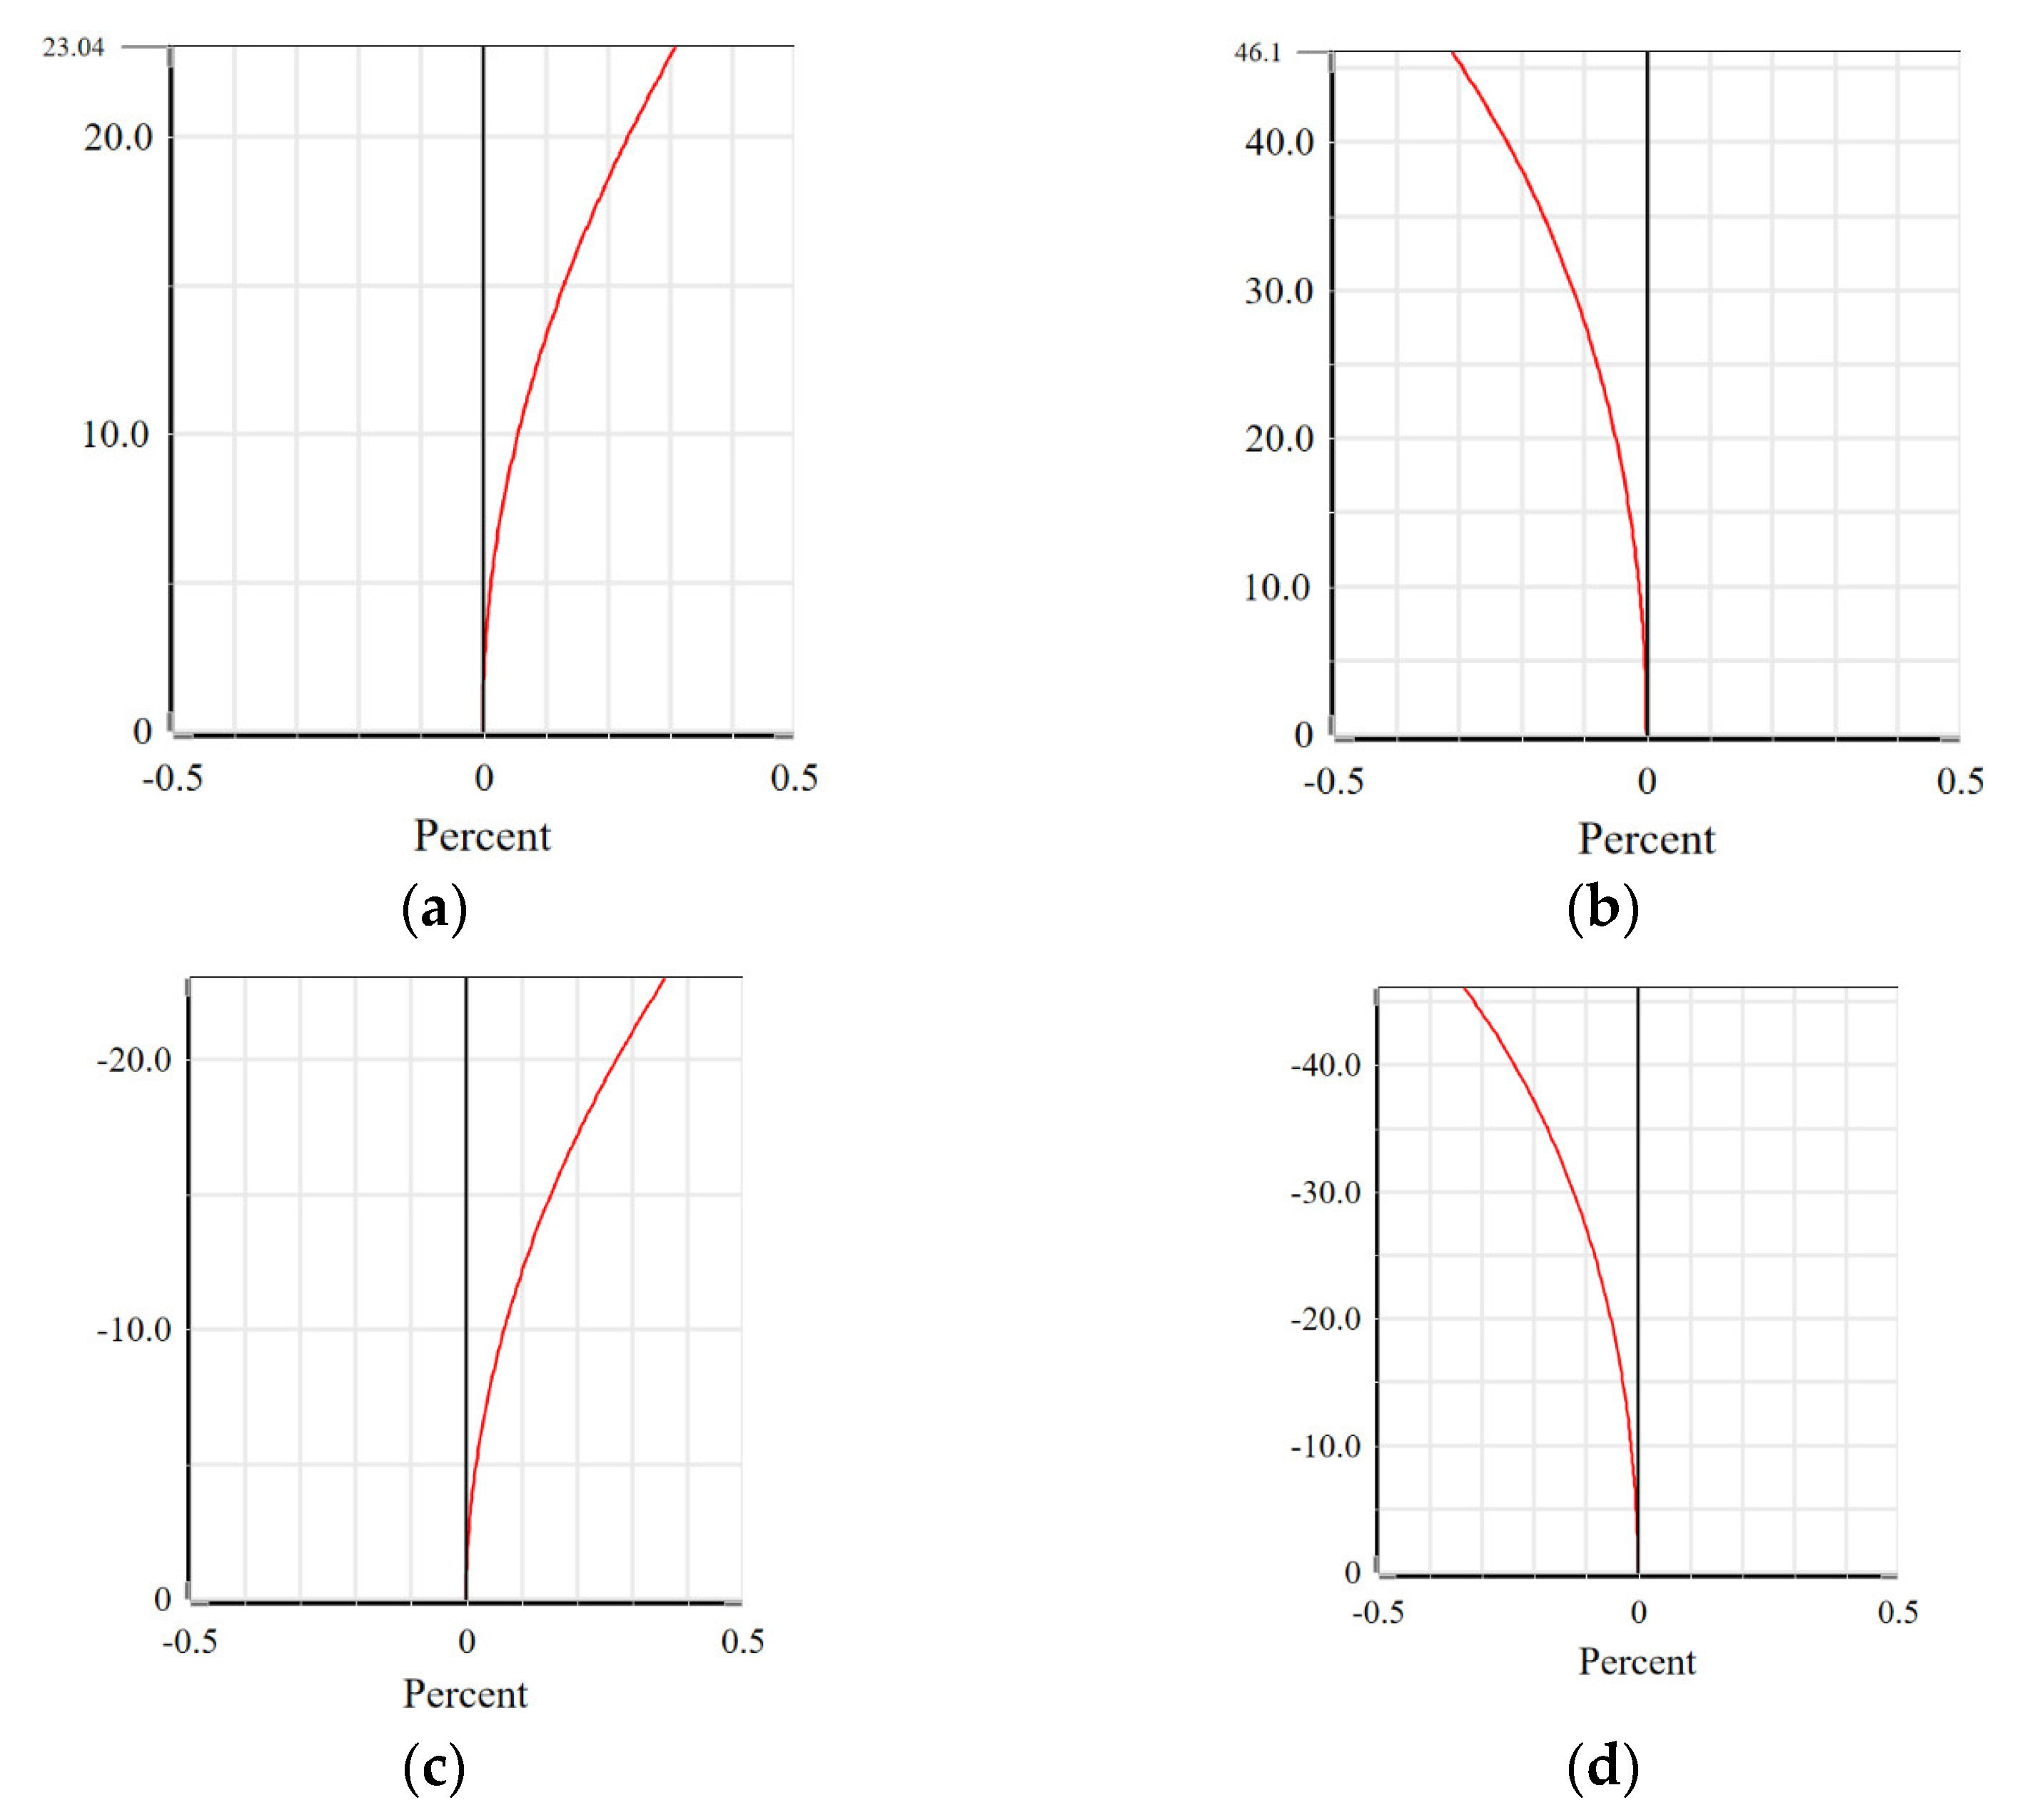
Figure 13a–d below are the distortion maps obtained by the system in the scanning mode of +y, +x, −y, and −x respectively. The distortion values of the system in the four scanning directions are 0.3110%, 0.3111%, 0.3617%, and 0.3342%, which are far less than the set standard value of 2%, indicating that the distortion of the system is small. The results meet the design requirements.
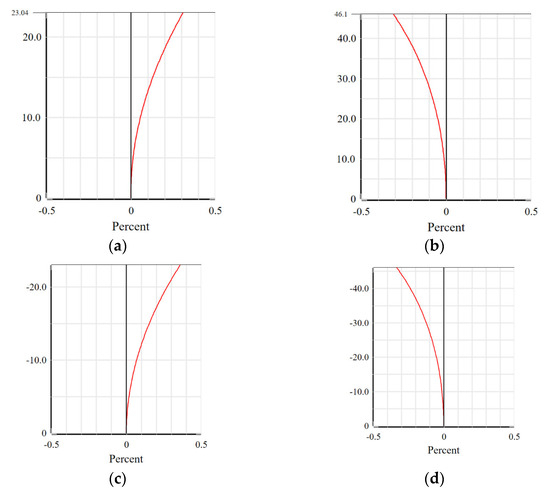
Figure 13.
F-Tan (Theta) distortion: (a) +y direction; (b) +x direction; (c) −y direction; (d) −x direction.
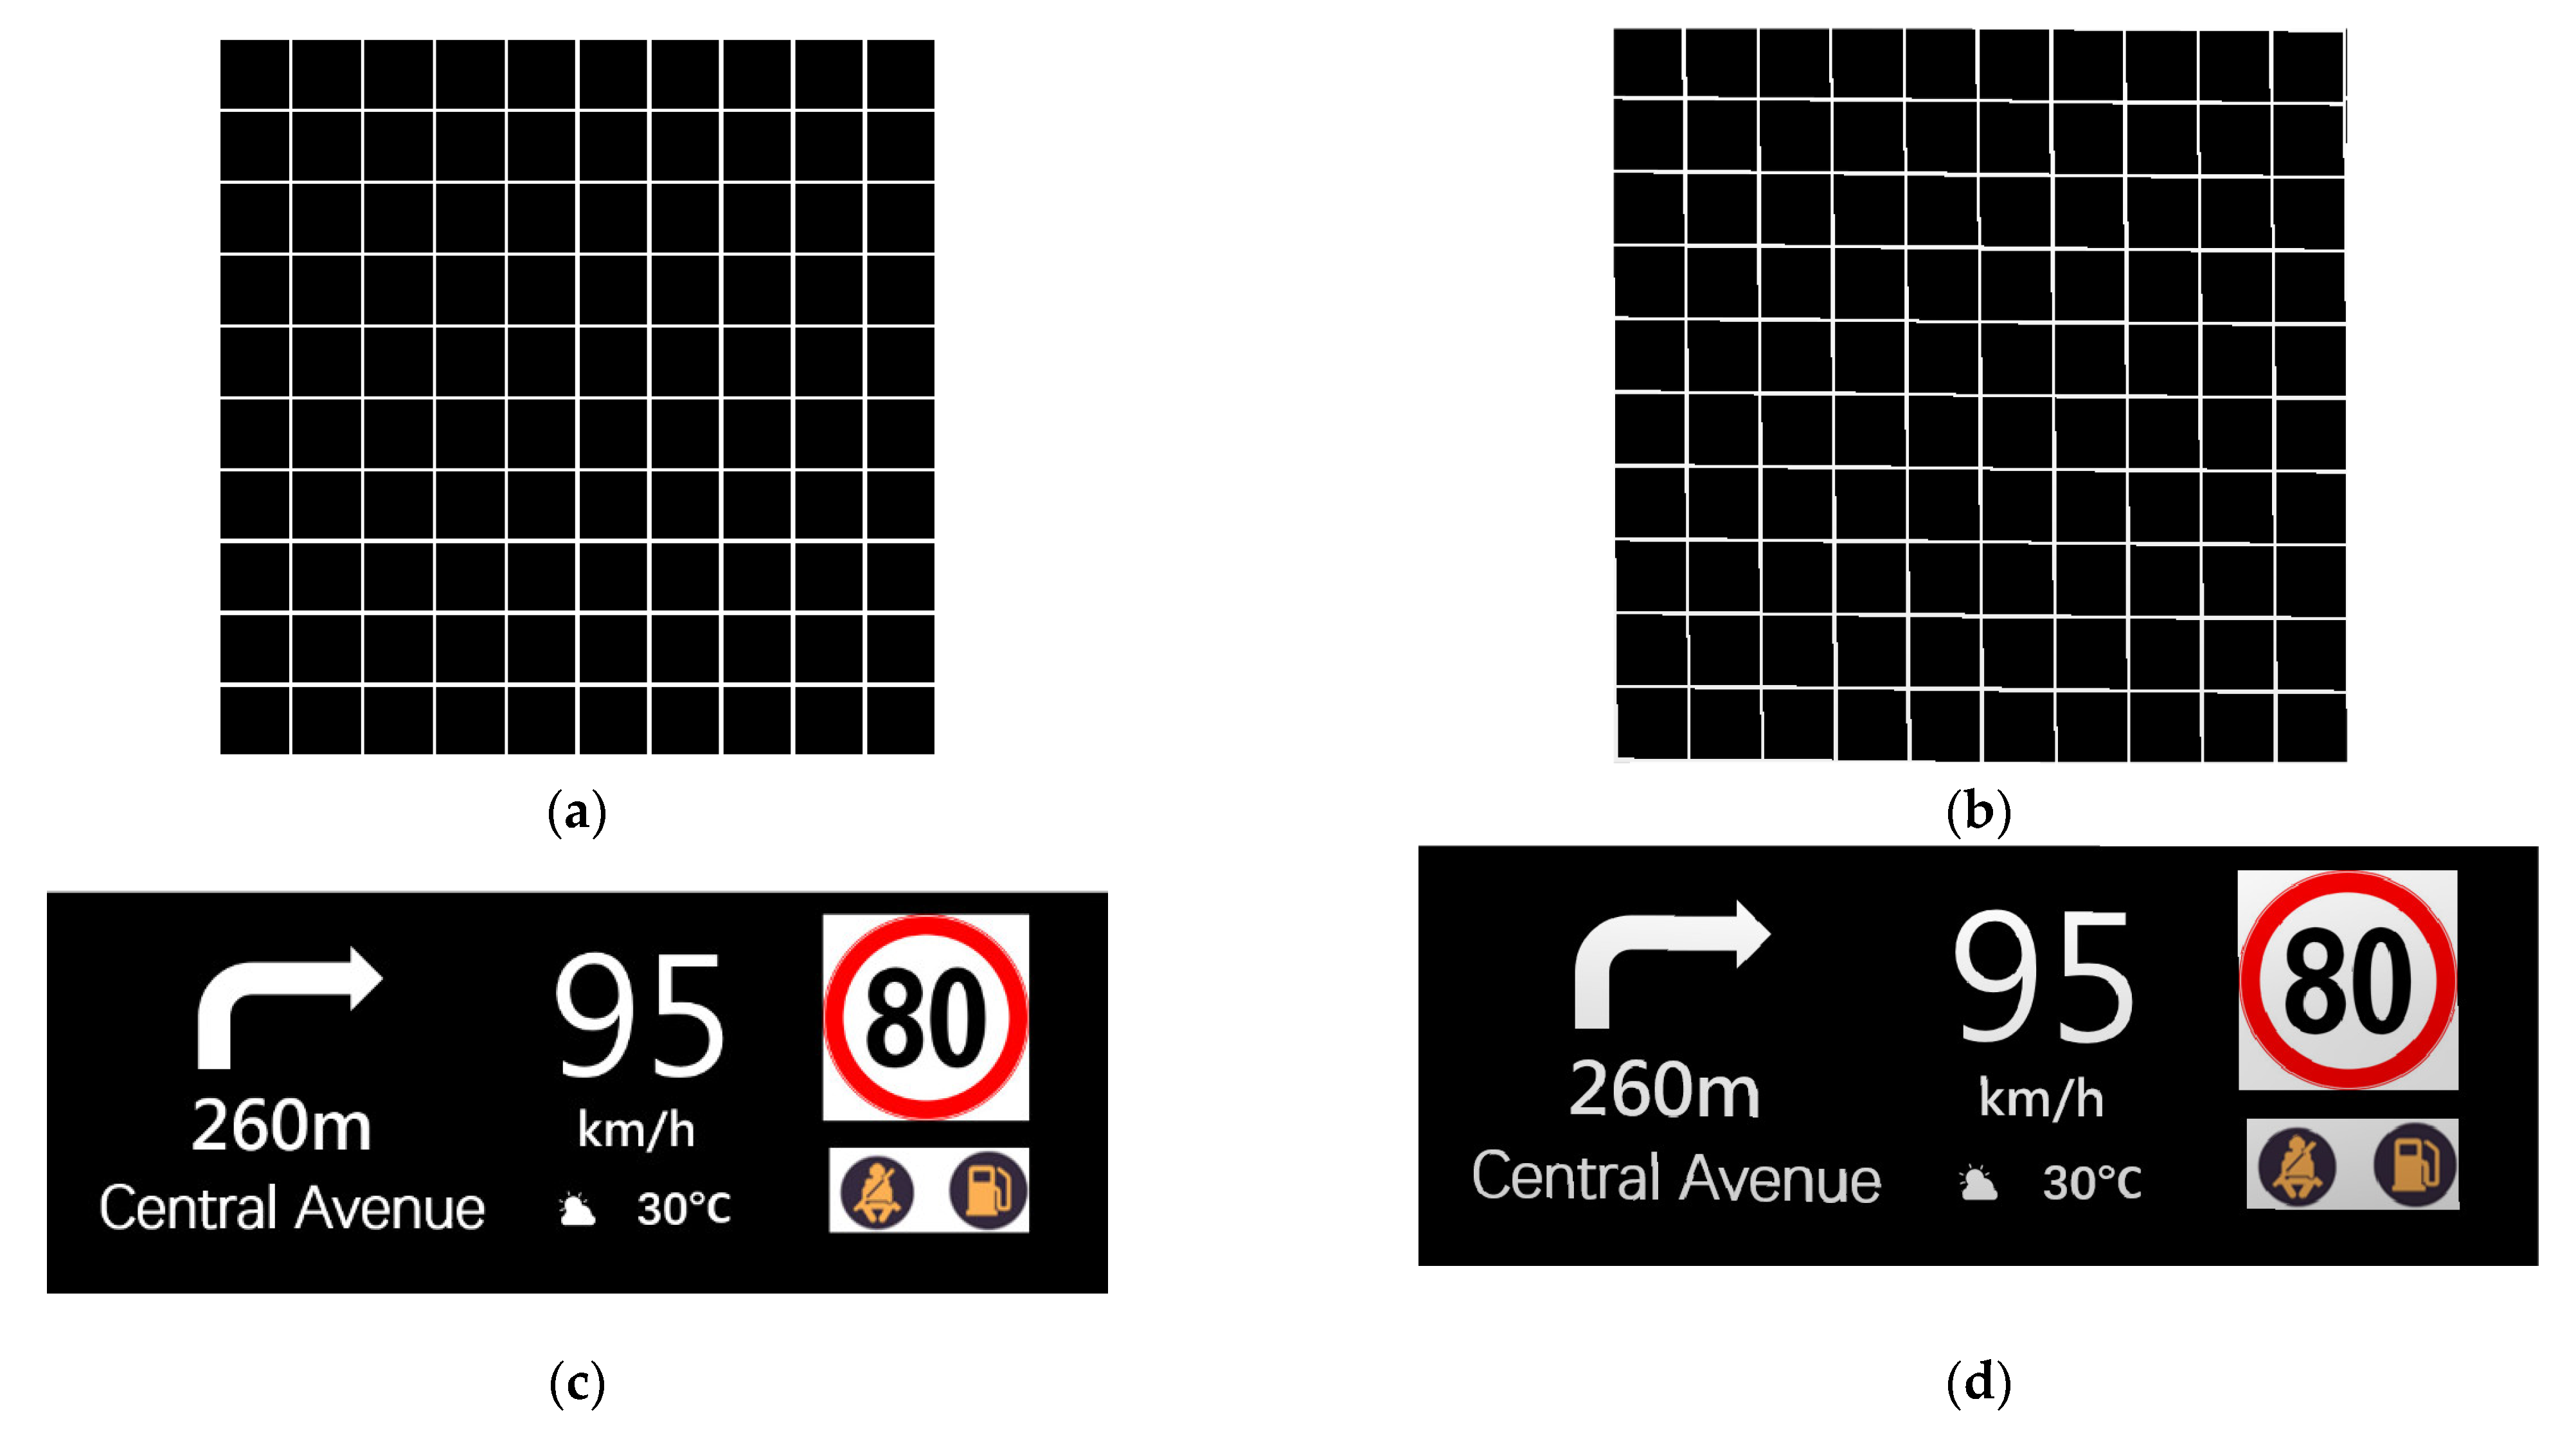
The image simulation tool provided by Zemax software (OpticStudio 19.4 Premium) is used to simulate and analyze the imaging performance of the system, and the original optical position image is compared with the simulation image to reflect the effect of the system in actual imaging. The specific effect is shown in Figure 14 below. It can be seen from the grid simulation diagram that the system has a slight tilt to the left during imaging, and some image details are missing. However, in the actual navigation image simulation, the information can be displayed normally, without affecting the effective transmission of information, and the system can meet the actual application requirements.
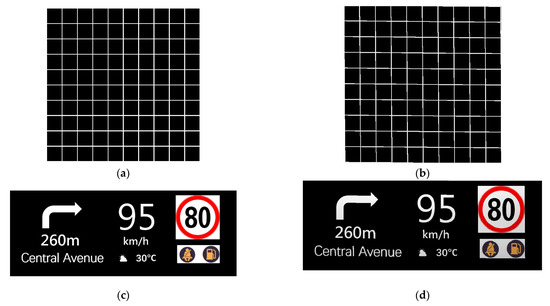
Figure 14.
Actual imaging display: (a) grid source bitmap; (b) grid simulated image; (c) actual source bitmap; (d) actual simulated image.
5. Conclusions
By analyzing AR-HUD structure, this paper proposes an initial structure design method based on the Rodrigues rotation formula, which effectively solves the complicated problem of initial HUD structure construction. At the same time, using the off-axis three-mirror system anti-occlusion solution, the position of the mirror in the HUD system is restricted by constraints, which solves the problem that the system structure is easy to run off and the light is blocked in the process of software optimization. Finally, the simulation analysis of the designed system shows that system distortion is controlled within 2%, the virtual image plane of the system is at a Nyquist spatial frequency of 0.44 lp/mm, the MTF value of the full field of view is close to 0.5, and the simulation image has a good imaging effect that can meet the requirements of human eye observation, proving the correctness and effectiveness of the structural design. It provides some references for the subsequent initial structure design and control of AR-HUDs.
Author Contributions
Formal analysis, Y.Y., H.C. and Z.W.; investigation, Y.Y. and H.C.; methodology, Y.Y. and H.C.; software, Y.Y. and Z.W.; validation, Z.W. and H.C.; resources, Z.W.; writing—original draft preparation, Y.Y.; writing—review and editing, Z.W.; visualization, Z.W.; supervision, H.C.; project administration, H.C. and Z.W. All authors have read and agreed to the published version of the manuscript.
Funding
This paper is supported by the “Yang Fan” major project in Guangdong Province, China, No. 2020-05-1.
Institutional Review Board Statement
Not applicable.
Informed Consent Statement
Not applicable.
Data Availability Statement
Data are contained within the article.
Conflicts of Interest
The authors declare no conflict of interest.
References
- Guo, W.; Yan, D.; Liu, T.; Zhang, Z. Technical Challenge and Solution for Vehicle-Mounted AR-HUD Mass Commercial Application. In Proceedings of the International Conference on Optoelectronic and Microelectronic Technology and Application, Nanjing, China, 20–22 October 2020. [Google Scholar]
- Park, H.S. In-Vehicle AR-HUD System to Provide Driving-Safety Information. ETRI J. 2013, 35, 1038–1047. [Google Scholar] [CrossRef]
- Chen, Y.; Xu, J. Application of Augmented Reality in Automobile Design. Design 2021, 34, 82–85. [Google Scholar]
- An, Z.; Xu, X.; Yang, J.; Qiao, Y.; Liu, Y. Design of Augmented Reality Head-up Display System Based on Image Semantic Segmentation. Acta Photonica Sin. 2018, 38, 77–83. [Google Scholar]
- Wiesner, C.A.; Ruf, M.; Sirim, D.; Klinker, G. 3D-FRC: Depiction of the Future Road Course in the Head-Up-Display. In Proceedings of the IEEE International Symposium on Mixed and Augmented Reality (ISMAR), Nantes, France, 9–13 October 2017. [Google Scholar]
- Huang, X.; Hu, S.; Tang, G.; Yang, P.; Xu, B.; Zhang, G. Optical structure design of automotive head-up display with long-distance imaging. J. Appl. Opt. 2019, 40, 894–900. [Google Scholar]
- Chen, X.; Cao, Y.; Xue, J.; Ren, J.; Wang, B.; Wu, S. Optimal Design of Optical Module for Double Freeform Head-up Display System. Laser Optoelectron. Prog. 2022, 60, 360–366. [Google Scholar]
- Wei, S.; Fan, Z.; Zhu, Z.; Ma, D. Design of a Head-up Display Based on Freeform Reflective Systems for Automotive Applications. Appl. Opt. 2019, 58, 1675. [Google Scholar] [CrossRef] [PubMed]
- Zhang, Y.; Su, Z.; Pan, H.; Chen, X.; Zhang, W. Optical Design and Tolerance Analysis of Freeform Automotive Head-up Display. Acta Photonica Sin. 2020, 49, 44–55. [Google Scholar]
- Bremers, A.W.; Yöntem, A.Ö.; Li, K.; Chu, D.; Meijering, V.; Janssen, C.P. Perception of Perspective in Augmented Reality Head-up Displays. Int. J. Hum. Comput. Stud. 2021, 155, 102693. [Google Scholar]
- Jazar, R.N. Theory of Applied Robotics: Kinematics, Dynamics, and Control, 2nd ed.; Springer: Cham, Switzerland, 2010. [Google Scholar]
- Chen, T.; Wu, Y.; Song, S.; Li., S. Design and Alignment of Folded Off-Axis Three-Mirror Optical System. Laser Optoelectron. Prog. 2021, 58, 355–361. [Google Scholar]
- Luo, Q.; Zhang, D.; Niu, X. Optical Design of Off-axis Three-mirror System with Wide Field. Infrared 2017, 38, 14–18. [Google Scholar]
- Zhuang, S.; Qian, Z. Modulation Transfer Function, 1st ed.; China Machine Press: Beijing, China, 1981; pp. 256–264. [Google Scholar]


Disclaimer/Publisher’s Note: The statements, opinions and data contained in all publications are solely those of the individual author(s) and contributor(s) and not of MDPI and/or the editor(s). MDPI and/or the editor(s) disclaim responsibility for any injury to people or property resulting from any ideas, methods, instructions or products referred to in the content. |
© 2023 by the authors. Licensee MDPI, Basel, Switzerland. This article is an open access article distributed under the terms and conditions of the Creative Commons Attribution (CC BY) license (https://creativecommons.org/licenses/by/4.0/).