
Detection and Evaluation of Construction Cracks through Image Analysis Using Computer Vision

 ,
,  , and
, and
Abstract
:1. Introduction
State of the Art
2. Materials and Methods
2.1. General Operation
2.2. YOLOv4
2.3. Instruments
2.4. Training
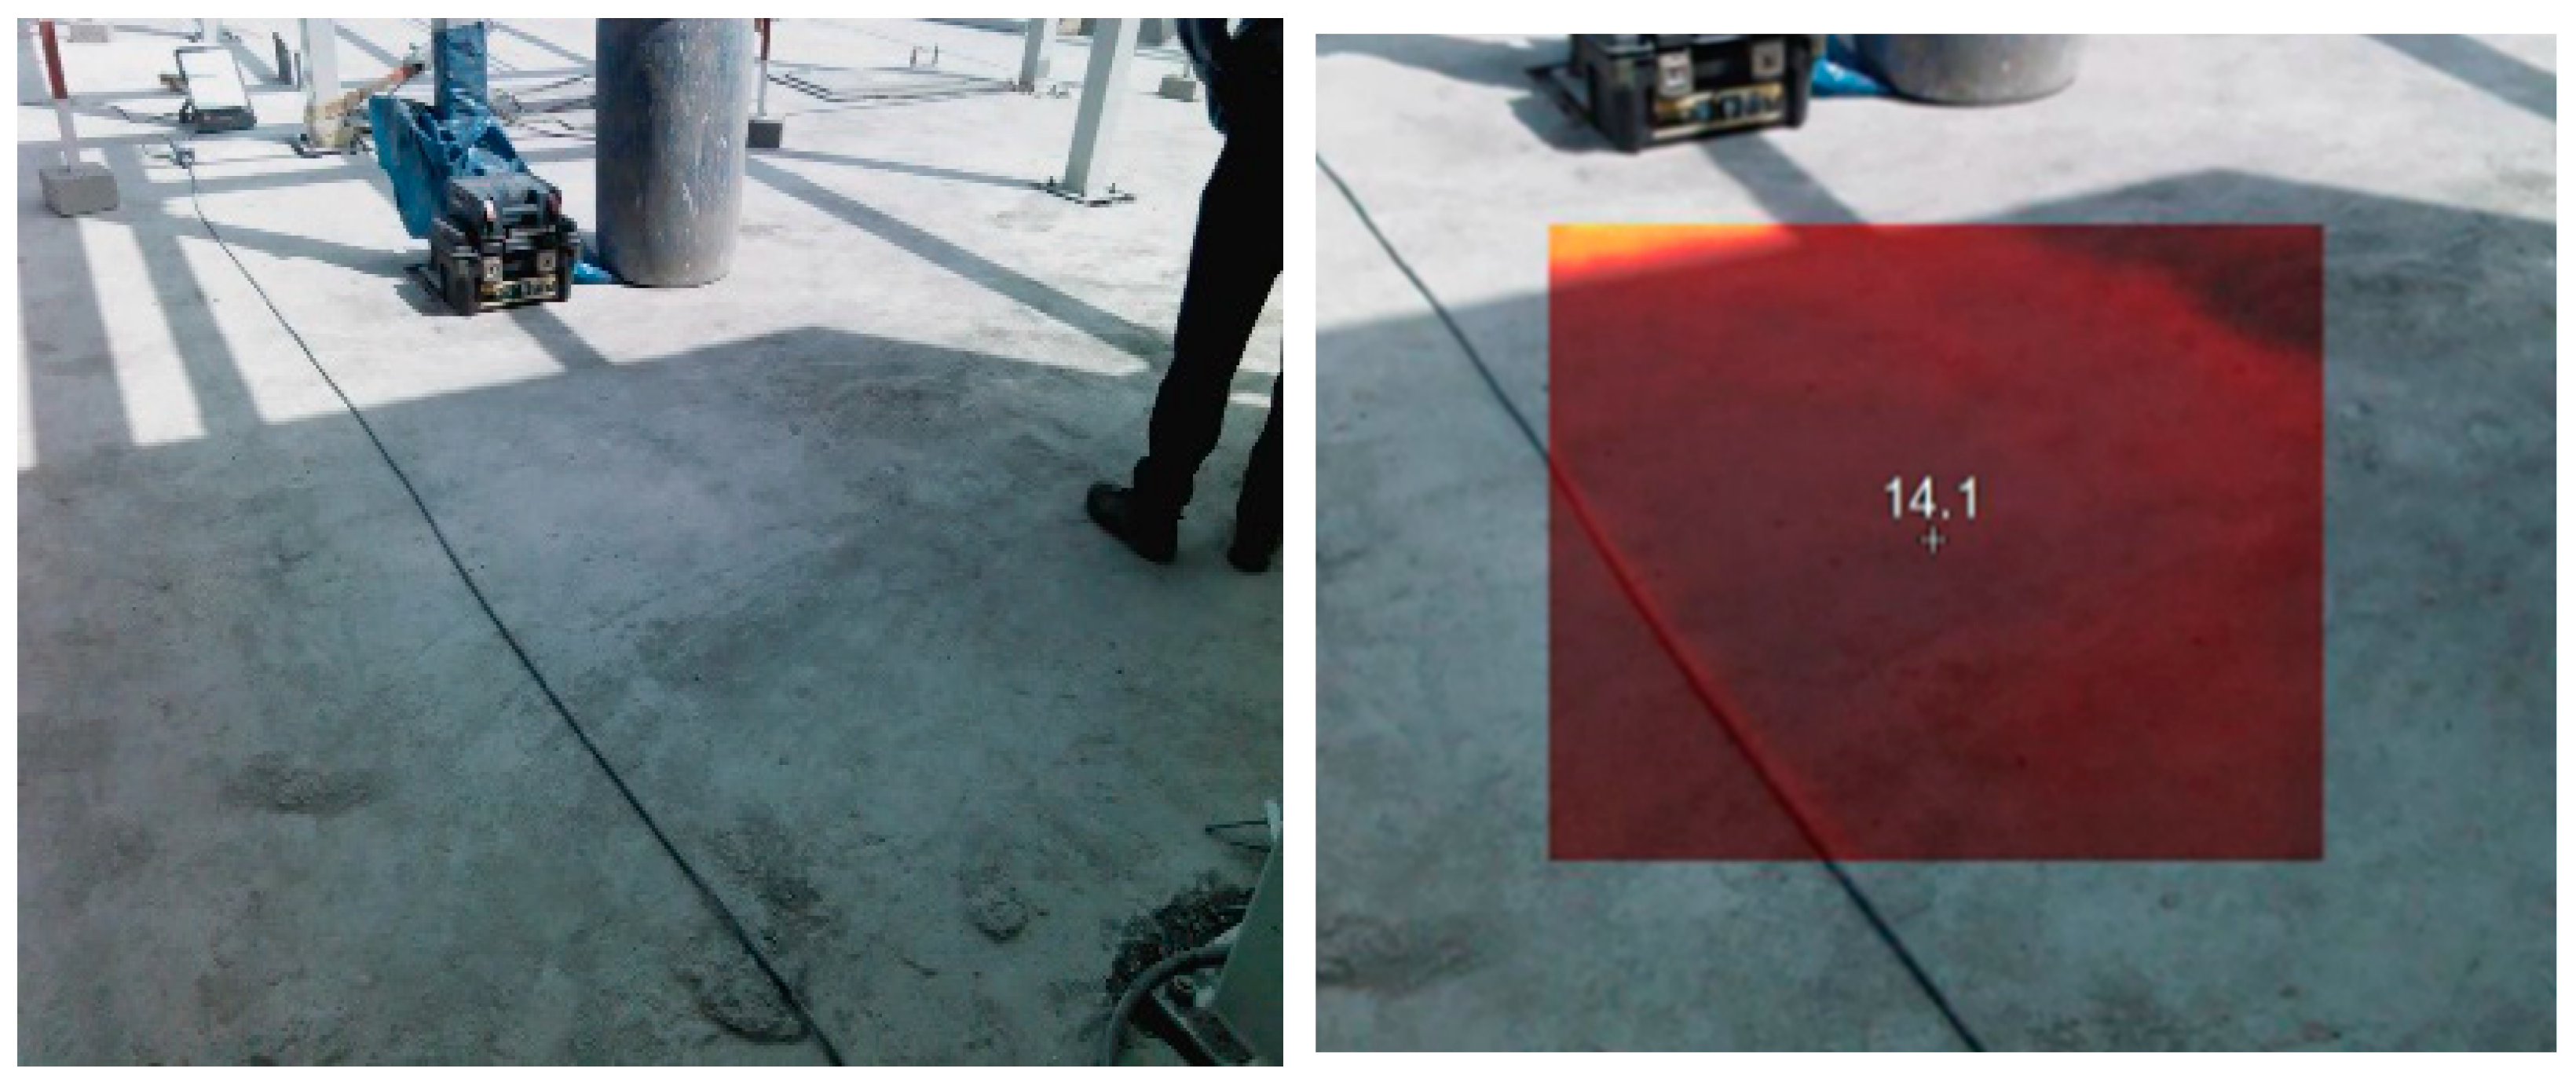
Thermal Camera
2.5. Model Development
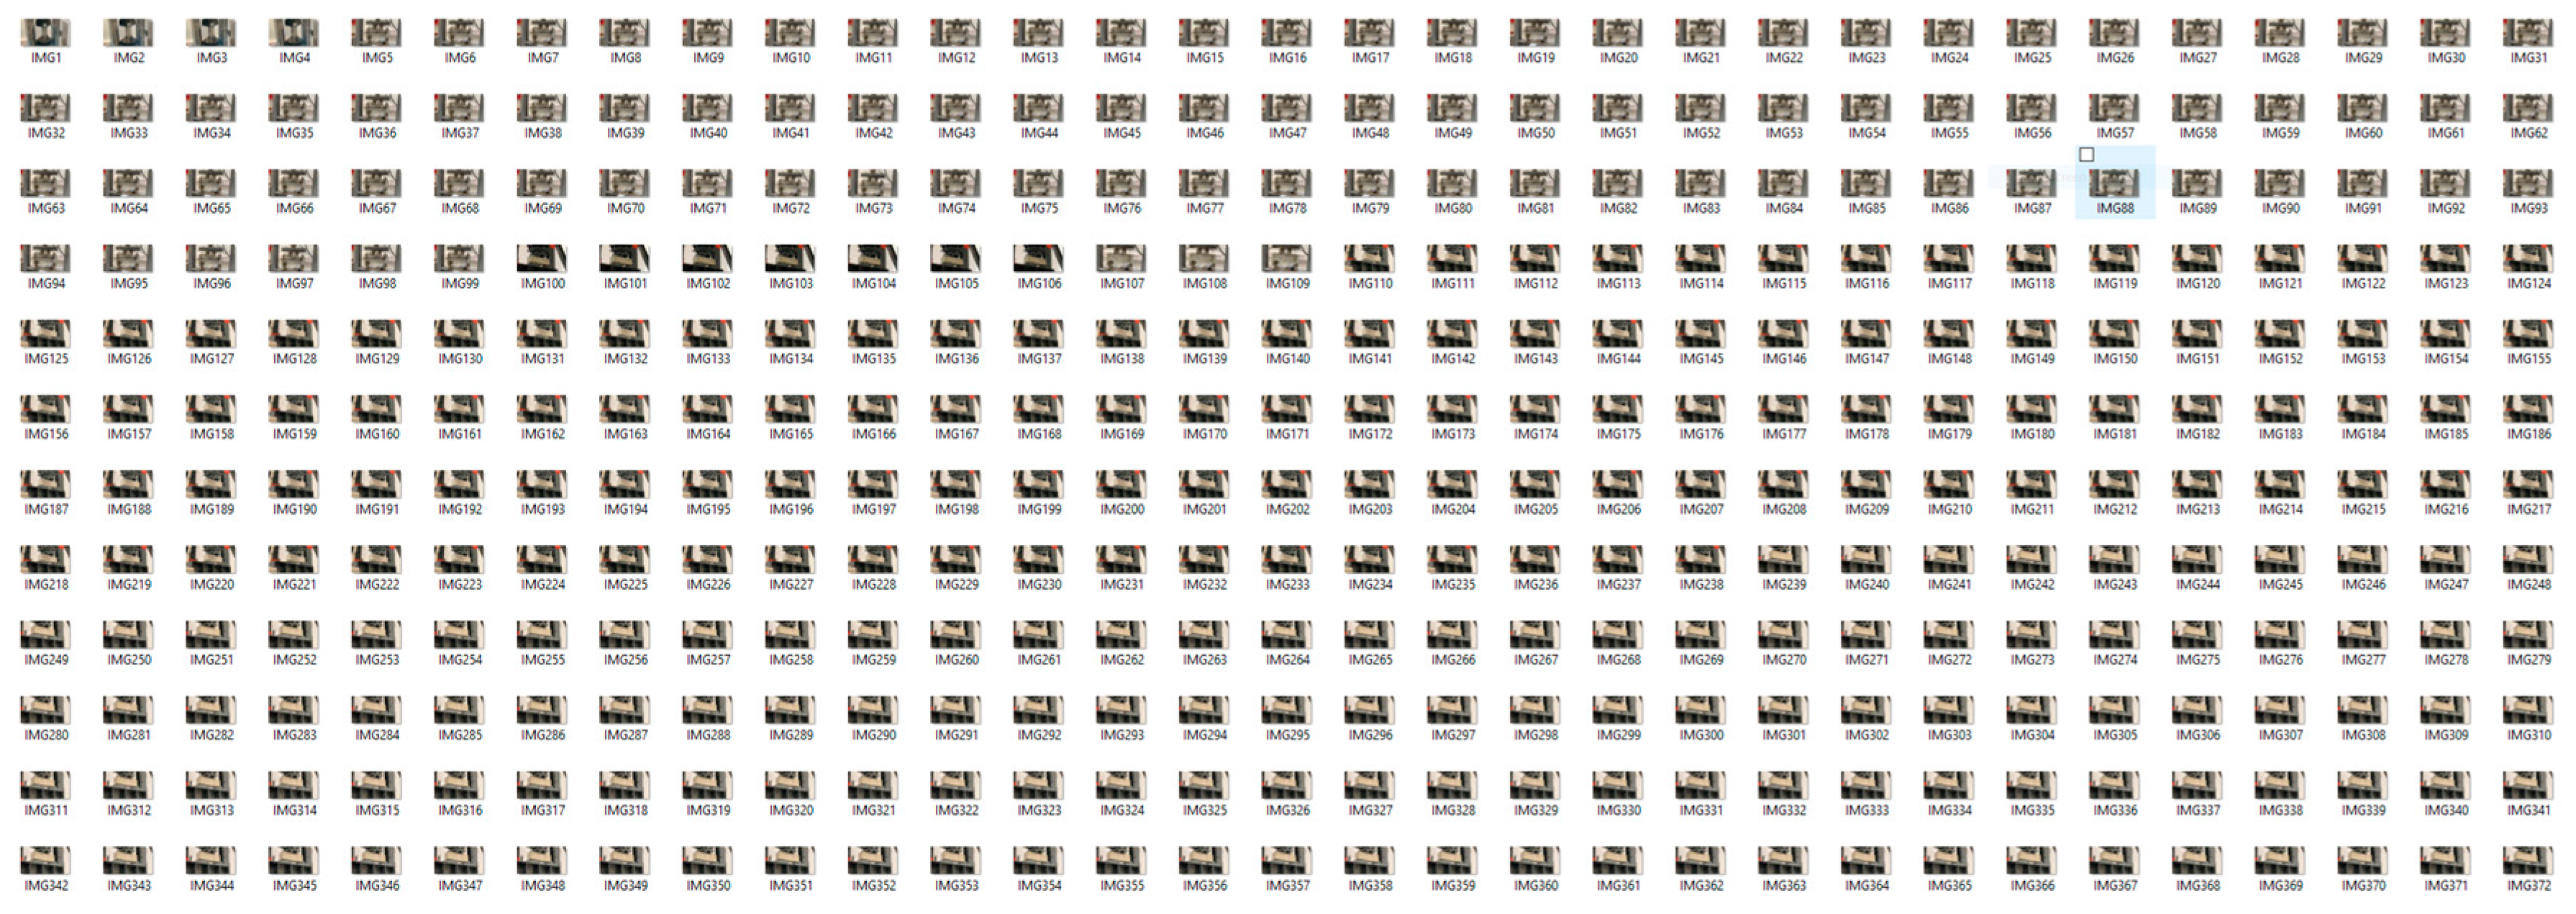
2.5.1. Frame Extraction
| Algorithm 1. Frame extraction algorithm |
|
| Video file reading path |
|
|
|
|
|
|
|
|
|
|
|
|
| Configuration and results: |
| Libraries used: decord, cv2, numpy, pathlib, os |
| Total generated images: 2929 |
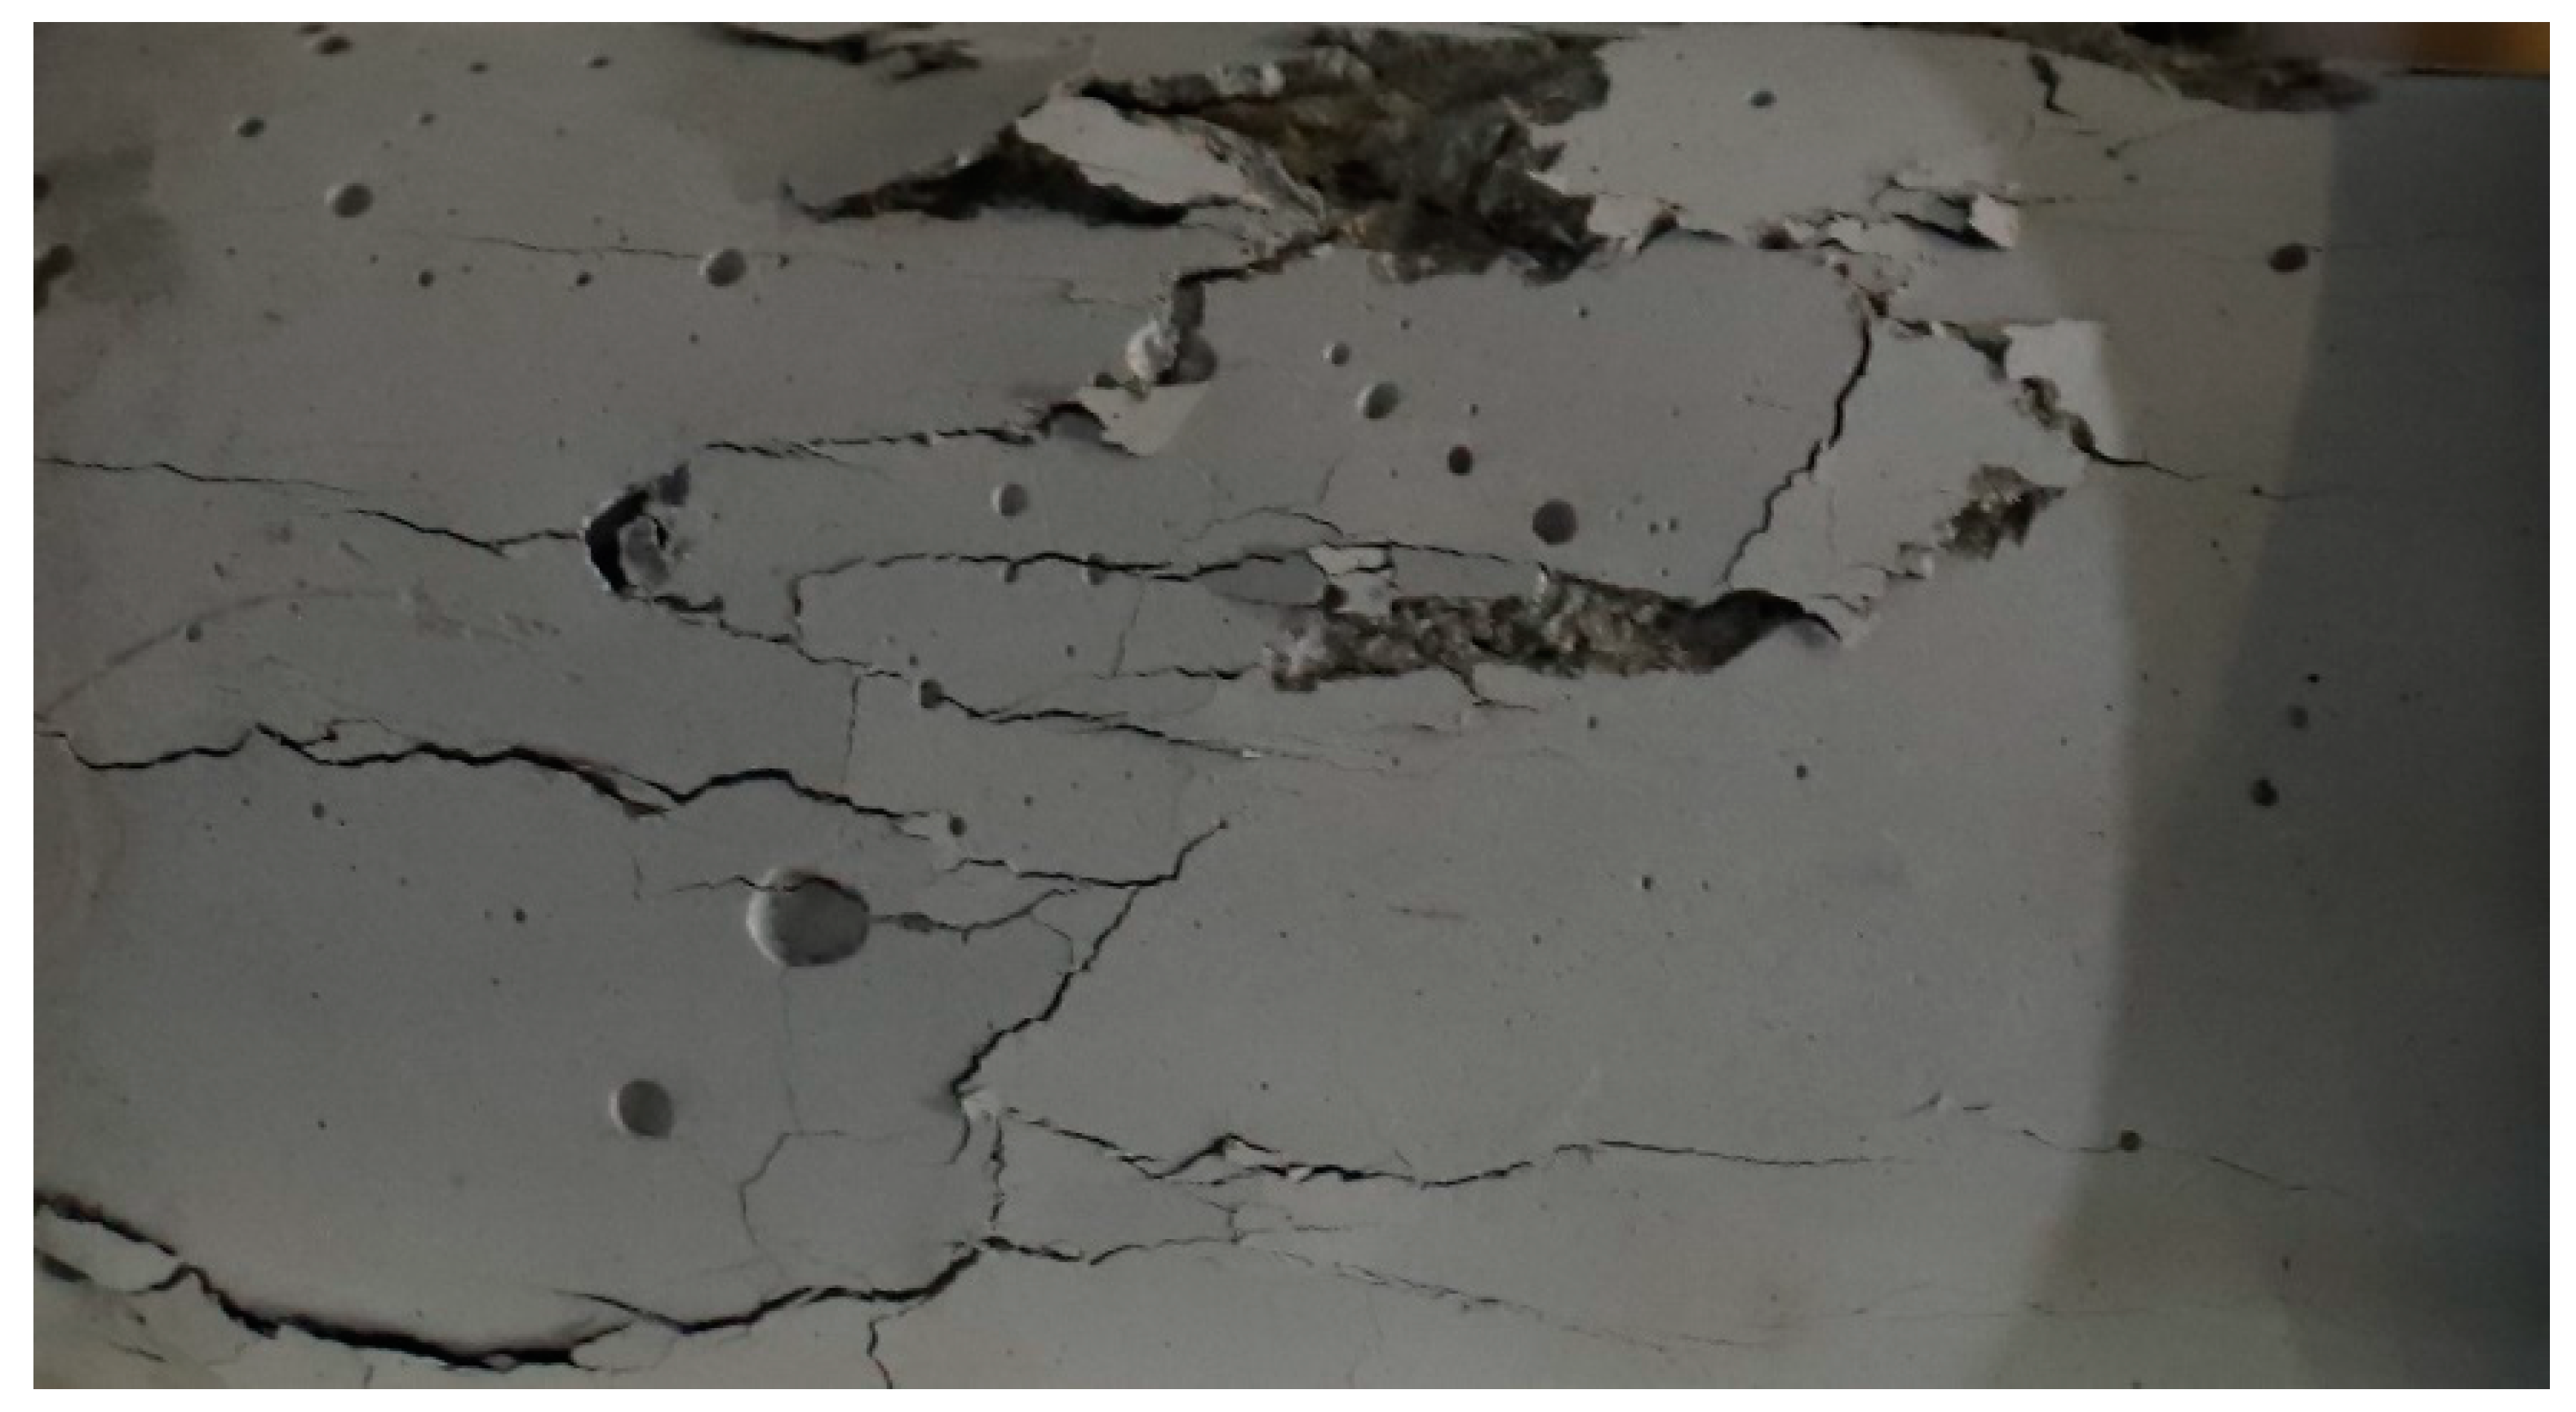
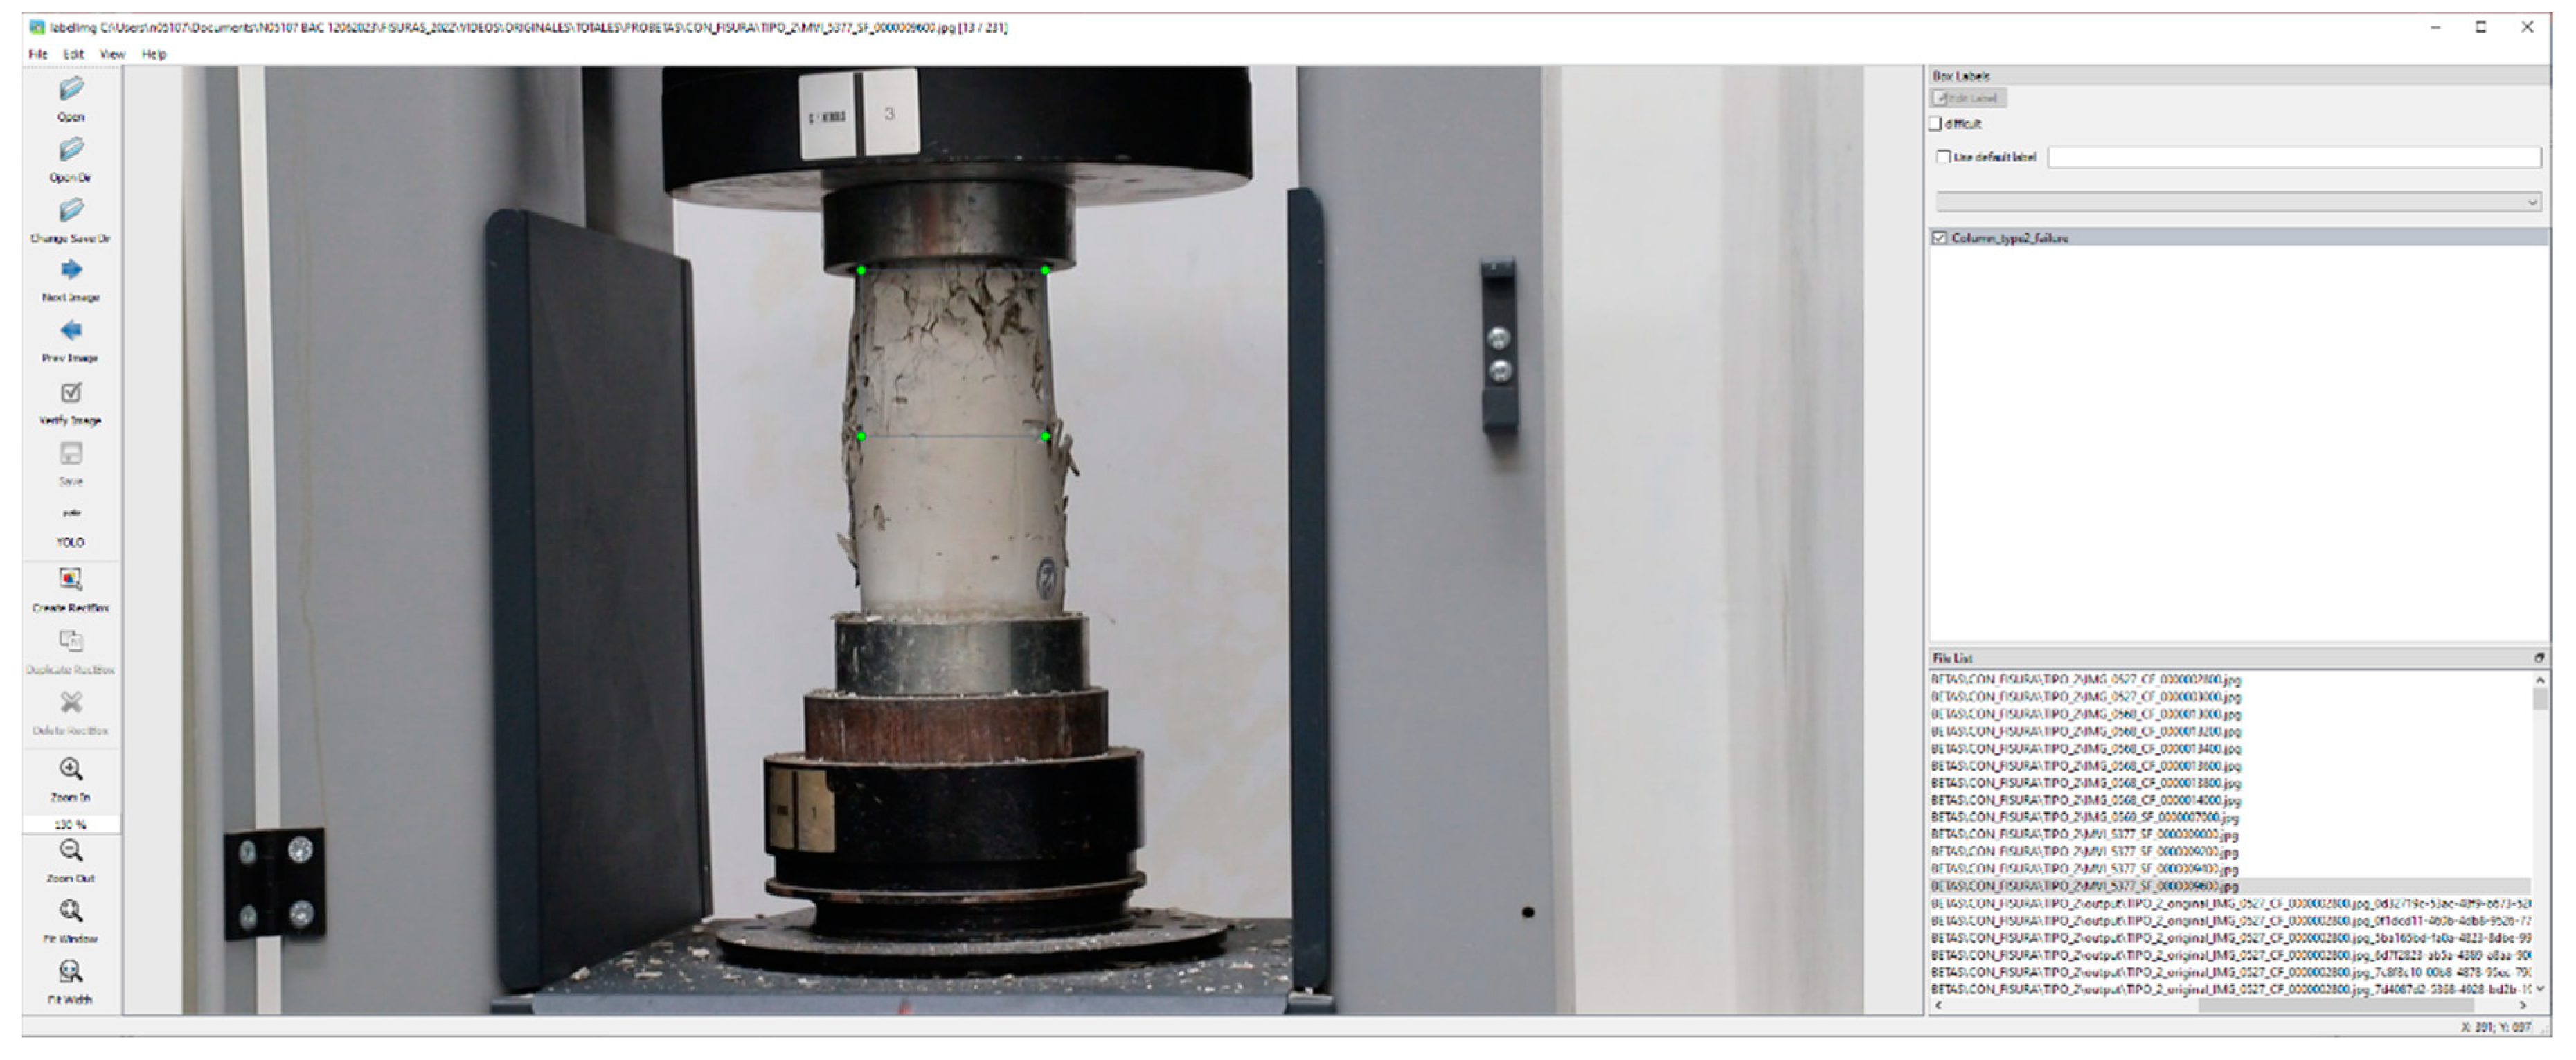
2.6. Manual Image Classification
- Cracks originated in the plastic state.
- Cracks caused by plastic contraction. The leading causes from which this type of crack usually originates are hydraulic shrinkage during setting and excessive vibration or trowel.
- Cracks originated from the plastic settlement due to four factors: little coating and excessive diameters in the steel, changes in consistency in continuous pours, displacement of the formwork, and deformation of the supporting ground.
- Cracks originated in the hardened state, among which cracks originated by spontaneous movements caused by: contraction due to carbonation and thermal shrinkage; numbness due to thermal expansion, excessive oxidation of reinforcing steel, or excess expansive in cement; and alkali-aggregate reaction.

| Type | Image | Area Detail |
|---|---|---|
| Type 2 | 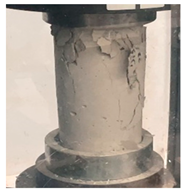 | 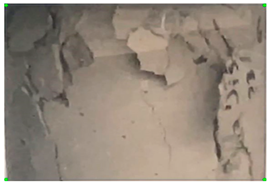 |
| Type 3 |  | 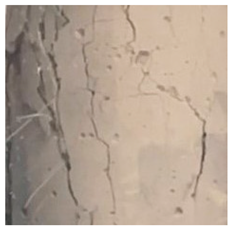 |
| Type 4 | 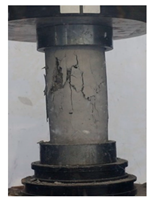 | 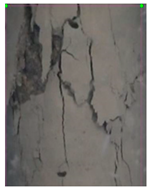 |
| Type 5 |  | 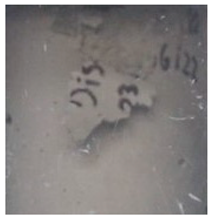 |
| Beam | 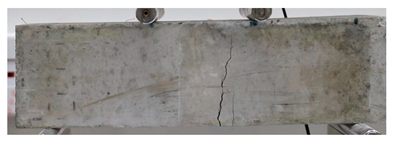 | 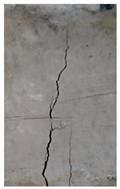 |
2.7. Neural Network Training
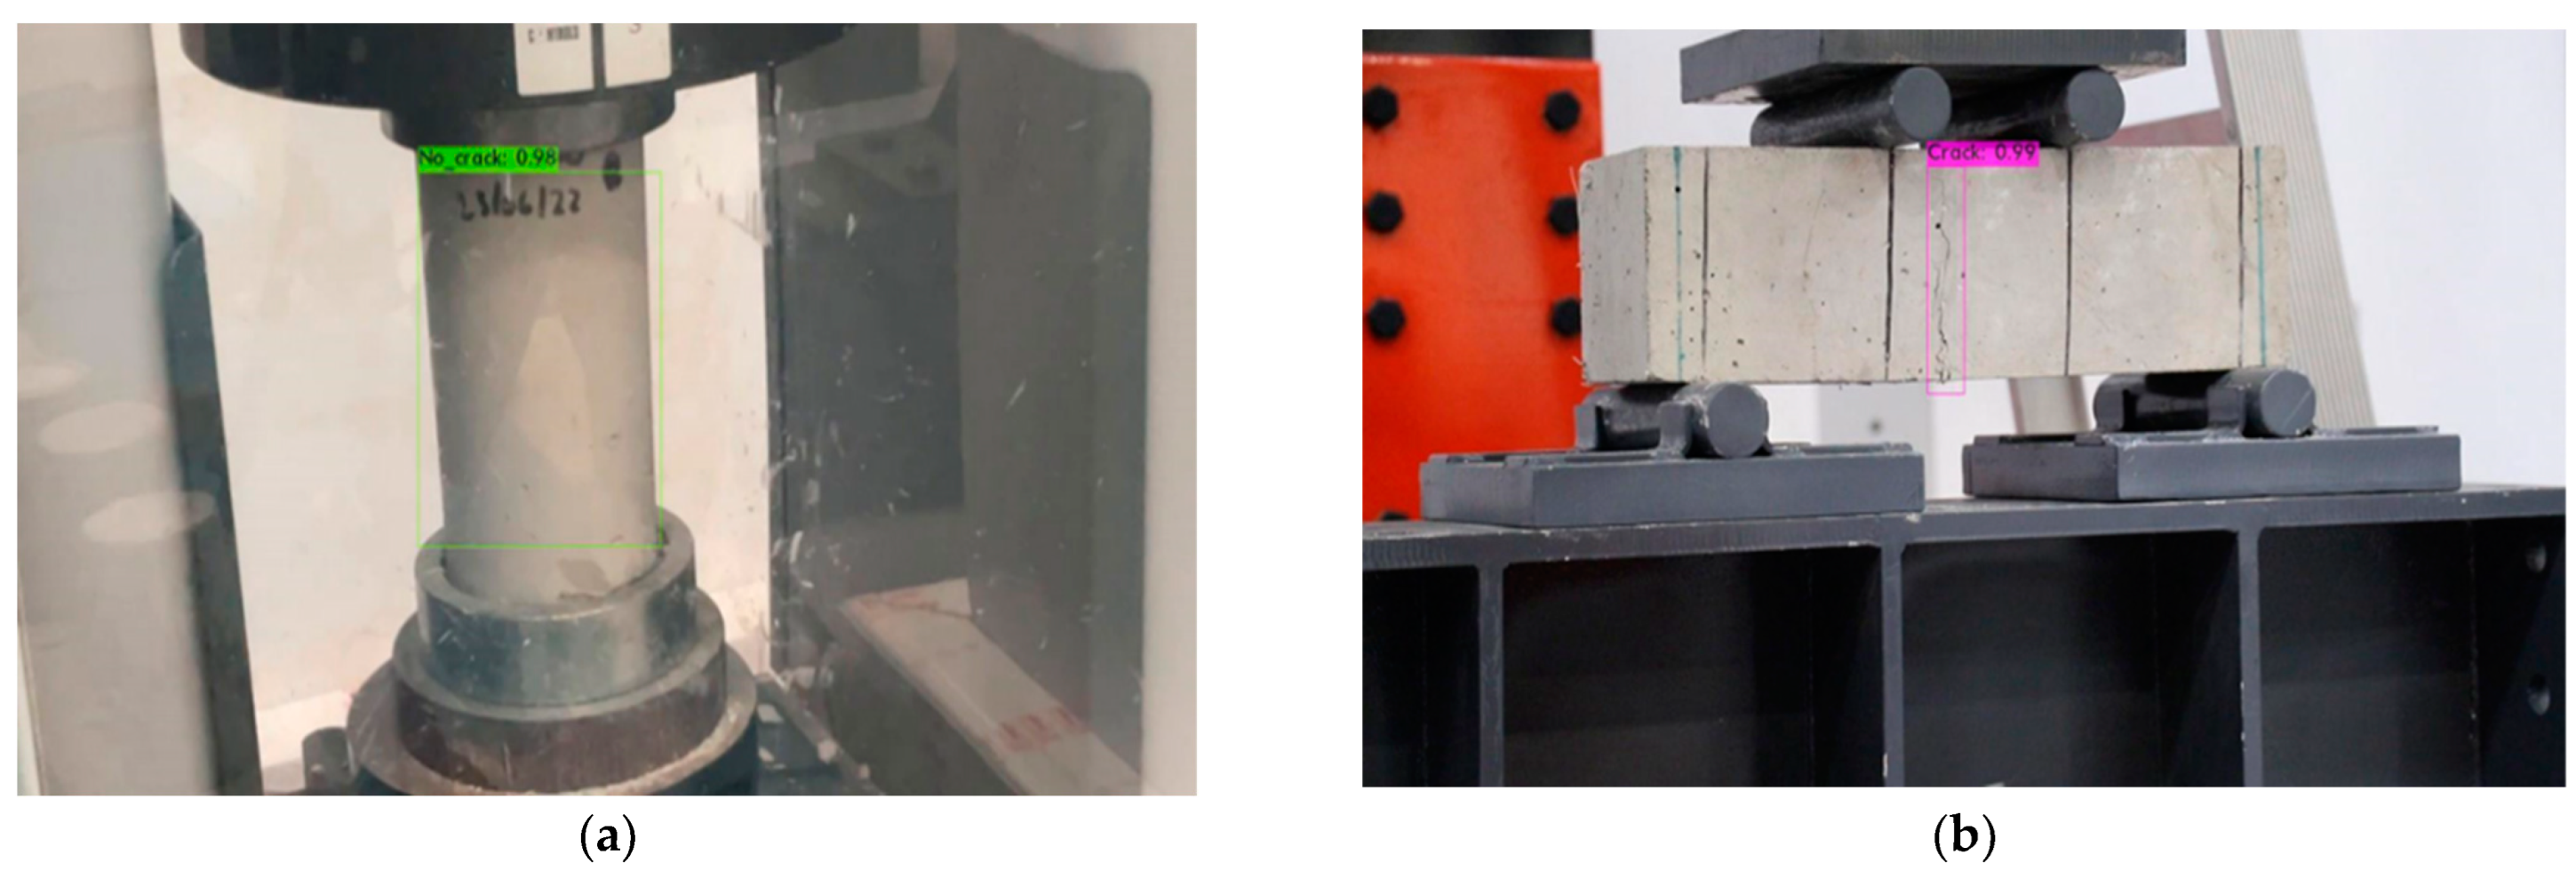
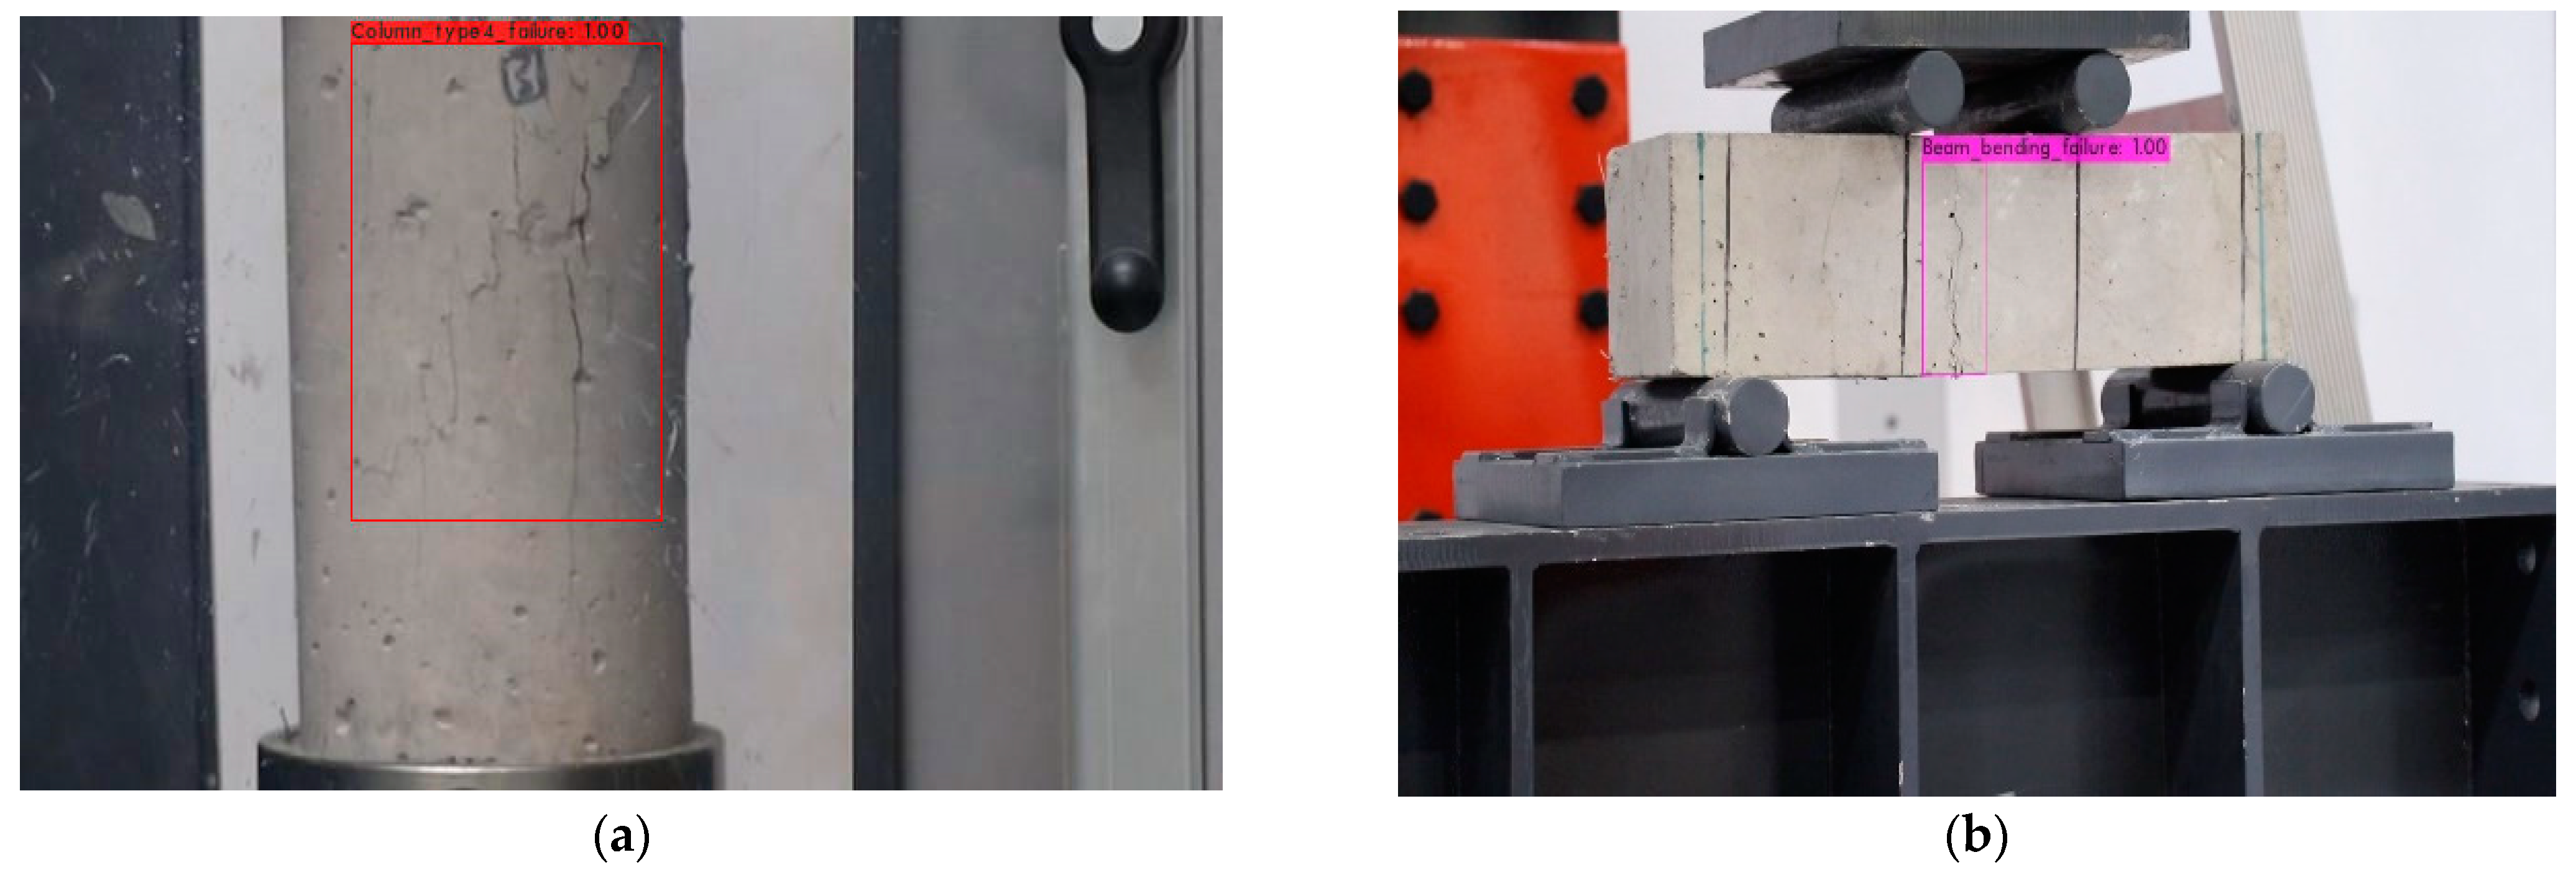
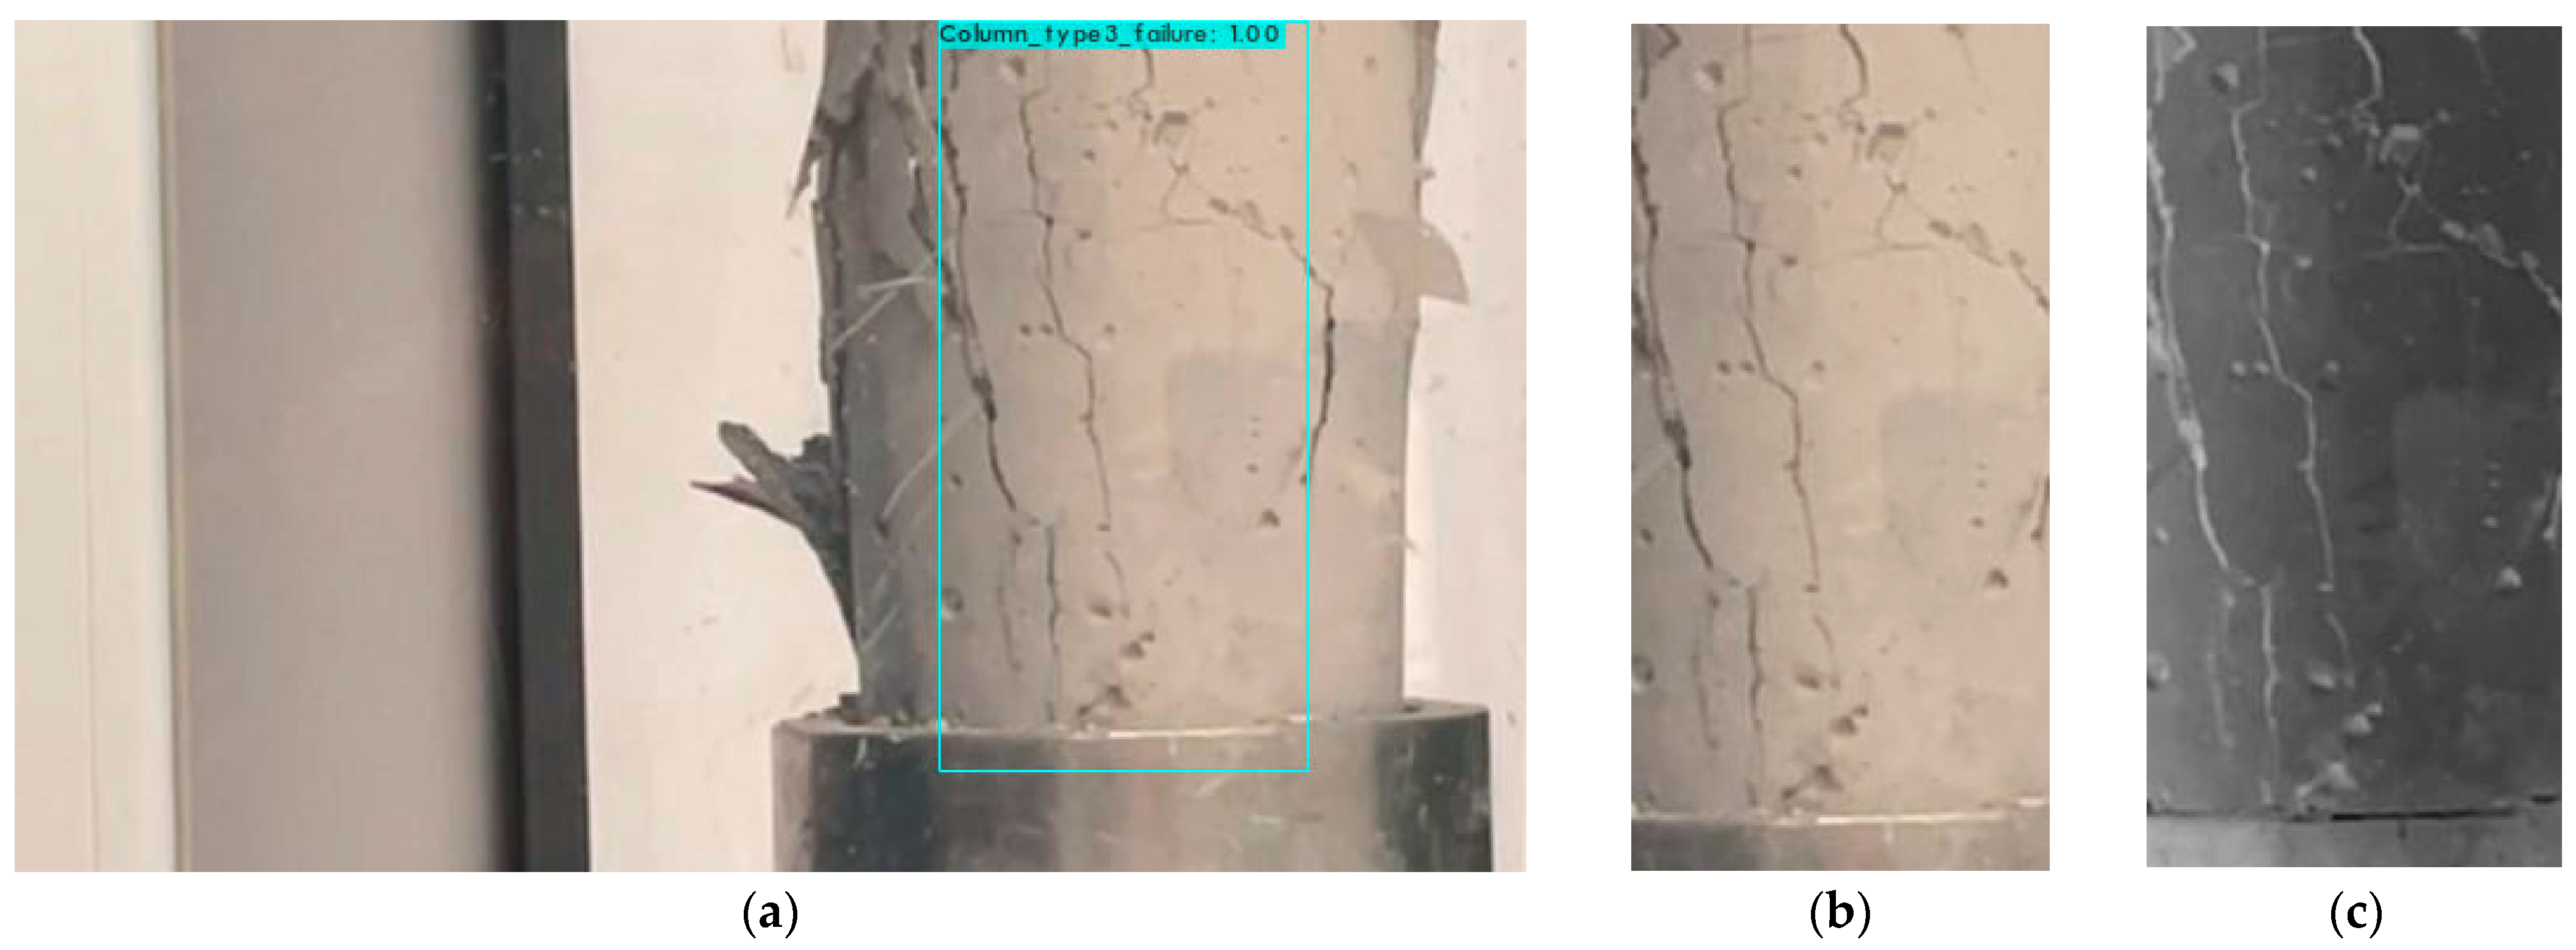
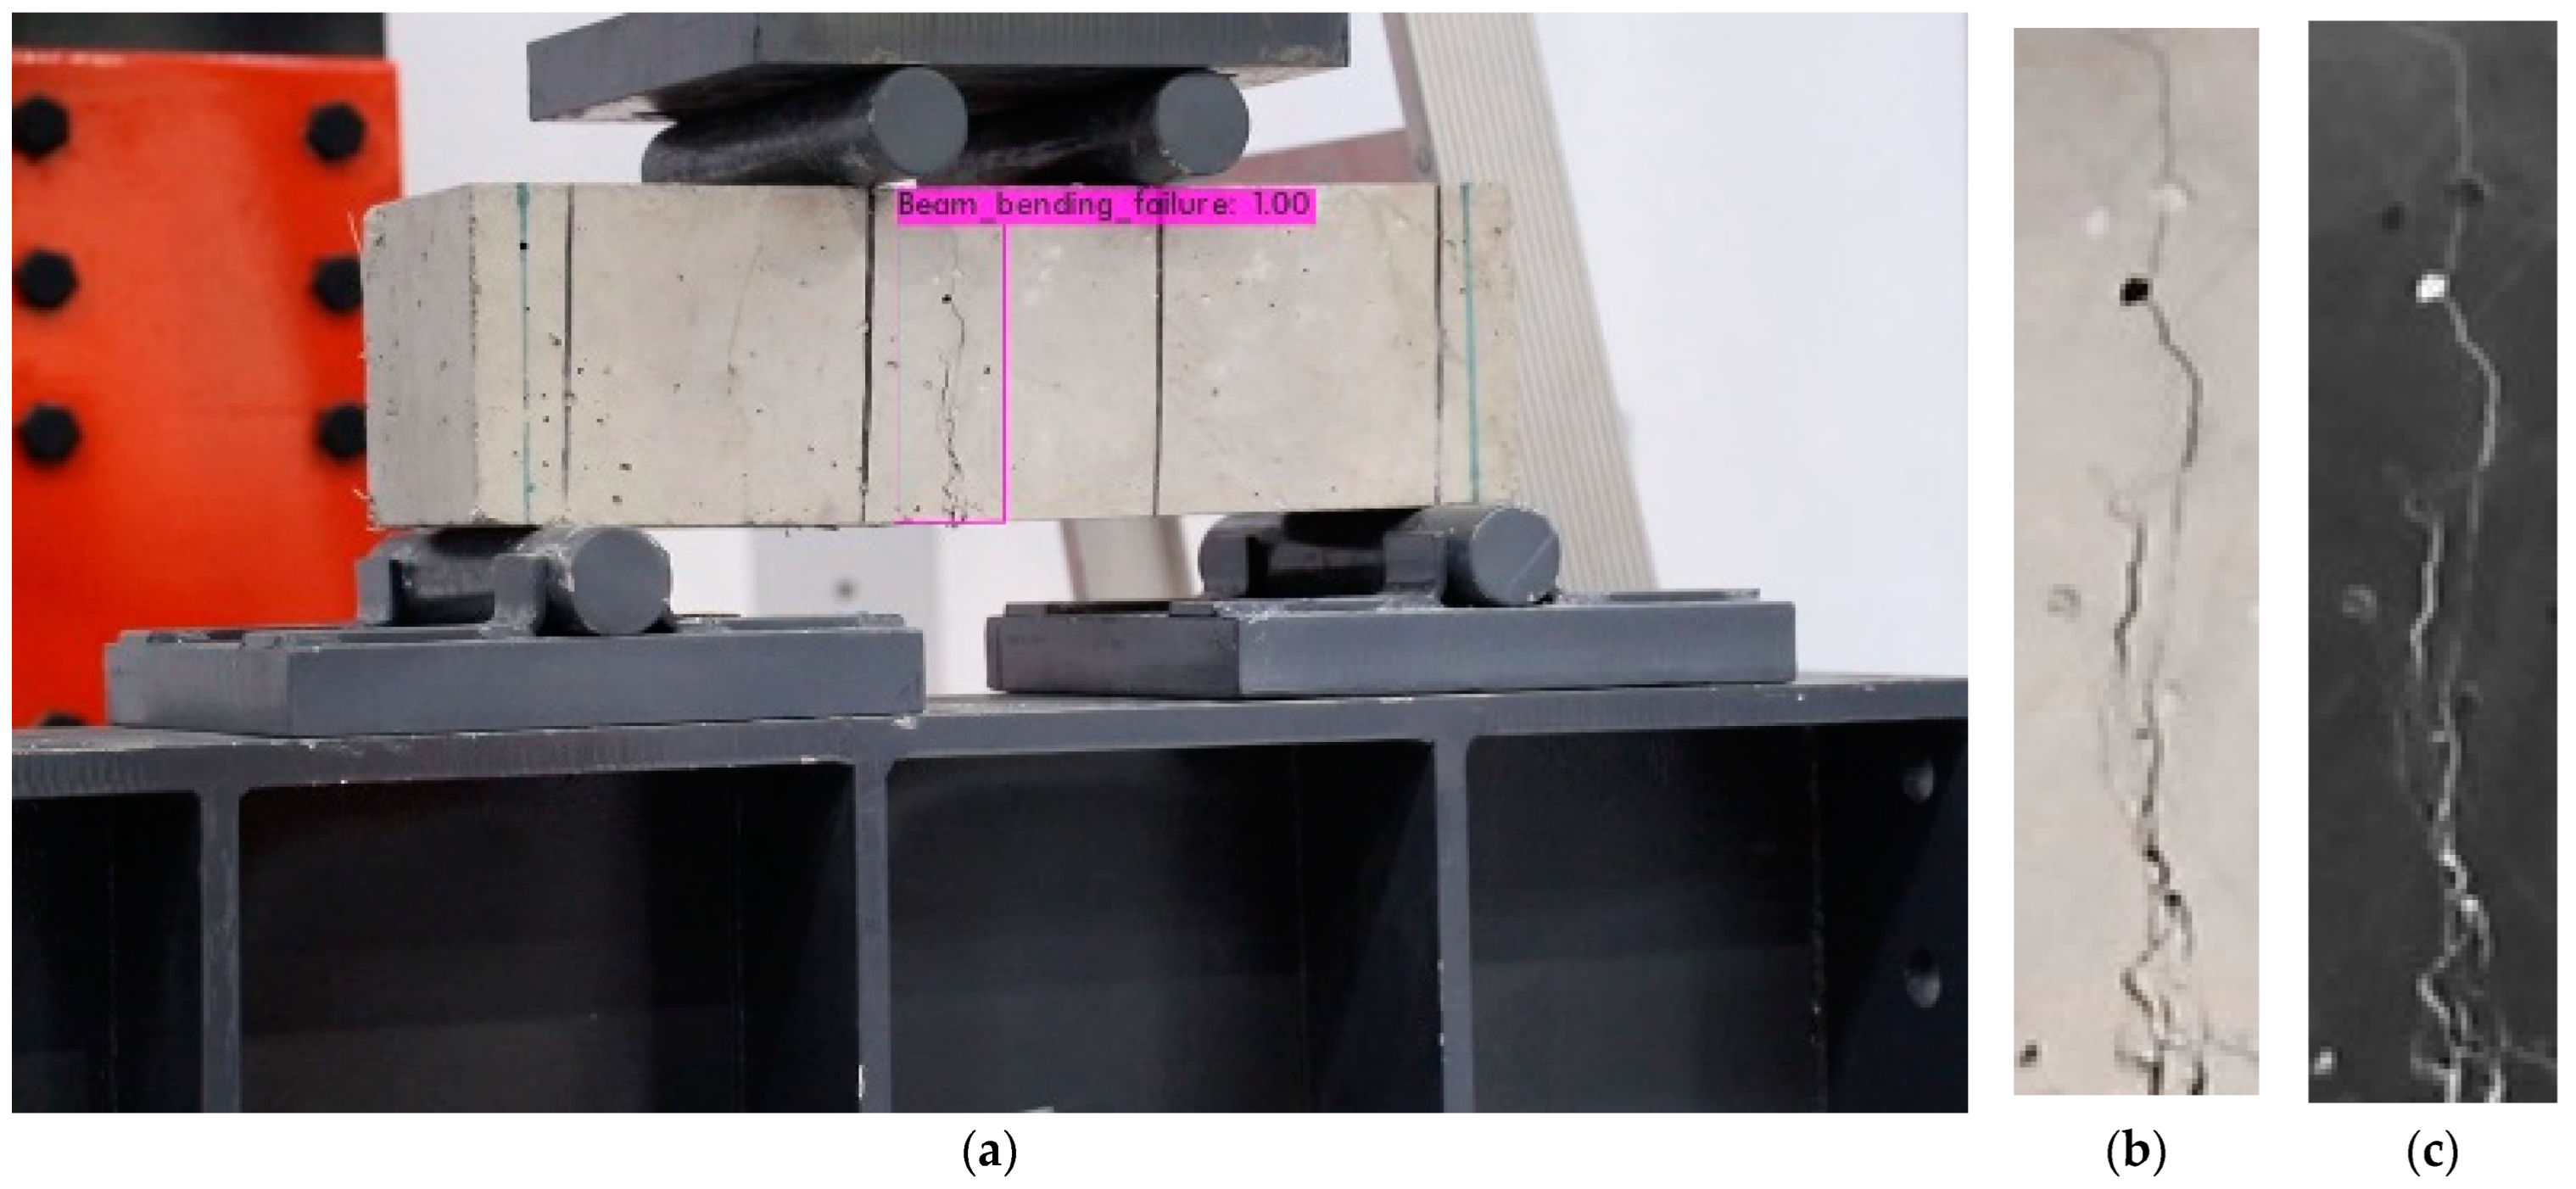
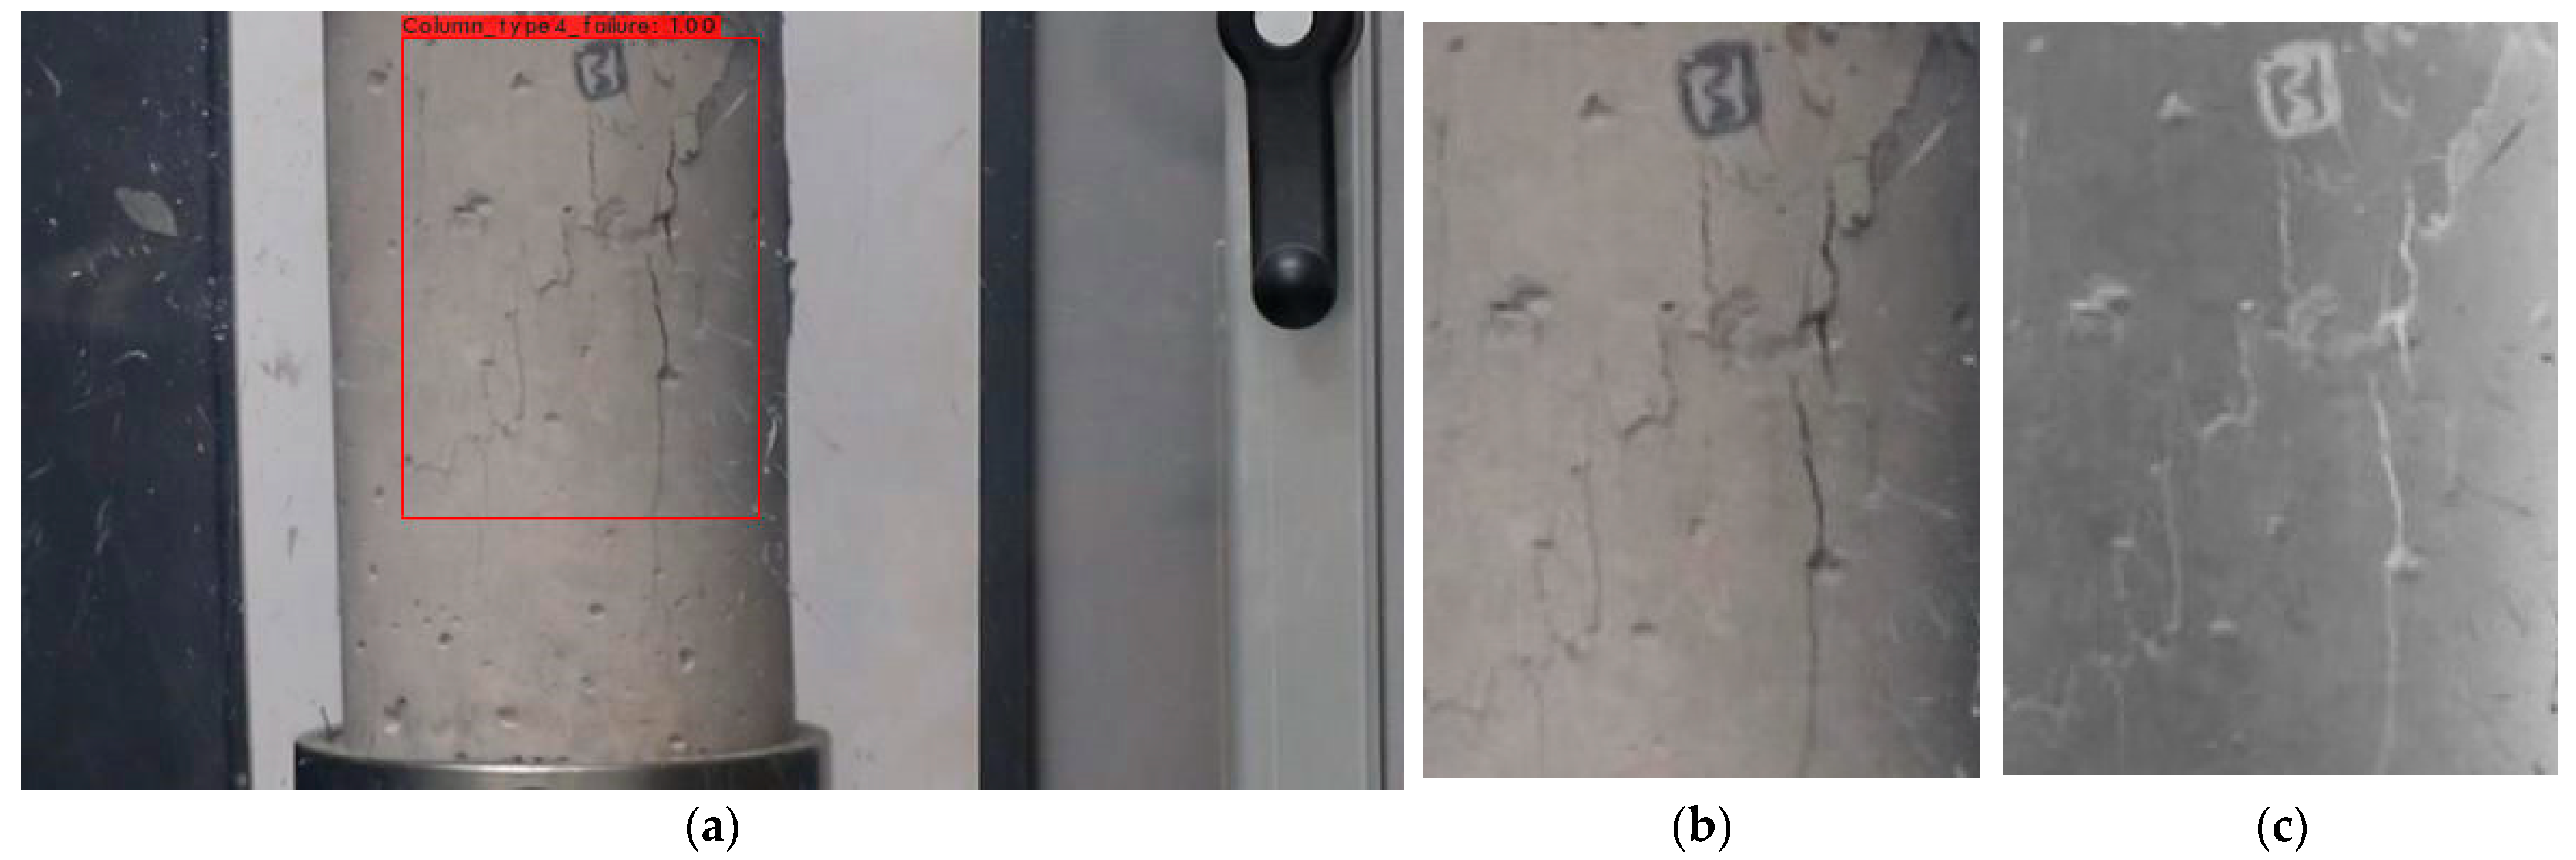
2.8. Fracture Characterization
3. Discussion
4. Conclusions
- Consider adopting more recent YOLO model iterations, such as YOLOv6 or YOLOv7.
- Fine-tune the model’s operational parameters to prioritize performance gains over shorter training times.
- Apply pruning to reduce the computational cost of the neural network, as well as other preprocessing and data augmentation techniques.
- Expand the training dataset significantly, encompassing over 2000 images.
- Introduce greater diversity to the images, incorporating different concrete compositions, varied angles, and lighting conditions.
- The method is limited to static evaluations and does not account for dynamic fracture changes over time.
- Factors like the size of the analyzed structural element, lighting conditions, porosity of the building material, and camera quality and positioning influence the outcomes. Additional experimentation with these variables is essential to establish standardized fracture criticality scales.
- The implemented methodology is limited to applying the pre-existing YOLOv4 algorithm in a customized database for detecting and evaluating cracks in construction, so preprocessing techniques such as pruning have not been applied.
Author Contributions
Funding
Data Availability Statement
Acknowledgments
Conflicts of Interest
References
- Flores Larsen, S.E.; Hongn, M.E. Termografía infrarroja en la edificación: Aplicaciones cualitativas. Avances Energías Renovables Medio Ambiente-AVERMA 2012, 16, 25–32. [Google Scholar]
- Orozco, M.; Avila, Y.; Restrepo, S.; Parody, A. Factores influyentes en la calidad del concreto: Una encuesta a los actores relevantes de la industria del hormigón. Revista Ingeniería Construcción 2018, 33, 161–172. [Google Scholar] [CrossRef]
- Yu, Z.; Shen, Y.; Shen, C. A real-time detection approach for bridge cracks based on YOLOv4-FPM. Autom. Constr. 2021, 122, 103514. [Google Scholar] [CrossRef]
- Del Savio, A.A.; Luna, A.; Cárdenas-Salas, D.; Vergara Olivera, M.; Urday Ibarra, G. The use of artificial intelligence to identify objects in a construction site. In Proceedings of the International Conference on Artificial Intelligence and Energy Systems (ICAIES) in Virtual Mode, Jaipur, India, 12–13 June 2021. [Google Scholar] [CrossRef]
- Del Savio, A.; Luna, A.; Cárdenas-Salas, D.; Vergara, M.; Urday, G. Dataset of manually classified images obtained from a construction site. Data Brief 2022, 42, 108042. [Google Scholar] [CrossRef] [PubMed]
- Fang, W.; Ding, L.; Zhong, B.; Love, P.E.D.; Luo, H. Automated detection of workers and heavy equipment on construction sites: A convolutional neural network approach. Adv. Eng. Inform. 2018, 37, 139–149. [Google Scholar] [CrossRef]
- Peng, G.; Lei, Y.; Li, H.; Wu, D.; Wang, J.; Liu, F. CORY-Net: Contrastive Res-YOLOv5 Network for Intelligent Safety Monitoring on Power Grid Construction Sites. IEEE Access 2021, 9, 160461–160470. [Google Scholar] [CrossRef]
- Del Savio, A.A.; Luna Torres, A.; Cárdenas-Salas, D.; Vergara Oliveira, M.A.; Urday Ibarra, G.T. Artificial Intelligence Applied to the Control and Monitoring of Construction Site Personnel. In Advances in Mechanics of Materials for Environmental and Civil Engineering; dell’Isola, F., Barchiesi, E., León Trujillo, F.J., Eds.; Advanced Structured Materials; Springer: Cham, Switzerland, 2023; Volume 197, Chapter 2, pp. 19–29. [Google Scholar] [CrossRef]
- Cha, Y.J.; Choi, W.; Büyüköztürk, O. Deep learning-based crack damage detection using convolutional neural networks. Comput.-Aided Civ. Infrastruct. Eng. 2017, 32, 361–378. [Google Scholar] [CrossRef]
- Chen, F.C.; Jahanshahi, M.R. NB-CNN: Deep learning-based crack detection using convolutional neural network and Naïve Bayes data fusion. IEEE Trans. Ind. Electron. 2017, 65, 4392–4400. [Google Scholar] [CrossRef]
- Huyan, J.; Li, W.; Tighe, S.; Zhai, J.; Xu, Z.; Chen, Y. Detection of sealed and unsealed cracks with complex backgrounds using deep convolutional neural network. Autom. Constr. 2019, 107, 102946. [Google Scholar] [CrossRef]
- Dung, C.V.; Anh, L.D. Autonomous concrete crack detection using deep fully convolutional neural network. Autom. Constr. 2019, 99, 52–58. [Google Scholar] [CrossRef]
- Wang, K.C.P.; Zhang, A.; Li, J.Q.; Fei, Y.; Chen, C.; Li, B. Deep Learning for Asphalt Pavement Cracking Recognition Using Convolutional Neural Network. In Proceedings of the Airfield and Highway Pavements 2017, Philadelphia, PA, USA, 27–30 August 2017. [Google Scholar] [CrossRef]
- Abdelhafiz, A.; Balabel, A.; Alwetaishi, M.; Shamseldin, A.; Issa, U.; Sharaky, I.; Al-Surf, M.; Al-Harthi, M. An innovative approach to check buildings’ insulation efficiency using thermal cameras. Ain Shams Eng. J. 2022, 13, 101740. [Google Scholar] [CrossRef]
- Pazhoohesh, M.; Zhang, C. Automated construction progress monitoring using thermal images and wireless sensor networks. In Proceedings of the Annual Conference CSCE 2015, Regina, SK, Canada, 25–30 May 2015; pp. 593–602. [Google Scholar]
- Zhang, X.; Saniie, J.; Cleary, W.; Heifetz, A. Quality control of additively manufactured metallic structures with machine learning of thermography images. JOM 2020, 72, 4682–4694. [Google Scholar] [CrossRef]
- Czarnecki, L.; Garbacz, A.; Kurach, J. On the characterization of polymer concrete fracture surface. Cem. Concr. Compos. 2001, 23, 399–409. [Google Scholar] [CrossRef]
- Bhowmik, S.; Ray, S. An experimental approach for characterization of fracture process zone in concrete. Eng. Fract. Mech. 2019, 211, 401–419. [Google Scholar] [CrossRef]
- Zhang, L.; Dang, F.; Ding, W.; Zhu, L. Quantitative study of meso-damage process on concrete by CT technology and improved differential box counting method. Measurement 2020, 160, 107832. [Google Scholar] [CrossRef]
- An, Q.; Chen, X.; Wang, H.; Yang, H.; Yang, Y.; Huang, W.; Wang, L. Segmentation of concrete cracks by using fractal dimension and UHK-net. Fractal Fract. 2022, 6, 95. [Google Scholar] [CrossRef]
- Redmon, J.; Divvala, S.; Girshick, R.; Farhadi, A. You Only Look Once: Unified, Real-Time Object Detection. In Proceedings of the 2016 IEEE Conference on Computer Vision and Pattern Recognition (CVPR), Las Vegas, NV, USA, 27–30 June 2016; pp. 779–788. [Google Scholar] [CrossRef]
- T9/10-M Professional Thermal Imager. Dali Technology. 2023. Available online: https://www.dalithermal.com/productinfo/741402.html (accessed on 6 March 2023).
- SD10A848WA-HNF. Dahua Technology. 2023. Available online: https://www.dahuasecurity.com/products/All-Products/Discontinued-Products/PTZ-Cameras/WizMind-Series/SD10A848WA-HNF (accessed on 6 March 2023).
- Faulkner, H. Decord Version of video_to_frame.py. GitHub Gist. 2020. Available online: https://gist.github.com/HaydenFaulkner/3aa69130017d6405a8c0580c63bee8e6 (accessed on 10 August 2022).
- Tzutalin. Git Code. 2015. Available online: http://github.com/tzutalin/labelImg (accessed on 12 August 2022).
- Corral, J.T. Patología de la construcción grietas y fisuras en obras de hormigón; origen y prevención. Ciencia Y Sociedad 2004, 29, 72–114. [Google Scholar] [CrossRef]
- Redmon, J. Darknet: Open Source Neural Networks in C. Joseph Chet Redmon. 2016. Available online: https://pjreddie.com/darknet/ (accessed on 31 August 2021).
- Silva, W.R.L.D.; Lucena, D.S.D. Concrete cracks detection based on deep learning image classification. Proceedings 2018, 2, 489. [Google Scholar] [CrossRef]
- Su, C.; Wang, W. Concrete cracks detection using a convolutional neural network based on transfer learning. Math. Probl. Eng. 2020, 2020, 7240129. [Google Scholar] [CrossRef]


| Thermal Camera | ||
|---|---|---|
| Detector resolution | 320 × 240 or 640 × 480 |  |
| Touch screen | 3.5 inches LCD of 640 × 480 | |
| Digital zoom | 2× and 4× | |
| Integrated digital camera | 5 megapixels | |
| Temperature measurement range | −20 °C to +1200 °C | |
| Precision | ±2 °C or 2% | |
| Thermal sensitivity | ≤0.05 °C to 30 °C | |
| Battery life | 3–4 h per battery | |
| Color alarm | High temperature, low temperature, and isotherms | |
| Operating temperature | −10 °C to +50 °C | |
| Storage temperature | −20 °C to +50 °C | |
| Size (H x W x L) | 27.7 × 12.2 × 16.7 cm | |
| Weight (battery included) | 1.04 kg | [22] |
| Motorized PTZ IP Camera | ||
| Model | SD10A848WA-HNF |  |
| Maker | DAHUA | |
| Sensor | 1/1.8“ CMOS | |
| Lenses | 5.7 mm–275 mm | |
| Zoom | 48× | |
| Image sensor | 1/1.8“ CMOS | |
| Effective pixels | 2.42 MP | |
| Max. Resolution | 1920 (H) × 1080 (V) | |
| ROM | 8 GB | |
| RAM | 2 GB | |
| Electronic shutter speed | 1/3 s–1/100000 s | |
| Scanning system | Progressive scanning | |
| Min. Illumination | Colour: 0.001 [email protected] B/W: 0.0001 [email protected] 0 Lux (IR light on) | [23] |
| Training | Training Images (70%) | Validation Images (30%) | Best mAP | Precision | Recall |
|---|---|---|---|---|---|
| n°1 | 792 | 340 | 98.36% | 0.96 | 0.99 |
| n°2 | 792 | 340 | 99.49% | 0.96 | 0.97 |
| n°3 | 792 | 340 | 99.75% | 0.98 | 0.99 |
| n°4 | 792 | 340 | 96.62% | 0.95 | 0.97 |
Disclaimer/Publisher’s Note: The statements, opinions and data contained in all publications are solely those of the individual author(s) and contributor(s) and not of MDPI and/or the editor(s). MDPI and/or the editor(s) disclaim responsibility for any injury to people or property resulting from any ideas, methods, instructions or products referred to in the content. |
© 2023 by the authors. Licensee MDPI, Basel, Switzerland. This article is an open access article distributed under the terms and conditions of the Creative Commons Attribution (CC BY) license (https://creativecommons.org/licenses/by/4.0/).
Share and Cite
Del Savio, A.A.; Luna Torres, A.; Cárdenas Salas, D.; Vergara Olivera, M.A.; Urday Ibarra, G.T. Detection and Evaluation of Construction Cracks through Image Analysis Using Computer Vision. Appl. Sci. 2023, 13, 9662. https://doi.org/10.3390/app13179662
Del Savio AA, Luna Torres A, Cárdenas Salas D, Vergara Olivera MA, Urday Ibarra GT. Detection and Evaluation of Construction Cracks through Image Analysis Using Computer Vision. Applied Sciences. 2023; 13(17):9662. https://doi.org/10.3390/app13179662
Chicago/Turabian StyleDel Savio, Alexandre Almeida, Ana Luna Torres, Daniel Cárdenas Salas, Mónica Alejandra Vergara Olivera, and Gianella Tania Urday Ibarra. 2023. "Detection and Evaluation of Construction Cracks through Image Analysis Using Computer Vision" Applied Sciences 13, no. 17: 9662. https://doi.org/10.3390/app13179662