1. Introduction
Surgical removal of the larynx due to cancer will impact multiple physiologic functions, including swallowing, respiration, voice, and speech. Due to the loss of the larynx, verbal communication will be permanently altered. The loss of normal speech also has been shown to have far-reaching post-treatment impacts that may lead to significant social, psychosocial, and financial disadvantages [
1,
2,
3]. While several postsurgical, alaryngeal verbal communication options exist, tracheoesophageal (TE) puncture voice restoration [
4] remains a valuable and widely used postlaryngectomy rehabilitation option more than 40 years after its introduction. Further, TE puncture voice restoration does appear to have advantages relative to broader communication functioning and quality of life (QoL) in this population [
5,
6].
One of the most significant advantages of TE voice and speech evolves from its use of a pulmonary air source. Experimental data reveal that this advantage involves changes that directly influence the frequency, intensity, and temporal characteristics of the TE voice signal [
7,
8,
9]. Further, the ability to utilize the air volume provided by the lungs results in a range of aerodynamic advantages inherent to the acoustic properties of the voice/speech signal as compared to other alaryngeal speech methods [
9,
10,
11,
12]. Research has revealed that the specific aerodynamic changes which exist with TE voice production may also account for increases in speech accuracy. This finding is based on comparisons made between traditional esophageal speech and of TE speech, as both methods use the same biological voicing source, the pharyngoesophageal segment [
12,
13,
14]. In fact, research findings suggest that when compared to traditional esophageal speakers, those who use TE speech are favored by listeners for both judgments of speech intelligibility and acceptability [
7,
12,
13,
14,
15,
16,
17,
18,
19].
That is, TE speakers’ access to pulmonary air may help them generate increased airflows and associated air pressures within the vocal tract during TE speech production. However, an additional concern in this context rests with the fact that TE speakers do not have an adductor–abductor voicing mechanism; rather, the response of the postlaryngectomy vibratory source may in many respects be somewhat passive despite increased driving pressures secondary to the access to lung air by these speakers [
20,
21,
22]. Data reported in the literature support this assumption [
9]. More specifically, although traditional esophageal speakers use the same voicing mechanism as TE speakers (the pharyngoesophageal segment), they exhibit a substantially reduced driving pressure due to limitations in the volume of the esophageal reservoir [
22,
23,
24,
25,
26,
27]. Thus, the aerodynamic advantages associated with TE speech production and the inherent capacity to maintain air volumes within the esophageal reservoir have been suggested to result in concurrent advantages in speech production and its perceived listener accuracy [
7].
Although esophageal and TE speech differ from each other and clearly differ from that of normal speech production, the aerodynamic capacity and trans-pseudoglottal flows and pressure are greater during TE speech [
8,
9,
10,
20,
21,
22,
28,
29]. In comparing TE, esophageal, and normal speakers on acoustical characteristics of fundamental frequency, intensity, and duration, Robbins et al. [
9] found that TE speech was characterized as having the greatest intensity, a higher frequency than esophageal speakers, and finally, temporal features that approximated normal speakers. Data from that study [
9] further suggest that TE speech more closely approximates normal speech based solely on acoustic measures; however, TE speech remains identifiable by listeners as abnormal in its perceptual quality with associated reductions and variability in intelligibility [
8]. More recently, a meta-analysis comparing the acoustic characteristics of TE speech and esophageal speech reported significantly higher fundamental frequency values, maximum phonation times, and greater intensity outcomes for TE speakers [
28]. These authors also suggested that higher harmonic-to-noise ratios are generated by TE speakers [
28]. Collectively, and as a likely consequence of a high-volume pulmonary driving source, the present data provide further support for the notion that assessments of accuracy in TE speakers must carefully consider the phonetic construction of stimulus materials used, as they are likely to be directly influenced by pulmonary driving pressures in the group of postlaryngectomy alaryngeal speakers [
10,
28,
29]. Accordingly, data also suggests that a pulmonary powered TE speech system and the associated aerodynamic changes will result in resonant changes within the postlaryngectomy vocal tract, including temporal changes in the onset of voicing [
27,
28,
29,
30,
31,
32,
33,
34]. Thus, the representation of sounds within any given stimulus list must always be addressed as a potential threat to the internal and external validity of accuracy measures which are gathered from speakers. If the specific content of stimulus lists used in assessments of speech accuracy are not adequately considered, errors in interpreting the outcome of such assessments may be jeopardized.
To date, studies of TE speech accuracy have traditionally employed a closed-set response paradigm and whole-word scoring methods. That is, listeners who are requested to judge speech intelligibility are commonly asked to select a word from a predetermined set of options that indicates their perception of an intended target word (e.g., “tight”); these selection options typically differ in a single sound, often with an additional consideration of the phonetic position of sounds (e.g., pipe, pike, tight, type). Thus, while some sounds within a word may be misperceived, the listener may be able to identify the correct word through chance occurrence in some instances. However, of particular importance to the present work, incorrect listener identifications are typically determined in an all-or-none fashion. Based on a listener’s selection, the target word is either identified as being correct or incorrect. Thus, a single sound error in a target word will render the entire word as incorrect. This suggests that whole-word methods of scoring speech accuracy may not only be highly punitive to the speaker, but insensitive to the unique types of sound errors made by the speaker and which are perceived by the listener in such assessments. Ultimately, whole-word approaches to quantifying speech accuracy may be insensitive to larger deficits in speech production. This suggestion also becomes of greater importance in the realm of therapeutic intervention; that is, without specific information of the nature of such deficits in a speaker’s sound accuracy and resultant intelligibility, appropriate targets may be neglected.
In addition to the above noted factors that may influence accuracy assessments, it is also important to identify potential limitations in a listener’s auditory-perceptual judgments of whole-word stimuli. More specifically, in some instances the response paradigm chosen also may reduce the inherent representativeness of accuracy scores obtained; namely, the perception of a given target word by the listener may potentially be influenced by word familiarity [
35,
36]. In such instances, a listener’s perception of only part of the target stimuli may lead to an overall correct identification by the listener within the context of the selection options offered in a given closed set of responses. In this regard, access to a set of word choices may influence the listener when in fact elements of the entire word may not have been perceived—either by exclusion of some of the closed set choices, or by an incorrect closure relative to the perception of a partial stimulus [
37,
38]. Further, a closed set response format may be influenced by a variety of lexical (e.g., potential ambiguity of a target word, etc.), semantic or contextual factors [
39], and/or aspects of word familiarity, even in simple listening paradigms [
40], or the naturalness of sound sequences within target words [
41]. This limitation in whole-word scoring has led some investigators to explore accuracy assessment options through use of nonsense stimuli across a variety of communication disorders [
10,
42,
43,
44,
45].
In contrast to closed-set response paradigms, an open-set response model requires that listeners are not placed in a “forced-choice” auditory-perceptual situation. Rather, in an open-set paradigm, listener responses may provide a more representative index of what they perceived, and, consequently, their composite accuracy scores may be more representative of production/perceptual errors [
35]. While whole-word intelligibility scoring is valuable, phonemic scoring may provide a more representative measure of accuracy in that it may avoid inflated perceptual identifications (i.e., accuracy scores) using something that may mirror a “cloze” procedure typically associated with reading [
46]. In such a circumstance, partial perceptions of a target word may allow the listener to make judgments of the entire stimulus without full detection of each specific sound. The task of detecting the target may be further influenced by contextual factors, word frequency, and/or probabilistic “guessing”, an unintended consequence that may aid the “correct” detection of a target word by the listener despite the speaker’s inaccurate production of one or more phonemes within the word. This may be particularly important in quantifying the production challenges of TE speakers, given the unique voicing challenges that they have been shown to demonstrate [
10,
15]. While we are most interested in listener perceptions of TE speech, we are keenly aware that listener judgments are directly influenced by production errors. Thus, the use of the term “production/perceptual” errors may better represent the data to be presented within this work.
For example, intrinsic methods of postlaryngectomy voice production (i.e., TE and esophageal speech) are frequently characterized by voiced-for-voiceless sound errors across a range of phonetic categories, such as stops, fricatives, etc. [
16,
47]. Because the tracheoesophageal voicing source is not an adductor–abductor mechanism, changes in fine voice control and the associated changes in the acoustic signal secondary to this limitation may have collective influences on the accuracy of speech production. Thus, the use of a more refined method of phonemic scoring in conjunction with an open-set response paradigm may provide a more comprehensive measure of speaker performance and change over time, regardless of the underlying voice and/or speech disorder [
43]. Additionally, employing an open-set response paradigm for listeners may address critical clinical concerns in that more specific information related to the nature of a given speaker’s speech production errors may be obtained. This type of detailed speech production data may support the development of a treatment framework directed at improving overall intelligibility. However, while phonemic scoring can benefit intelligibility assessments, it also raises concerns specific to the construction of stimulus materials and how this may influence accuracy scores obtained from normal hearing listeners [
48]. Although not without limitations and/or the potential for perceptual bias, use of normal-hearing listeners may provide the opportunity to more accurately identify production accuracy of disordered speakers. Further, our interest in the potential influence of phonetic construction of each list was guided by clear differences in sound representation across these lists. Consequently, the present study was designed to address multiple concerns, with a focus on the method of scoring and the unique phonemic representation inherent to any given intelligibility test list.
Based on the above information, and due to the knowledge gaps that exist, the present study was undertaken to identify the potential influence of the method of scoring and the composition of an intelligibility word list on speech accuracy scores obtained. Accordingly, the outcome of this work was directed toward identifying variability in a speaker’s accuracy secondary to how an intelligibility score is calculated (whole-word vs. phonemic scoring) and how this potentially influences accuracy assessments across three different word lists. The specific question addressed in this present study was: Do listener judgements of TE speakers’ accuracy vary as a function of the scoring method and the composition of test materials?
2. Methodology
2.1. Participant Speakers
This project was structured as a small sample, prospective comparative study. Five native English adult male tracheoesophageal (TE) speakers produced the speech stimuli for this study. Their ages ranged from 49 to 60 years (M = 54). All speakers were judged by three experienced speech-language pathologists (SLPs) to be highly proficient TE speakers who did not experience interpersonal communication challenges (Our decision to use speakers who demonstrated good verbal communication skills was based on our assumption that production errors would be reduced in comparison to those with poorer, subjectively assessed communication effectiveness. Thus, we anticipated that speech production would be optimized for the purposes of this exploratory study). Additional criteria for inclusion in this study required that the speakers be between 45 and 65 years of age, had used TE speech as their primary method of alaryngeal communication and had done so for at least three years at the time of their participation, and were self-reported to be in good general health at the time of recording. All speakers had undergone total laryngectomy and primary TE puncture without any type of free flap reconstruction which was deemed exclusionary. None of the participant speakers had experienced any complications related to the laryngectomy or TE puncture process; this included wound infection, extended fistula, pharyngeal stricture, or the formation of granulation tissue at the puncture site in the postsurgical period. No respiratory problems (e.g., chronic obstructive pulmonary disease) were reported.
At the time of speech sample recordings, all participant speakers also self-reported that they were in good general health and had not experienced any cancer recurrence. While the size of TE puncture voice prosthesis used by these speakers did vary in its length, the prosthesis diameter (16 French) was the same. It should be noted that the diameter of any TE voice prosthesis is measured in what is termed “French” sizing. This metric relates to the diameter of the prosthesis and the standard metric conversion is identified as diameters in millimeters multiplied by 3, which then equals the French size. All speakers used a Blom-Singer indwelling device at the time of voice recording and all samples were produced using digital (i.e., finger or thumb) closure of the tracheostoma with a heat and moisture exchange (HME) housing affixed to the perimeter of the participant speakers’ tracheostoma. Prior to recording, all five participant speakers provided informed consent in accordance with our research ethics board (Western University REB #18588E).
2.2. Speech Stimuli and Recording Procedure
Each speaker recorded three experimental word lists in random order: (1) The 30-item
Northwestern Intelligibility Test [
49], (2) the 50-item
Consonant Rhyme Test [
50], and (3) the 66-item
Weiss and Basili [
51] word list. These lists were selected due to their prior use in past research on postlaryngectomy speech intelligibility. Thus, all three lists had a majority of stimuli composed of scorable items in both word-initial and word-final positions due to CVC items. Briefly, the Northwestern Intelligibility Test (NIT) comprised 26 consonant-vowel-consonant (CVC) stimuli, 2 CV, 1 VC, and 1 CVCC stimuli. Thus, there were 29 scorable consonants in both initial and final positions. The Consonant Rhyme Test (CRT) was composed of 48 CVC and 2 CV stimuli. Thus, the CRT had 50 scorable consonants in the word-initial position and 48 in the word-final position. Finally, the Weiss and Basili List (W&B) was composed of 58 CVC, 5CV, and 3 VC stimuli. This resulted in 63 scorable initial consonants and 61 final consonants.
Relative to stimulus items and the distribution of phonemes, there was variability in the consonants represented across the three stimulus word lists. For all lists, however, the majority of stimuli contained an initial and/or final stop, fricative, or affricate cognate consonant. For the NIT, the 30 words were either initiated (
n = 20) or terminated (
n = 19) with a stop, fricative, or affricate. Words on the 50-item CRT were either initiated (
n = 31) or terminated (
n = 25) with a consonant from one of these three manner classes. Finally, for the 66 words on the W&B list, 48 were initiated, and 46 were terminated with a stop, fricative, or affricate cognate. For the remaining stimuli on all lists, and with the exception of consonants where phonological rules restricted their use (e.g., /ŋ/in the initial position), all other words did include either a nasal (/m/, /
n/, or/ŋ/) or a liquid-glide (/l/, /r/, /w/, or /j/) consonant in one or both positions. Thus, all lists were constructed with a substantial weighting toward sounds that involved cognate consonant pairs that differed in voicing (see
Table 1).
Each speaker recorded the experimental stimuli in a sound-treated audiometric suite (IAC-11648) using a high quality, cardioid condenser microphone (Shure PG81) coupled to a pre-amplifier and then digitized using Sona Speech II (Kay Pentax, Montvale, NJ, USA) at a sampling rate of 48 KHz. Input levels were adjusted individually for each speaker. Participant speakers were first familiarized with each stimulus list and then they were asked to read through randomized versions of each word list during the recording. Regardless of the word list spoken, all stimuli were produced by speakers within the carrier phrase “You will write ____”. The microphone was affixed to an adjustable arm stand and was placed eight inches from the corner of the participant’s mouth. On several occasions, participants mispronounced items from the stimulus due to a misunderstanding of the spoken word. For example, some speakers produced a voiced/g/sound in the word “gnash” (as opposed to being silent) from the W&B list. If any word was mispronounced during the recording procedure the participant was requested to stop, at which time they were instructed on the correct pronunciation of the word. Following this instruction, the speaker was asked to continue the recording where they left off and the acquisition of speech samples resumed. The entire recording task required approximately 30 min to complete with rest breaks provided as requested by the participant speaker.
2.3. Participant Listeners
Fifteen native English speaking graduate students in communication sciences and disorders volunteered to participate in the study after providing informed consent. Listeners ranged from 21 to 32 years of age (M = 24 years) with no self-reported history of hearing loss or speech and/or language problems. Prior to participation in the study, all listeners passed a pure tone audiometric screening at 20 dBHL for the octave frequencies 500, 1000, and 2000 Hz. In order to serve as listeners, all had been trained in phonetic transcription using the International Phonetic Alphabet (IPA). More specifically, all listeners had successfully completed courses in both phonology and phonetics; hence, all were fully proficient with IPA, and each listener confirmed this prior to consenting to the listening task. However, despite this knowledge and experience, none of the listeners had either formal or informal training in voice disorders or prior exposure to postlaryngectomy alaryngeal voice and speech methods. Thus, while proficient in IPA transcription, all listeners were considered naïve to postlaryngectomy alaryngeal voice and speech.
2.4. Listening Procedure
All experimental speech stimuli produced by the five participant speakers were randomized for both stimulus items and speakers, and a spoken number preceded each stimulus item. For all speech stimuli, the carrier phrase was removed; hence, listeners were only presented with single words as part of the listening and transcription task. Participant listeners were allowed to move through the listening process at their own pace; however, listeners were asked to listen to the stimulus item only once prior to providing their transcription of the target word. All listeners were presented with a total of 730 stimuli which included 150 stimuli (5 speakers × 30 items) from the NIT, 250 stimuli (5 speakers × 50 items) from the CRT, and 330 stimuli (5 speakers × 66 items) from the W&B list.
Experimental stimuli were presented through circumferential headphones (JVC H-610) in a sound-treated audio booth (IAC 11648) at a listening level judged to be comfortable by each individual listener. Each listener was permitted to listen to and transcribe their responses to each stimulus item at their own pace. Listening sessions required a total of approximately two and a half hours with opportunities for two brief break periods (approximately 5 min each) provided during the experimental session. However, upon request by several listeners, brief additional breaks were provided. All listeners completed the task without attrition.
Prior to commencing the listening session, all listeners were instructed that they would be presented with a series of real English words and once presented, they were to manually transcribe their response to each stimulus either phonetically or orthographically based on exactly what they believed they heard [
52]. More specifically, listeners were permitted to use standard orthographic only if they believed that they could fully and accurately represent their judgment using orthography for any given target; this option was carefully explained to each listener prior to initiating the listening task. In those instances, listeners were requested to identify any orthographic response by identifying it on the score sheet with the highlighter provided. If listeners were unsure of any stimulus that was presented, they were requested to provide a phonetic transcription of what they heard rather than what they may have thought was the target word. If a particular sound within a word could not be identified by the listener, they were asked to place a hyphen in the location of the word where that occurred. Thus, an open-set response paradigm was utilized. Although all speaker stimuli for any given list were randomized, the presentation of word lists (NIT, CRT, and W&B lists) was counterbalanced to control for potential list order effects. That is, while stimuli within each of the three individual lists were randomized, the order of list presentation varied in a pseudo-random manner across listeners.
2.5. Agreement of Auditory-Perceptual Judgments
In addition to the 730 primary stimuli presented to each listener, approximately 15% of each speaker’s stimuli (n = 21) across the three lists were duplicated for reliability purposes. This included five duplicate samples from the NIT, seven samples from the CRT, and nine samples from the W&B list. Thus, a total of 105 additional samples (21 samples x 5 speakers) were included in the master stimulus list resulting in 835 total samples produced for all five speakers. All reliability duplicates were presented at the end of each randomized list. These additional stimuli were used to calculate inter- and intrajudge reliability. Reliability of listener judgments (Ri) expressed as a percentage were obtained using the following formula: Ri = total # of agreements/total # of agreements + total # of disagreements × 100.
2.6. Data Analysis
Listener transcription data were initially calculated for each listener and then these data were collapsed across listeners for each speaker. Overall, the group of listeners preferred and provided their transcriptions using IPA in more than 94% of the total responses to more than 12,000 total stimuli (835 transcriptions × 15 listeners). In those instances where orthographic transcription occurred (approximately 750 responses), these transcriptions were confirmed by one of the authors at the end of the listening session and then converted to IPA for further analysis. Based on this procedure, individual speaker scores for each of the three lists were initially compiled for all five speakers. All scoring of listener responses was carried out at the phonetic level, but two accuracy scores were obtained, a whole-word score and a phoneme or “consonant” score. Data were analyzed further to identify accuracy patterns by phonetic class (stops, fricatives, affricates, nasals, and liquid-glides), as well as for pre- and postvocalic position within the target word. Whole-word scores were obtained and compared. Statistical analyses of the data were performed to determine differences across speakers and across stimulus lists. A repeated-measures, one-factor analysis of variance was computed using Statistical Package for the Social Sciences (SPSS, Version 18, Minneapolis, MN, USA) on the overall listener scores for each of the three lists.
2.7. Summary of Reliability Assessments
For one of the speakers, the W&B reliability data (i.e., nine duplicate samples) were lost due to technical factors. However, good-to-excellent (agreement > 80%) reliability data for this speaker was found for the other two-word lists suggesting that consistency of listener judgments was good. Inter- and intrajudge agreement for the other lists produced by all other speakers were all above 80% agreement when second judgments of duplicated stimuli were compared to first judgments of the same sample. For the NIT, the intrajudge reliability ranged between 82% and 90% and the interjudge reliability ranged between 80% and 84%. The CRT revealed intrajudge reliability which ranged from 83% to 88% and interjudge reliability between 89% and 92%. Finally, the intrajudge reliability for the W&B list across four speakers ranged from 82% to 96%, while the interjudge reliability ranged between 81% and 94%.
4. Discussion
This study was designed to evaluate the potential influence of scoring method and stimulus list construction on the accuracy of a small group of highly proficient TE speakers. Based on the present data, care must be taken in comparing speech sound accuracy when stimulus lists differ across assessments. Further, more sensitive methods of scoring at the phonemic level appear to provide a critical component of valid speech accuracy assessments. Similar to previous research related to the dysarthrias, acoustic characteristics of target stimuli will also provide the foundation from which speech accuracy can be more comprehensively compared; this is also true for alaryngeal voice methods, such as both TE and esophageal speech [
5,
6,
7,
8,
9,
43]. Because the TE voicing mechanism is driven by pulmonary air, aerodynamic considerations are essential to our understanding of speech sound production in these speakers [
27,
28,
29,
30,
31,
32]. Thus, our findings provide a framework from which further understanding of speech accuracy, and ultimately intelligibility, can be evaluated in assessments of alaryngeal speakers in general and for TE speakers specifically.
Perhaps one of the most noteworthy findings from the current work is the variability that was observed between speakers given their generally good levels of communication effectiveness as subjectively assessed by experienced clinicians. Despite rating each of these speakers as excellent in the context of a running speech sample, whole-word and consonant specific intelligibly between these individuals was highly variable. The current findings may support the use of clinical assessment in both quiet and noisy environments to adequately identify speaker-specific challenges across such varied communication contexts [
15]. If some consonants are more likely to be misperceived in quiet, it is not unreasonable to assume that further breakdown in accuracy will occur in the presence of noise. Furthermore, the use of phoneme-specific analysis is encouraged to identify individual challenges associated with manner of articulation. Yet it is also important to acknowledge that the anticipation of some types of errors, most notably those associated with voicing, are common in TE speakers. If the composition of any given stimulus list is not considered, comparison and monitoring of a TE speaker’s accuracy may be limited [
53]. Finally, as has been suggested in prior research, concerns specific to both the phonetic complexity of the target stimuli, lexical or semantic factors [
40], as well as their relative word frequency, may also influence the accuracy scores obtained [
36,
37,
48].
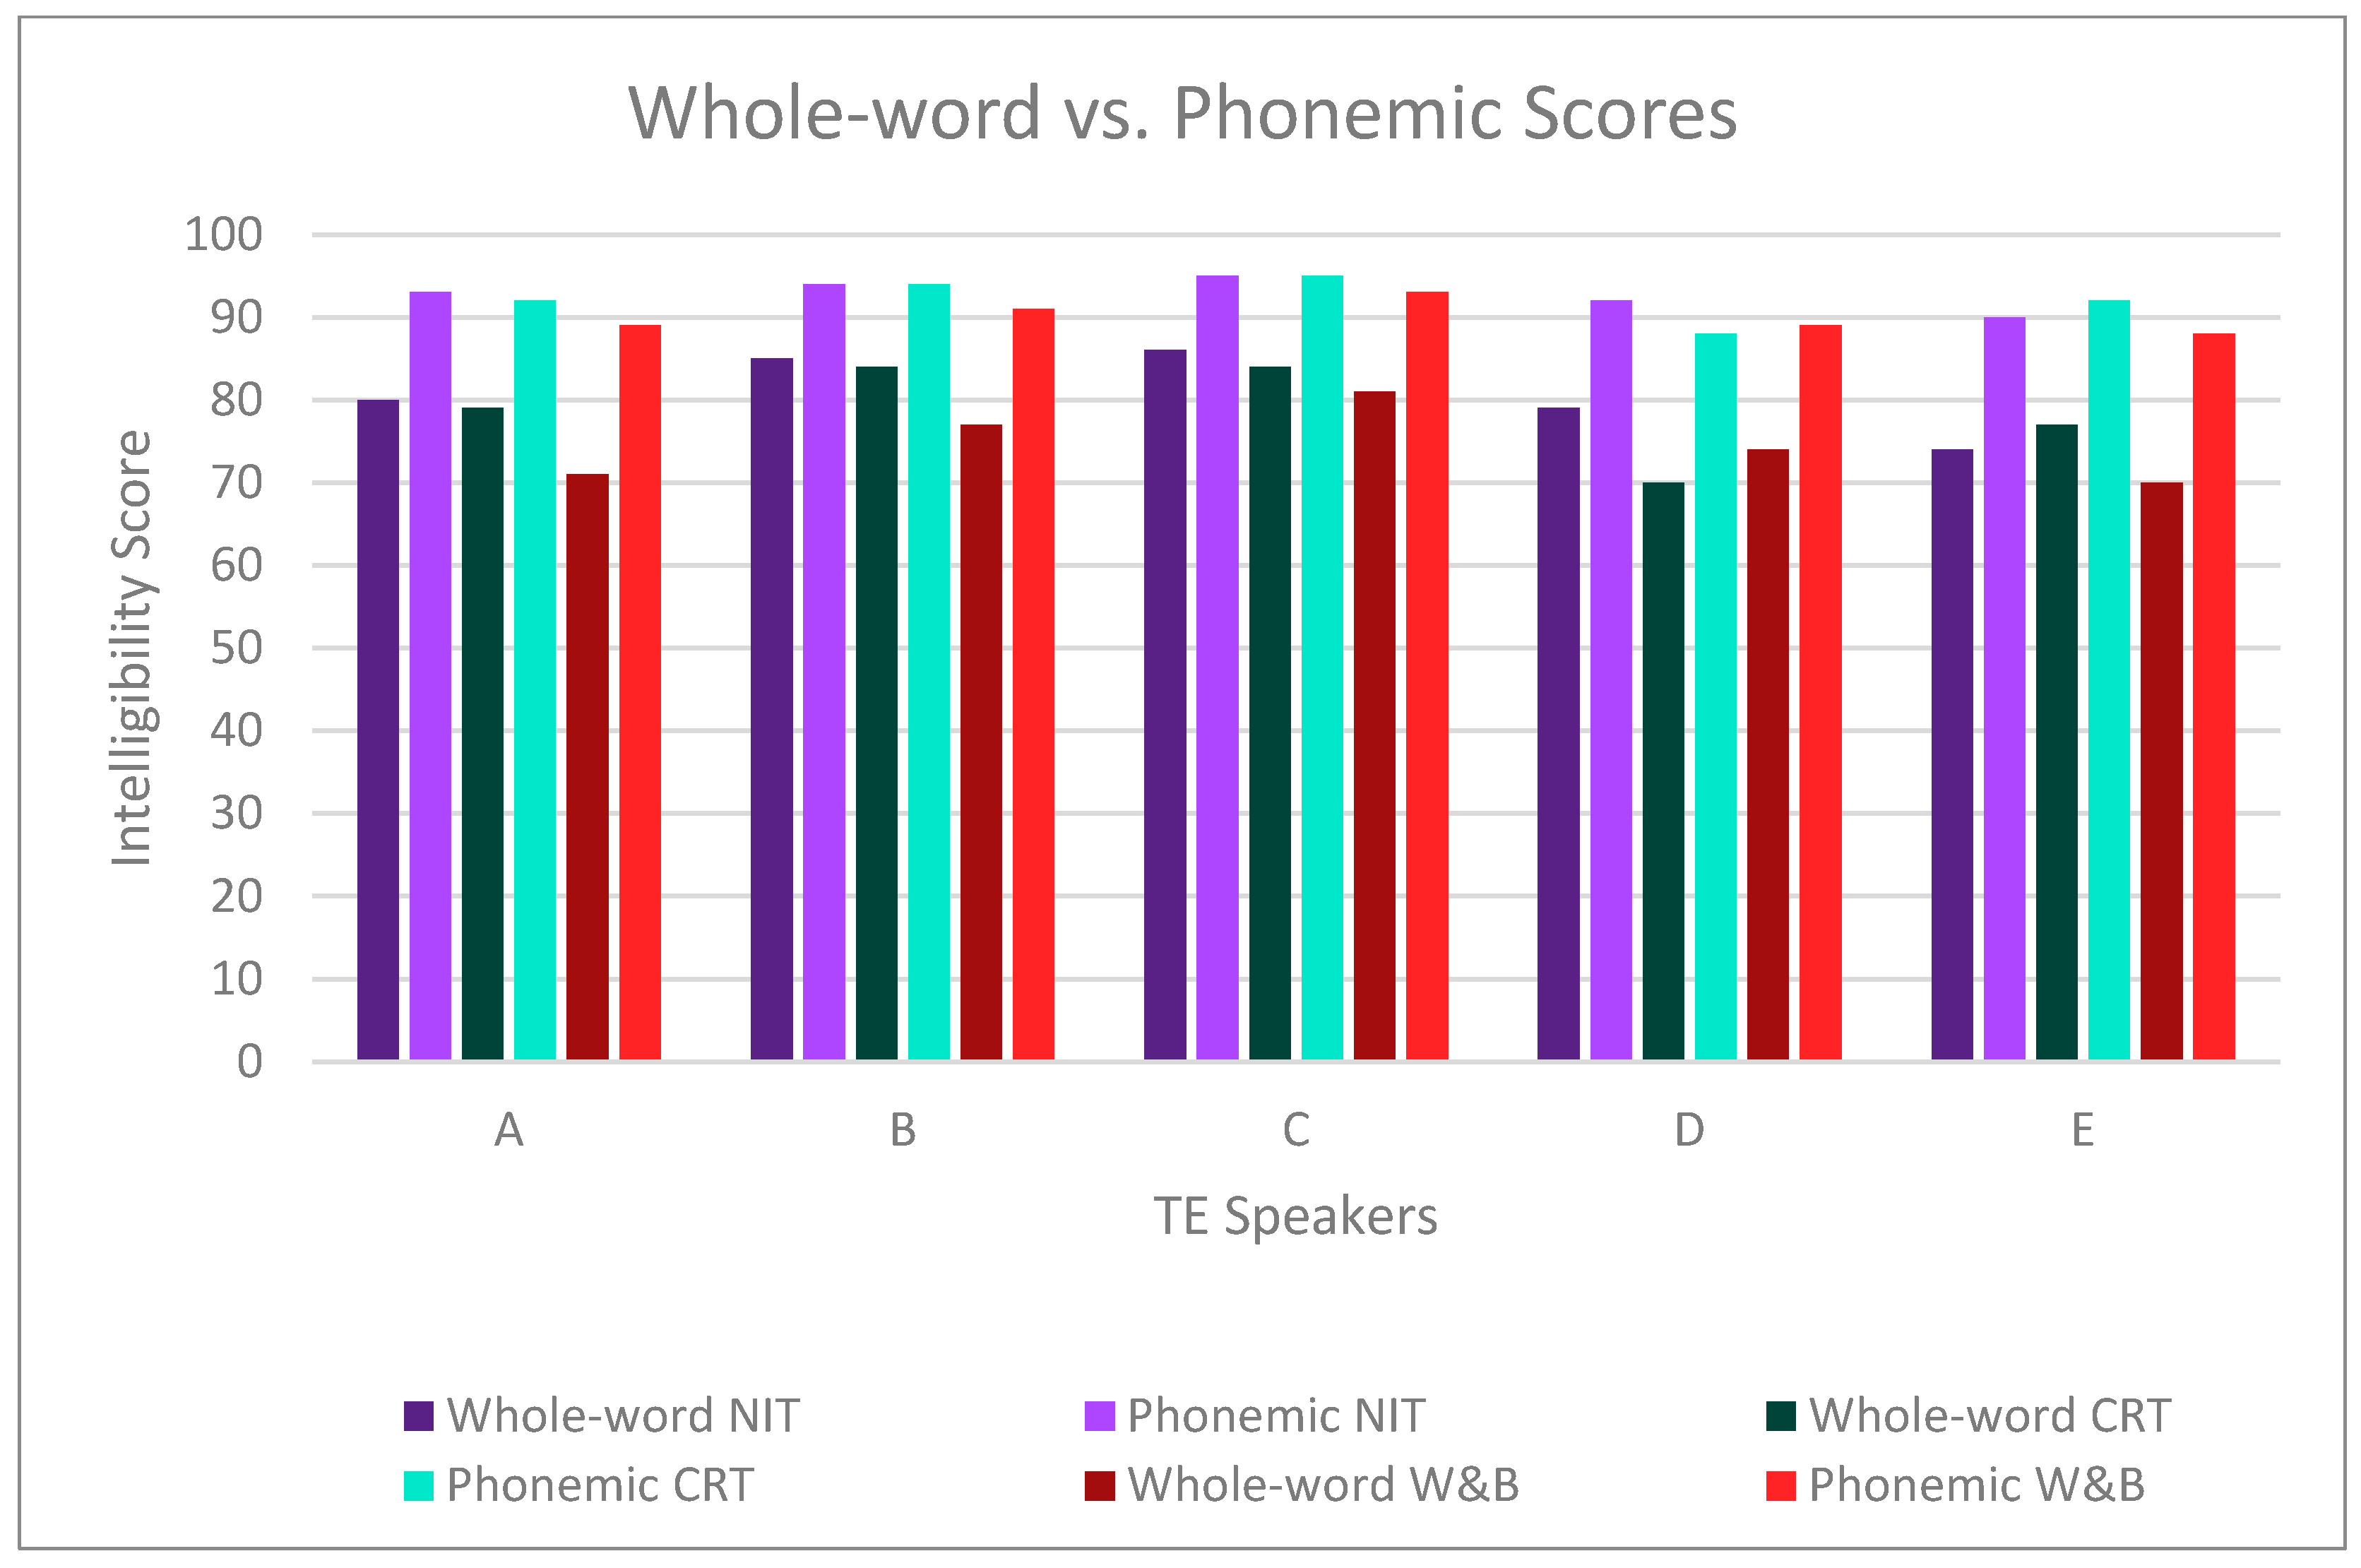
Although all postlaryngectomy alaryngeal speakers will exhibit voicing errors regardless of alaryngeal mode, TE speakers may exhibit unique patterns. For example, TE speakers appear to exhibit a distinct “voicing advantage” over esophageal speakers [
10] despite use of a non-adductor/abductor postlaryngectomy voice mechanism. Despite these findings, few studies have considered or investigated TE speaker performance relative to a specific intelligibility word list. Ultimately, the concern raised in this context relates to the potential for any given word list to vary in the accuracy score that is derived. While it is understood that measures reflecting mean group accuracy scores may not be representative of individual speaker performance, we are more concerned with potential variability that is a direct consequence of list construction. Most notably, Speaker C was consistently perceived as the most intelligible speaker for all three intelligibility word lists studied. Further, Speakers C and D serve as cases in point to the observed variability across lists (see
Table 1), yet other considerations may be noted.
For example, intelligibility outcomes for three laryngectomee groups were studied by Williams and Watson [
19] and expert judges rated TE speakers to be significantly better than the esophageal and electrolarynx speakers on measure of intelligibility. The naive judge group rated the intelligibility of TE speakers to be significantly better than the electrolarynx speakers but found no significant difference in esophageal speakers. This may suggest that the phonetic construction of stimuli used for such assessments of postlaryngectomy speech must be carefully considered as an influencing factor in the accuracy scores obtained and how they may be weighed when comparing across studies.
Doyle and colleagues have reported that when compared to traditional esophageal speakers, the consonant accuracy of TE speakers was significantly better [
10]. Further, Doyle et al. attributed the superior accuracy of the TE speakers to differences in the aerodynamic driving sources between the two alaryngeal modes. Their study assessed three esophageal speakers, three TE speakers, and one dual-mode speaker who was proficient in both esophageal and TE modes. Nonsense stimuli (consonant-vowel-consonant) were presented to naïve listeners who were asked to transcribe their responses using an open-set response paradigm. Plosives, fricatives, nasals, and liquid-glides produced by TE speakers were found to be significantly more intelligible when compared to stimuli produced by esophageal speakers; this finding was also consistent for the productions of the dual-mode speaker. While both speaker groups were similarly intelligible for voicing distinctions, the error pattern was different. Esophageal speakers were found to be better at producing voiceless targets; the production of voiced targets was found to be superior for the TE speakers; however, it is important to reiterate that these data were based on judgments of nonsense stimuli. We would, however, also like to acknowledge that the present data were collected in an optimal listening environment. Thus, the issue of reductions in the accuracy of consonant identification in less-than-ideal listening circumstances also must be considered. For this reason, the accuracy of identification will be influenced by not only the amount of background competition to the TE speech signal, but also by the type of noise [
15].
Tardy-Mitzell et al. [
18] assessed the speech acceptability and intelligibility of 15 TE speakers. Conversational speech, automatic speech, a standard passage, and the CRT were recorded on video tape. The listeners had no auditory training or clinical experience with alaryngeal speech. These listeners rated the TE speakers to be highly acceptable and intelligible with scores ranging from 80.7% to 97.5% and a mean score of 93%. These early results indicated that TE speakers are highly intelligible even to naïve listeners. However, based on the findings from our study, whole-word scoring and the use of multiple-choice word lists may have inflated the scores in Tardy-Mitzell et al. [
18] to some extent due to lexical, semantic, or other selection-based or listener-based factors [
38,
39,
40,
41].
As noted, multiple-choice test materials may be influenced by both the number of foils provided within a response set and the phonetic composition of those foils. That is, foils that more closely align with the target, for example, differing in only a single, distinctive feature, may offer either greater or lesser perceptual challenges to the listener. From a clinical perspective, the use of a closed-set response format may pose inherent perceptual limitations. A listener also may identify a target word by chance alone based on a “best guess” approach from the options provided. Whole-word scoring methods were used in these past studies. This means that the response was scored either correct or incorrect with no special consideration of the specific nature of the errors. We believe that the identification of these errors via phonemic scoring can provide valuable information to the clinician about the speech production difficulties encountered by this clinical population. Minimally, we believe that our data support the notion that the content of specific word lists must be carefully considered in relation to the accuracy of outcomes generated. Ultimately, word scores may only serve to artificially inflate a TE speaker’s accuracy level and to potentially limit attempts to further improve a given speaker’s accuracy via direct therapy.
4.1. Limitations of the Present Study
Several limitations associated with the present work deserve mention. First, the present study used only a small sample of TE speakers, all of which were judged to be proficient speakers by experienced clinicians. For this reason, these results cannot be generalized to less proficient speakers, or those of similarly high levels of speech proficiency. Further, despite being naïve listeners, it is possible the listener bias existed to some extent due to their experience with IPA. Based on our observation of variability in accuracy scores both across speakers and listeners may suggest that the more refined phoneme scoring may offer value for ongoing clinical assessments of TE speakers. However, the time demand associated with phonemic transcription may offer limits from a clinical standpoint. Furthermore, list construction remains a question relative to other sources of variability and in the present study, the ability to generalize findings across word lists is difficult due to contextual issues (e.g., the variation in vowels used across stimulus lists). That is, accuracy scores will be influenced by the content of stimuli within any given word list. In this regard, the W&B materials provided reduced accuracy scores; however, the stimuli included in that list had a greater representation of consonants than the other two stimulus lists studied. Ultimately, we believe that the ability to evaluate the widest array of consonants will potentially provide a more beneficial means of assessment for clinical use. Yet it should be mentioned that, despite many years of information on postlaryngectomy speech accuracy, no standard method has yet emerged [
45,
54]. We would, however, also like to note that potential learning effects relative to the stimuli presented cannot be ruled out in relation to listener responses. We did attempt to mitigate this concern by carefully instructing listeners to transcribe exactly what they heard [
53], rather than guessing based on exposure to other samples. While this approach cannot fully rule out learning, on debriefing listeners once they completed the task, all indicated that they were diligent in seeking to provide transcriptions of what they heard.
The final issue relates to the participant speakers and the scores obtained. As noted, these five speakers were judged by experienced clinicians to be highly proficient. Overall, and regardless of the word list assessed, the present data support these speakers’ excellent levels of TE speech proficiency. However, the construction of word list stimuli appears to be an important variable in accuracy that cannot be disregarded. This finding was consistently observed for all speakers except for Speaker D who was perceived as more intelligible for initial consonants on the W&B list than for those of the CRT. Initial consonant production was similar for the NIT and for the CRT for both overall scores and individual speaker scores. This might suggest that as overall subjective judgments of speaker proficiency decreases, we might observe a commensurate increase in productive/perceptual errors during more refined assessments of speech accuracy. Thus, the types of errors noted (i.e., manner of production, place, voicing, phonetic position in stimulus) may not necessarily be demonstrated in a consistent manner to that observed for our speakers. We would, however, anticipate that less proficient speakers would also present with greater levels of challenge across consonant categories. That is, phonemic errors are likely to be very individualized and idiosyncratic in nature which may result in complex types of errors that reflect deficits across multiple distinctive features that characterize any given word list [
46]. Further, the influence of noise on listener judgments must always be considered in the larger context of speech accuracy and intelligibility [
15]. This suggestion would argue for efforts to standardize speech intelligibility assessment tools to document reductions in postlaryngectomy speech accuracy. Thus, comprehensive efforts which seek to address factors related to the stimuli used for assessment, the representation of speech sounds inherent to such stimulus items, listener sophistication, methods of scoring and listening paradigms used for evaluation are necessary.
4.2. Implications of Data
With effective speech rehabilitation, a laryngectomized patient can achieve generally good levels of TE speech intelligibility. This study demonstrated that individual speaker variability, however, must be considered through the implementation of phonemic scoring of any given speaker’s productions. That is, the identification of individualized patterns of production/perception may be optimized through use of distinctive features, most specifically relative to voicing and manner of production, as a point of assessment. Thus, accuracy scores will be stimulus dependent due to unique aerodynamic and acoustic characteristics of the TE signal [
9,
10,
27,
28,
29,
30,
31,
33,
34]. This more refined method of analysis will certainly be a reflection of how any given stimulus word list is constructed. In the present study, the W&B stimulus word list had the lowest variability of the three lists compared in this study, suggesting that it may be a more useful tool for determining the accuracy of TE speakers. Thus, a clinician may have greater confidence that changes in a speaker’s speech production (and consequently their perceived accuracy) during the period of therapy are due to treatment rather than being a function of variation in phonemic representation that characterizes any specific word list. Thorough analysis of a speaker’s phonemic productions is an important and sensitive procedure which should precede initial speech therapy in order to determine baseline performance. We would, however, note that phonemic scoring is not errorproof, particularly when real word stimuli are used as listener identification of target stimuli can be influenced by word frequency, familiarity, etc. [
48].
The findings of the present study warrant further research into TE speech accuracy and the construction of stimuli used to assess intelligibility. More investigation into individual speaker differences would provide better information for clinical assessment and therapy prognosis. Additionally, concerns about the experience of the listeners who provide judgments must always be considered [
54]. One of the restrictions of the small speaker sample used in the present study is the reduced generalizability of the findings to a larger TE speaker population. By investigating a larger sample, using a wider range of TE speakers, more generalizable results about the use of phonemic scoring and the W&B list and potentially other measures for accuracy evaluation may be obtained. Investigation into the test–retest reliability of the intelligibility assessment suggested in the present study could provide relevant information for clinical management. Finally, investigation into the pattern of production errors a speaker makes could provide greater information which would be of clinical utility in the treatment of TE speakers, thereby improving the prognosis of speech rehabilitation.
The final area of discussion that has practical implications relates to the surgical variability of those who undergo total laryngectomy and may pursue TE puncture voice restoration as a rehabilitation option. The speakers present in the study had undergone standard laryngectomy without reconstruction; for that reason, the present data and the generalization of our findings to those with more extensive surgical resections and/or reconstruction must be carried out with caution. Of particular importance in this regard is the potential loss of valuable speech production information should whole-word and/or forced choice judgment paradigms be employed; clearly our data suggest that information may be lost using such methods. However, the present findings should encourage future awareness specific to the phonetic structure of stimuli used for testing postlaryngectomy speech accuracy [
10,
33,
34,
52,
53]. At the very least, comparison across postlaryngectomy TE speaker groups (i.e., those with reconstruction and those without) may be undertaken. Such information may then foster a better understanding of how a range of surgical treatment factors may influence speech outcomes. Based on this concern, it continues to be imperative that further efforts directed toward devising assessment methods (i.e., both the construction of stimulus materials and the method of scoring production accuracy) and which target postlaryngectomy speech accuracy be pursued.


