
Research on Visualization Technology of Production Process for Mechanical Manufacturing Workshop

Abstract
:1. Introduction
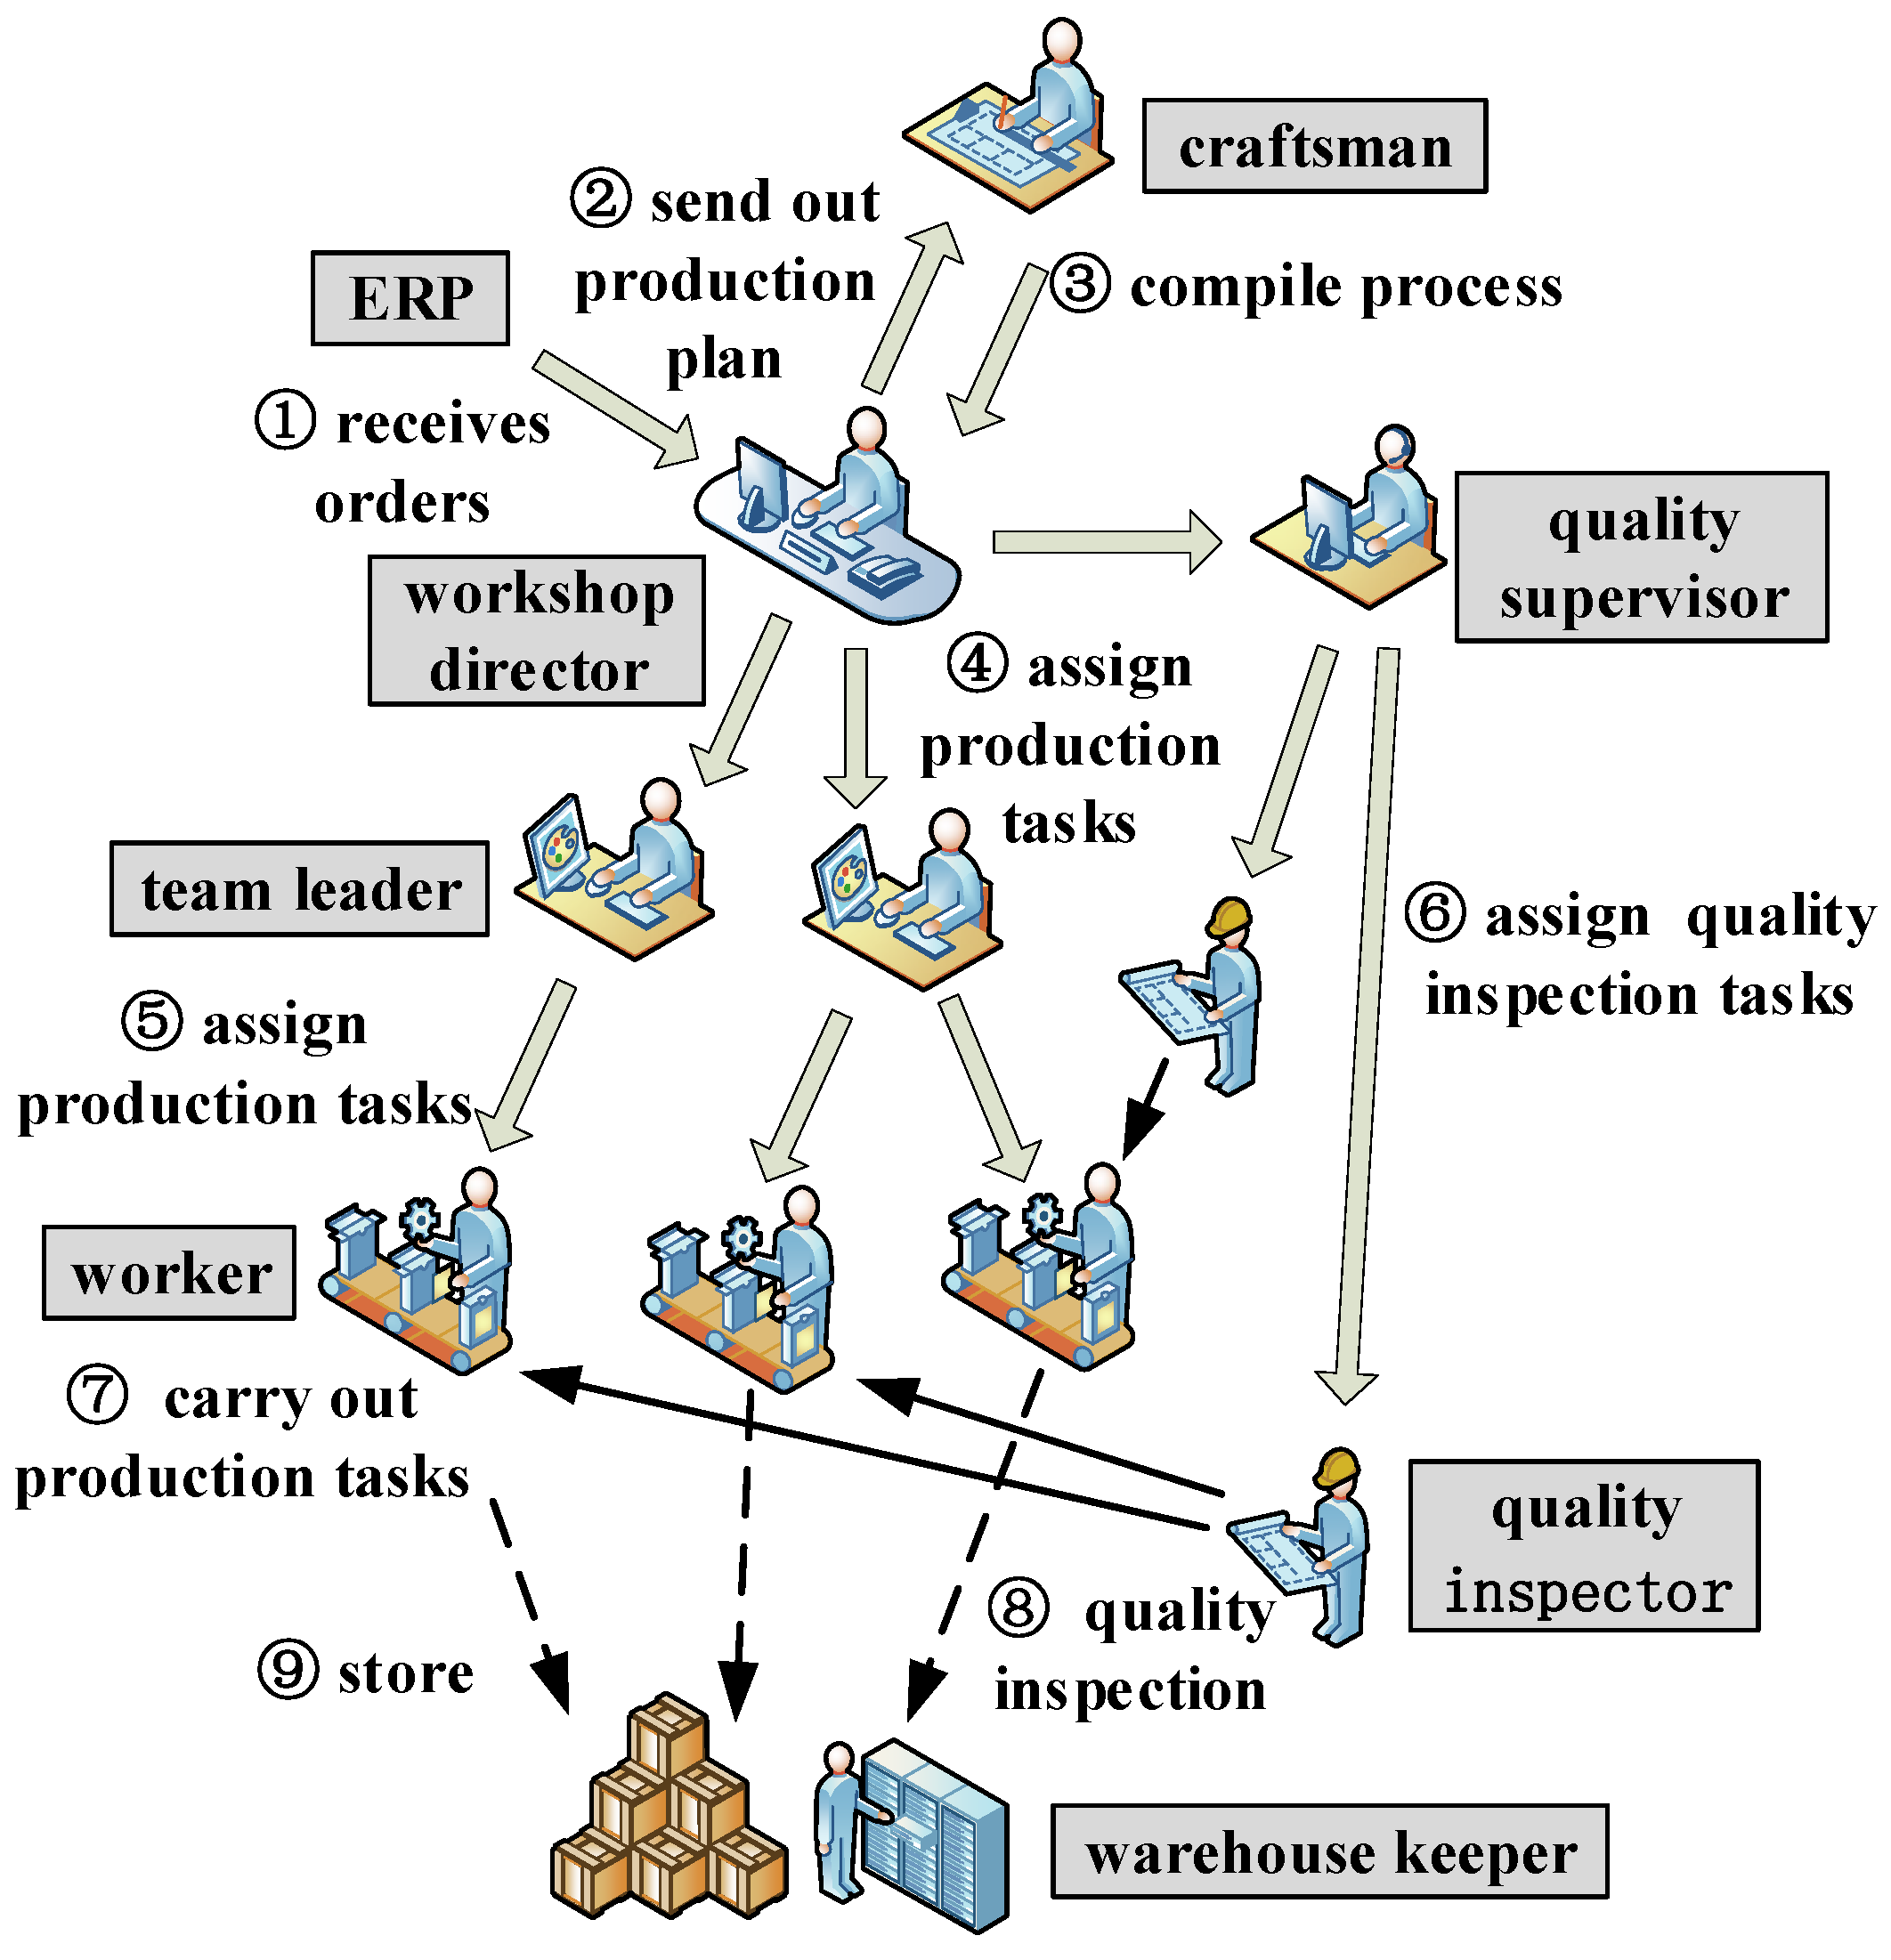
- (1)
- The workshop director receives orders;
- (2)
- The workshop director sends out production plan to the craftsman;
- (3)
- The craftsman compiles the production process flow;
- (4)
- The workshop director assigns the production tasks to the team leaders and the quality supervisor;
- (5)
- The team leader assigns the production tasks to the workers;
- (6)
- The quality supervisor assigns the quality inspection (QI) tasks to the quality inspectors;
- (7)
- The worker carries out production tasks in accordance with the production process flow;
- (8)
- The quality inspector inspects the work quality of the workers;
- (9)
- The product is completed and stored.
2. Literature Review
3. The Production Process Flow Chart Model
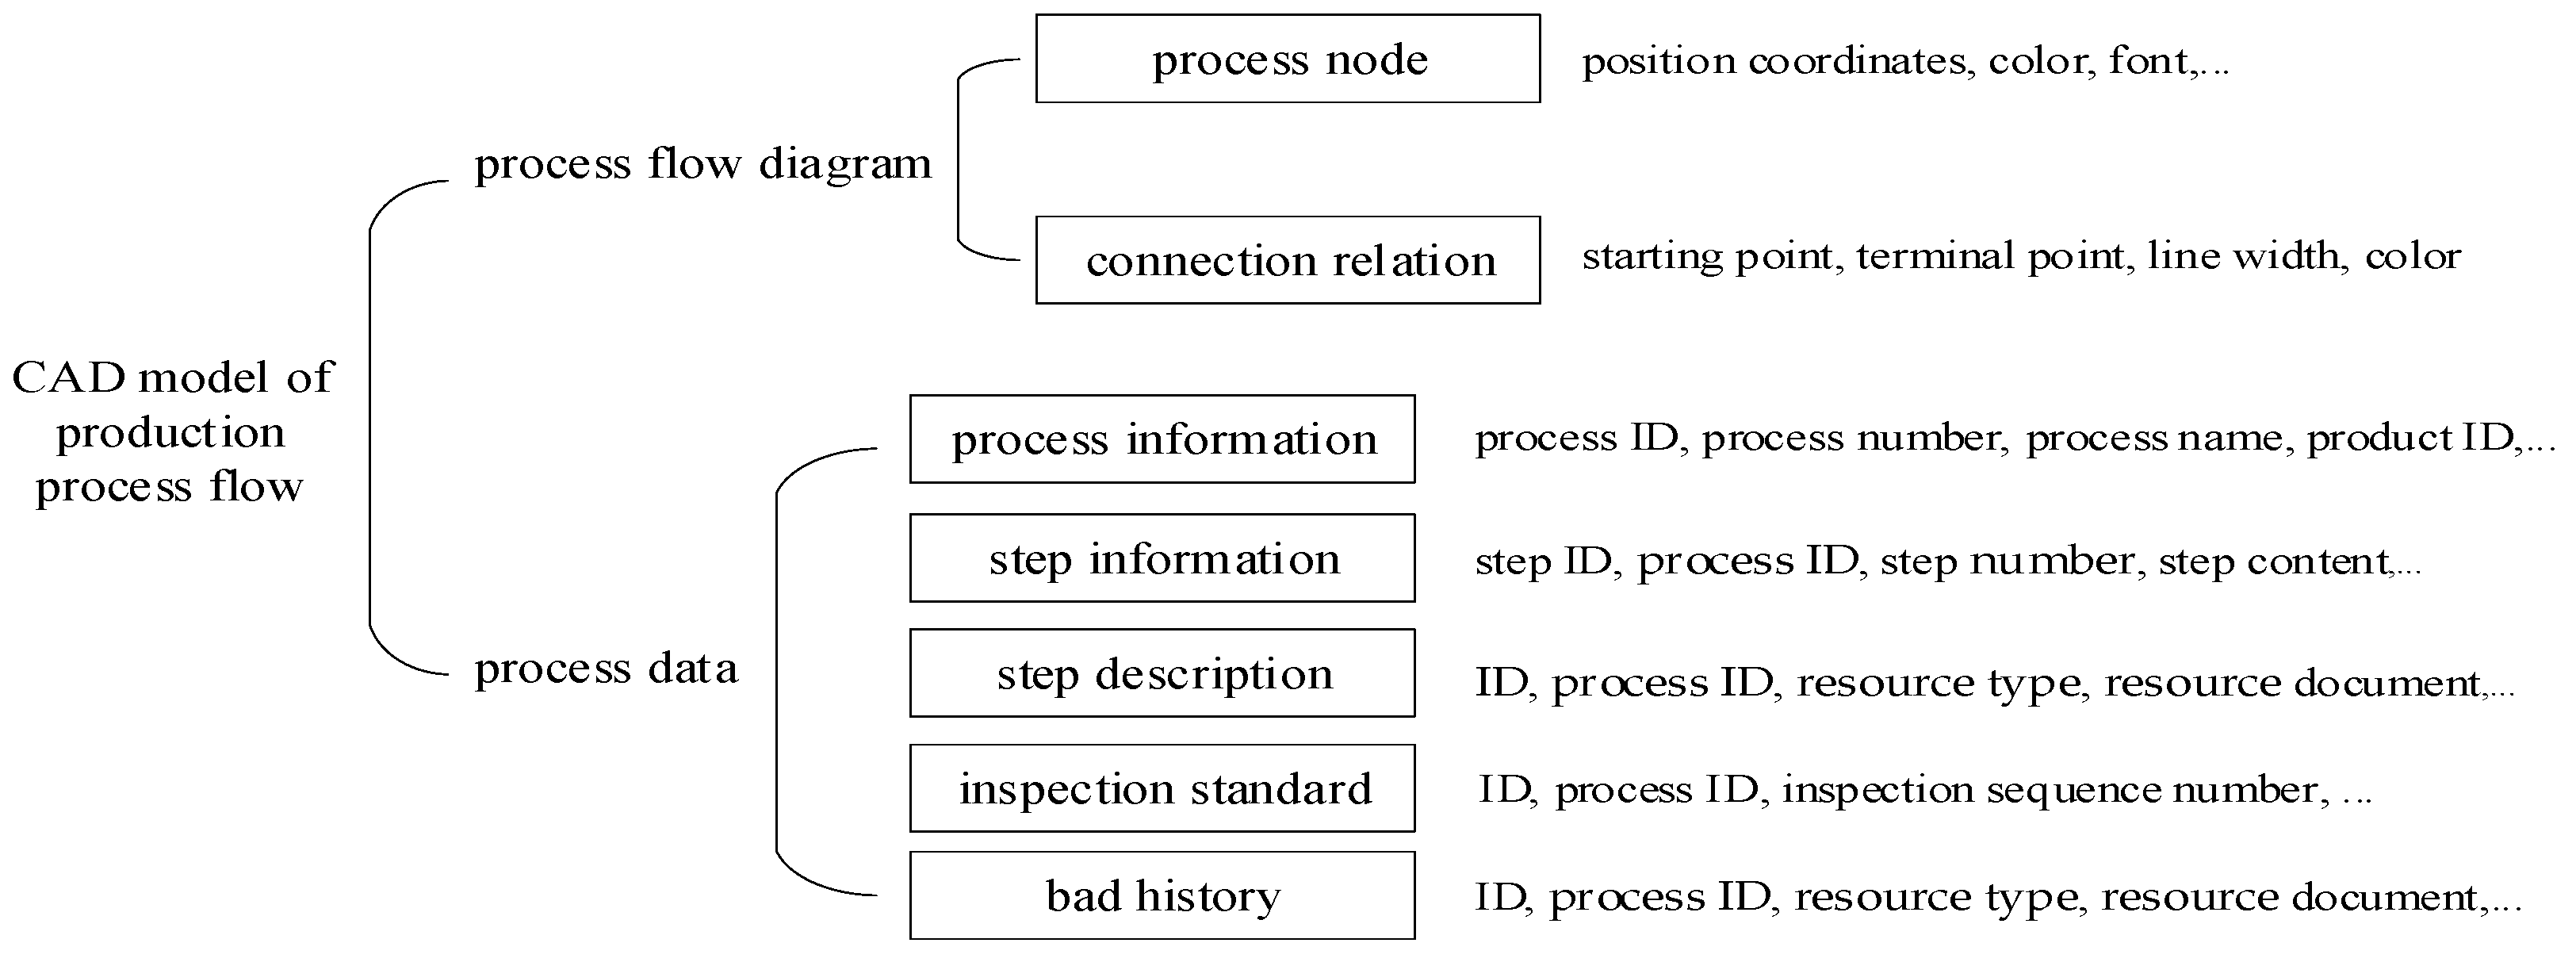
3.1. The Description of Production Process Flow Chart Model
- (1)
- Process nodes contain process number, process name, coordinate positions, background image, and font setting;
- (2)
- Connection relationships include previous process, follow-up process, arrow pointing, style, line width, and straight/broken line type;
- (3)
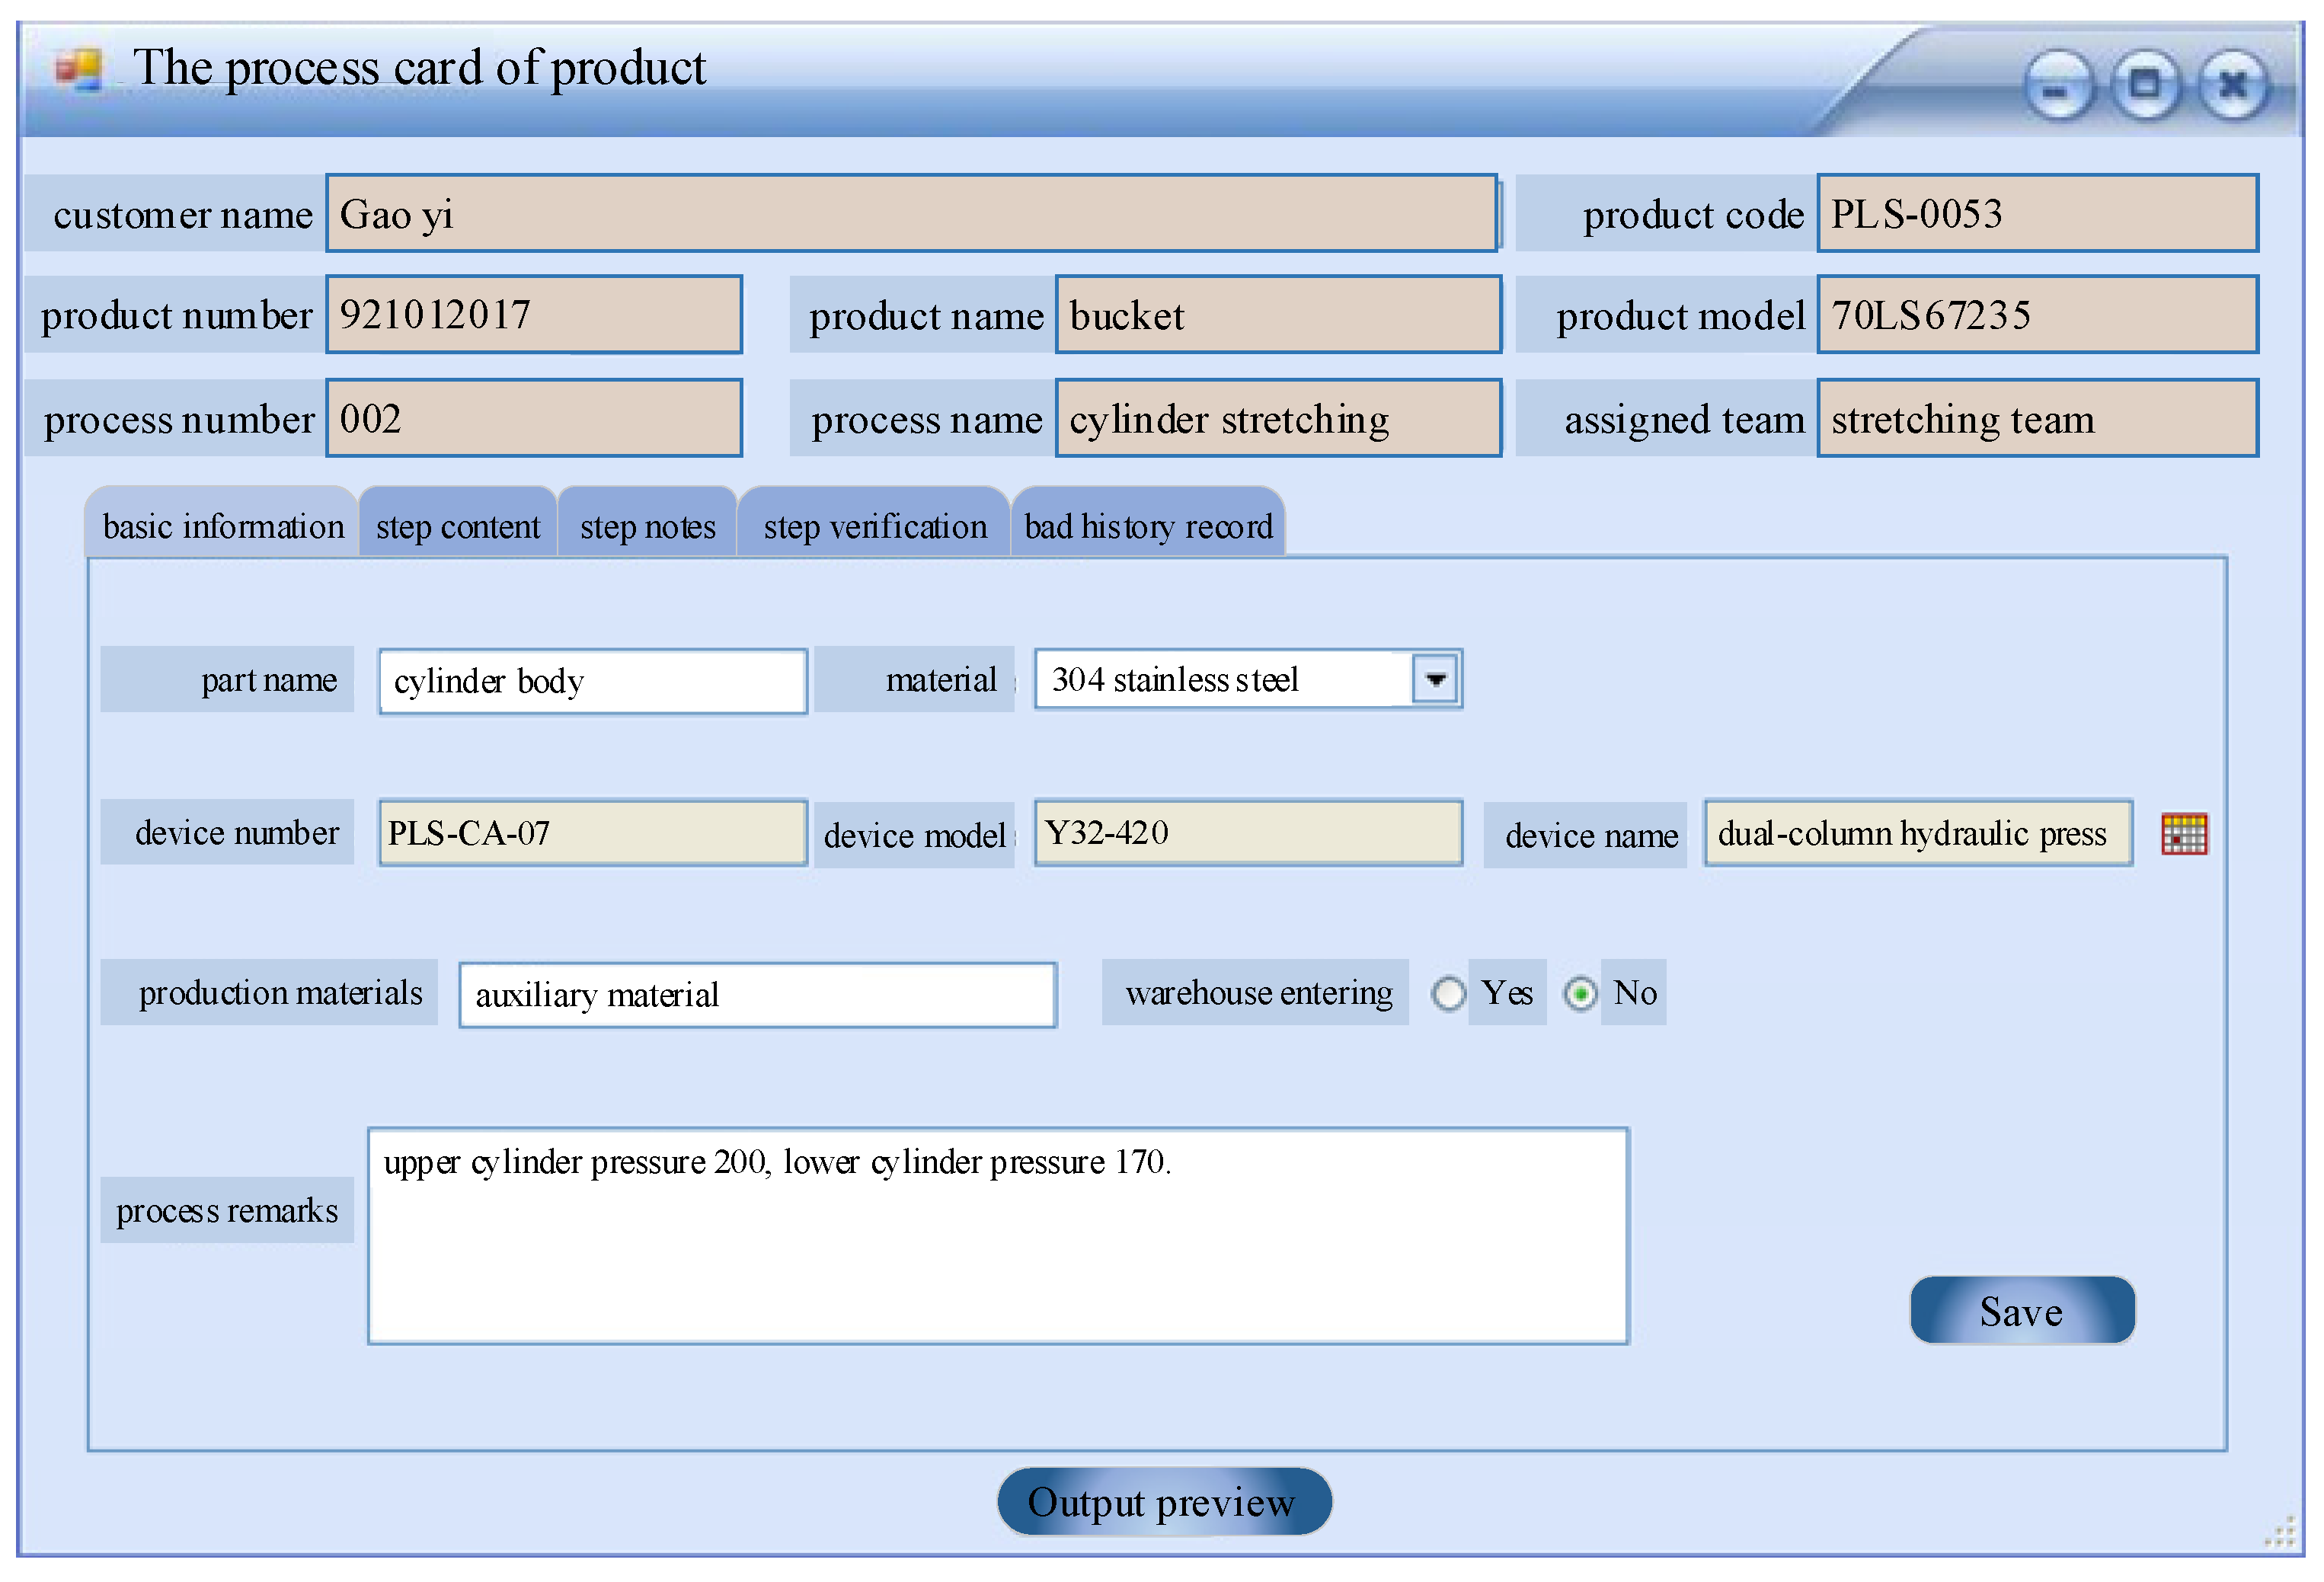
- Process information is made up of process ID, process number, process name, product ID, part name, processing equipment, processing material, assigned team, warehousing options, downstream process number, and remarks;
- (4)
- Step information contains step ID, process ID, step number, step content, specific content, piece rate unit price, and reference time;
- (5)
- Step description includes ID, process ID, resource type, resource document, and notes;
- (6)
- Inspection standard is made up of ID, process ID, inspection sequence number, inspection standard, inspection mode, input type, and inspection frequency;
- (7)
- Product information contains product ID, product name, product model, product number, version number, creation time, process flow chart file, and status;
- (8)
- Bad history record includes ID, process ID, resource type, resource document, and notes.
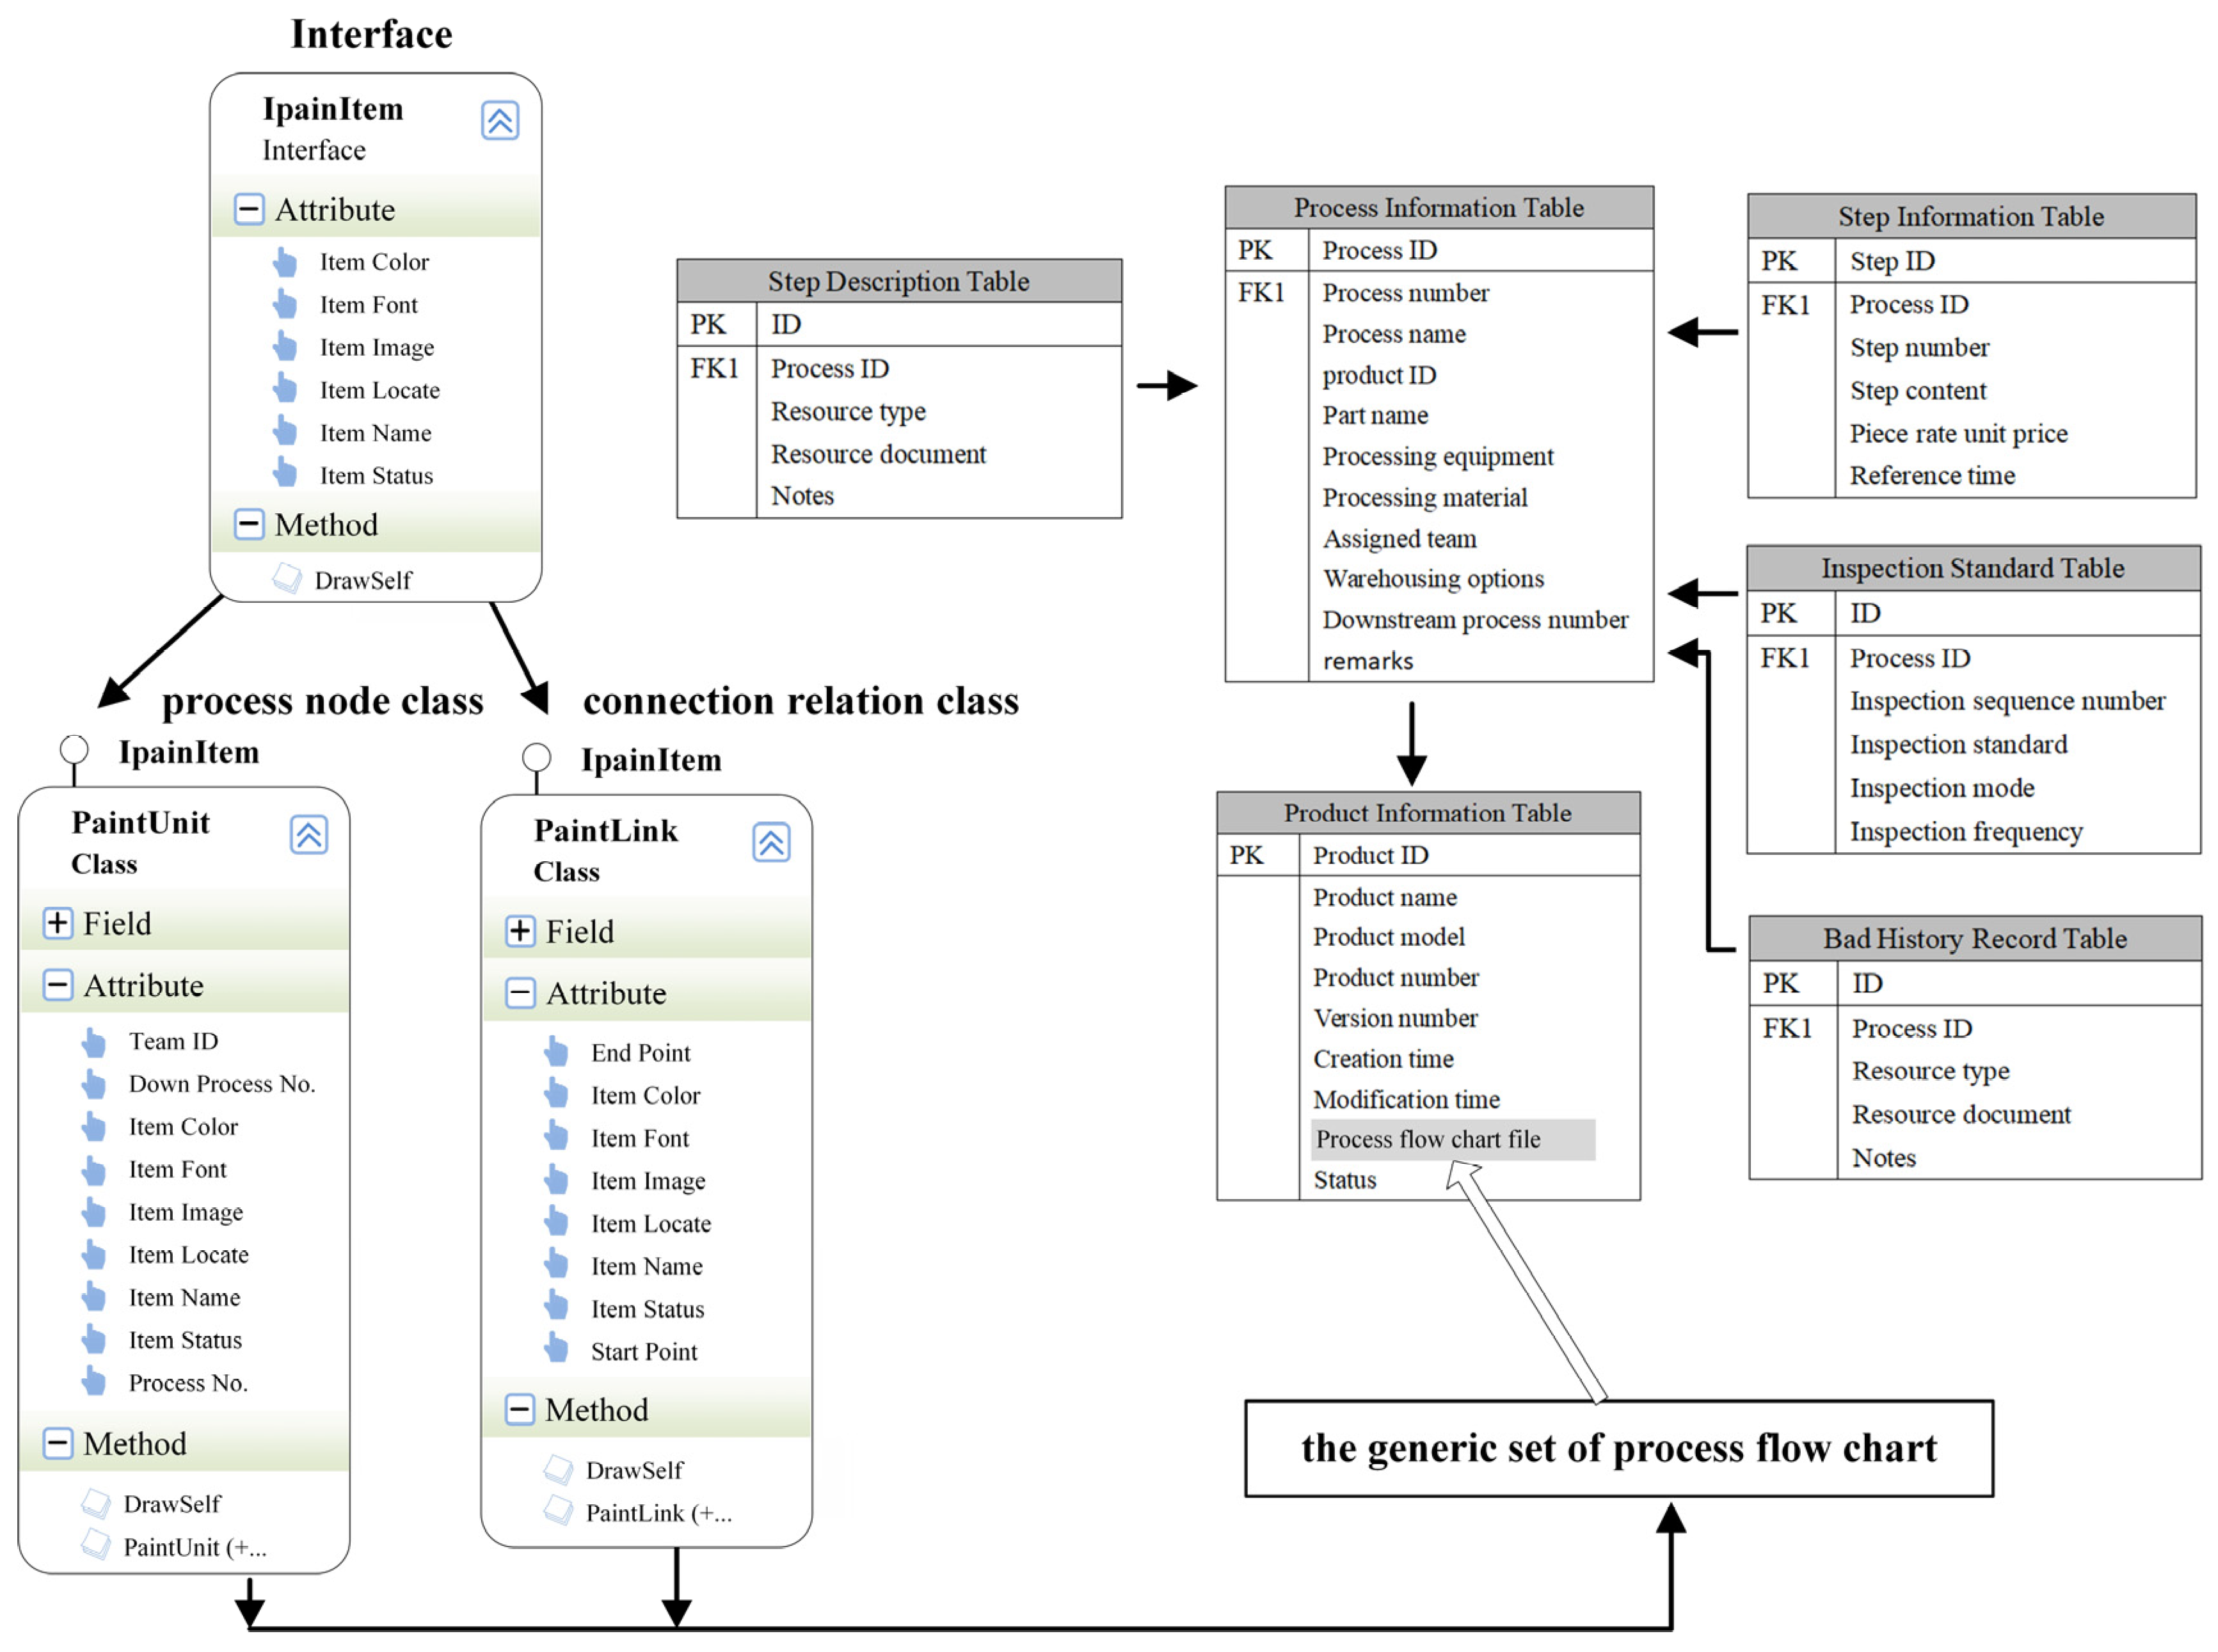
3.2. The Storage of Production Process Flow Chart Model
4. The Key Technologies of Visualization of Production Process Flow Chart
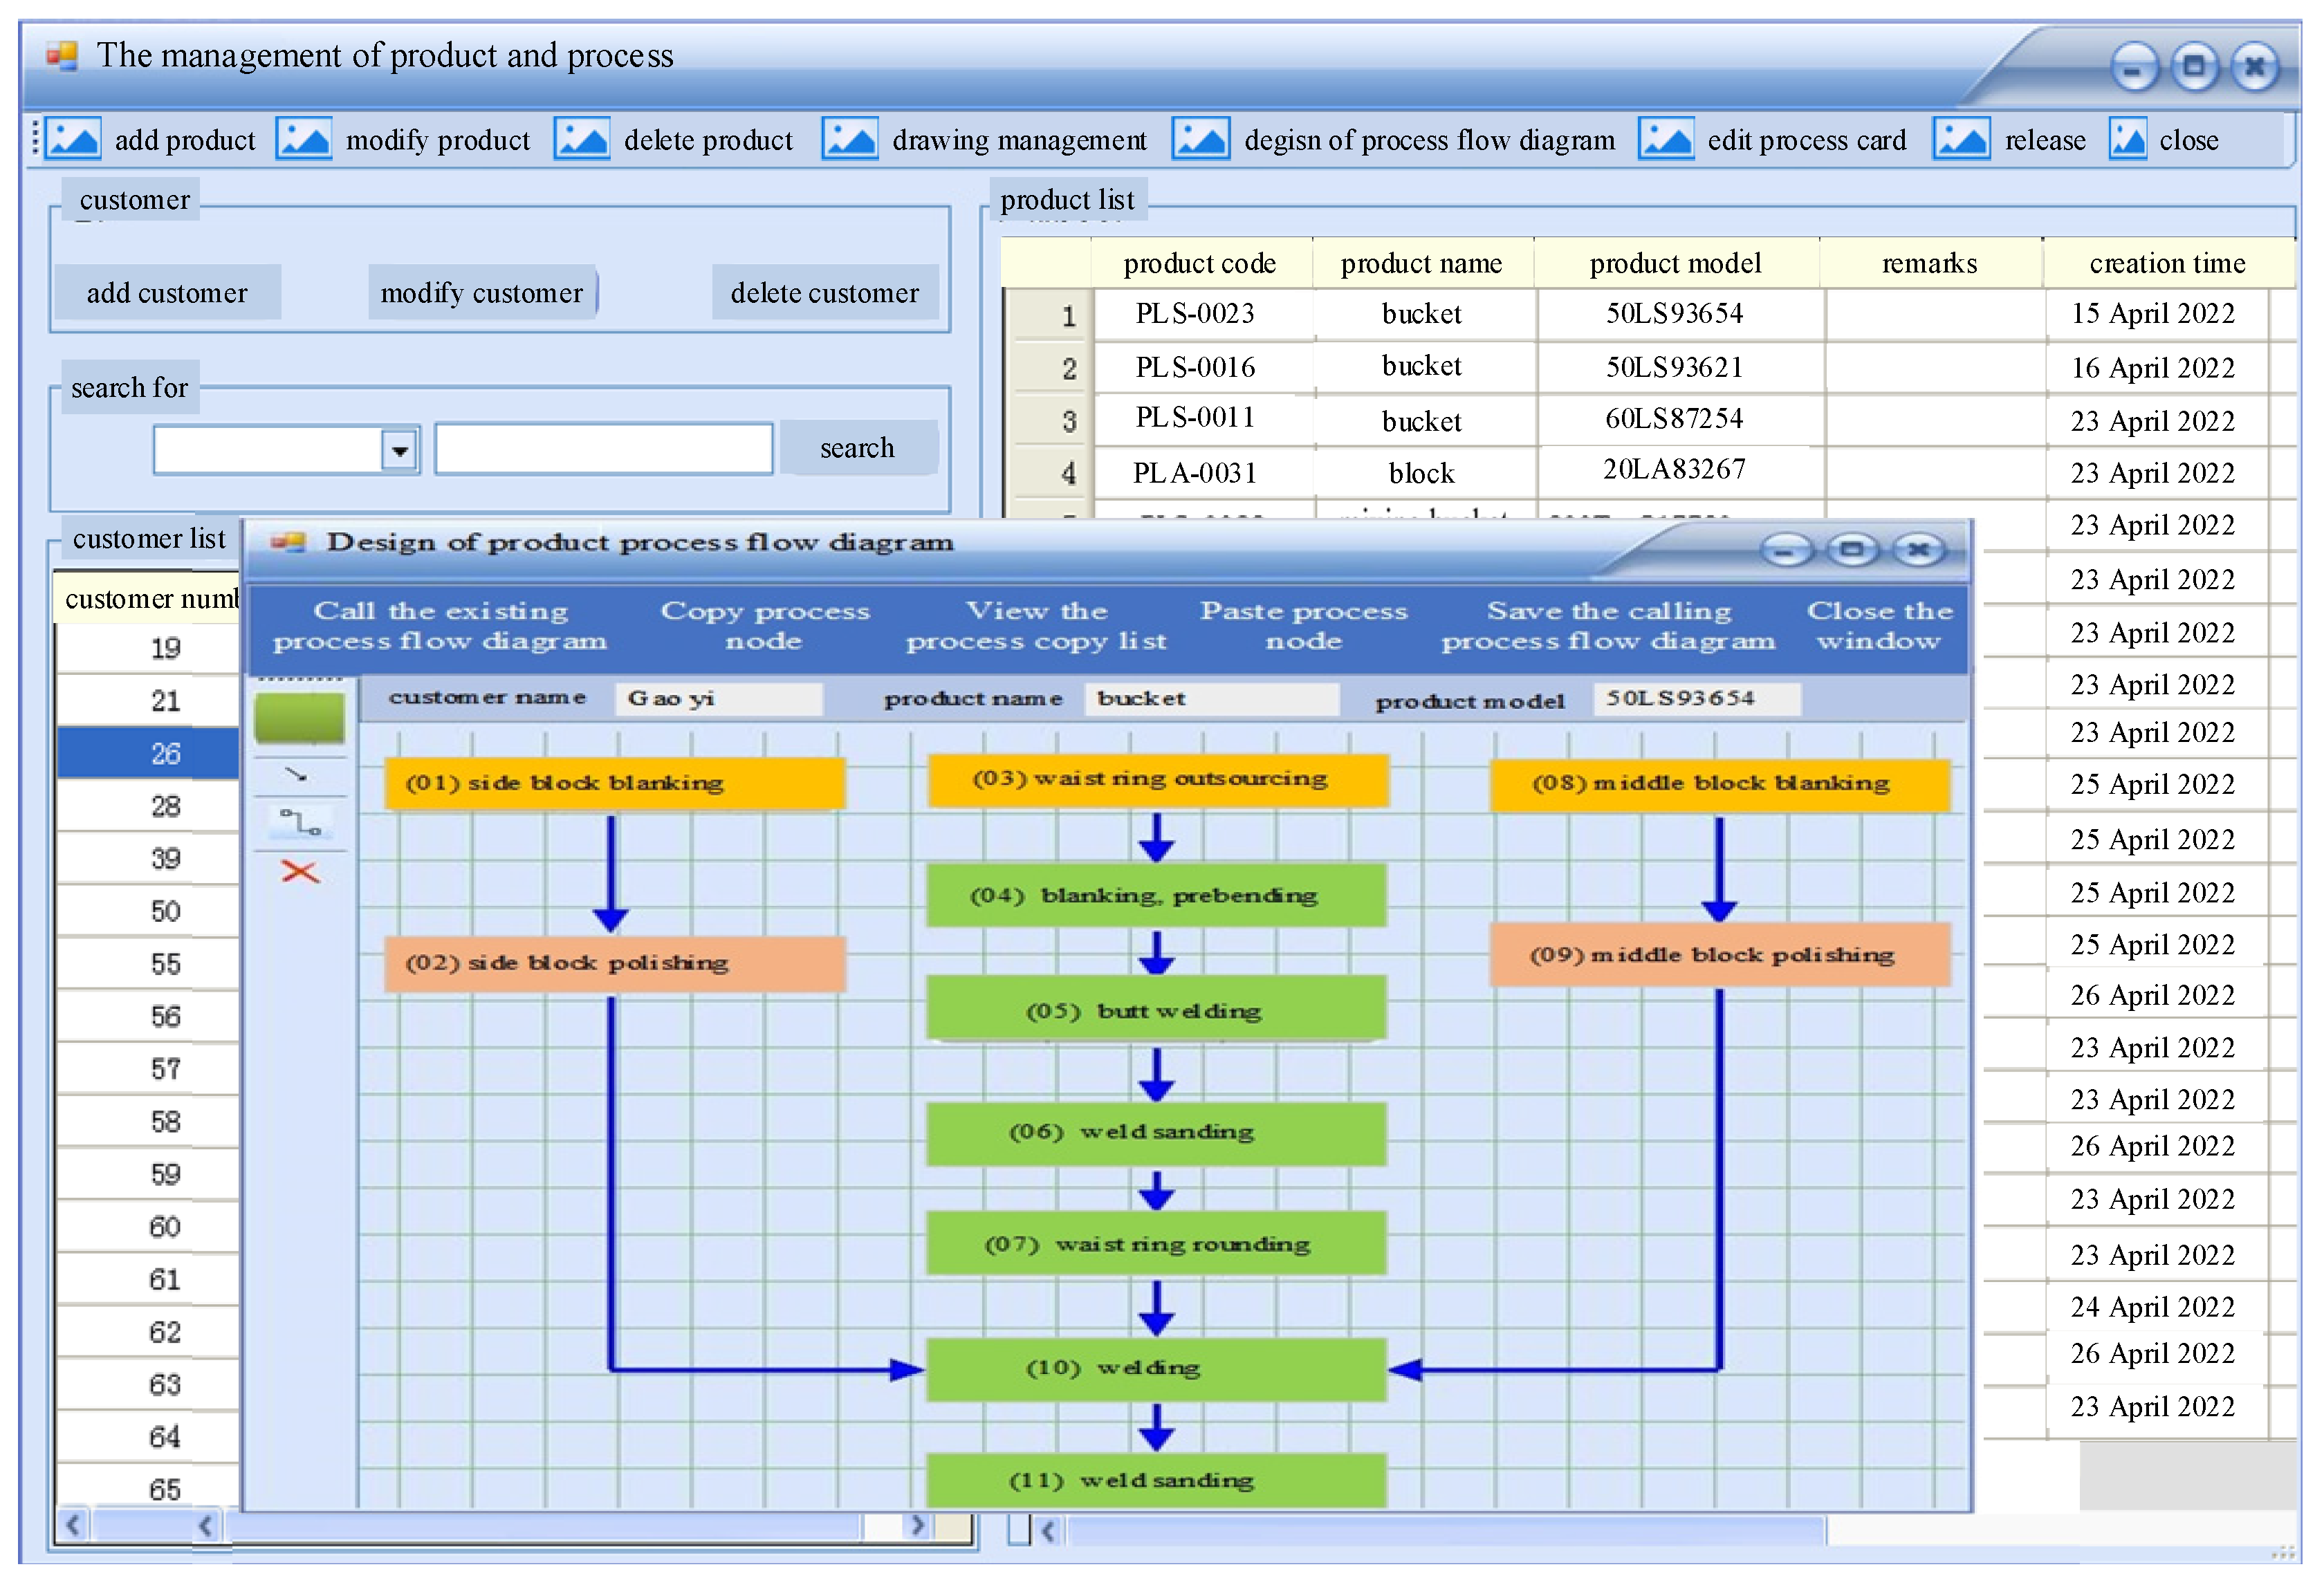
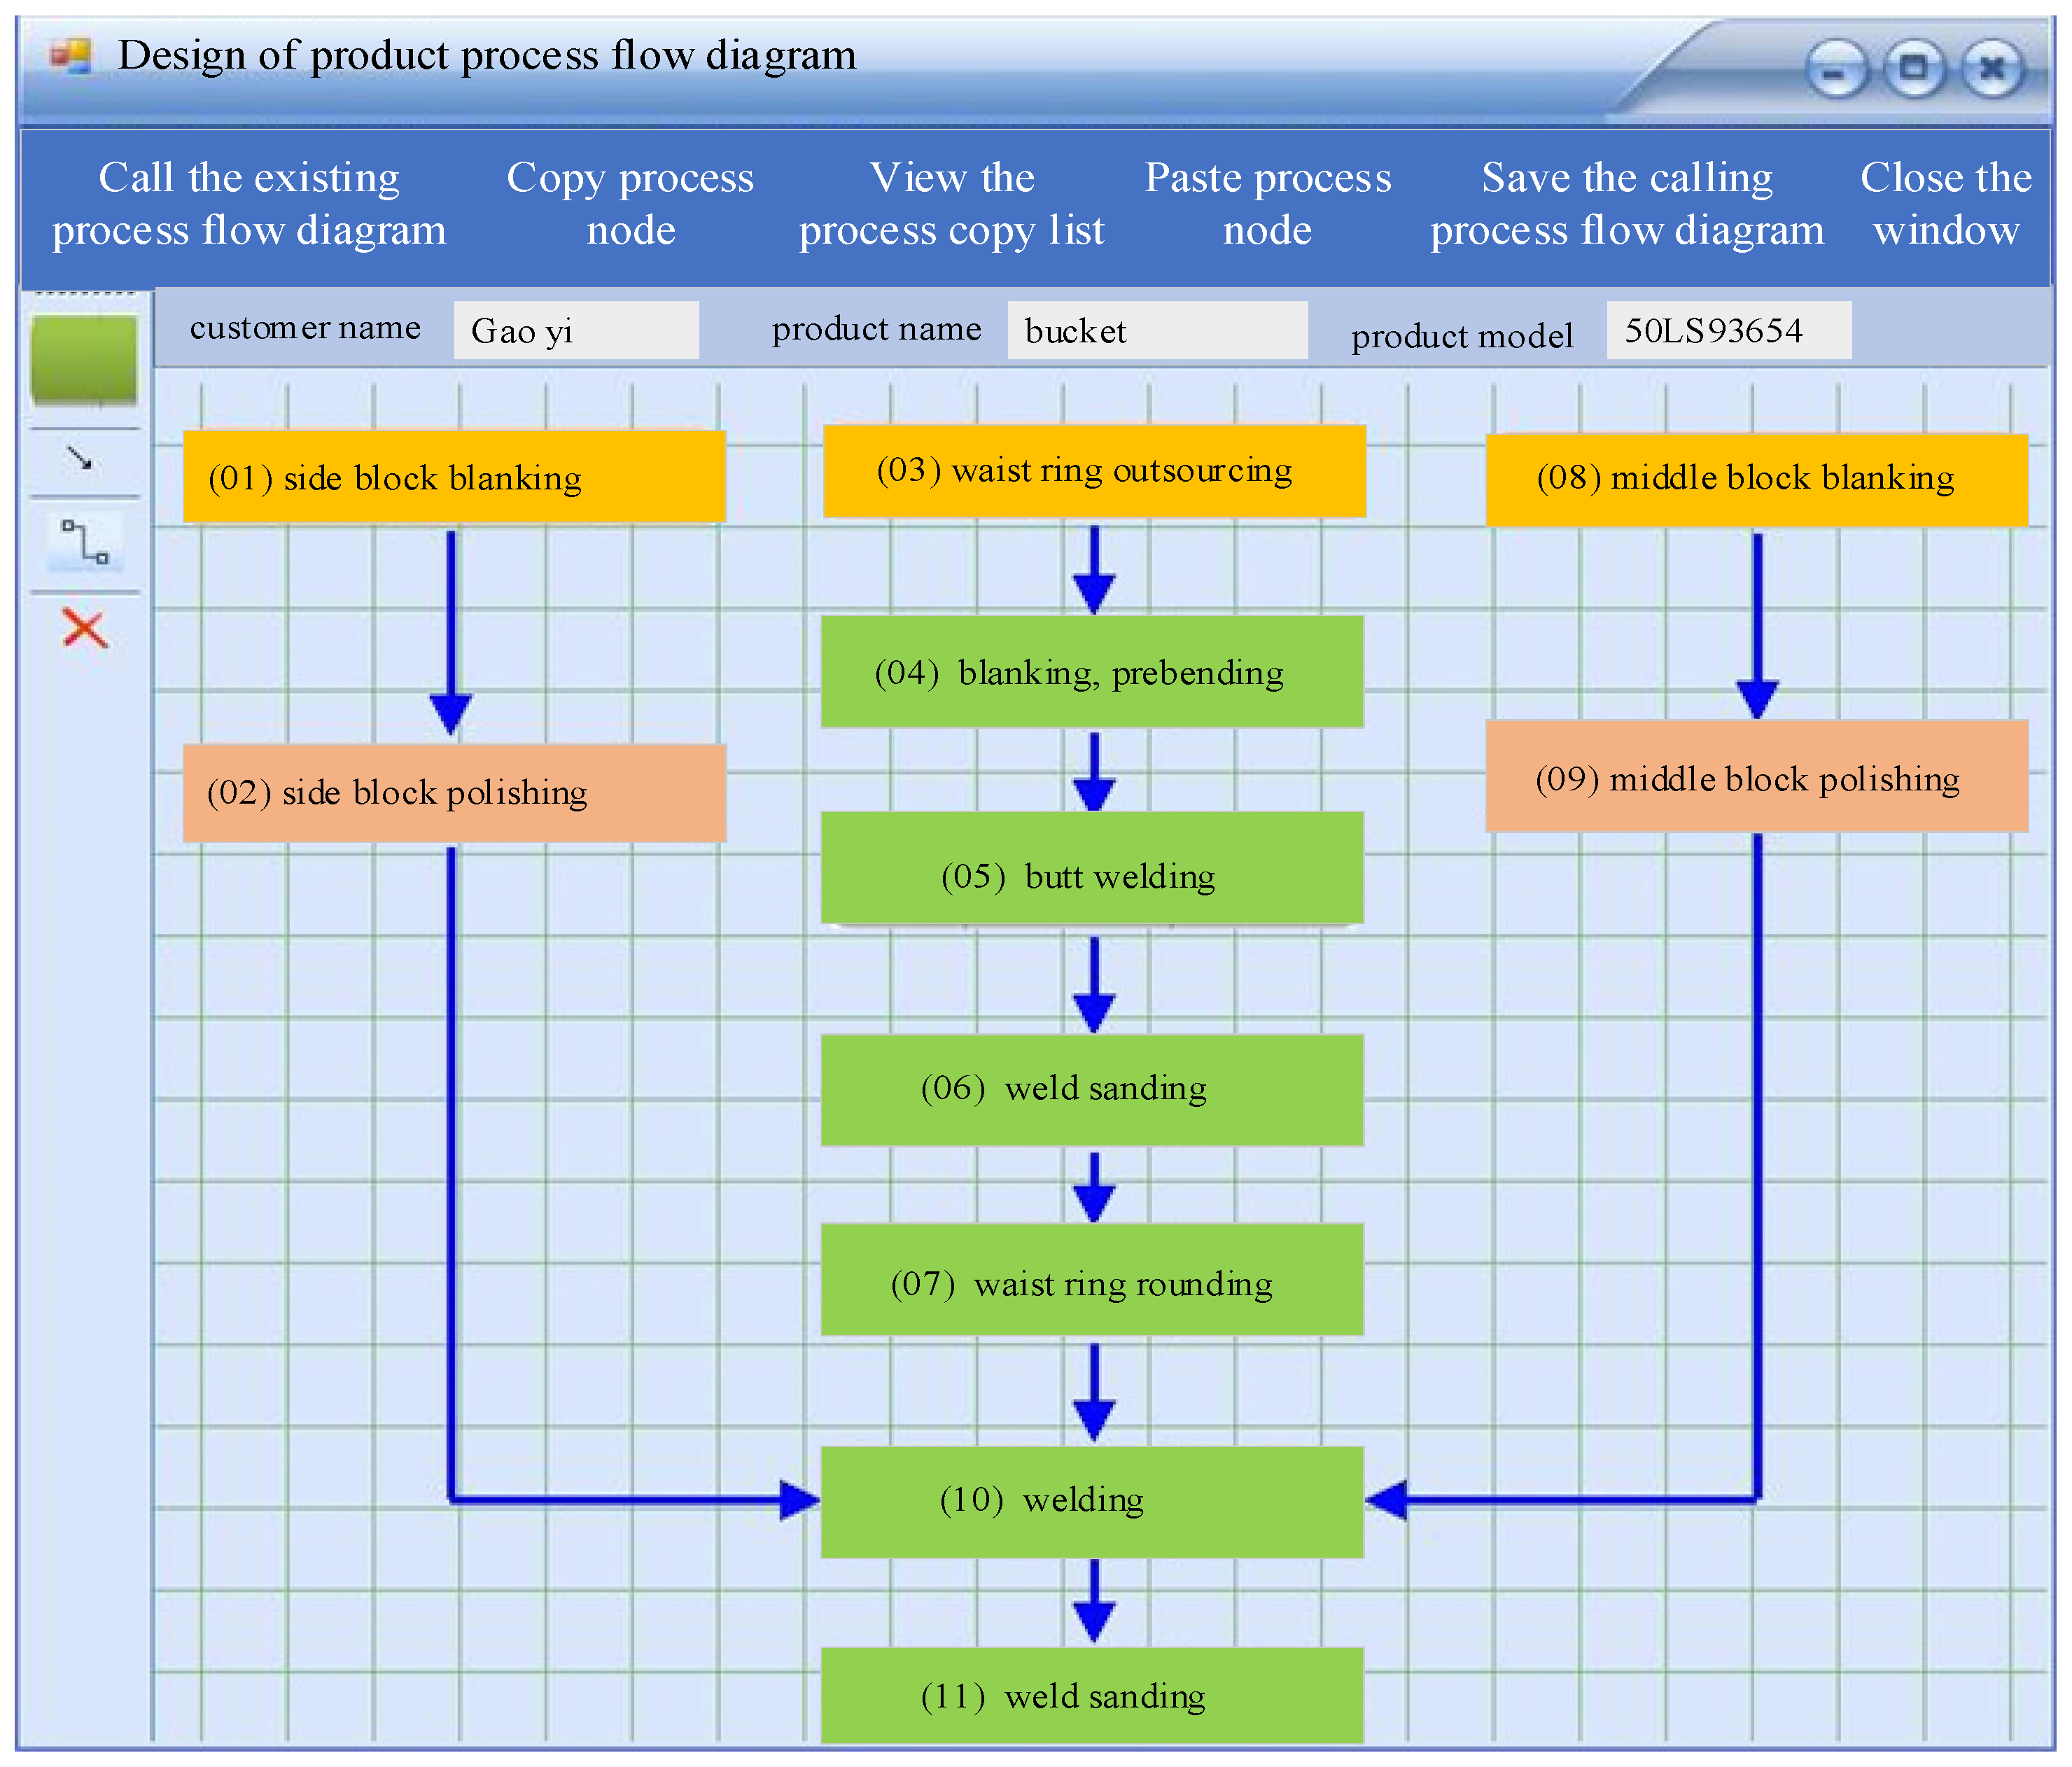
4.1. Visual Design of Process Flow Chart
- (1)
- Draw completely by hand. Each process node is dragged and dropped individually; then, they are progressively connected in a straight or broken line based on serial and parallel relationships to create a process flow diagram;
- (2)
- Copy or paste some of the current process nodes. One can open the current flow chart, select the process nodes one wants to copy, and then paste them into the desired flow chart if a few of the process nodes in the process flow diagram match those in the existing flow chart. The remaining part is drawn by hand. This technique significantly improves the drawing efficiency;
- (3)
- Alter an existing process flow diagram directly. One can call an existing flow chart and edit it if the process flow chart one wants to create is comparable to one already in existence. This approach can effectively reuse the original process flow chart, which will considerably increase work productivity.
- (1)
- Go through the flow chart. When entering the module interface, one can read the field content of process flow chart file in the product information table through the data access layer and then use the binary serializer to deserialize the data before obtaining the object set of List <IPaintItem>, which includes all of the process nodes and connecting line segments in the flow chart. After that, one traverses the set and calls the DrawSelf method on each object to draw all of them in the form interface;
- (2)
- Draw process nodes. Users can add a process simply by dragging and dropping the process icon from the left toolbar to the appropriate position in the form interface. This function is mainly realized through the DragDrop event of the form. When the user releases the mouse, the node object at the cursor position is established and added to the process flow chart set;
- (3)
- Set up the process basic information. The MouseDoubleClick event triggers a dialog box when the user double-clicks the process node, allowing the user to enter details such as the process number, the process name, and the assigned team. After setting, the process node can display the process number, process name, and associated colors in accordance with the various allocated teams;
- (4)
- Draw connecting line segments between process nodes. The connection relationship is established by drawing a connecting line between process nodes. According to the actual needs, there are two types of connecting lines: straight line and broken line;
- (5)
- Move the process node. The operation node be moved. Users can drag the process node to reposition it when editing the process flow chart. The link between process nodes will automatically and instantly change as the user moves;
- (6)
- Delete the object. The system will determine which object the user has chosen by comparing the click coordinates with the coordinate range of each object. When the delete function is chosen, the specified object is deleted by invoking the Remove method of the set;
- (7)
- Copy/paste process nodes. The ability to copy and paste process nodes is especially useful for process flow chart that contains some same or similar process nodes, which can aid technicians in quickly and effectively drawing the necessary process flow. The realization method is as follows: Initially, the user opens the process flow chart of similar products, selects the process nodes to be copied, and then adds them to the copying list one by one. Next, the user opens the target process flow chart and uses the paste feature to draw the process nodes in the copy list into the flow chart one by one, and at the same time, the associated process data will be automatically copied;
- (8)
- Save the process flow chart. The user verifies the integrity of the flow chart before storing it. The user is asked to complete the process’s basic information if it is not already filled out. The flow chart’s List <IPaintItem> object set is binary serialized and stored in the database’s product information table if the integrity check is successful.
4.2. Process Card Management
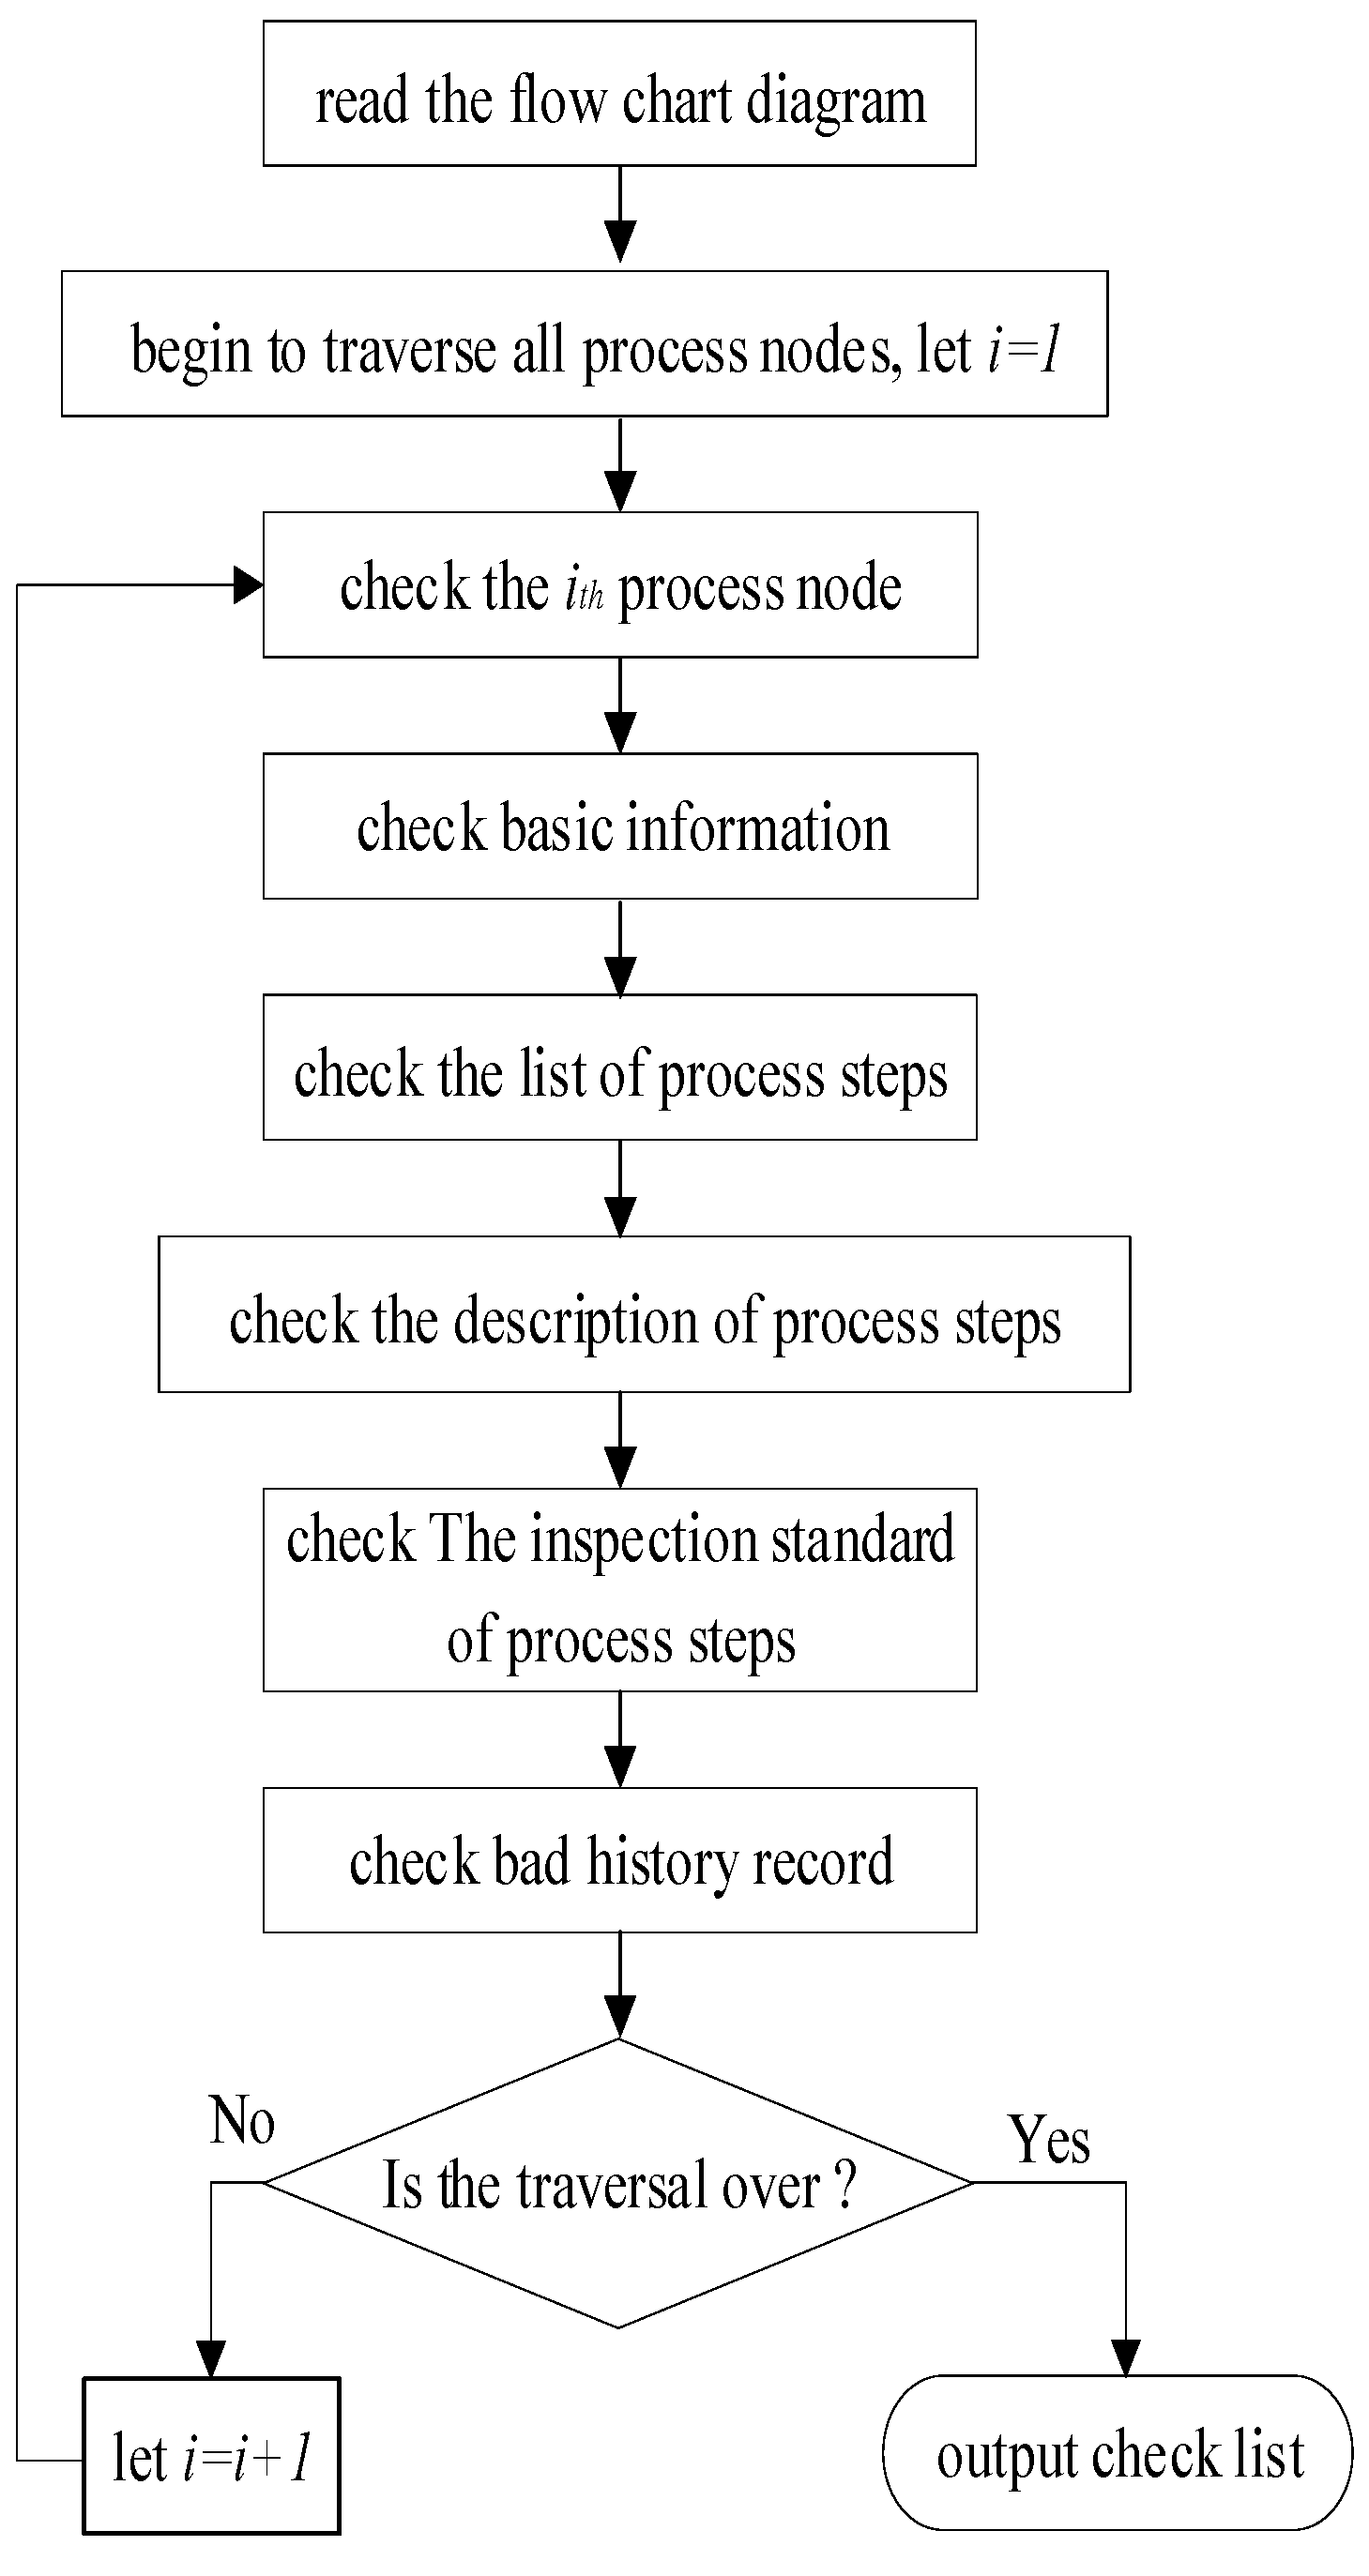
4.3. Process Flow Chart Release
- Step 1: Read the process flow diagram;
- Step 2: Start to traverse all process nodes in the process flow chart, and let i = 1;
- Step 3: Start to check the ith process node;
- Step 4: For the process node, inspect its fundamental details, its step list, the bad history, the contents of the corresponding description, and the inspection standards of each step sequentially;
- Step 5: Have all process nodes been checked? If so, print the check list, as the list describes whether there is some information missed and reminds the user of the lack details; otherwise, let i = i + 1, and jump to step 3 for the subsequent node.
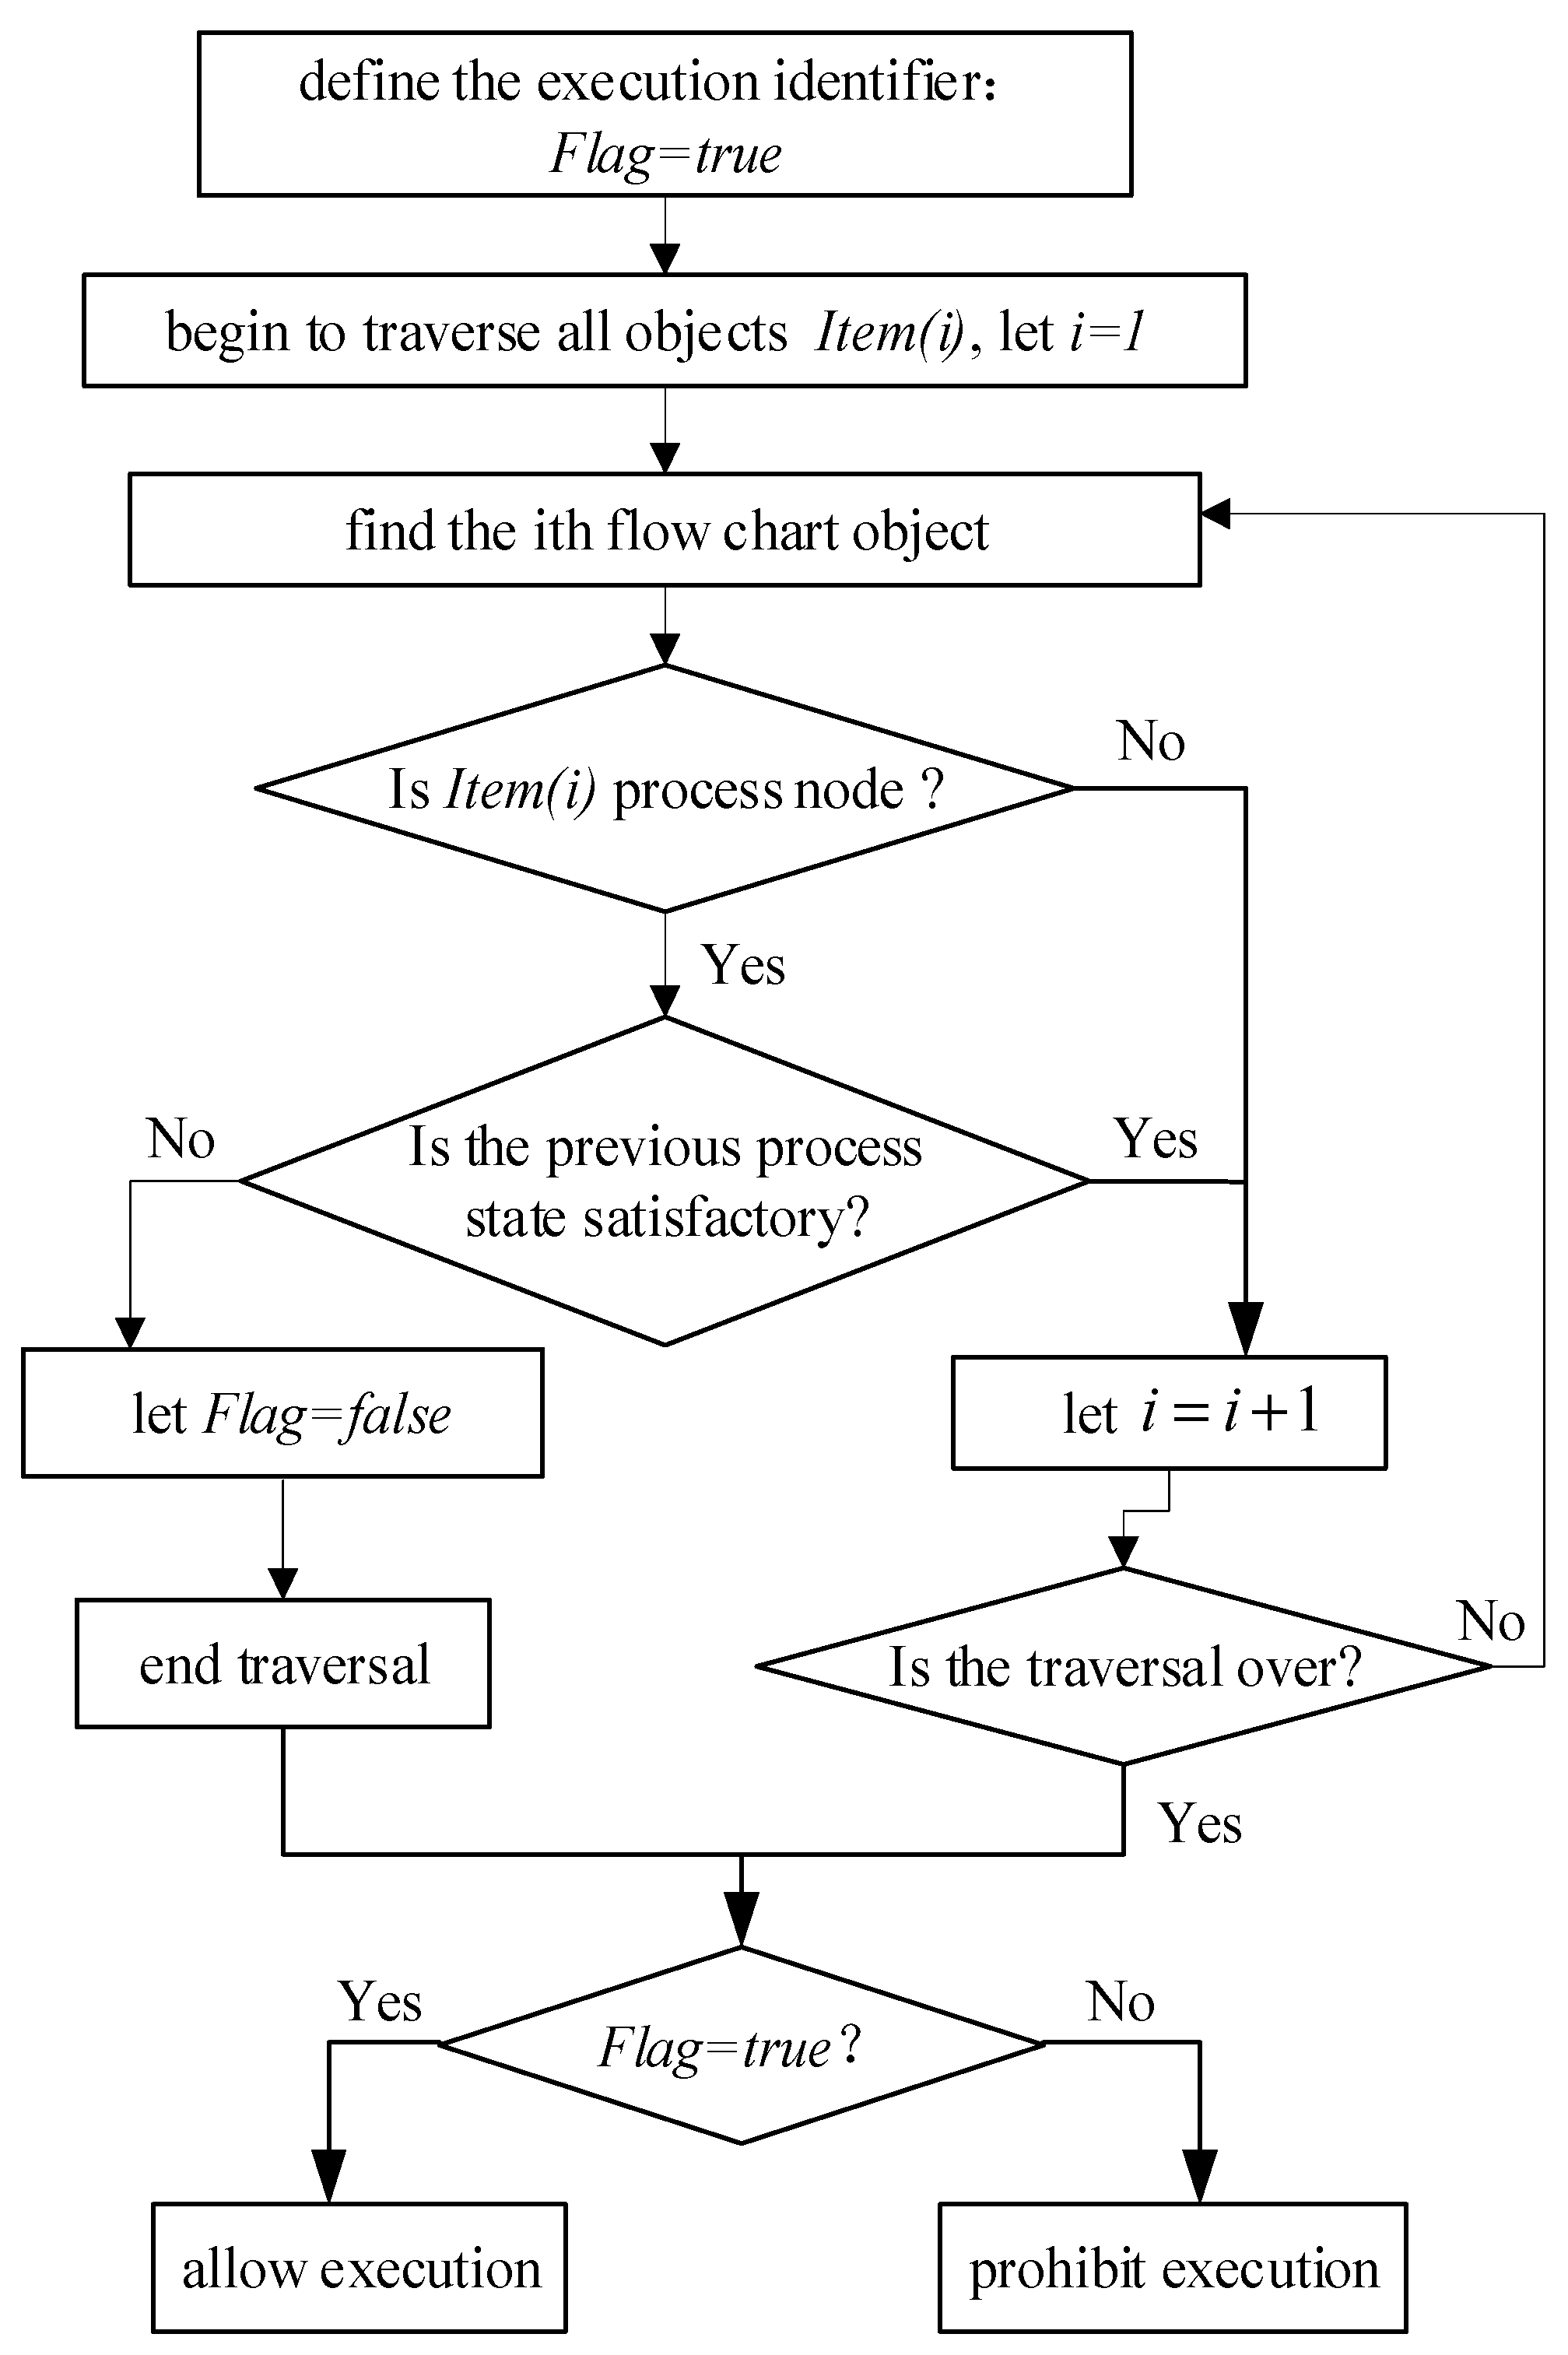
4.4. Process Control Based on Process Flow Chart
- Step 1: Define the execution identity , and let ;
- Step 2: Start to traverse all the objects in the process flow chart, and let ;
- Step 3: Find the flow chart object ; is the process node or connecting line segment in the flow chart;
- Step 4: Determine if is a process node, and if it is not, let , and jump to step 3; otherwise, proceed to step 5;
- Step 5: Are the states of the previous processes satisfied? If yes, let , and jump to step 3; otherwise, let , and end the traversal;
- Step 6: Is the execution identity false? If it is, the process is allowed; otherwise, it is forbidden.
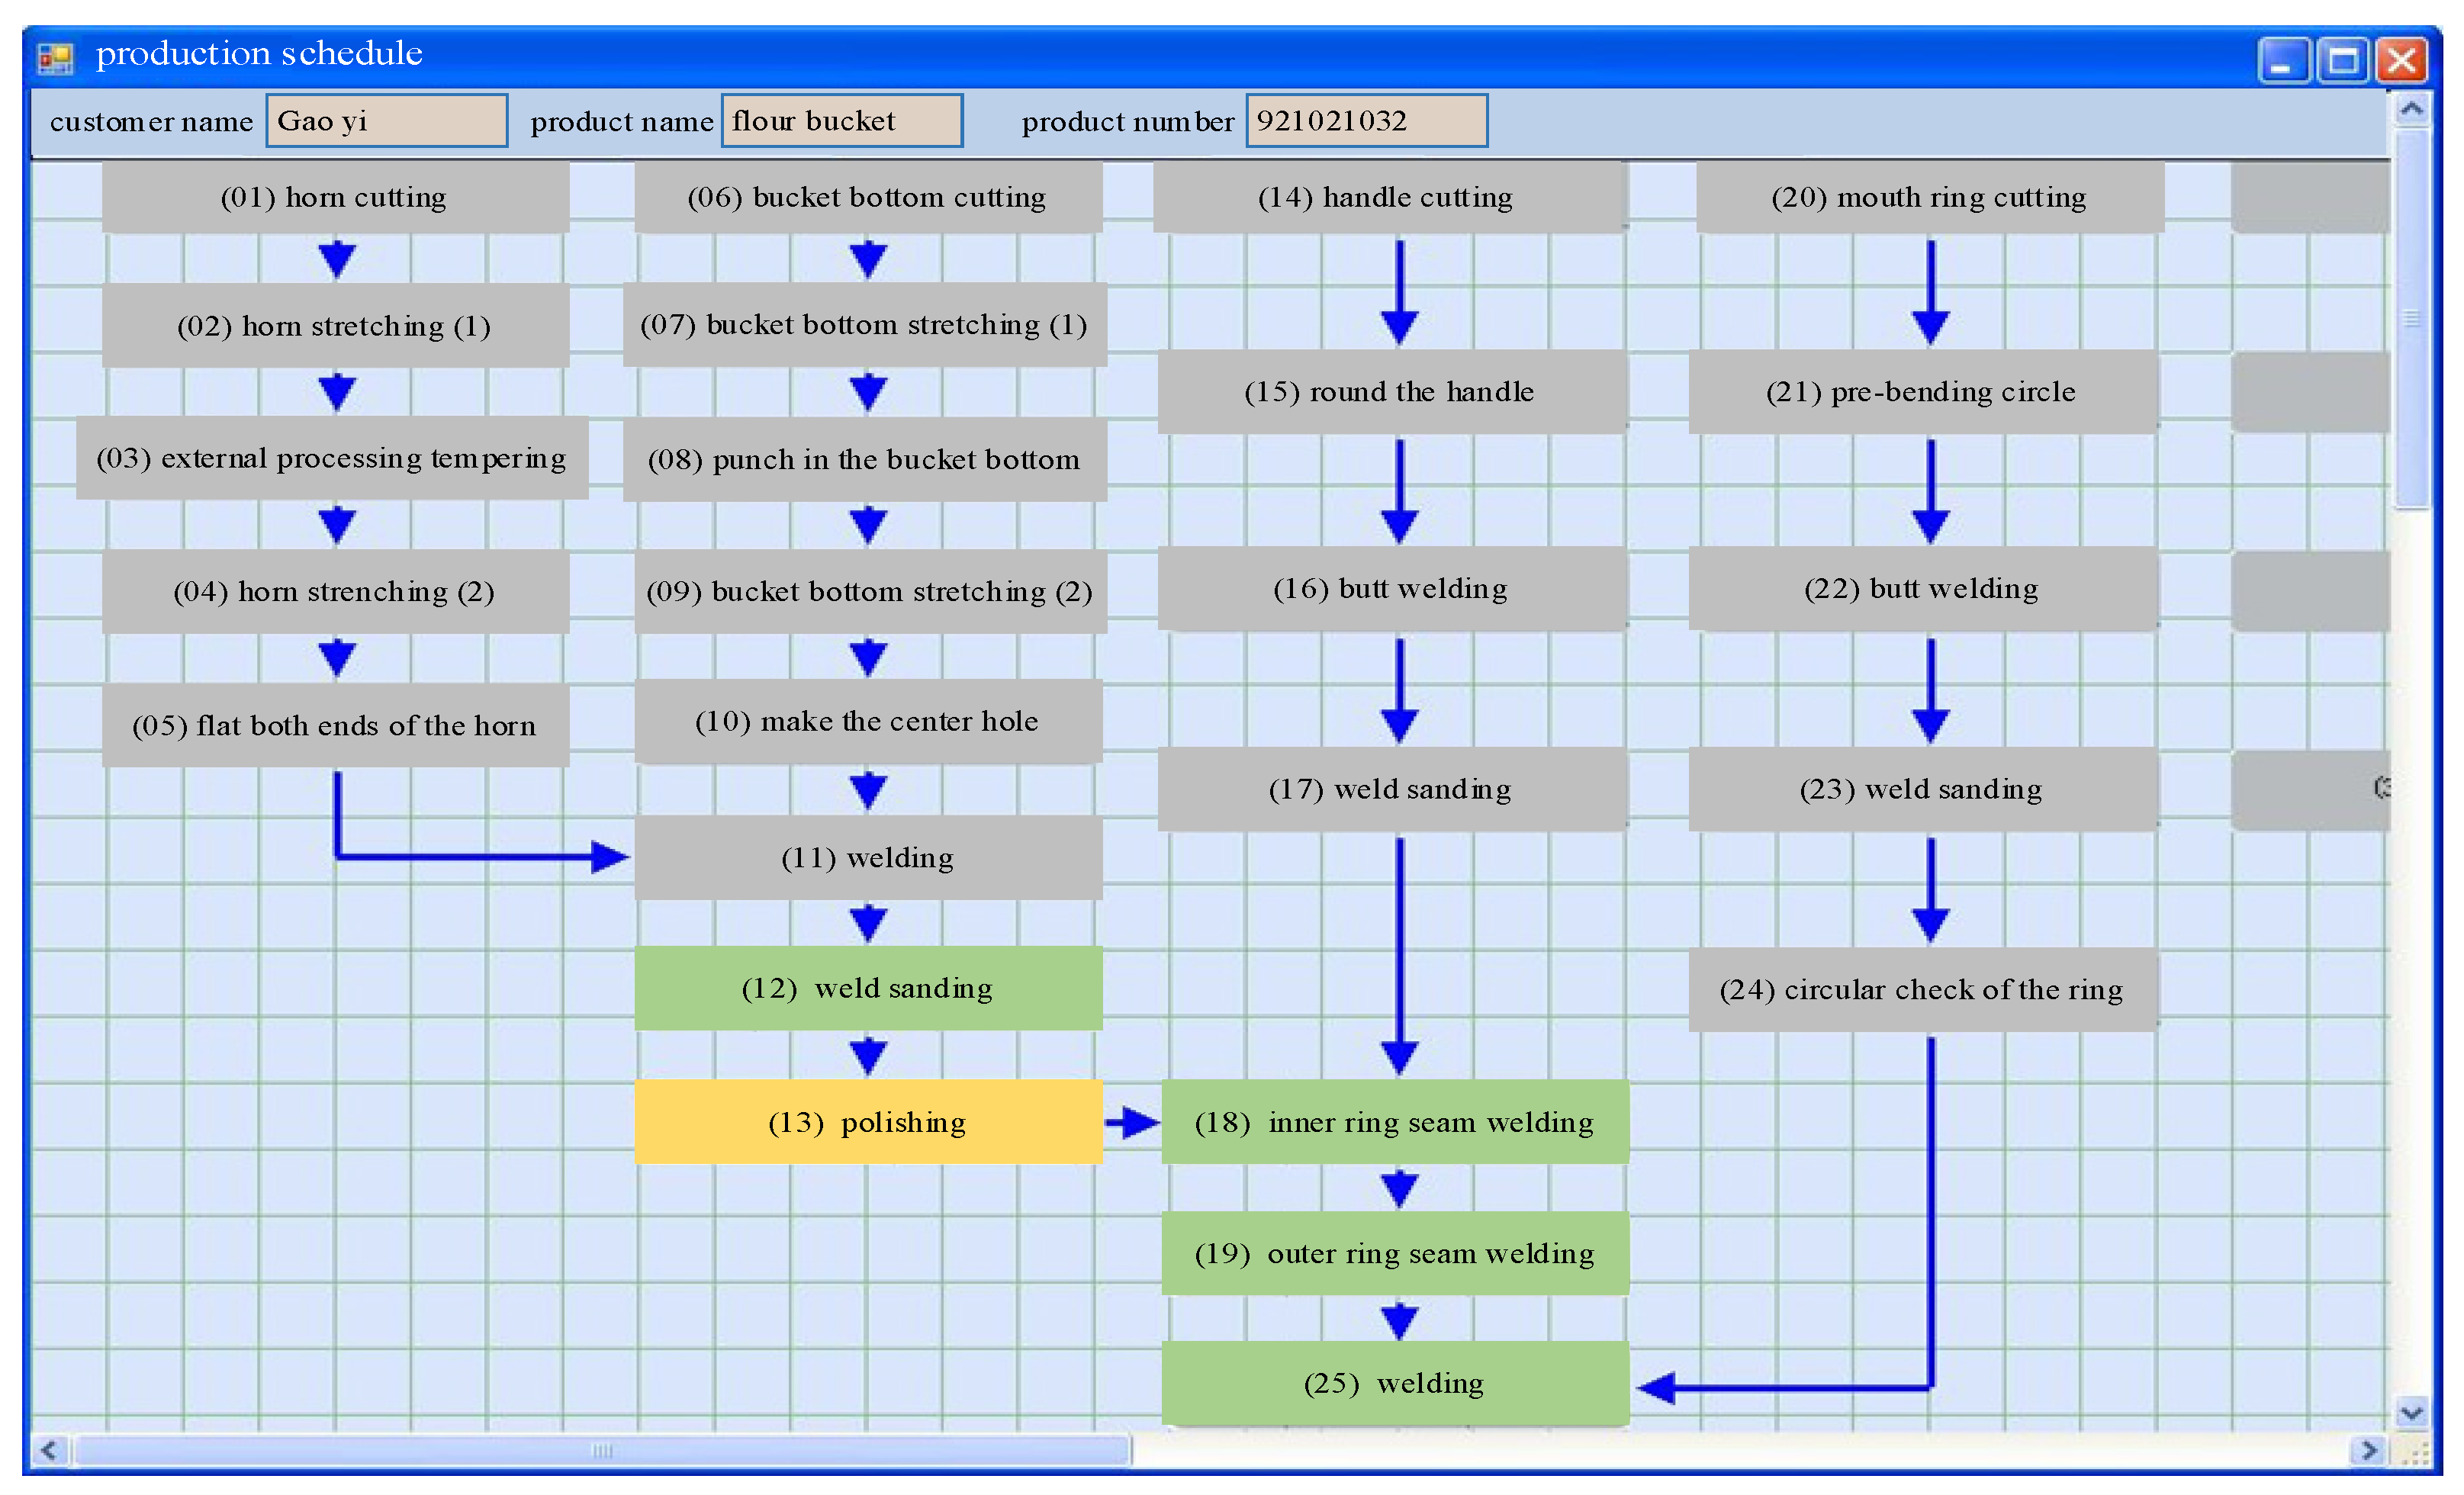
4.5. Production Schedule Monitoring Based on Process Flow Chart
- Step 1: Traverse each object in the flow chart;
- Step 2: Add the process node to the executing node set if its execution state is in progress; the background will be changed to gray if the process has finished; if the process is not started, leave things alone;
- Step 3: Start after the traversal is complete, and set the interval to 1 s. In the trigger event, the background image of each node in the set is alternatively changed to create the flicker effect.
5. Conclusions
- (1)
- After investigating the visualization technology of the process flow chart in light of the characteristics of the manufacturing process for mechanical products in small-sized businesses, the model of the production process flow chart containing process data and process flow charts was constructed. The database-based process flow chart storage scheme is thus proposed;
- (2)
- The mechanical manufacturing workshop production management system was created using SQL Server as the database, VS2019 as the development environment, and C#.NET as the programming language. The various operations for the production process and associated process data were realized in the system;
- (3)
- The graphical process design, process card data management, and process flow chart release were all finished by the system software created in the study. The judgment method of the process execution status was used to realize the process flow chart process control, and the process execution status display mechanism was applied to visualize the workshop production schedule;
- (4)
- Through the use of the process flow chart visualization technology, the overall structure of the production process and the connection between processes can be graphically displayed, and the system effectively raises the level of information management and work efficiency in the workshop. It also provides the technical foundation for flow-driven production information transfer in the workshop and can serve as a universal standard for the process module in workshop production management systems;
- (5)
- The system developed in the research implements the main functions of workshop production management in small-sized enterprises, but it also has its limitations. First, it is suitable for products with similar production processes. For example, it is currently employed in the machinery manufacturing company in Ningbo, China, which mainly produces various complex structural sheet-metal goods. In terms of product processes, stamping, drawing, welding, polishing, etc., are mostly used. In this way, the process flow chart and corresponding production management of new products can be quickly established by copying and modifying those of the existing products. Second, the system primarily implements production management in small enterprise workshops and lacks other management functions, such as finance and sales. Future research will focus on expanding existing functions or integrating new functions with the enterprise’s functional systems. Finally, the system lacks research and application of relevant intelligent methods in the process of production organization, such as the allocation of team members for each process, the intelligent scheduling of workshop production resources, and so on. In the future, we will strengthen the research on intelligent optimization issues related to workshop production management and solve problems such as production task allocation and workshop resource scheduling to further enhance the intelligence level of the workshop production management system.
Author Contributions
Funding
Institutional Review Board Statement
Informed Consent Statement
Data Availability Statement
Conflicts of Interest
References
- Seeger, P.M.; Yahouni, Z.; Alpan, G. Literature review on using data mining in production planning and scheduling within the context of cyber physical systems. J. Ind. Inf. Integr. 2022, 28, 100371. [Google Scholar] [CrossRef]
- Ramadan, M.; Salah, B.; Othman, M.; Ayubali, A.A. Industry 4.0-based real-time scheduling and dispatching in lean manufacturing systems. Sustainability 2020, 12, 2272. [Google Scholar] [CrossRef]
- Colledani, M.; Tolio, T.; Fischer, A.; Iung, B.; Lanza, G.; Schmitt, R.; Váncza, J. Design and management of manufacturing systems for production quality. CIRP Ann. Manuf. Technol. 2014, 63, 773–796. [Google Scholar] [CrossRef]
- Schuh, G.; Potente, T.; Hauptvogel, A. Methodology for the evaluation of forecast reliability of production planning systems. Procedia CIRP 2014, 17, 469–474. [Google Scholar] [CrossRef]
- İlhami, M.O.; Yaman, B.; Guerrini, G. Designing workshop management system supporting decision making with OODB. Procedia Technol. 2012, 1, 19–23. [Google Scholar]
- Tripathi, V.; Saraswat, S.; Gautam, G.D. A study on implementation of various approaches for shop floor management. Lect. Notes Electr. Eng. 2021, 766, 371–387. [Google Scholar]
- Chang, K.H.; Chiu, A.S.F.; Tan, K.H. Related theories and practical applications of soft computing in the manufacturing process of industry 4.0 2021. Math. Probl. Eng. 2022, 2022, 9802892. [Google Scholar] [CrossRef]
- Womack, J.; Jones, D.; Roos, D. The machine that changed the world: The story of lean production. In Toyota’s Secret Weapon in the Global Car Wars that Is Now Revolutionizing World Industry; Free Press: New York, NY, USA, 1990. [Google Scholar]
- Tripathi, V.; Chattopadhyaya, S.; Mukhopadhyay, A.K.; Sharma, S.; Li, C.; Singh, S.; Hussan, W.U.; Salah, B.; Saleem, W.; Mohamed, A. A sustainable productive method for enhancing operational excellence in shop floor management for industry 4.0 using hybrid integration of lean and smart manufacturing: An ingenious case study. Sustainability 2022, 14, 7452. [Google Scholar] [CrossRef]
- Chen, X.; Voigt, T. Implementation of the manufacturing execution system in the food and beverage industry. J. Food Eng. 2020, 278, 109932278. [Google Scholar] [CrossRef]
- Shojaeinasab, A.; Charter, T.; Jalayer, M.; Khadivi, M.; Ogunfowora, O.; Raiyani, N.; Yaghoubi, M.; Najjaran, H. Intelligent manufacturing execution systems: A systematic review. J. Manuf. Syst. 2022, 6, 503–522. [Google Scholar] [CrossRef]
- Wang, L.; Gao, R.; Váncza, J.; Krüger, J.; Wang, X.V.; Makris, S.; Chryssolouris, G. Symbiotic human-robot collaborative assembly. CIRP Ann.-Manuf. Technol. 2019, 68, 701–726. [Google Scholar] [CrossRef]
- Mumali, F. Artificial neural network-based decision support systems in manufacturing processes: A systematic literature review. Comput. Ind. Eng. 2022, 165, 107964. [Google Scholar] [CrossRef]
- Kritzinger, W.; Karner, M.; Traar, G.; Henjes, J.; Sihn, W. Digital Twin in manufacturing: A categorical literature review and classification. IFAC-PapersOnline 2018, 51, 1016–1022. [Google Scholar] [CrossRef]
- Blaga, A.; Militaru, C.; Mezei, A.D.; Tamas, L. Augmented reality integration into MES for connected workers. Robot. Comput.-Integr. Manuf. 2021, 68, 102057. [Google Scholar] [CrossRef]
- Niebel, B.W. Mechanized process selection for planning new designs. In ASME 33rd Annual Meeting Collected Papers; No. 737; ASME: New York NY, USA, 1965; Volume 65. [Google Scholar]
- Cay, F.; Chassapis, C. An IT view on perspectives of computer aided process planning research. Comput. Ind. 1997, 34, 307–337. [Google Scholar] [CrossRef]
- Xu, X.; Wang, L.; Newman, S.T. Computer-aided process planning-A critical review of recent developments and future trends. Int. J. Comput. Integr. Manuf. 2011, 24, 1–31. [Google Scholar] [CrossRef]
- Denkena, B.; Shpitalni, M.; Kowalski, P.; Molcho, G.; Zipori, Y. Knowledge Management in Process Planning. CIRP Ann. Manuf. Technol. 2007, 56, 175–180. [Google Scholar] [CrossRef]
- Borojevic, S.; Matic, D.; Dragic, M. An integrated intelligent CAD/CAPP platform: Part II-Operation sequencing based on genetic algorithm. Teh. Vjesn. 2022, 29, 1686–1695. [Google Scholar]
- Malleswari, V.N.; Pragvamsa, P.G. Automatic machining feature recognition from STEP files. Int. J. Comput. Intergr. Manuf. 2023, 36, 863–880. [Google Scholar] [CrossRef]
- Deja, M.; Siemiatkowski, M.S. Machining process sequencing and machine assignment in generative feature-based CAPP for mill-turn parts. J. Manuf. Syst. 2018, 48, 49–62. [Google Scholar] [CrossRef]
- Ji, X.; Ye, H.; Zhou, J.; Deng, W.L. Digital management technology and its application to investment casting enterprises. China Foundry 2016, 13, 301–309. [Google Scholar] [CrossRef]
- Wu, Z.; Zong, F.; Cao, P.; Wang, J.; Zhu, Z.; Guo, X.; Cao, P. Investigation of the customized furniture industry’s production management systems. J. Eng. Res. 2023, in press. [Google Scholar] [CrossRef]
- Luo, Q.; Yu, D.; Hu, Y. Design and implementation of workshop management system based on android mobile terminal. Modul. Mach. Tool Autom. Manuf. Tech. 2015, 10, 157–160. [Google Scholar]
- Liu, J.; Li, Y.; Shi, Y. Workshop production management system based on craft made in manufacture. Manuf. Autom. 2011, 33, 16–18, 36. [Google Scholar]
- Bi, Y. Design of manufacture management system based on wireless terminal. Mach. Build. Autom. 2014, 43, 128–131. [Google Scholar]
- Sruthi, M.; Kavitha, B. A survey on IoT platform. J. Sci. Res. Mod. Educ. 2016, 1, 468–473. [Google Scholar]
- Zhang, L. Research and application of the manufacturing information collection. Mach. Des. Manuf. Eng. 2014, 43, 40–42. [Google Scholar]
- Heidarpour, F.; Ciccolella, A.; Uva, A.E. Design and Development of an IoT Enabled Device for Remote Monitoring of Hydraulic Hammers; Springer: Cham, Switzerland, 2023; pp. 390–398. [Google Scholar]
- Wei, D.; Wang, H.; Liu, L. Visual monitoring system for small and medium-sized automatic production lines. China Mech. Eng. 2020, 31, 1351–1359. [Google Scholar]
- Lu, L.; Chang, C.; Tung, C.; Lu, C.Y.; Su, T.J.; Lee, L.W. Application of digital visualization in traditional manufacturing transformation. Sens. Mater. 2023, 35, 2139–2148. [Google Scholar] [CrossRef]
- Rosales, J.; Deshpande, S.; Anand, S. IIoT based augmented reality for factory data collection and visualization. Procedia Manuf. 2021, 53, 618–627. [Google Scholar] [CrossRef]
- Zhang, H.; Liang, J.; Li, G. The development and application of production management system based on job shop scheduling and monitoring. Mach. Des. Manuf. 2010, 11, 239–241. [Google Scholar]
- Oertwig, N.; Gering, P.; Knothe, I.T.; Rimmelspacher, S.O. User-centric process management system for digital transformation of production. Procedia Manuf. 2019, 33, 446–453. [Google Scholar] [CrossRef]
- Li, L.; Wu, Z.; Wu, L. Research on information processing technology of title bar for AUTOCAD/ERP integration. Appl. Mech. Mater. 2013, 423, 2716–2719. [Google Scholar] [CrossRef]


| Execution Status | Display Effect |
|---|---|
| Not started | Colored background (except gray) (different colors correspond to different teams) |
| In progress | Flickering background |
| Finished | Gray background |
Disclaimer/Publisher’s Note: The statements, opinions and data contained in all publications are solely those of the individual author(s) and contributor(s) and not of MDPI and/or the editor(s). MDPI and/or the editor(s) disclaim responsibility for any injury to people or property resulting from any ideas, methods, instructions or products referred to in the content. |
© 2023 by the authors. Licensee MDPI, Basel, Switzerland. This article is an open access article distributed under the terms and conditions of the Creative Commons Attribution (CC BY) license (https://creativecommons.org/licenses/by/4.0/).
Share and Cite
Li, L.; Wu, Z.; Lu, L. Research on Visualization Technology of Production Process for Mechanical Manufacturing Workshop. Appl. Sci. 2023, 13, 9754. https://doi.org/10.3390/app13179754
Li L, Wu Z, Lu L. Research on Visualization Technology of Production Process for Mechanical Manufacturing Workshop. Applied Sciences. 2023; 13(17):9754. https://doi.org/10.3390/app13179754
Chicago/Turabian StyleLi, Li, Zhaoyun Wu, and Liping Lu. 2023. "Research on Visualization Technology of Production Process for Mechanical Manufacturing Workshop" Applied Sciences 13, no. 17: 9754. https://doi.org/10.3390/app13179754
APA StyleLi, L., Wu, Z., & Lu, L. (2023). Research on Visualization Technology of Production Process for Mechanical Manufacturing Workshop. Applied Sciences, 13(17), 9754. https://doi.org/10.3390/app13179754