Article

Phased System Reliability Modeling and Assessment for Construction of Lunar Scientific Base

1
School of Aeronautic Science and Engineering, Beihang University, Beijing 100191, China
2
Beijing Institute of Spacecraft System Engineering, Beijing 100094, China
*
Author to whom correspondence should be addressed.
Appl. Sci. 2023, 13(17), 9823; https://doi.org/10.3390/app13179823
Submission received: 16 May 2023 / Revised: 23 August 2023 / Accepted: 29 August 2023 / Published: 30 August 2023

Abstract

:
The construction of a lunar scientific base (LSB) is a complex and gradual process that has to be completed in stages according to mission planning. Reliability assessment is critical for quantifying failure risks and planning complex space missions. In space engineering, reliability tests often encounter small samples and zero-failure data, rendering traditional system reliability assessment methods based on maximum likelihood theory inapplicable. This paper introduces a novel reliability assessment method for phased systems, termed building block assessment (BBA), to address existing limitations. The approach involves the development of a phased reliability model, which avoids correlation issues in reliability analysis. The reliability of the phased system is then assessed bottom-up using test data from subtasks, and the scenario where confidence limits are dependent is also discussed. Numerical examples demonstrate that the BBA method can effectively handle zero-failure data compared with traditional methods, and the reliability of LSB construction is verified to reach 0.9544 with a confidence degree of 0.9.

1. Introduction

As lunar exploration continues to advance, major space powers such as the United States, Russia, Europe, and China have proposed numerous lunar exploration schemes and development plans, with lunar base construction being a critical objective [1,2,3]. The lunar scientific base (LSB), as the preliminary stage of the lunar base, is of great significance to the long-term exploration and exploitation of lunar resources [4,5,6]. The LSB generally includes multiple pieces of lunar surface detection equipment, such as landers, rovers, energy stations, robots, and scientific exploration instruments [7]. It is impossible to send such a large amount of equipment to the moon in just one launch due to the limited carrying capacity. Therefore, the complex systematic project of the LSB construction must be completed through a progressive method of “multiple launches and lunar surface assembly” [8].
The LSB construction requires substantial investment, a long construction period, and high technical risk. Thus, an accurate reliability assessment of the LSB construction is critical for successful mission implementation. As a common method to quantify the failure risk in complex aerospace systems, reliability assessment involves uncertainties affecting their behavior and helps engineers make more informed decisions during the design phase [9]. In order to ensure the smooth completion of the LSB construction, the industrial sector explicitly called for a quantitative reliability assessment of the whole construction process and put forward high-reliability index requirements.
An accurate reliability assessment depends on reasonable reliability modeling. According to the basic concept of step-by-step LSB construction [7], the overall construction is divided into three main processes: lunar surface fixed-point delivery of equipment, lunar surface transport of equipment, and lunar surface docking assembly of equipment. The phased reliability model proposed in this paper regards the overall construction as a series system composed of the three phases described above, considering that the failure of any one phase will lead to the failure of the whole LSB construction. This novel model makes the reliability confidence limits of each phase independent, thus avoiding correlation and simplifying the calculation.
The confidence limits assessment for series system reliability has always been challenging in reliability engineering [10,11,12,13]. In particular, the LSB construction process may face the problem of small sample tests and zero-failure data. For example, aerospace equipment is usually expensive and the production batch is not large, so only small sample tests can be conducted [14,15,16,17]. Besides, such products end up being highly reliable and having a long life. Due to the limitations of development cycles and test costs, it is unaffordable to conduct prolonged testing. The limited test time makes it difficult to appear failure data in reliability test results; in other words, zero-failure data is often obtained [18,19,20].
The Lindstrom-Madden (LM) method [21] and the modified maximum likelihood (MML) method [22] are the main methods used in engineering to assess the lower confidence limit (LCL) for series system reliability. The core idea behind them is to reduce the test results to a set of binomial (pass/fail) tests with a pseudo-test number n and a pseudo-success number s (i.e., the system is considered to have passed s out of n tests). Furthermore, the theory of confidence intervals for binomial distribution reliability is used [23]. However, the traditional methods are based on the theory of maximum likelihood estimation and therefore have large errors in small sample cases [24]. In addition, these two methods are not applicable when there are zero-failure subsystems in a series system [25,26].
In recent years, the Bayesian and Bootstrap methods have been developed for estimating the confidence limits of series system reliability. The Bayesian method combines pre-test reliability with field-test information, which is advantageous for small sample data [27,28]. However, the subjective selection of the prior distribution limits its application [29]. The Bootstrap method assumes that the empirical distribution fits the sample distributions well and extends the sample by resampling [30,31]. This method is intuitive and convenient, but the estimates are usually approximate.
Inspired by the realistic problems encountered in the reliability assessment of LSB construction, this study makes two contributions: a phased reliability model for LSB construction and a building block assessment (BBA) method for phased system reliability. The phased reliability model ensures the independence of the reliability confidence limits of each stage and meets the prerequisite for solving the system reliability confidence limits using the BBA method. The BBA method enables a bottom-up assessment of phased system reliability with high confidence using lower-level reliability information and realizes the small-sample reliability assessment of LSB construction.
The rest of the paper is organized as follows. Section 2 describes in detail the three main processes of LSB construction and compares the proposed phased reliability model with the conventional model. In Section 3 and Section 4, the reliability assessment methods for the main processes and the overall LSB construction are proposed, all including reliability models and confidence limit calculation formulas. Numerical examples are provided in Section 5 to illustrate the applicability and effectiveness of the proposed method. Finally, Section 6 summarizes the paper.

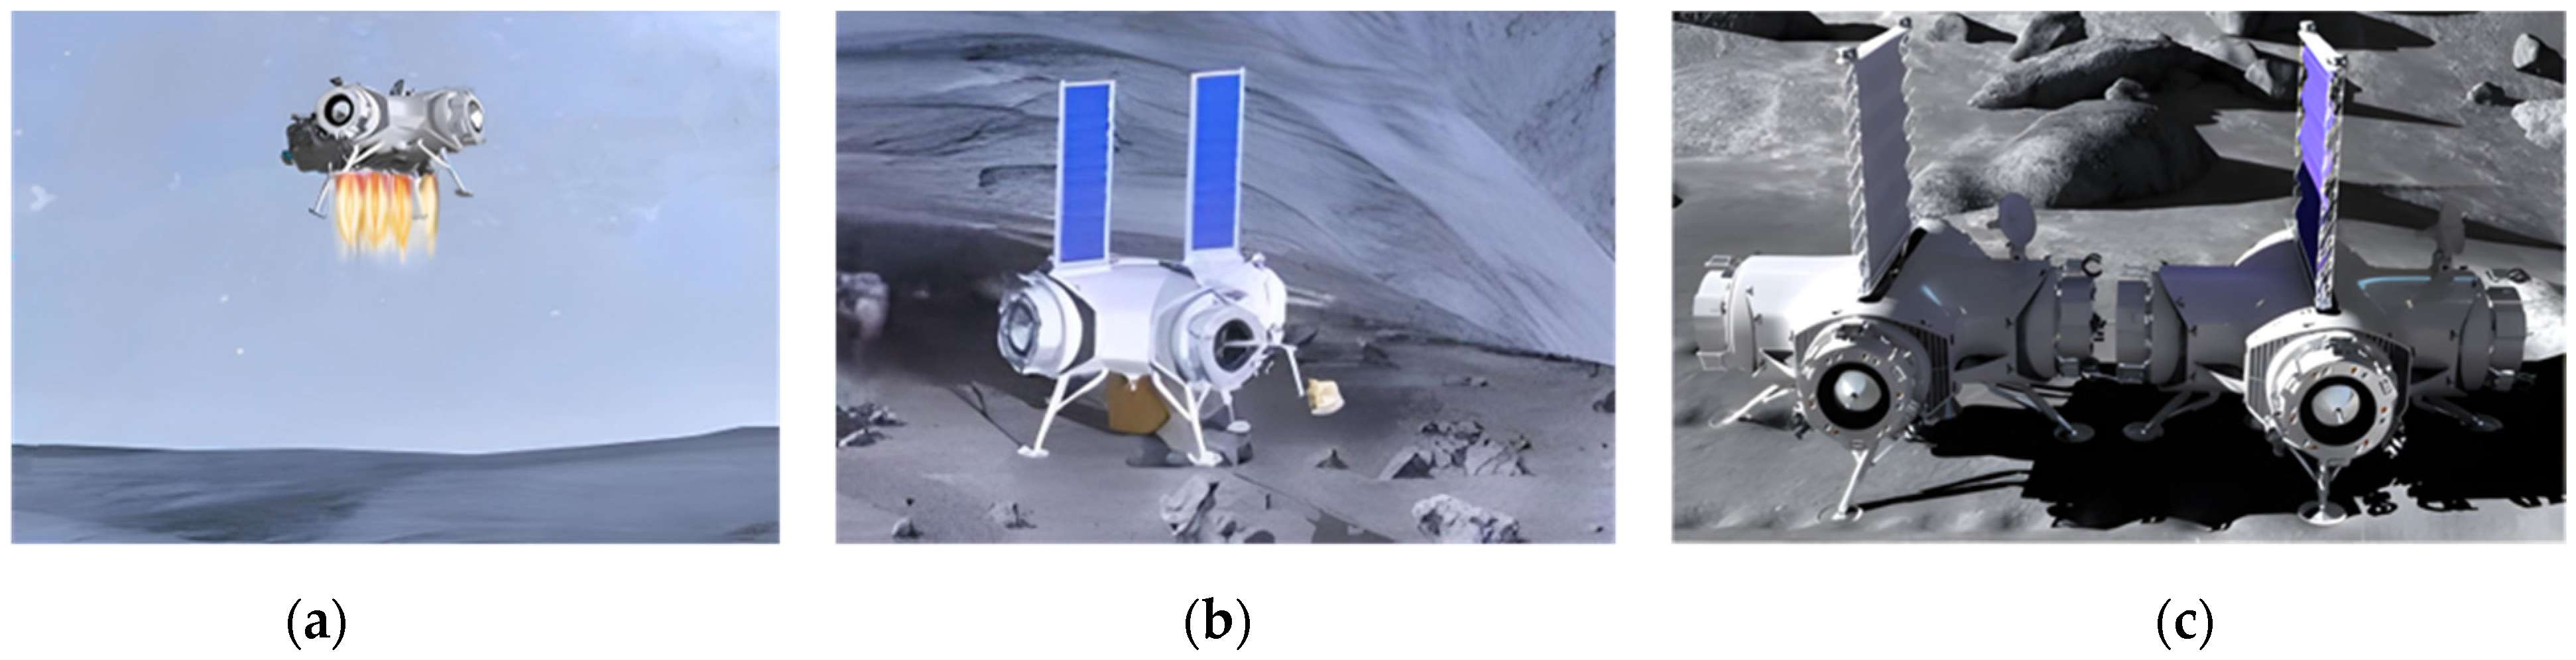
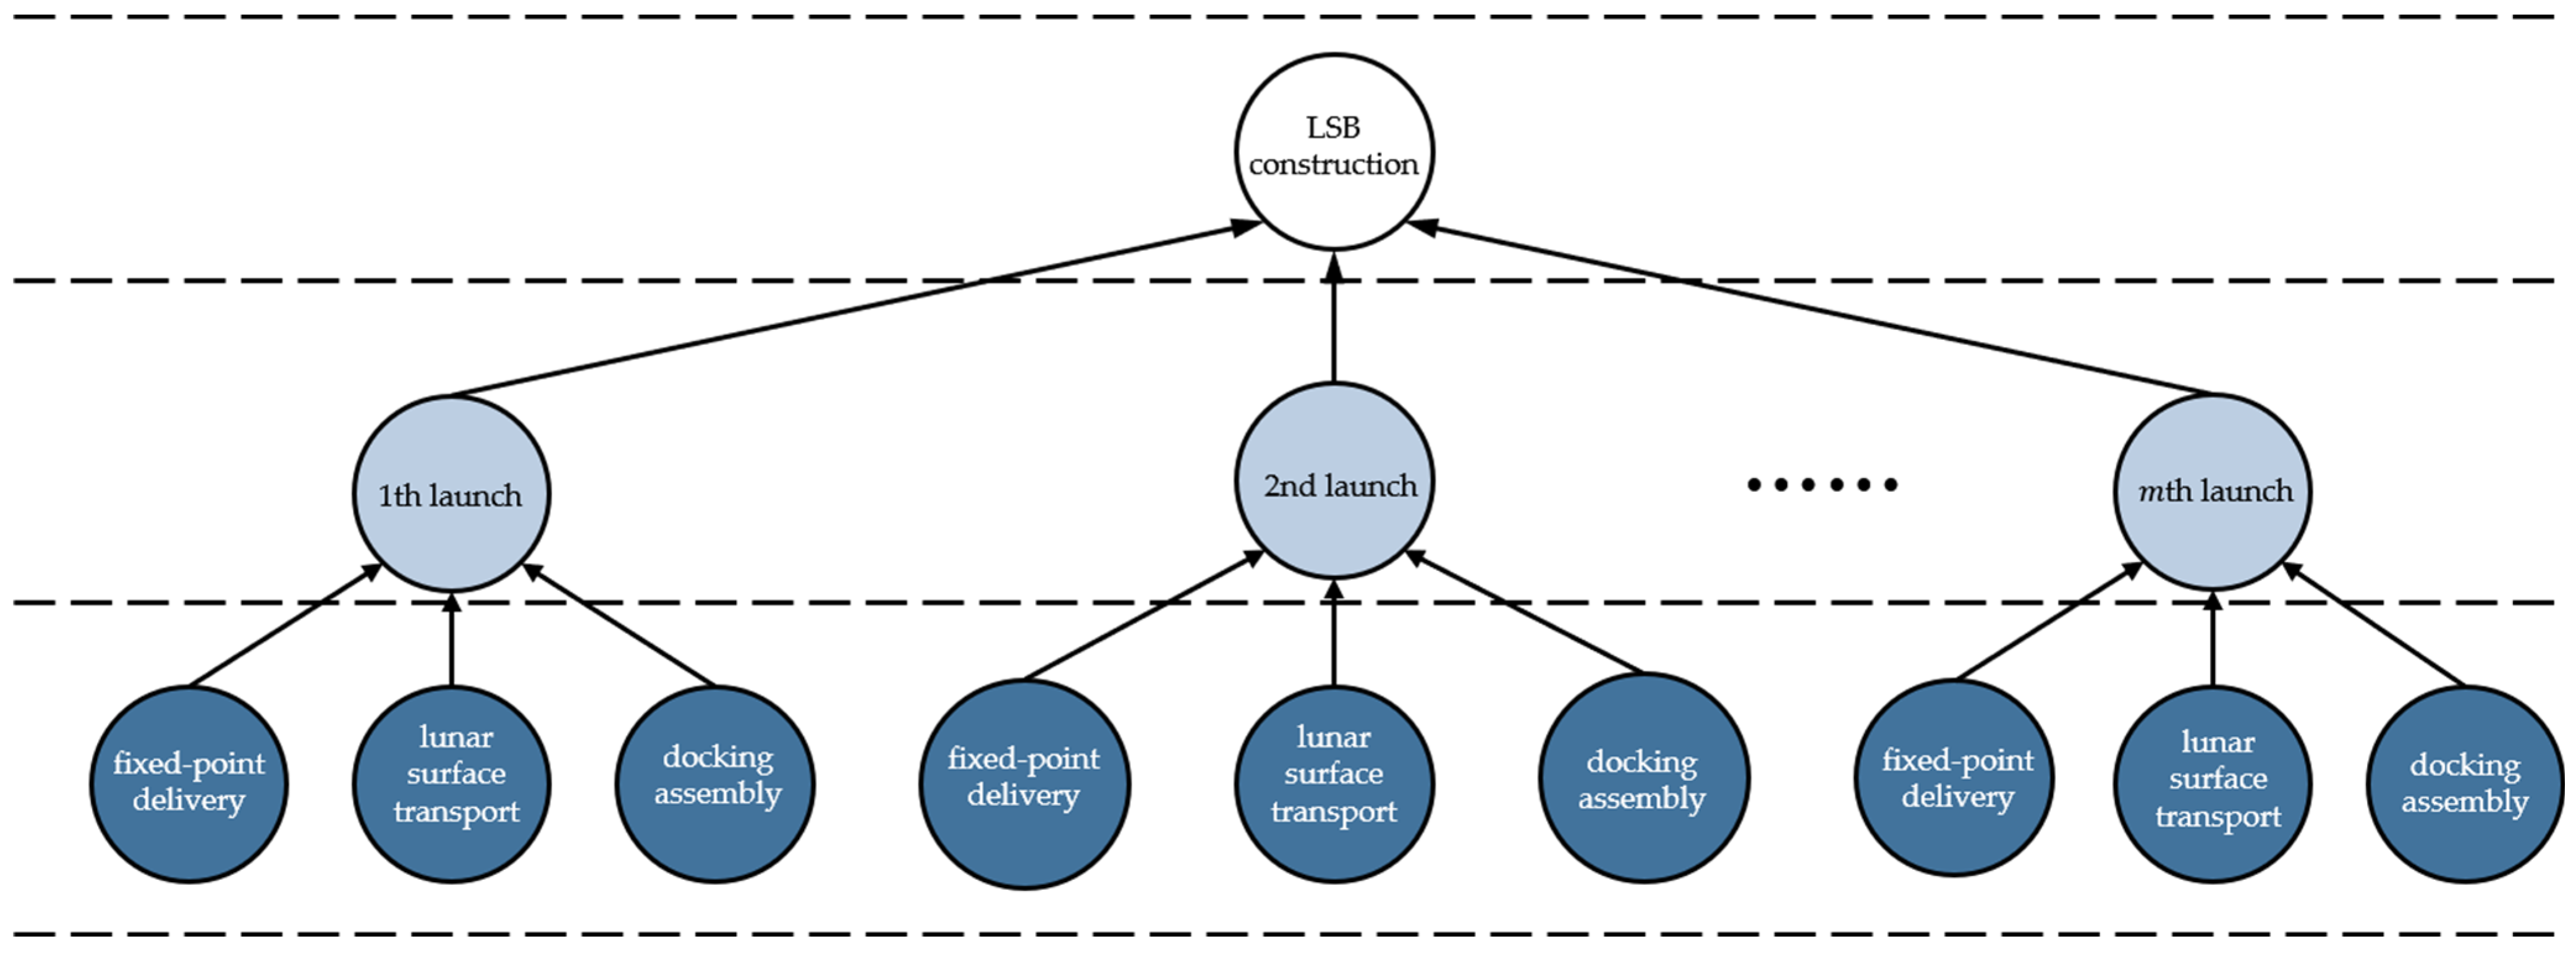
2. A Phased Reliability Model for LSB Construction

The LSB construction is divided into three main processes, as shown in Figure 1: (a) the fixed-point delivery of equipment on the lunar surface; (b) the lunar surface transport of equipment; (c) the docking and assembly of equipment on the lunar surface. Firstly, the lander transports the equipment required for the LSB operation from the earth orbit to the lunar orbit and further delivers it from the lunar orbit to the lunar surface landing site, thereby achieving a safe and stable landing on the lunar surface. Secondly, the lander converts from a landing attitude to a walking attitude or releases the lunar rover to complete the reliable and smooth transport of equipment from the landing site to the LSB destination. Afterward, the necessary docking and assembly of the equipment are performed at the LSB destination to form a functional module assembly [7]. The LSB construction is a long-term and gradual process that needs to be completed in stages according to the mission plan. Generally, the LSB construction process consists of m 1 times of fixed-point delivery, m 2 times of lunar surface transport, and m 3 times of docking assembly.
A phased reliability model for LSB constructions is developed in this study to facilitate the reliability assessment, as shown in Figure 2. The novel model makes the reliability confidence limits of each main process independent, thus avoiding correlation and simplifying the calculation. Several reasonable modeling approaches exist for the LSB construction, but the solution difficulty varies considerably between different models. For example, it is also applicable to model the subtask reliability for LSB construction, i.e., the overall construction consists of individual launch tasks in series, as shown in Figure 3. Since each launch task consists of three main processes: fixed-point delivery, lunar surface transport, and docking assembly, the confidence limits of reliability in each task are correlated (because the test samples of the three processes are related). This correlation will make the solution of mathematical models too complex.
As mentioned above, reliability assessment for LSB construction or its major processes is impractical to directly achieve because of the complex construction processes. Instead, a feasible solution is fully utilizing the reliability test information at lower levels for a BBA. Aiming at this, this paper proposes reliability assessment methods for the three main processes and the overall construction process in Section 3 and Section 4, respectively.

3. Reliability Assessment Method for Three Main Processes

The phased reliability model proposed in Section 2 ensures that the reliability confidence limits for the three main processes are independent. However, each process (such as fixed-point delivery) is performed many times, and the reliability confidence limits of each fixed-point delivery may be correlated. This section gives the reliability assessment methods for the three main processes, taking the fixed-point delivery process as an example.
Suppose m 1 fixed-point delivery will be carried out during the LSB construction, and denote R A   i as the reliability of the i th fixed-point delivery, i = 1 , 2 , , m 1 . The individual fixed-point deliveries are independent and form a serial system. The reliability block diagram is shown in Figure 4.
The reliability R A of the overall fixed-point delivery can be expressed as
R A = i = 1 m 1 R A i       i = 1 , 2 , , m 1
In engineering practice, the true value of R A i is unknown. Indeed, its LCL with the confidence degree γ is required and evaluated through the corresponding reliability test, which satisfies
P ( R A i R A i , γ ) = γ       i = 1 , 2 , , m 1
Due to the risk-averse design, space engineering requires a high confidence degree indicator γ (i.e., a confidence degree of not less than 0.9). A confidence degree of 0.9 means that there is 90% certainty that the true value of the reliability is not less than the LCL of the reliability estimated from the test sample. Theoretically, the assessment results are safe and secure.
It is well known that the reliability of a series system is the product of the reliability of the individual subsystems. However, is the LCL of the series system reliability also the product of the LCL of the individual subsystem reliability? Moreover, how does one calculate the confidence degree for the LCL of the system reliability in this case? Inspired by the above problem, this section will discuss the LCL of the overall fixed-point delivery reliability R A = i = 1 m 1 R A i with the confidence degree γ in two cases: identical and different reliability. Before discussing, definitions of the relevant concepts are first given. According to interval estimation theory, it is known that confidence limits of reliability are statistically inferred from the test sample.
(1)
If the reliability confidence limits of subtasks are inferred from the same test samples, it can be said that they have identical reliability; in other words, the reliability confidence limits are correlated.
(2)
If the reliability confidence limits of subtasks are inferred from different test samples, it can be said that they have different reliability; in other words, the reliability confidence limits are independent.
(3)
In either case, the reliability R A i  of each fixed-point delivery is independent (random events are independent).

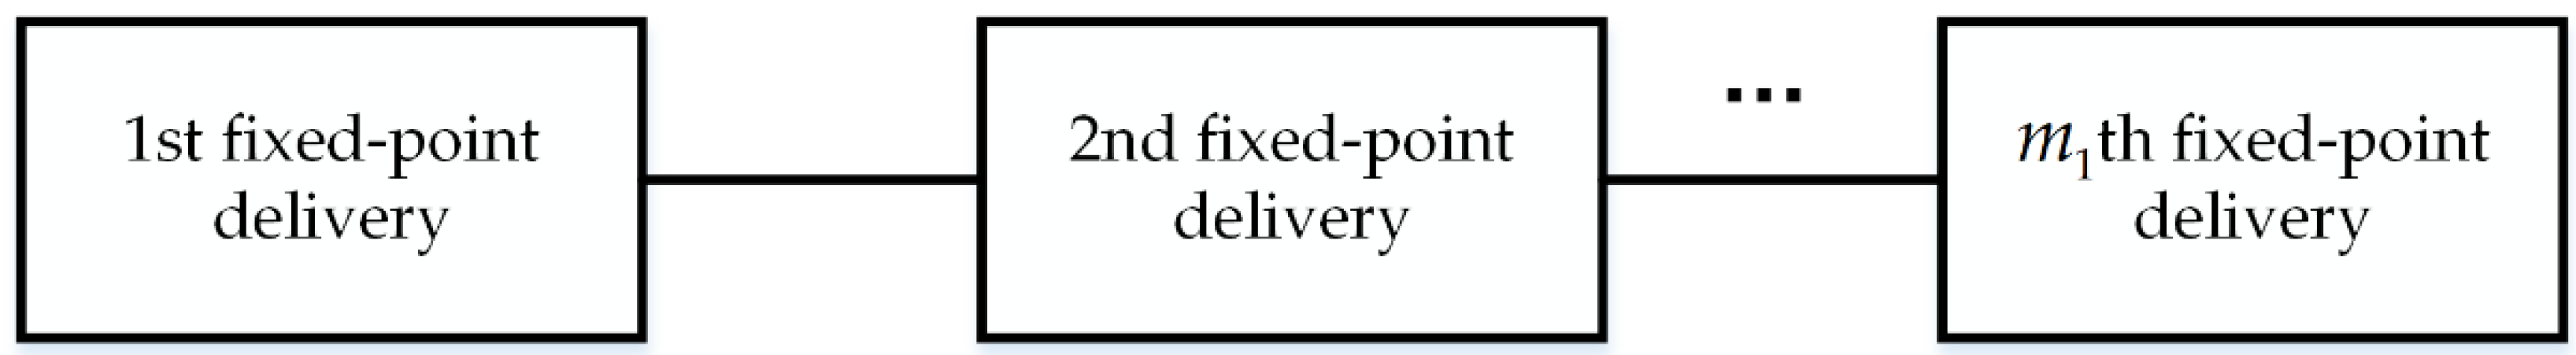
3.1. Reliability Assessment with Identical Reliability of Each Fixed-Point Delivery

For the case where the reliability R A i of each fixed-point delivery is independent and identical (the confidence limits R A i , γ of R A i are correlated with each other), the LCL of the overall fixed-point delivery reliability R A with the confidence degree γ is calculated by the following formula:
R A , γ = i = 1 m 1 R A i , γ =   R A 1 , γ m 1       i = 1 , 2 , , m 1
The above result indicated that the LCL of R A with the confidence degree γ is equal to the product of R A i , γ ( i = 1 , 2 , , m 1 ) .
Formula (3) is proved as follows. Since the reliability of each fixed-point delivery is identical, there are
R A 1 = R A 2 = = R A m 1
R A 1 , γ = R A 2 , γ = = R A m 1 , γ
Also because
R A = i = 1 m 1 R A i = R A 1 m 1
P ( R A 1 R A 1 , γ ) = γ
Furthermore, the following can be derived:
P { R A R A , γ } = P { R A 1 m 1 R A 1 , γ m 1 } = P { R A 1 R A 1 , γ } = γ

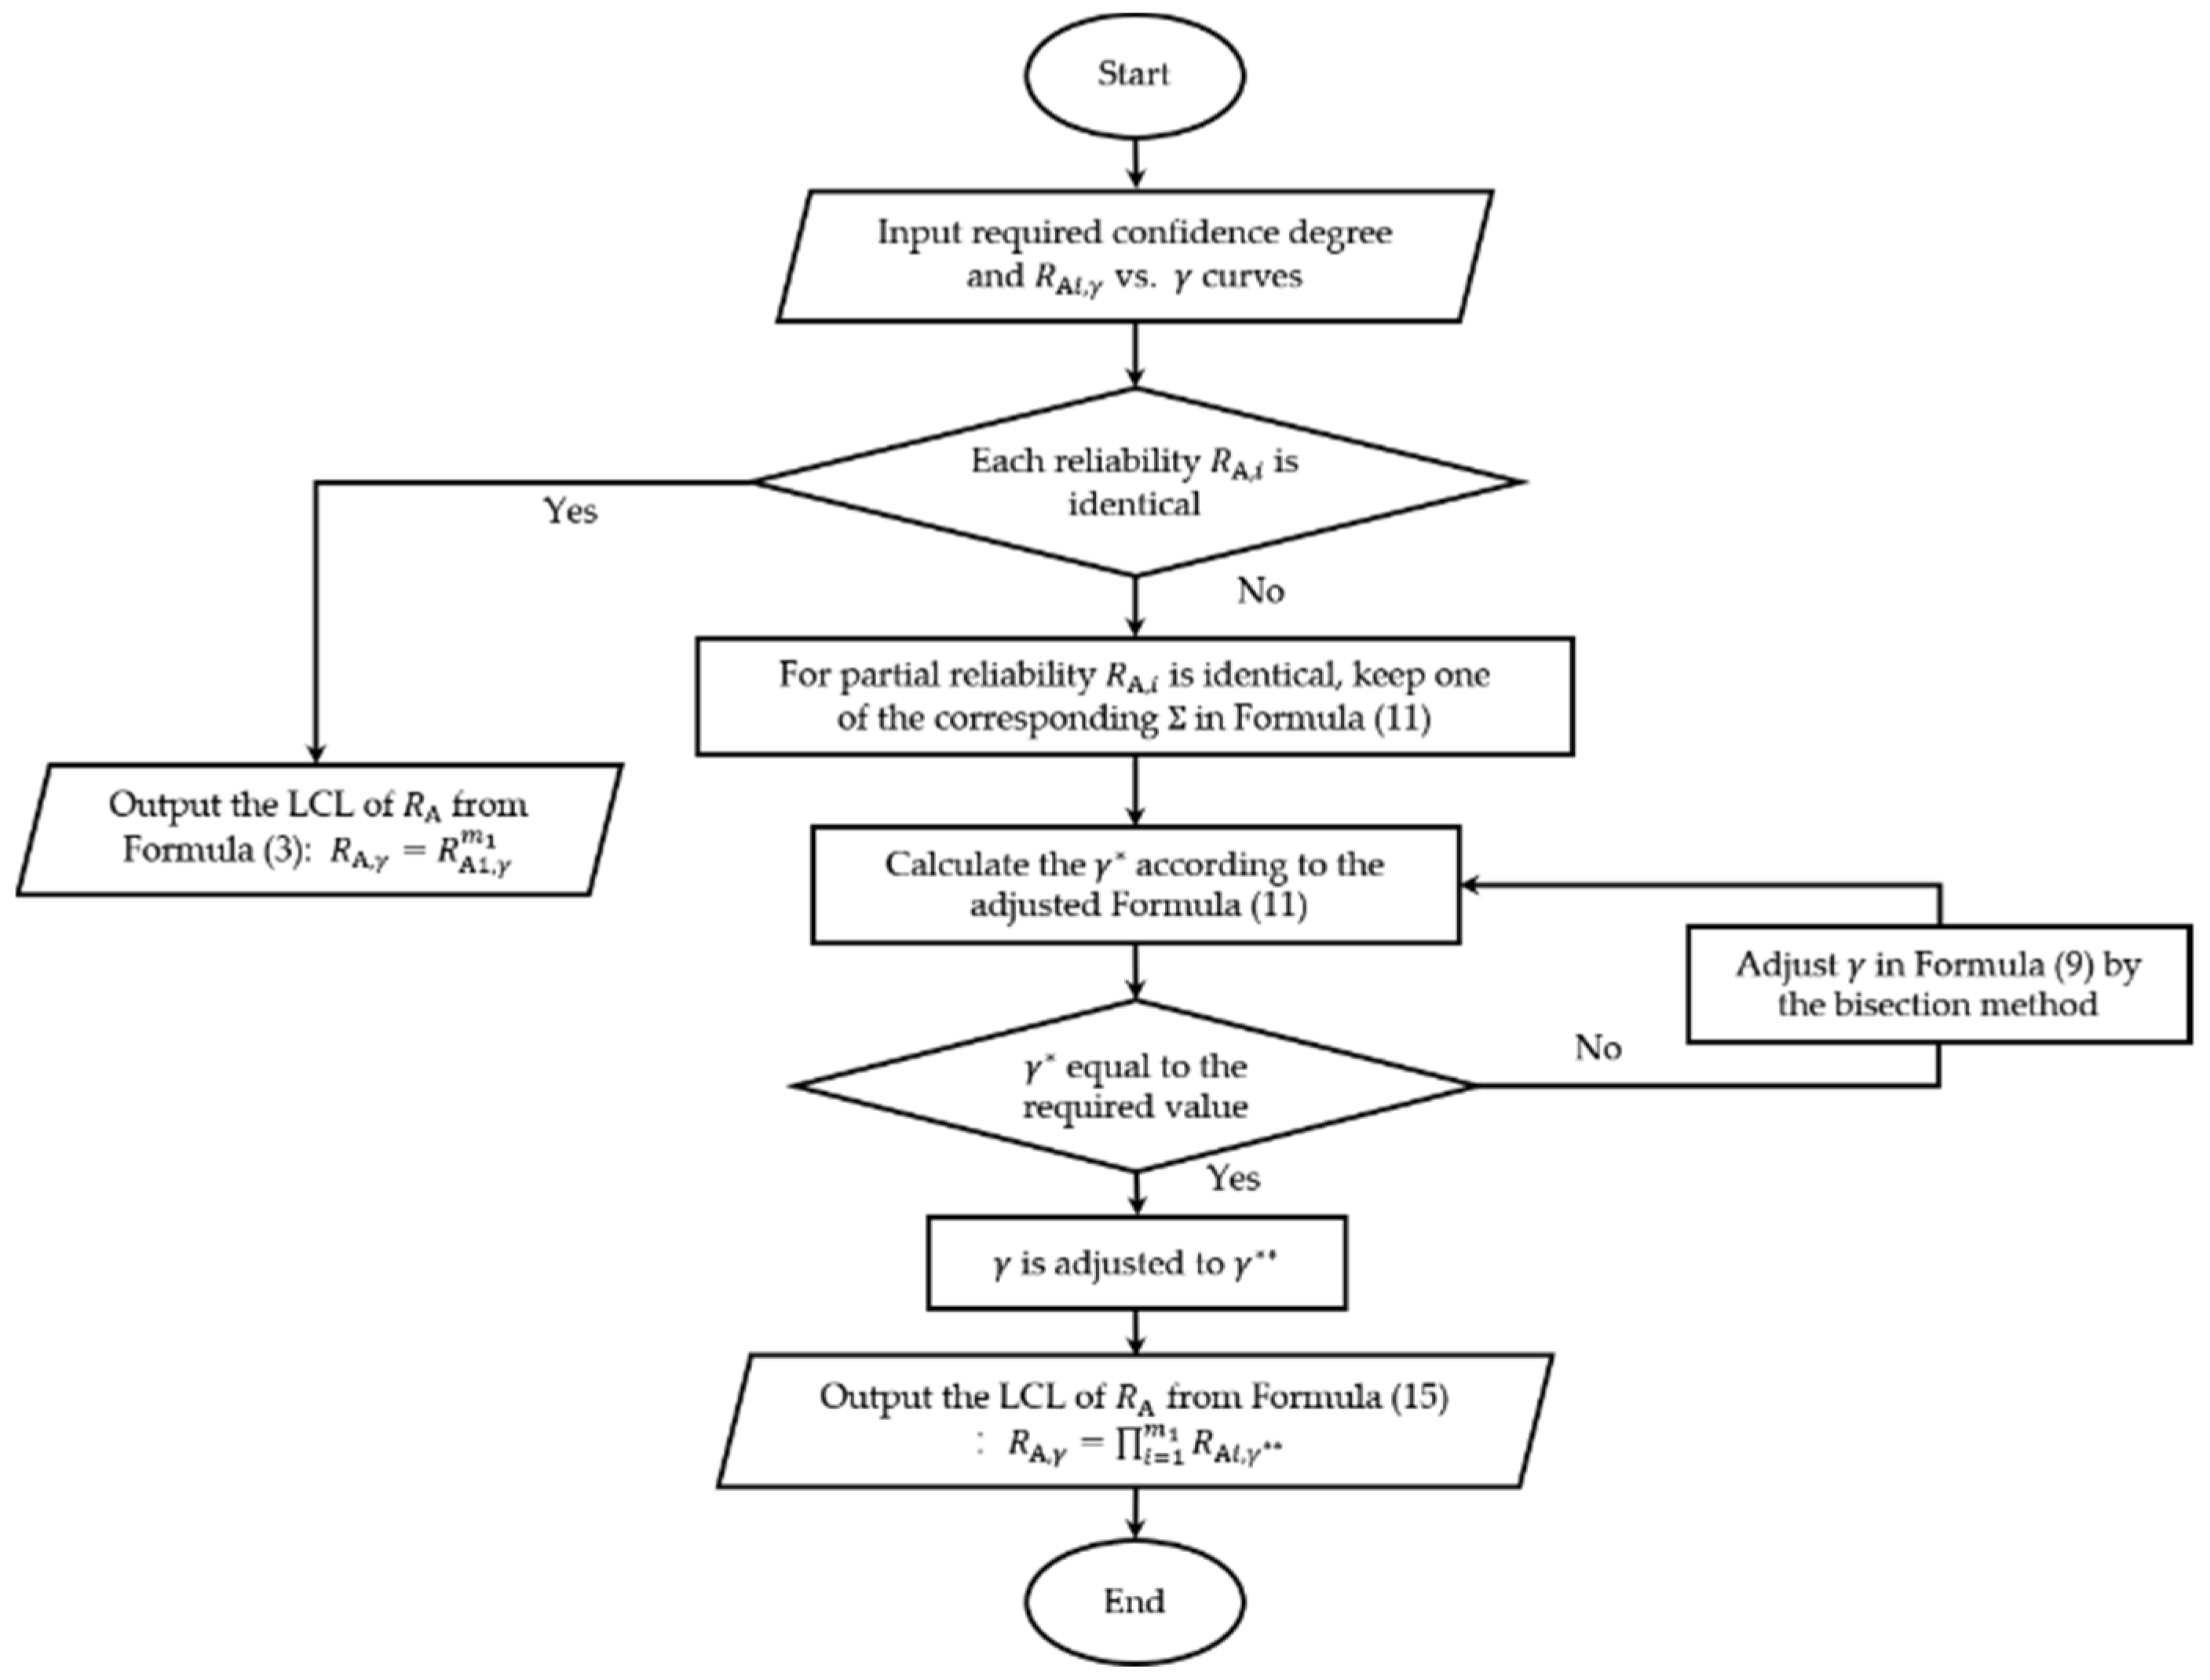
3.2. Reliability Assessment with Different Reliability of Each Fixed-Point Delivery

Consider the case where each fixed-point delivery reliability is entirely different (their reliability confidence limits are independent). It is inappropriate to apply the conclusion of Section 3.1 directly. In this case, the product of R A i , γ ( i = 1 , 2 , , m 1 ) could be taken as an approximate solution to the LCL of R A with the confidence degree γ , and the approximate solution can be expressed as
R AL = i = 1 m 1 R A i , γ           i = 1 , 2 , , m 1
Let γ denote the actual confidence degree of R AL . It can be calculated by
γ * = P { R A R AL } = P { R A 1 R AL / i = 2 m 1 R A i }
Although the true value of R A i in Formula (10) is unknown, their LCLs at any confidence degree can be determined by Formula (2). Therefore, γ can be further calculated numerically, that is
γ * = P { R A R AL } = 1 M m 1 1 k 2 = 1 M k 3 = 1 M k m 1 = 1 M γ ˜ k 2 k 3 k m 1
where
γ ˜ k 2 k 3 k m 1 = P { R A 1 R AL / i = 2 m 1 R A i , γ k i }
P [ R A i R A i , γ k i ] = γ k i       i = 2 , 3 , , m 1
γ k i = 1 k i 0.5 M       k i = 1 , 2 , , M ,   i = 2 , 3 , , m 1
A detailed explanation for the numerical algorithm of Formulas (11)–(14) is summarized in Algorithm 1.
Algorithm 1: Numerical calculation of the confidence   degree   γ * for R AL
(1)
Select  M  according to the requirements of numerical calculation accuracy (e.g., 10 4 , 10 5 , 10 6 ).
(2)
Calculate   the   confidence   degrees   γ k i   using   Formula   ( 14 )   for   i = 2 , 3 , , m 1 .
(3)
Compute the R A i , γ k i ( i = 2 , 3 , , m 1 ) with the corresponding   confidence   degree   γ k i by using Formula (13).
(4)
Substitute R A i , γ k i ( i = 2 , 3 , , m 1 )   into   Formula   ( 12 )   to   calculate   γ ˜ k 2 k 3 k m 1 .
(5)
The   confidence   degree   γ * is obtained by Formula (11).
It is worth noting that there is a deviation between γ and the required confidence degree γ . In order to obtain the exact LCL for R A with the confidence degree γ , Algorithm 1 should be repeated several times from different start points.
Note that Formula (10) is a monotonically increasing function of γ . Thus, the value of γ in Formula (9) can be continuously adjusted to γ by the dichotomy until the value of γ * calculated by Algorithm 1 is equal to the required value of γ . In other words, find the value of γ such that the confidence degree for R AL in Formula (9) satisfies γ * = γ . At this time, the LCL of the overall fixed-point delivery reliability R A with the confidence degree γ is obtained as
R A , γ = i = 1 m 1 R A i , γ       i = 1 , 2 , , m 1
where R A i , γ is the LCL for each fixed-point delivery reliability R A i with the confidence degree γ .
For all fixed-point deliveries, there is both identical and different reliability. Firstly, the LCL of the reliability of the partial fixed-point delivery consisting of fixed-point deliveries with the same reliability can be calculated by Formula (3). Furthermore, the LCL for the overall fixed-point delivery reliability can be calculated according to Formulas (9)–(15).
In summary, the flow chart for the fixed-point delivery reliability assessment method is illustrated in Figure 5.
Since the lunar surface transport and docking composition can likewise be viewed as a serial system consisting of their subtasks, the above formulas and discussions are also applicable to calculate the LCLs for the reliability of lunar surface transport and docking assembly.

4. Reliability Assessment Method for Overall LSB Construction

The overall construction of the LSB consists of three main processes: lunar surface fixed-point delivery, lunar surface transport, and lunar surface docking assembly. The failure of any one process will lead to the failure of the entire LSB construction. So the overall construction process can be regarded as a series of systems consisting of three independent processes. Figure 6 gives the reliability block diagram of the overall LSB construction.
The reliability R of the overall LSB construction can be expressed as
R = R A R B R C
where R A ,   R B   and   R C denote the reliability of fixed-point delivery, lunar surface transport, and docking assembly, respectively. Denote R A , γ ,   R B , γ   and   R C , γ as the LCLs for the reliability of the three main processes with the confidence degree γ , respectively. Taking the product of R A , γ ,   R B , γ   and   R C , γ as an approximate solution of the LCL for overall construction reliability, namely
R L = R A , γ R B , γ R C , γ
Then the actual confidence degree γ of R L can be calculated as
γ = P { R R L } = P { R A R L R B R C }
The true values of R B and R C in Formula (18) are unknown. However, their confidence limits at any confidence degree can be calculated in Section 3, respectively. Therefore, γ can be further calculated numerically by the following formula:
γ = P { R R L } = 1 M 2 k 1 = 1 M k 2 = 1 M γ ˜ k 1 k 2
where
γ ˜ k 1 k 2 = P { R A R L R B , γ k 1 R C , γ k 2 }
P [ R B R B , γ k 1 ] = γ k 1 ,   P [ R C R C , γ k 2 ] = γ k 2  
γ k i = 1 k i 0.5 M       k i = 1 , 2 , , M ,   i = 1 , 2
A detailed explanation for the numerical algorithm of Formulas (19)–(22) is summarized in Algorithm 2.
Algorithm 2: Numerical calculation of the γ for R L
(1)
Select  M  according to the requirements of numerical calculation accuracy (e.g., 10 4 , 10 5 , 10 6 ).
(2)
Calculate   the   confidence   degrees   γ k 1   and   γ k 2 using Formula (22).
(3)
Compute   the   R B , γ k 1 and   R C , γ k 2   with   the   corresponding   confidence   degree   γ k 1   and   γ k 2  using Formula (21).
(4)
Substitute R B , γ k 1   and   R C , γ k 2   into   Formula   ( 20 )   to   calculate   γ ˜ k 1 k 2 .
(5)
The confidence degree γ is obtained by Formula (19).
In order to obtain the exact LCL for overall constructed reliability, it is necessary to adjust the confidence degree γ of R A , γ ,   R B , γ   and   R C , γ in Formula (17) to γ , until γ calculated by Algorithm 2 is equal to the required value of γ . In other words, find the value of γ such that the confidence degree for R L in Formula (17) satisfies γ = γ . Finally, the LCL of the overall construction reliability with the confidence degree γ is provided by
R L , γ = R A , γ R B , γ R C , γ
where R A , γ ,   R B , γ   and   R C , γ are the LCLs of the reliability for the fixed-point delivery, lunar surface transport, and docking assembly with the confidence degree γ , respectively. R A , γ ,   R B , γ   and   R C , γ can be calculated by the methods in Section 3.
For a clear description, Figure 7 illustrates the main process of the BBA method. After obtaining the reliability information of each fixed-point delivery, lunar surface transport, and docking assembly, the reliability of each main process can be assessed according to the reliability models of the three main processes, respectively. On this basis, the LSB construction reliability can be assessed with the overall construction reliability model.

5. Example

5.1. Comparative Examples with Traditional Methods

This section compares the proposed method with the LM and MML methods through two large sample examples. The two traditional methods have been widely used in engineering because of their simple calculations and easy-to-understand formulas. However, they are unsuitable for cases where the series system has zero-failure subsystems. In this case, the BBA method in this paper can still work well.
Consider a series system consisting of two independent subsystems. Among them, the test result of subsystem 1 is:  n 1 = 100 ,   s 1 = 99 ; the test result of subsystem 2 is:  n 2 = 100 ,   s 2 = 100 . With the confidence degree γ = 0.9 , the LCLs of system reliability are calculated using the LM, MML, and BBA methods. The results are listed in Table 1.
It can be seen from Table 1 that the LCLs of system reliability given by the LM and MML methods are the same as those of subsystem 1. It means that the two methods do not consider the failure possibility of subsystem 2. However, the LCL of reliability for subsystem 2 is only 0.977, i.e., the failure possibility cannot be ignored. Therefore, the two methods actually lead to a dangerous system reliability assessment. In contrast, the BBA method in this paper can solve this problem by simultaneously considering each subsystem’s possible failure.
The drawback of traditional methods based on maximum likelihood theory is more obvious when all subsystems are zero-failure. For example, consider a series system consisting of three independent zero-failure subsystems with sample numbers of n 1 = 100 , n 2 = 150 , and n 3 = 200 . Similarly, the LCLs of system reliability are calculated using the LM and BBA methods (this scenario is beyond the application scope of the MML method [32]). The results are listed in Table 2.
As shown in Table 2, when all subsystems are zero-failure, the LM method equates system test results to subsystem 1 with the fewest tests, assuming the reliability of the other subsystems as 1. In other words, the LM method only utilizes test information from subsystem 1, discarding valuable data from the other zero-failure subsystems, which is particularly wasteful in the case of small samples. In contrast, the BBA method utilizes test data from all subsystems, making the reliability assessment of the system more objective and reliable.

5.2. Numerical Example of the Proposed Methodology

Assume that the LCLs for the fixed-point delivery, lunar surface delivery, and docking assembly reliability with the confidence degree γ = 0.9 are known to be R A , γ = 0.98 , R B , γ = 0.98 and R C , γ = 0.98 . Moreover, it is known that the fixed-point delivery, lunar surface delivery, and docking assembly tests are all zero-failure data and can be converted into binomial data [33]:
n 1 = ln ( 1 γ ) ln R A , γ = 114
  n 2 = ln ( 1 γ ) ln R B , γ = 114
n 3 = ln ( 1 γ ) ln R C , γ = 114
where n 1 , n 2 and n 3 are the pseudo test numbers of the fixed-point delivery, lunar delivery, and docking assembly, respectively.
In the case of subsystems with zero-failure data, traditional LM and MML methods cannot be applied, as analyzed in Section 5.1. In contrast, the reliability assessment method for the LSB overall construction in Section 4 addresses the above difficulties well. For the cases of fixed-point delivery, lunar surface delivery, and docking assembly with zero-failure data, there are [34]
R A , γ = ( 1 γ ) 1 / n 1
R B , γ = ( 1 γ ) 1 / n 2
R C , γ = ( 1 γ ) 1 / n 3
Accordingly, using the method in Section 4, it is convenient to obtain the LCL of LSB overall construction reliability R with the confidence degree γ = 0.9 as
R L , γ = R A , γ R B , γ R C , γ = ( 1 γ ) 1 n 1 + 1 n 2 + 1 n 3 = 0 . 9544
where γ = 0.8304 , which is calculated from Formulas (19)–(22), and γ ˜ k 1 k 2 in Formula (20) is
γ ˜ k 1 k 2 = 1 R L n 1 ( 1 γ k 1 ) n 1 / n 2 ( 1 γ k 2 ) n 1 / n 3 = 1 ( 1 γ ) 1 + n 1 / n 2 + n 1 / n 3 ( 1 γ k 1 ) n 1 / n 2 ( 1 γ k 2 ) n 1 / n 3
The above results show that the proposed method in this research can fully use the zero-failure information of the three main processes to assess the LSB construction reliability with high confidence.

6. Conclusions

In light of the prevalence of small sample tests and zero-failure data in aerospace product reliability tests, traditional methods such as the LM and MML methods are not applicable. This paper proposes a confidence limit calculation method for the product of subsystem reliability to assess the reliability of LSB construction. A novel phased reliability model is developed to facilitate the building block reliability assessment of LSB construction. The reliability of the three main processes of fixed-point delivery, lunar surface transport, and docking assembly is assessed using reliability test information. The corresponding confidence limit calculation formulas are derived for identical and different reliabilities. The LCL for LSB construction reliability is determined with high confidence based on the assessed reliability of the three main processes. Two comparative examples are used to verify the advantage of the BBA method, demonstrating its ability to handle zero-failure subsystems in series systems.
The application of the proposed method for the LCL of LSB construction reliability is illustrated. Results indicate that the reliability of LSB construction reaches 0.9544 under a high confidence degree index, meeting the engineering requirements. In engineering practice, many aerospace mechanisms can be regarded as series systems, such as solid rockets, the connecting and separating mechanisms of spacecraft, and the landing buffer mechanism of lunar landers. This method can also be extended to assess the reliability confidence limits of such series systems.
Although this study considers subtasks as the fundamental level of the hierarchical reliability model, it is necessary to note that subtasks may be further decomposed into corresponding functional units when direct reliability information is difficult to obtain. This preliminary theoretical exploration only divides the construction process to the subtask level; future research will incorporate specific task requirements to construct a more comprehensive reliability model.

Author Contributions

Conceptualization, Z.L. and H.F.; methodology, Z.L. and H.F.; software, Z.L.; validation, Z.L., H.F. and Q.W.; formal analysis, Z.L.; investigation, Z.L. and H.F.; resources, Z.L., H.F. and Q.W.; data curation, Z.L.; writing—original draft preparation, Z.L.; writing—review and editing, Z.L., H.F. and Q.W.; visualization, Z.L.; supervision, Q.W.; project administration, H.F.; funding acquisition, H.F. All authors have read and agreed to the published version of the manuscript.

Funding

This research was funded by National Natural Science Foundation of China grant No. U2037602.

Institutional Review Board Statement

Not applicable.

Informed Consent Statement

Not applicable.

Data Availability Statement

Not applicable.

Acknowledgments

The authors gratefully acknowledge the financial support for this project from the National Natural Science Foundation of China grant No. U2037602.

Conflicts of Interest

The authors declare no conflict of interest.

Abbreviations

Acronym
LSBlunar scientific baseLMLindstrom-Madden
BBAbuilding block assessmentMMLmodified maximum likelihood
LCLlower confidence limit
Notation
n test number R AL approximate solution to the LCL of R A
s success number γ confidence   degree   of   R AL
R A , R B , R C reliability of fixed-point delivery, lunar surface transport, and docking assembly R A , γ , R B , γ , R C , γ LCLs for the reliability of the three main processes with the confidence degree γ
m 1 , m 2 , m 3 number of subtasks for three main processes R reliability of the overall LSB construction
R A i reliability of the   i th fixed-point delivery R L approximate solution to the LCL of R
γ required confidence degree γ confidence   degree   of   R L
R A i , γ LCL   of   R A i  with the confidence degree  γ R L , γ LCL of  R  with the confidence degree  γ

References

  1. Han, H.; Chen, J. 21st Century Foreign Deep Space Exploration Development Plans and Their Progresses. Spacecr. Eng. 2008, 17, 1–22. (In Chinese) [Google Scholar] [CrossRef]
  2. Benaroya, H.; Bernold, L. Engineering of lunar bases. Acta Astronaut. 2008, 62, 277–299. [Google Scholar] [CrossRef]
  3. Roibás-Millán, E.; Sorribes-Palmer, F.; Chimeno-Manguán, M. The MEOW lunar project for education and science based on concurrent engineering approach. Acta Astronaut. 2018, 148, 111–120. [Google Scholar] [CrossRef]
  4. Zhang, H.; Hu, Z. A Tentative Idea for Robotics Lunar Base. Spacecr. Eng. 2010, 19, 95–98. [Google Scholar] [CrossRef]
  5. Evans, M.E.; Graham, L.D. A Flexible Lunar Architecture for Exploration (FLARE) supporting NASA’s Artemis Program. Acta Astronaut. 2020, 177, 351–372. [Google Scholar] [CrossRef]
  6. Marov, M.Y.; Slyuta, E.N. Early steps toward the lunar base deployment: Some prospects. Acta Astronaut. 2021, 181, 28–39. [Google Scholar] [CrossRef]
  7. Yang, J.; Wu, Q.; Yu, D. Preliminary study on key technologies for construction and operation of robotics lunar scientific base. J. Deep Space Explor. 2020, 7, 111–117. [Google Scholar] [CrossRef]
  8. Yuan, Y.; Zhao, C.; Hu, Z. Prospect of lunar base construction scheme. J. Deep Space Explor. 2018, 5, 374–381. [Google Scholar] [CrossRef]
  9. Chabridon, V.; Balesdent, M.; Bourinet, J.-M.; Morio, J.; Gayton, N. Evaluation of failure probability under parameter epistemic uncertainty: Application to aerospace system reliability assessment. Aerosp. Sci. Technol. 2017, 69, 526–537. [Google Scholar] [CrossRef]
  10. Li, M.; Zhang, W.; Hu, Q.; Guo, H.; Liu, J. Design and Risk Evaluation of Reliability Demonstration Test for Hierarchical Systems With Multilevel Information Aggregation. IEEE Trans. Reliab. 2017, 66, 135–147. [Google Scholar] [CrossRef]
  11. Schuberg, E.; Myhre, J.; Jeske, D.R.; McQuarrie, A.D.; Warfield, J.D. Objective Comparison of Confidence Bound Methods for Binomial Series System Reliability. IEEE Trans. Reliab. 2020, 69, 533–544. [Google Scholar] [CrossRef]
  12. Yang, L.; Guo, Y.; Wang, Q. Reliability Assessment of a Hierarchical System Subjected to Inconsistent Priors and Multilevel Data. IEEE Trans. Reliab. 2020, 69, 277–292. [Google Scholar] [CrossRef]
  13. Xu, Y.; Zheng, X.; Yao, W.; Wang, N.; Chen, X. A sequential multi-prior integration and updating method for complex multi-level system based on Bayesian melding method. J. Risk Reliab. 2021, 235, 863–876. [Google Scholar] [CrossRef]
  14. Sengupta, A.; Anderson, J.A.; Garner, C.; Brophy, J.R.; de Groh, K.K.; Banks, B.A.; Thomas, T.A.K. Deep Space 1 Flight Spare Ion Thruster 30,000-Hour Life Test. J. Propuls. Power 2009, 25, 105–117. [Google Scholar] [CrossRef]
  15. Herman, D.A.; Soulas, G.C.; Van Noord, J.L.; Patterson, M.J. NASA’s Evolutionary Xenon Thruster (NEXT) Long-Duration Test Results. J. Propuls. Power 2012, 28, 625–635. [Google Scholar] [CrossRef]
  16. Cui, Y.; Zhang, Y.; Wang, Z. Interval statistic based reliability analysis method on small sample hot test of satellite thruster. Appl. Math. Model. 2018, 60, 581–591. [Google Scholar] [CrossRef]
  17. Chen, W.B.; Li, X.Y.; Li, F.R.; Kang, R. Belief reliability evaluation with uncertain right censored time-to-failure data under small sample situation. Qual. Reliab. Eng. Int. 2022, 38, 3099–3115. [Google Scholar] [CrossRef]
  18. Tang, L.; Yang, G.; Xie, M. Planning Of Step-stress Accelerated Degradation Test. In Proceedings of the Reliability and Maintainability, 2004 Annual Symposium 2004, Los Angeles, CA, USA, 26–29 January 2004; pp. 287–292. [Google Scholar]
  19. Guo, H.; Jin, T.; Mettas, A. Designing Reliability Demonstration Tests for One-Shot Systems Under Zero Component Failures. IEEE Trans. Reliab. 2011, 60, 286–294. [Google Scholar] [CrossRef]
  20. Li, H.; Xie, L.; Li, M.; Ren, J.; Zhang, S. Reliability assessment of high-quality and long-life products based on zero-failure data. Qual. Reliab. Eng. 2018, 35, 470–482. [Google Scholar] [CrossRef]
  21. Lloyd, D.K.; Lipow, M. Reliability: Management, Methods, and Mathematics; University of Tennessee: Knoxville, TN, USA, 1962. [Google Scholar]
  22. Easterling, R.G. Approximate Confidence Limits for System Reliability. J. Am. Stat. Assoc. 1972, 67, 220–222. [Google Scholar] [CrossRef]
  23. Martz, H.F.; Duran, B.S. A Comparison of Three Methods for Calculating Lower Confidence Limits on System Reliability Using Binomial Component Data. IEEE Trans. Reliab. 2009, R-34, 113–120. [Google Scholar] [CrossRef]
  24. Yang, S.; Xu, L.; Xu, J. Sequential multilayer fusion based assessment model for spacecraft launch success ratio. Aerosp. Sci. Technol. 2016, 48, 223–233. [Google Scholar] [CrossRef]
  25. Mann, N.R. Approximately Optimum Confidence Bounds on Series- and Parallel-system Reliability for Systems with Binomial Subsystem Data. Microelectron. Reliab. 1974, 14, 295–304. [Google Scholar] [CrossRef]
  26. Coit, D.W. System-Reliability Confidence-Intervals for Complex-Systems with Estimated Component-Reliability. IEEE Trans. Reliab. 1997, 46, 487–493. [Google Scholar] [CrossRef]
  27. Dai, Z.; Wang, Z.; Jiao, Y. Bayes Monte-Carlo Assessment Method of Protection Systems Reliability Based on Small Failure Sample Data. IEEE Trans. Power Deliv. 2014, 29, 1841–1848. [Google Scholar] [CrossRef]
  28. Guo, J.; Li, Z.; Keyser, T. A Bayesian approach for integrating multilevel priors and data for aerospace system reliability assessment. Chin. J. Aeronaut. 2018, 31, 41–53. [Google Scholar] [CrossRef]
  29. Wilson, A.G.; Fronczyk, K.M. Bayesian reliability: Combining information. Qual. Eng. 2016, 29, 119–129. [Google Scholar] [CrossRef]
  30. Marks, C.E.; Glen, A.G.; Robinson, M.W.; Leemis, L.M. Applying Bootstrap Methods to System Reliability. Am. Stat. 2014, 68, 174–182. [Google Scholar] [CrossRef]
  31. Samart, K.; Jansakul, N.; Chongcheawchamnan, M. Exact bootstrap confidence intervals for regression coefficients in small samples. Commun. Stat.–Simul. Comput. 2017, 47, 2953–2959. [Google Scholar] [CrossRef]
  32. Du, S.; Li, Z.; Yu, D.; Li, D.; Hu, Q. Exact confidence limit for complex system reliability based on component test data. Qual. Technol. Quant. Manag. 2020, 17, 75–88. [Google Scholar] [CrossRef]
  33. Zheng, Z. On Transformation of Data in The Evaluation of Reliability of a System. Qual. Reliab. 1995, 1, 23–25. (In Chinese) [Google Scholar]
  34. Clopper, C.J.; Pearson, E.S. The Use of Confidence or Fiducial Limits Illustrated in the Case of Binomial. Biometrika 1934, 26, 404–413. [Google Scholar] [CrossRef]
Figure 1. Schematic diagram of the three main processes of LSB construction. (a) The fixed-point delivery of equipment on the lunar surface, (b) The lunar surface transport of equipment, (c) The docking and assembly of equipment on the lunar surface.
Applsci 13 09823 g001
Figure 2. A phased reliability model for LSB construction. The letters A, B and C refer to the three main processes respectively, and the letters’ subscripts indicate the sequence number of subtasks.
Applsci 13 09823 g002
Figure 3. A subtask reliability model for LSB construction.
Applsci 13 09823 g003
Figure 4. The reliability block diagram of fixed-point delivery.
Applsci 13 09823 g004
Figure 5. The flow chart for the fixed-point delivery reliability assessment method.
Applsci 13 09823 g005
Figure 6. The reliability block diagram of the overall LSB construction.
Applsci 13 09823 g006
Figure 7. Flow chart of the proposed BBA method for the LSB construction.
Applsci 13 09823 g007
Table 1. LCL calculations for system reliability using the LM, MML, and BBA methods ( γ = 0.9 ) .
Date/ResultsSubsystem 1Subsystem 2System
LM
Method
MML
Method
BBA
Method
Number of samples100100100100
Number of successes991009999
LCL for reliability0.9620.9770.9620.9620.948
Table 2. Reliability assessment results for the system composed of three zero-failure subsystems using the LM and BBA methods ( γ = 0.9 ) .
Date/ResultsSubsystem 1Subsystem 2Subsystem 3System
LM
Method
BBA
Method
Number of samples100150200100
Number of successes100150200100
LCL for reliability0.9770.9840.9890.9770.962
Disclaimer/Publisher’s Note: The statements, opinions and data contained in all publications are solely those of the individual author(s) and contributor(s) and not of MDPI and/or the editor(s). MDPI and/or the editor(s) disclaim responsibility for any injury to people or property resulting from any ideas, methods, instructions or products referred to in the content.

