Article

A Method for Extracting a Laser Center Line Based on an Improved Grayscale Center of Gravity Method: Application on the 3D Reconstruction of Battery Film Defects

1
Lianyungang Normal College, Lianyungang 222006, China
2
School of Mechatronic Engineering, China University of Mining and Technology, Xuzhou 221116, China
*
Author to whom correspondence should be addressed.
Appl. Sci. 2023, 13(17), 9831; https://doi.org/10.3390/app13179831
Submission received: 16 July 2023 / Revised: 12 August 2023 / Accepted: 29 August 2023 / Published: 30 August 2023
(This article belongs to the Special Issue Recent Advances in Autonomous Systems and Robotics)

Abstract

:
Extraction of the laser fringe center line is a key step in the 3D reconstruction of linear structured light, the accuracy of which is directly related to the quality of the 3D model. A laser center line extraction method based on an improved gray center of gravity method is proposed to solve the problem of low extraction accuracy. Firstly, a smoothing method is used to eliminate the flat top of the laser line, and the Gaussian curve is adopted to fit the peak position of the curve. Then, the gray threshold is set to automatically extract the laser linewidth, and based on the window opening, the grayscale center of gravity method is improved to extract the coordinates of the center pixel for the second time. Finally, experiments show that the average absolute error of the improved laser line extraction method is 0.026 pixels, which is 2.3 times lower than the gray center of gravity method, 1.9 times lower than the curve fitting method, and the standard error can reach 0.005 pixels. Compared with the gray center of gravity method and the curve fitting method, the influence of gray value change on the center line extraction is more fully considered, and the center of the light strip can be extracted more accurately, achieving sub-pixel accuracy.

1. Introduction

With the development of science and technology, lithium batteries with excellent performance have been widely used in many fields. However, there may be various surface defects in the production process of lithium batteries, which can produce many safety risks [1]. Therefore, the detection of surface defects of lithium batteries is particularly important in the early stage [2]. At present, the detection methods of lithium batteries are mainly reflected in the following two aspects: on the one hand, most of the product lines use human eye observation [3], which is labor-intensive and has a high error rate. On the other hand, the traditional visual two-dimensional surface inspection is greatly interfered with by external factors such as external light [4], product deformation, information collection [5], and difficult program debugging [6].
Due to the environmental limitations of 3D information extraction in industry, compared with the direct detection of features, machine vision has attracted the attention of researchers. The 2D industrial machine vision cannot obtain the height information of the detected surface defects, so the point cloud information of the measured surface is collected through 3D machine vision to achieve 3D reconstruction [7]. Zhao et al. [8] proposed an improved edge scan extraction model based on CCD camera vibration frequency and established a 3D quantitative method for surface defects of cast plate embryos. J.R. Arciniegas et al. [9] established a 3D reconstruction system based on fringe projection technology to solve the surface detection problem of non-metallic pipelines transporting hydrocarbons. Kang et al. [10] developed a surface detection system with 3D characteristic defects on the surface of flat steel using multi-spectral stereoscopic technology that could reliably detect small surface defects. A detection technology improved by Chien et al. [11] can identify and classify defects in transparent substrates by using diffraction characteristics of digital holograms and machine learning algorithms. A. Dawda et al. [12] proposed an automatic defect detection technology combining laser line projection and stereo vision, which effectively reduced the influence of high-precision surfaces on the accuracy of 3D reconstruction. Yang et al. [13] processed the data required for defect detection and 3D reconstruction based on laser scanning and adopted a BP neural network to filter the obtained point cloud data, effectively reducing the complexity of the 3D reconstruction of the weld surface. At present, research on the 3D reconstruction of surface defects mostly focuses on the identification of defects, while the quantitative analyses for defect classification and statistics are relatively few.
Among many measurement methods for 3D reconstruction, laser measurement, as a non-contact measurement, does not damage the measured object and has high measurement accuracy and speed [14]. C. Lizcano et al. [15] proposed a 3D surface reconstruction method based on triangulation, which can generate 3D surfaces. Li et al. [16] proposed a 3D point cloud detection method based on laser scanning and data low noise processing technology, which showed high accuracy for complex surfaces. The mobile laser scanning system built by Chen et al. [17] can quickly and automatically reconstruct the 3D model of urban roads. Wang et al. [18] improved the point cloud surface reconstruction algorithm of laser imaging radar to build a dense 3D depth surface, improving the robustness and reconstruction accuracy of the surface reconstruction algorithm. In order to solve the problem of moving objects, Liu et al. [19] designed a 3D reconstruction algorithm based on line laser rotational scanning and established a vision measurement system of a rotating platform. Jiang et al. [20] used a 3D data registration based on black and white ring marking by using monoculture laser line scanning technology, and real sculpture experiments verified the effectiveness of the proposed method. Sun et al. [21] used an innovative calculation method based on the target angle to effectively improve the effect of laser intensity correction and 3D reconstruction. In order to eliminate the error caused by the deflection between the measured system and the co-construction, Jia et al. [22] measured the weld by the height value based on the grid laser and the gray value of the gray photo to obtain the 3D contour. Aiming at the problem of low reconstruction accuracy of small objects, Li et al. [23] provided a fast and complete 3D reconstruction method based on a laser scanning and SMF algorithm, which improved the speed, accuracy, integrity, and visual effect of 3D modeling of small objects. However, the result of laser measurement is easily affected by noise as the laser line has a certain width, and the fuzzy contour line may lead to a deviation between the reconstructed result and the measured object.
The laser centerline extraction has a very important influence on the accuracy of 3D establishment [24], and the extraction methods for objects with surface texture and reflective plane are relatively few [25]. Li et al. [26] applied a laser centerline extraction algorithm based on the Hesse matrix to laser scanning and built a high-speed and high-precision laser centerline extraction system. Yang et al. [27] proposed a laser fringe center detection algorithm based on the gray barycenter, which has been proven to be characterized by good stability. Yin et al. [28] used a breakpoint detection method of laser fringe center line based on fixed dynamic programming, which could effectively avoid the influence of noise and improve the calculation efficiency. Tian et al. [29] used the contour polygon segmentation method to extract the laser centerline, and experiments showed that a more complete and smooth 3D model could be generated compared with other classical methods. Chen et al. [30] applied a Voronoi diagram to laser fringe extraction and proposed a fast-pruning algorithm for the reconstruction of standard graphics, but there were large errors in the processing of noisy images. Hou et al. [31] improved a grayscale barycenter method based on a normal vector to calculate the subpixel center of laser lines. Due to the large number of calculations required for hundreds of images, Wang et al. [32] proposed a Zhang–Sun refinement algorithm to effectively preserve the data information of the laser fringe endpoints. When fitting the laser center line, a method of extracting the region of interest is proposed to improve the anti-interference ability of the algorithm, but the influence of the laser line width and gray value on the center line is not considered.
Based on the above analysis of the references, a method for extracting the laser center line based on the improved grayscale center of gravity method is proposed in this work, which is applied to the 3D reconstruction of battery film defects. Firstly, a smoothing method is used to eliminate the flat top of the laser line, and the Gaussian curve is adopted to fit the peak position of the curve. Then, the gray threshold is set to automatically extract the laser linewidth, and based on the window opening, the grayscale center of gravity method is improved to extract the coordinates of the center pixel for the second time. Finally, the 3D model of surface defects on the lithium battery is reconstructed, and the experimental results show that the standard error of the proposed method is 0.005 pixels, which has a better extraction accuracy and noise resistance.
The rest of this work is organized as follows. The principle of laser triangulation and the pretreatment method of images are introduced in Section 2. In Section 3, the improved laser extraction method is proposed. The superiority of the proposed method is verified by analyzing the accuracy, noise resistance, and reconstruction effect of the method in Section 4. Conclusions and future works are summarized in Section 5.

2. Proposed Method

2.1. Principles of Laser Triangulation

The method of laser triangulation measurement is to form a triangular mathematical model by the position relation of the optical system, the laser emitter, and the surface spot of target objects, which uses the displacement change received by the optical system to calculate the speckle height information.
The measurement schematic is shown in Figure 1. The laser emitter emits a target beam projecting onto the object measured to form a laser line. The sensor in the optical system receives the laser line information from the target by receiving the lens, and the laser line information received by the base plane (no measured material) is displaced x in relation to the laser line information. Based on this, a triangular function relationship is formed. The relative height relationship between the surface of the object under test and the base plane is calculated by the relative displacement x of the laser line on the sensor, the angle of the laser and the receiving light β, and so on.
Laser triangulation can be divided into vertical and oblique, based on the incident position of the laser. The characteristic of the vertical incident type is to direct the light emitted by the line laser perpendicular to the base platform, which makes it easy to construct the mathematical model of the triangulation method, and the environment requirement is low. The inclined incident is the light emitted by the line laser into the benchmark platform at a certain angle. There is information on several angular parameters, meaning it is not easy to construct the mathematical model and needs higher environment requirements. As this study is about information on the lithium battery film surface height, the detection environment is relatively stable, and the vertical incident model is relatively simple; thus, the measurement speed is fast with a higher measurement accuracy and stability, so the vertical incident method is chosen in this work.
As shown in Figure 1, the laser beam is projected vertically at the O′ point in the base plane. The angle of the light received with the camera is β. Through the O point of the photocenter, the laser beam is imaged at the M′ point on the optical sensor. The distance between the O’ and the optical imaging system is b, the distance from the imaging point M′ to the center of the light O is a; when acting on a high object, the M′ point on the optical sensor is displaced, and the information of the N point on the surface of the object measured is projected on the N′ point of the sensor. The distance between the M′ and N′ is x, the height difference between the point of the measured object and the base plane is h. The N point is passed to create the vertical line of the receiving light, and the Pendant is the M point.
Shown in the geometric O M N O M N consisting of the laser light, according to the triangular similarity principle:
O M O M = M N M N
where O N = h , M O N = β , O M = a , O O = b , M N = x .
In O M N , according to the geometric relation:
O M = h c o s β
M N = h s i n β
and then:
O M = b h c o s β
The Formulas (1) and (4) are united and sorted out:
x b h c o s β = a h s i n β
h = x b a s i n β + x c o s β
As can be seen from Figure 2, the 3D reconstruction system is that the camera captures images containing laser lines at β angles based on laser triangulation. The computer terminal calculates the surface height h at different times, and the measured height information is recorded in the slice model. Finally, the 3D surface information is recovered by slice stacking to obtain the 3D surface model. It can be seen that the accuracy of laser centerline extraction is related to the accuracy of 3D reconstruction. The β is set to 30°; the advantage is that a sufficient surface field of view can be obtained without being obscured.

2.2. Image Preprocessing

In the visual system process, due to the presence of a lot of non-interest points and spot noise in the image, directly using the visual measurement system to coordinate the laser line extraction, the system can have a large complexity, slow processing speed, and low accuracy. Therefore, it is necessary to preprocess the image acquired by the visual system, which includes segmentation cropping, binarization, blurring, etc. The image preprocessing operation enhances the quality of the original laser line image and improves the accuracy of image acquisition.
As shown in Figure 3, the image of the original laser line is obtained from the camera. The laser line information includes the lithium battery plane information and the experimental platform plane information. The lithium battery plane information is the area of interest; the retained image should ensure the integrity of the object as much as possible. The computational complexity is reduced by decreasing the amount of data to reduce pixel points in the image processing, so the image needs to be cropped to draw the ROI area. In order to improve the speed of the laser line area and highlight the regional characteristics, the image needs to be grayed out. Because of some problems with the original grayscale image, there is a cliff-like change in the gray degree of the light-dark junction. As shown in the Gaussian blur of Figure 3, one of the grayscale lines need to be smoothed to allow for more complete extraction of bright areas.
The Gaussian filtering, median filtering, and mean filtering are classical image smoothing fuzzy processing methods. These methods are low-pass filters optimized for smooth processing in high-frequency parts of the image in areas such as edges, brightness jumps, and fast changes. The mean filter is to calculate the average of the gray value in the filter range and replace it. The median filter is to sort the gray value in the filter range and replace it with the median value. The Gaussian filtering gives the weights to the surrounding pixel points and is replaced by averages based on the weights and grayscale values of each pixel point. After dealing with the filtering method, the grayscale value is more in accordance with the light intensity distribution mode, so the Gaussian blur is used for smooth operation in this work; the principle is shown in Figure 4.
In order to select the appropriate parameters for the Gaussian blur, the pixel point on the line of the laser line is selected to evaluate the grayscale value. The results of using Gaussian blur different radius threshold processing are compared with the grayscale value of the original image, which is shown in Figure 5.
Three cases of filter radius r = 3, r = 5, and r = 7 are compared in this work, respectively. It can be seen that the change curve of the gray value is smoother after filtering, and the peak of the gray degree is decreased with the increase of filter radius. However, the grayscale peak reaches 255 (the grayscale peak of the original map) only when r = 3, and has a smoother curve compared to the grayscale curve, so taking r = 3, setting the grayscale threshold of 35.
The extracted area is shown in Figure 6, where the main three lines are the laser line regions and some reflective noise in the data acquisition. In Figure 6b, Considering the small volume of the noise area, the volume threshold area is greater than 500 to obtain the full laser line area. Obtaining a good laser line area is an important prerequisite for extracting the centerline, which can effectively reduce the noise interference during the centerline extraction.

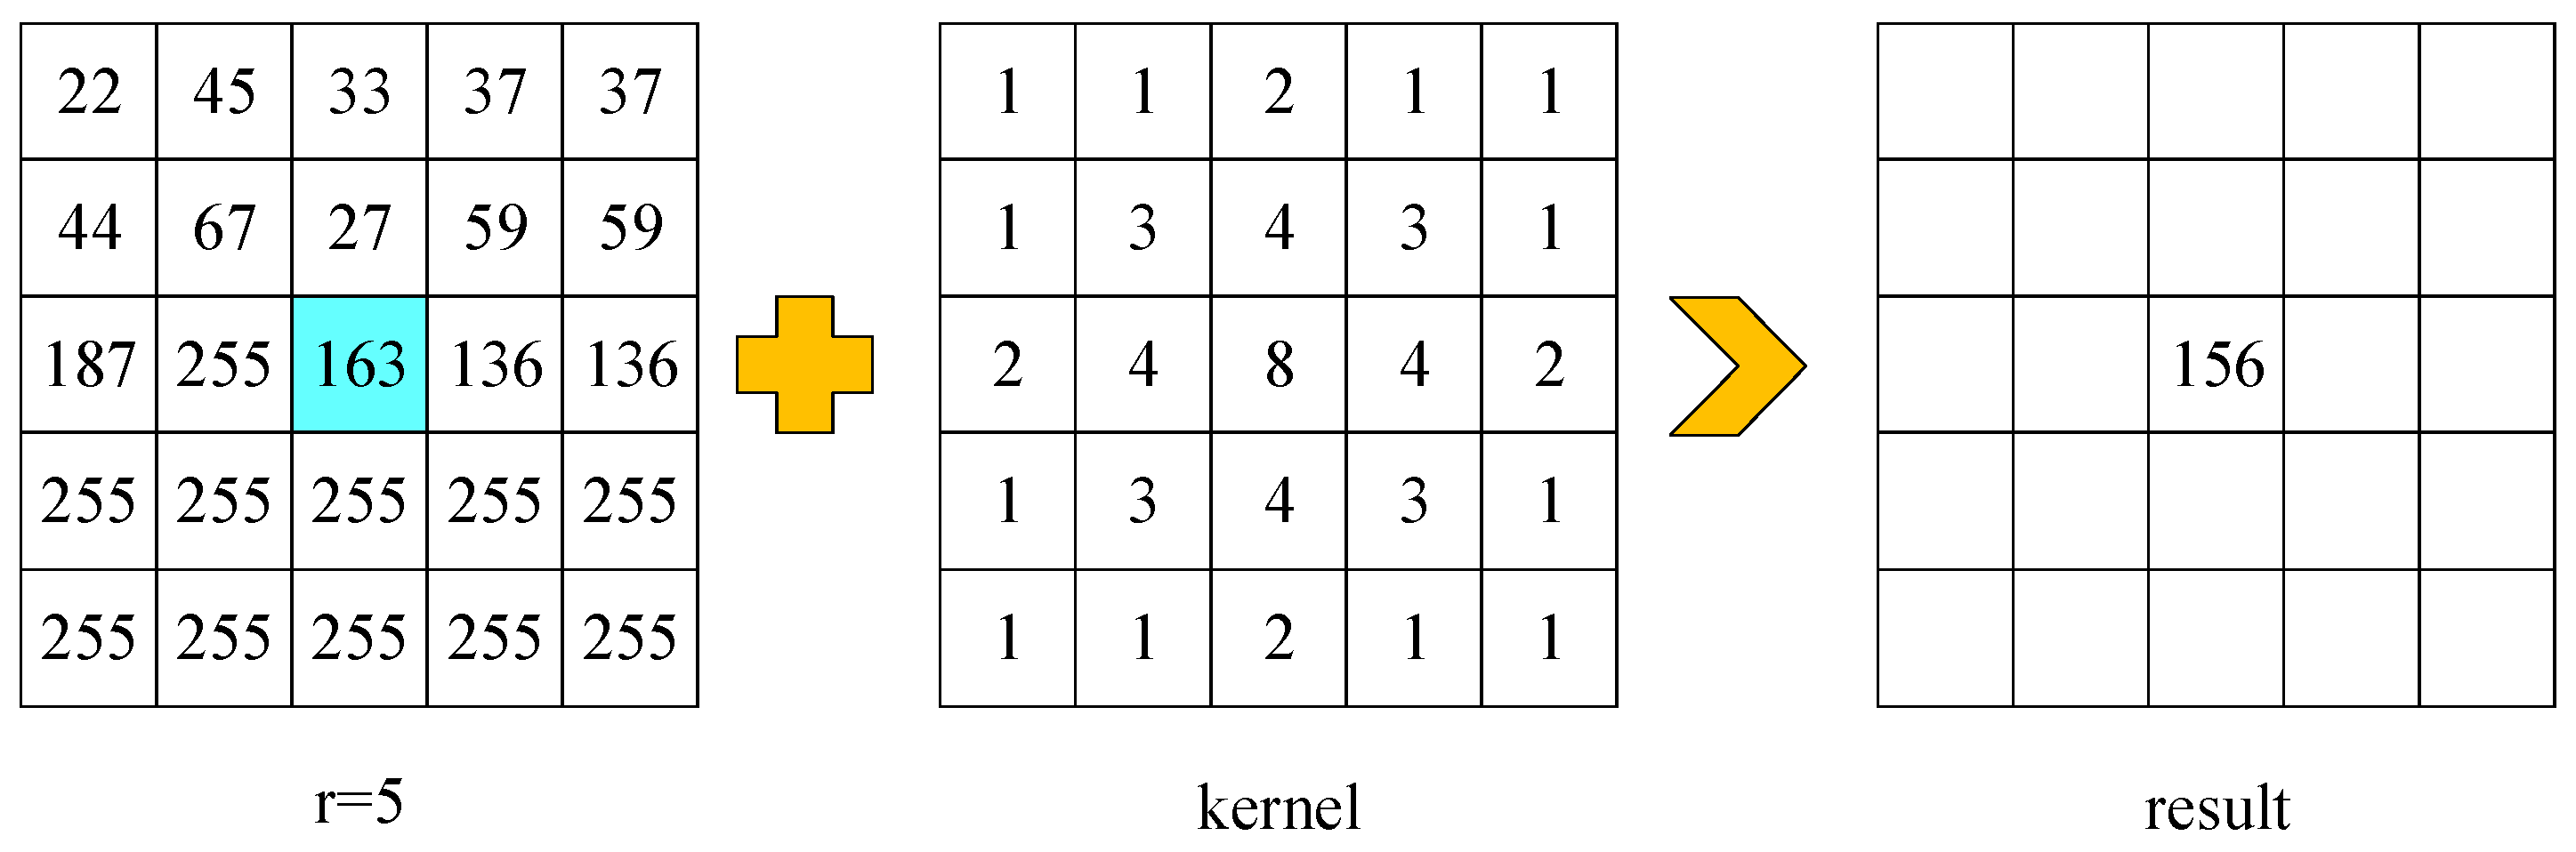
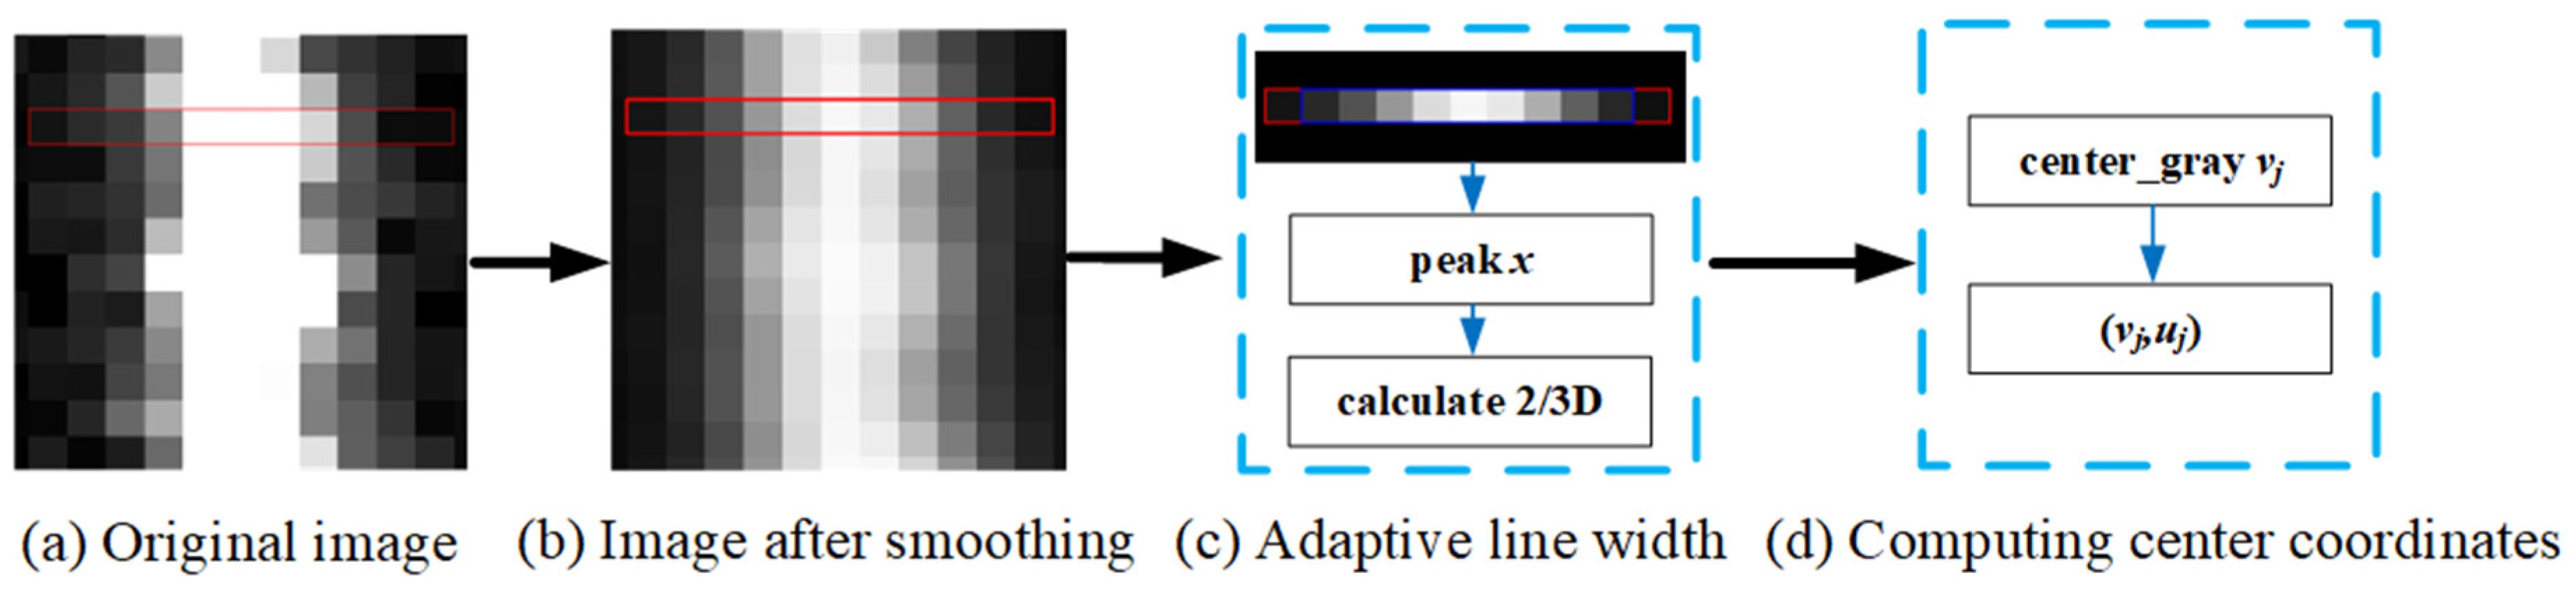
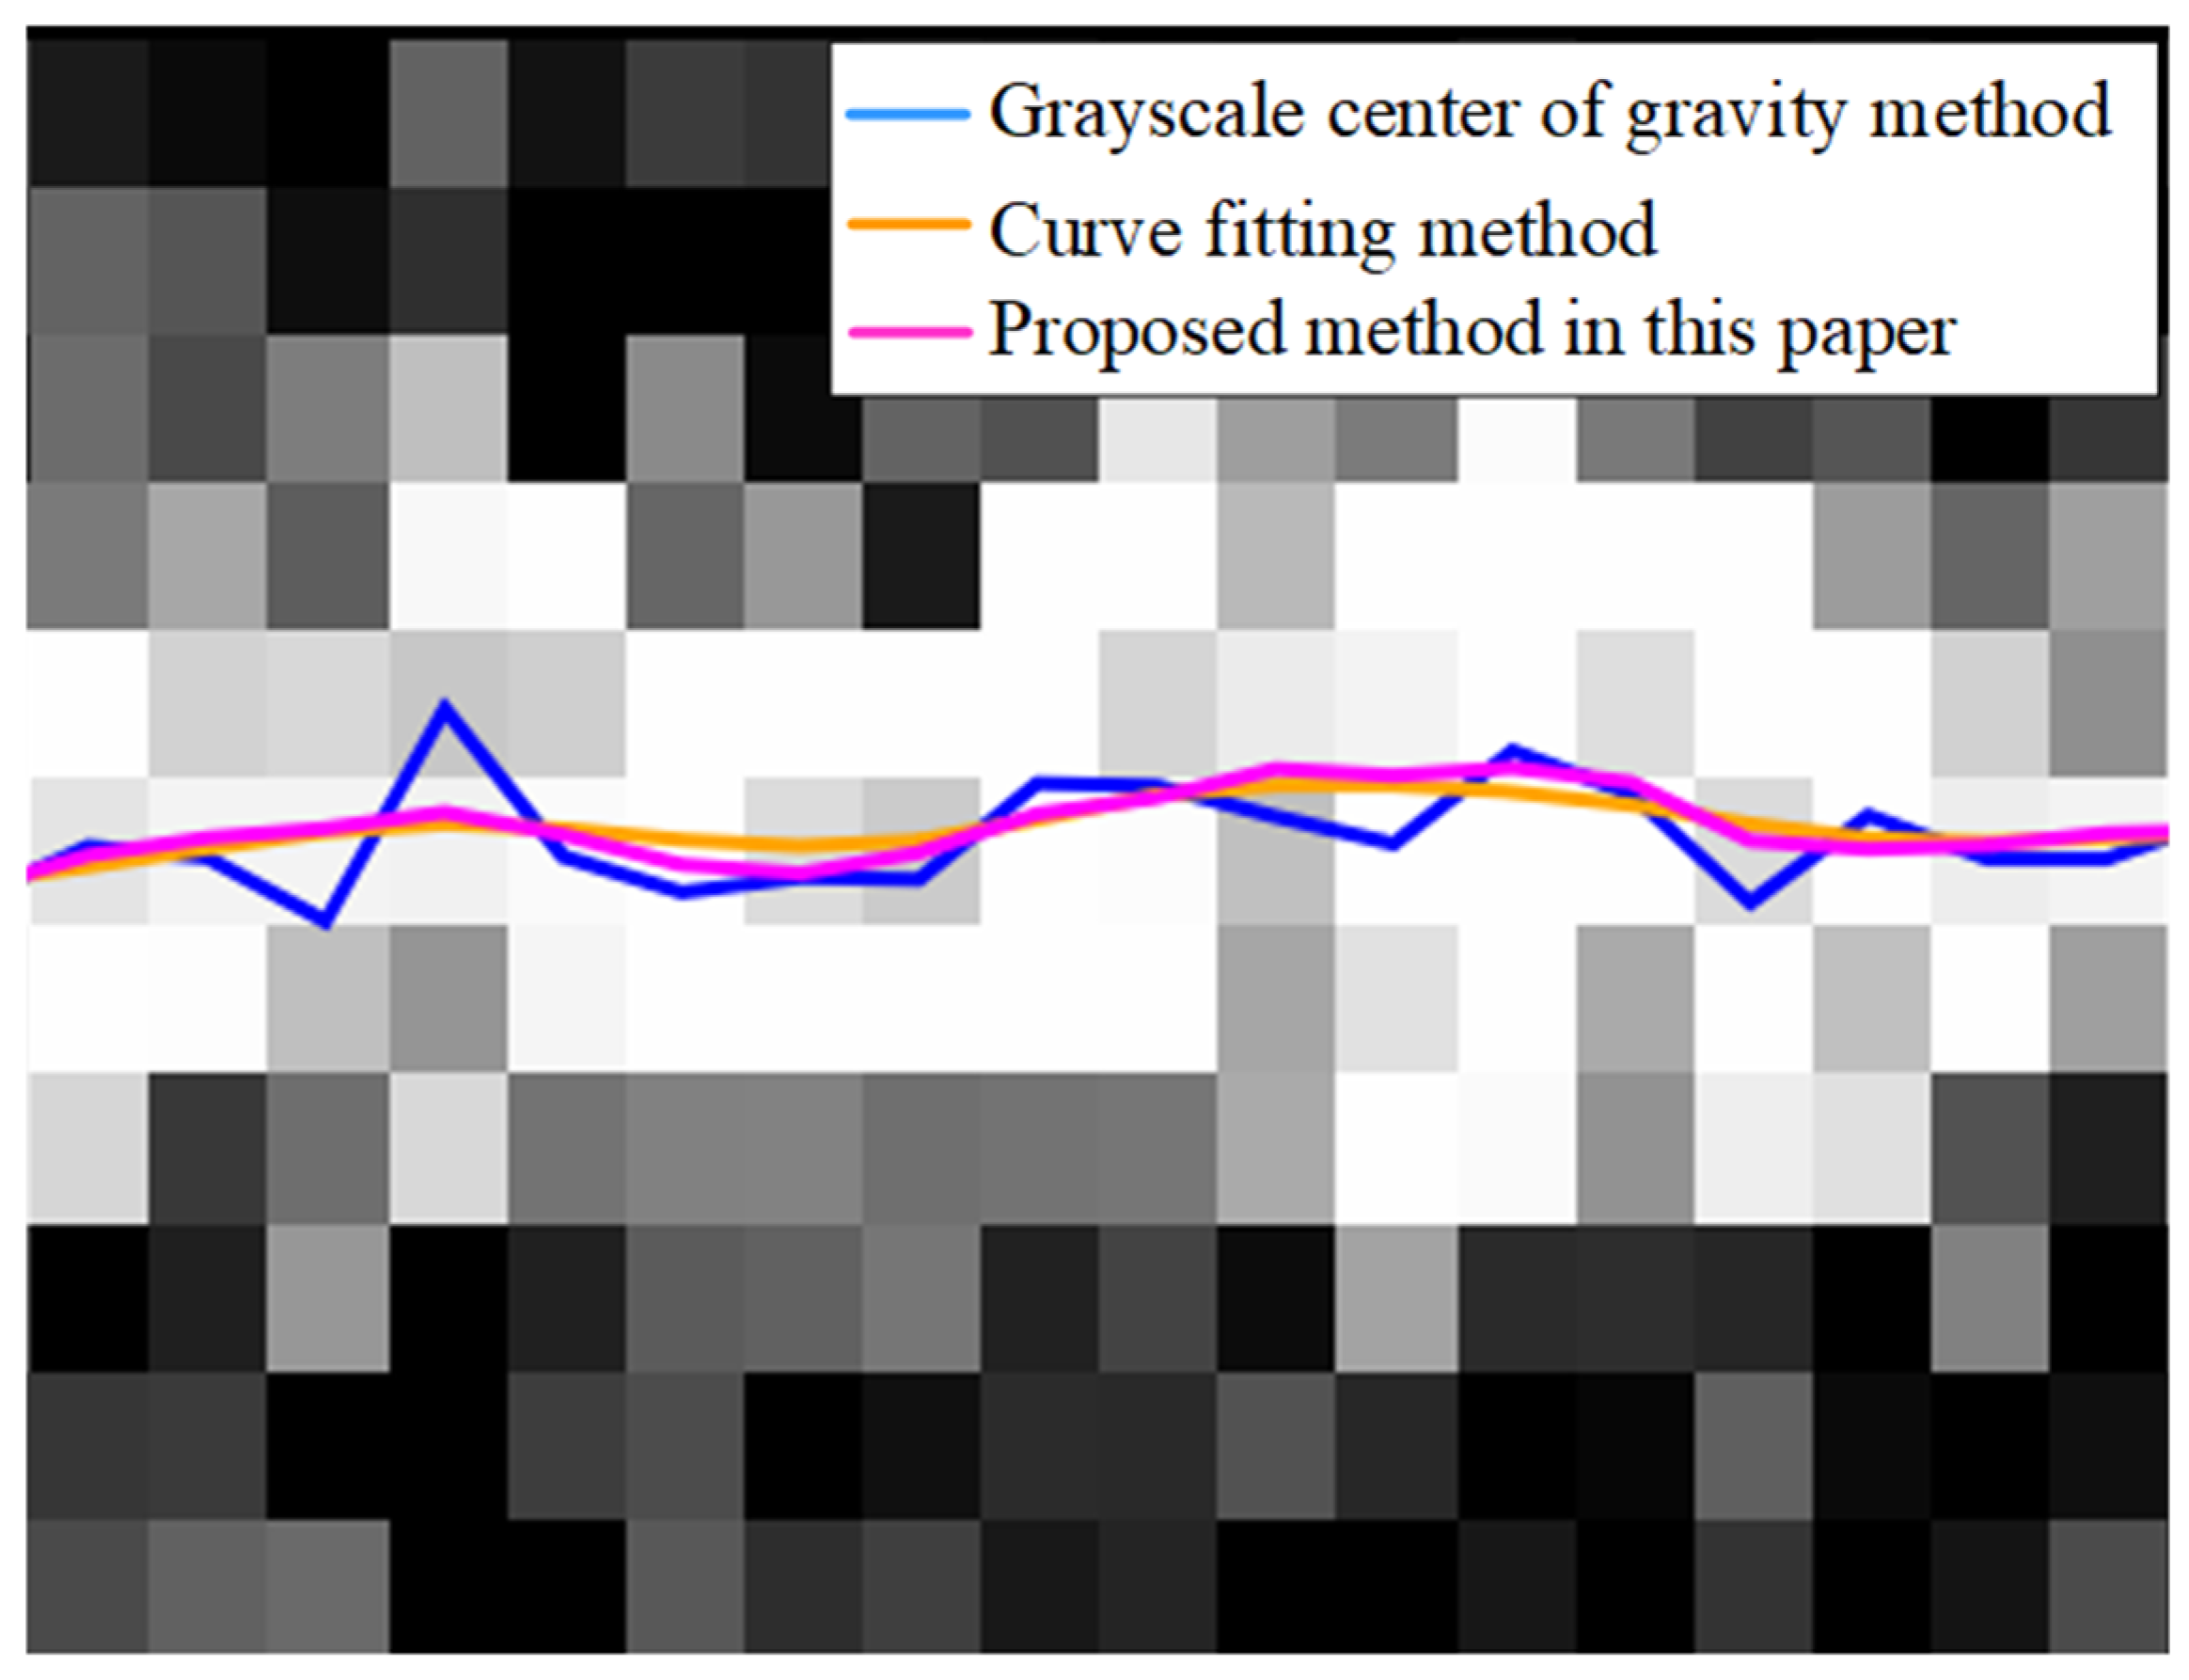
3. The Improved Laser Line Extraction

As shown in Figure 7, any point on the world coordinate system can be transformed into pixel coordinates. In order to obtain the target 3D information, the object position information needs to be restored from the laser line. The extraction of the laser line center line plays an important role in this system, which is the essential step in the process of obtaining high-precision 3D model data of the lithium battery surface. The accuracy of laser line extraction affects the subsequent 3D reconstruction, data processing, defect identification classification, and other related work. Therefore, it is important to choose the appropriate laser line extraction method.
The continuous gray saturation often occurs in the central line extraction process, which is also known as the “flat top”’ phenomenon. As shown in Figure 7, there is a situation where multiple pixels reach the grayscale value of 255, so that the above centerline extraction method cannot reflect the true position of the laser line to some extent, resulting in the laser centerline cannot be accurately extracted. Therefore, it is necessary to solve the “flat top” phenomenon where the grayscale value is saturated, and then put forward the method with higher precision in the centerline extraction.
As shown in Figure 7, there is an image of the grayscale distribution of pixel coordinates, which is perpendicular to the direction of the laser stripe. The grayscale strength of the laser stripe in this direction corresponds to the Gaussian distribution with respect to the left and right symmetry of the laser line center of gravity. The Gaussian curve is used for fitting in this paper, and the peak of the fitting curve is obtained as the centerline coordinate value of the coarse extraction. As can be seen from the peak extraction, the coordinates of the centerline have reached the sub-pixel level. Because of the flat top phenomenon due to the saturation of the grayscale, a degree of error in the information of curve fitting is caused by the saturation points, and the curve information reflected by the grayscale value cannot be fitted accurately. The flat roof phenomenon is due to the laser stripes projected by the laser emitter on the target object brightness information beyond the light intensity reflected by the grayscale value (0~255), resulting in a continuous area of gray saturation (grayscale value 255) state. Therefore, the problem of extracting the center line of the supersaturated laser line is how to solve the influence of the supersaturation point on the gray intensity information.
For the center line of the supersaturated laser line, the flat top phenomenon of the laser line is eliminated by using the smoothing method shown in Figure 8. Then, the Gaussian curve is used to fit the peak position of the exit curve, which is the center point coordinates.
As shown in Figure 8, the original sampling points are saturated with multiple grayscale values, and the grayscale values are unevenly distributed. There are singular points that deviate from the fitting curve, which results in a large deviation by Gaussian curve fitting. As the blue box pixel dots shown in Figure 8, the saturation point of the grayscale value is eliminated by the Gaussian smoothing for the original data. After eliminating the flat top phenomenon, the Gaussian curve is used to fit out the gray curve spline and extract the peak position. As can be seen from the results of the two graphs, the grayscale value changes greatly after smoothing, and the defect spline is more consistent with the true value of the grayscale curve.
Considering that the above curve fitting method has reached the sub-pixel level, there are still some deviations as the curve fitting does not fully utilize each grayscale value. The grayscale center of gravity method can fully reflect the change in grayscale value, so the center pixel coordinates extracted after smoothing are extracted quadratically by using the grayscale center of gravity method. The grayscale center of gravity method is used to extract the center line coordinates of laser lines by using the pixel point coordinates and the grayscale value of pixel points. The method is to calculate the “mass” position of a column of pixel grayscale values. The result is a centroid coordinate; the calculation method is shown in Formula (7):
u j = j v j = i i G i , j i G i , j
where ( u j , v j )   represents the centerline extraction of the j-row laser stripe and G i , j represents the grayscale value of the j -row, i -column pixel.
As can be seen from the grayscale center of gravity method, the grayscale center of gravity method is solved by selecting the threshold area, and the grayscale value in the region will have an effect on the final solution. Because of the above factors, on the basis of using the Gaussian fuzzy removal image flat roof phenomenon, the gray threshold value is set to automatically extract the laser line width. As shown in Figure 8, the grayscale center of gravity method is improved by using the open window thought to select the solving area in this work.
From Figure 8, it is clear that the Gaussian curve removing the flat roof phenomenon better fits the grayscale distribution. There are some deviations between the extreme x = 1165.115 and the extreme, which did not remove the flat top phenomenon, x = 1165.205. After the above analysis, the grayscale center of gravity method that can fully reflect the grayscale change is selected, and the center point xmax and the calculation range R of the grayscale center of gravity method is calculated. The center point xmax is the transverse coordinate of the maximum point of grayscale value after filtering. The calculation range R is 2D/3 times the number of pixels in horizontal coordinates, where D is the line width of the laser line. The line width of the laser line is calculated by the number of sampling points after taking a certain threshold. This method adapts the line width of each laser line, thus bringing about a change in the range of the grayscale.
Figure 9a is the original image; the laser stripe section will be traversed to accurately extract the center position in the method; Figure 9b is the image that is blurred and smoothed by Gaussian, extracting the uj row cross-section; Figure 9c is the parameter calculation of the grayscale center of gravity method, extracts the highest point of grayscale value, and opens the window left and right to select the grayscale gravity area. According to Figure 6, the largest pixel point within the grayscale center of gravity range is coordinated, i.e., peak xmax = 1165.115, the point (xmax = 1165) is considered as the center point round to open the window (the window size is 2D/3). The grayscale value and the number of squares in the adjacent squares have a certain proportion to the grayscale center of gravity range, so that the grayscale peak coordinates of the grayscale image after the Gaussian fuzzy processing take the same length to extract the laser line. In Figure 9c, the blue area is a grayscale gravity area, x = 1165 is considered as the starting point, the grayscale threshold is set for the line width D of the laser line. The grayscale threshold is set to 50 and the line width D is set to 7. The left and right lengths L = 2D/3 are selected. After rounding, the L is equal to 4, and then the grayscale center of gravity method is conducted. Figure 9d is the extracted result, and the center point coordinates obtained by the grayscale center of gravity method is vj, i.e., the extracted central coordinate point is (vj, uj).

4. The Experiment and Discussion

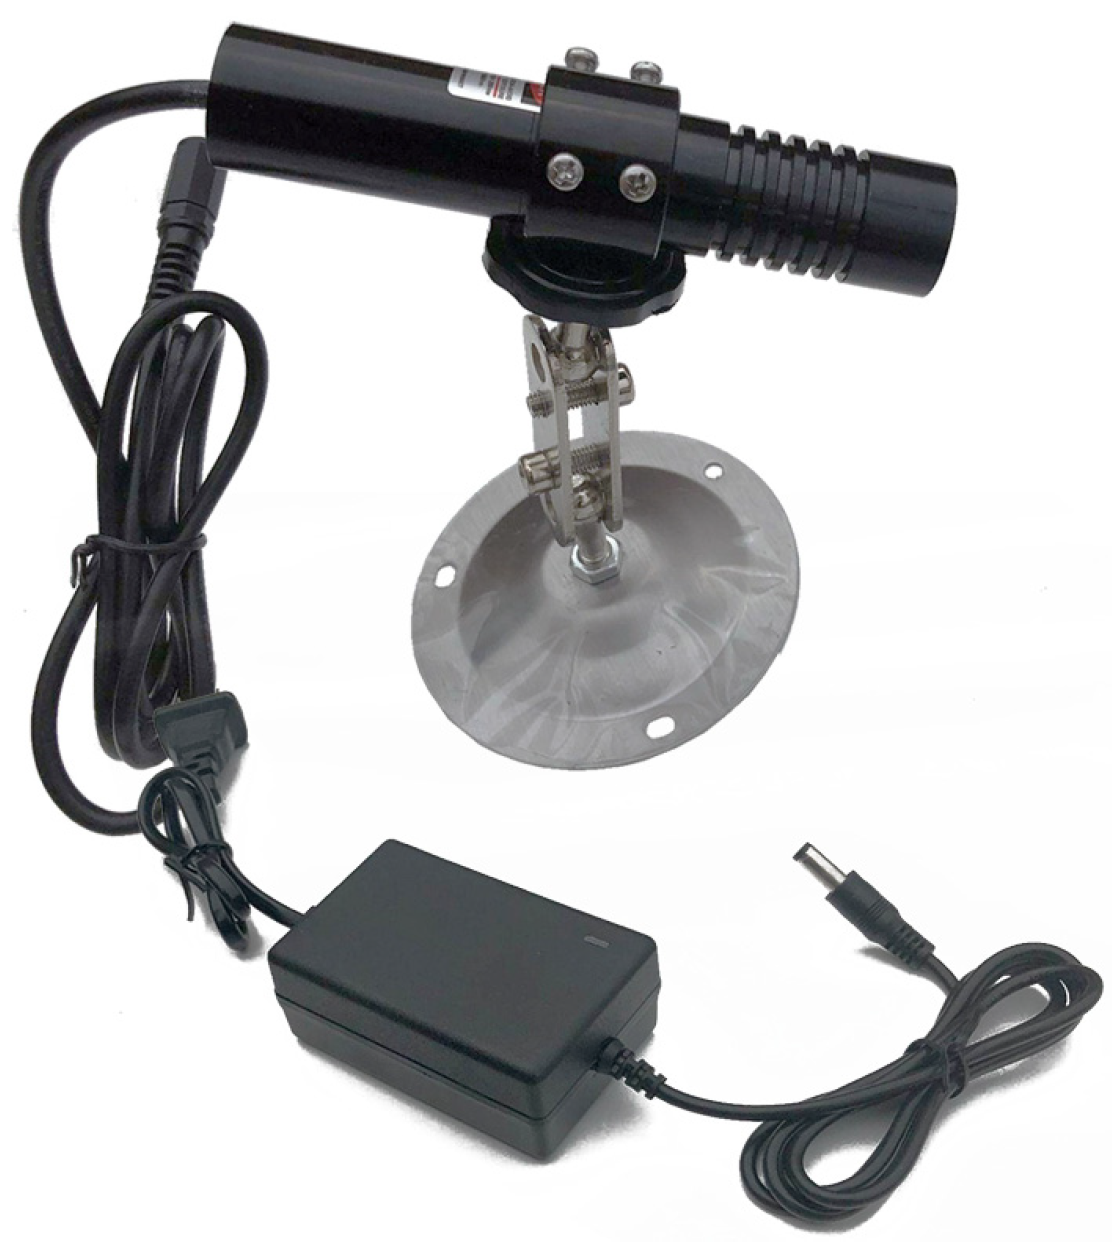
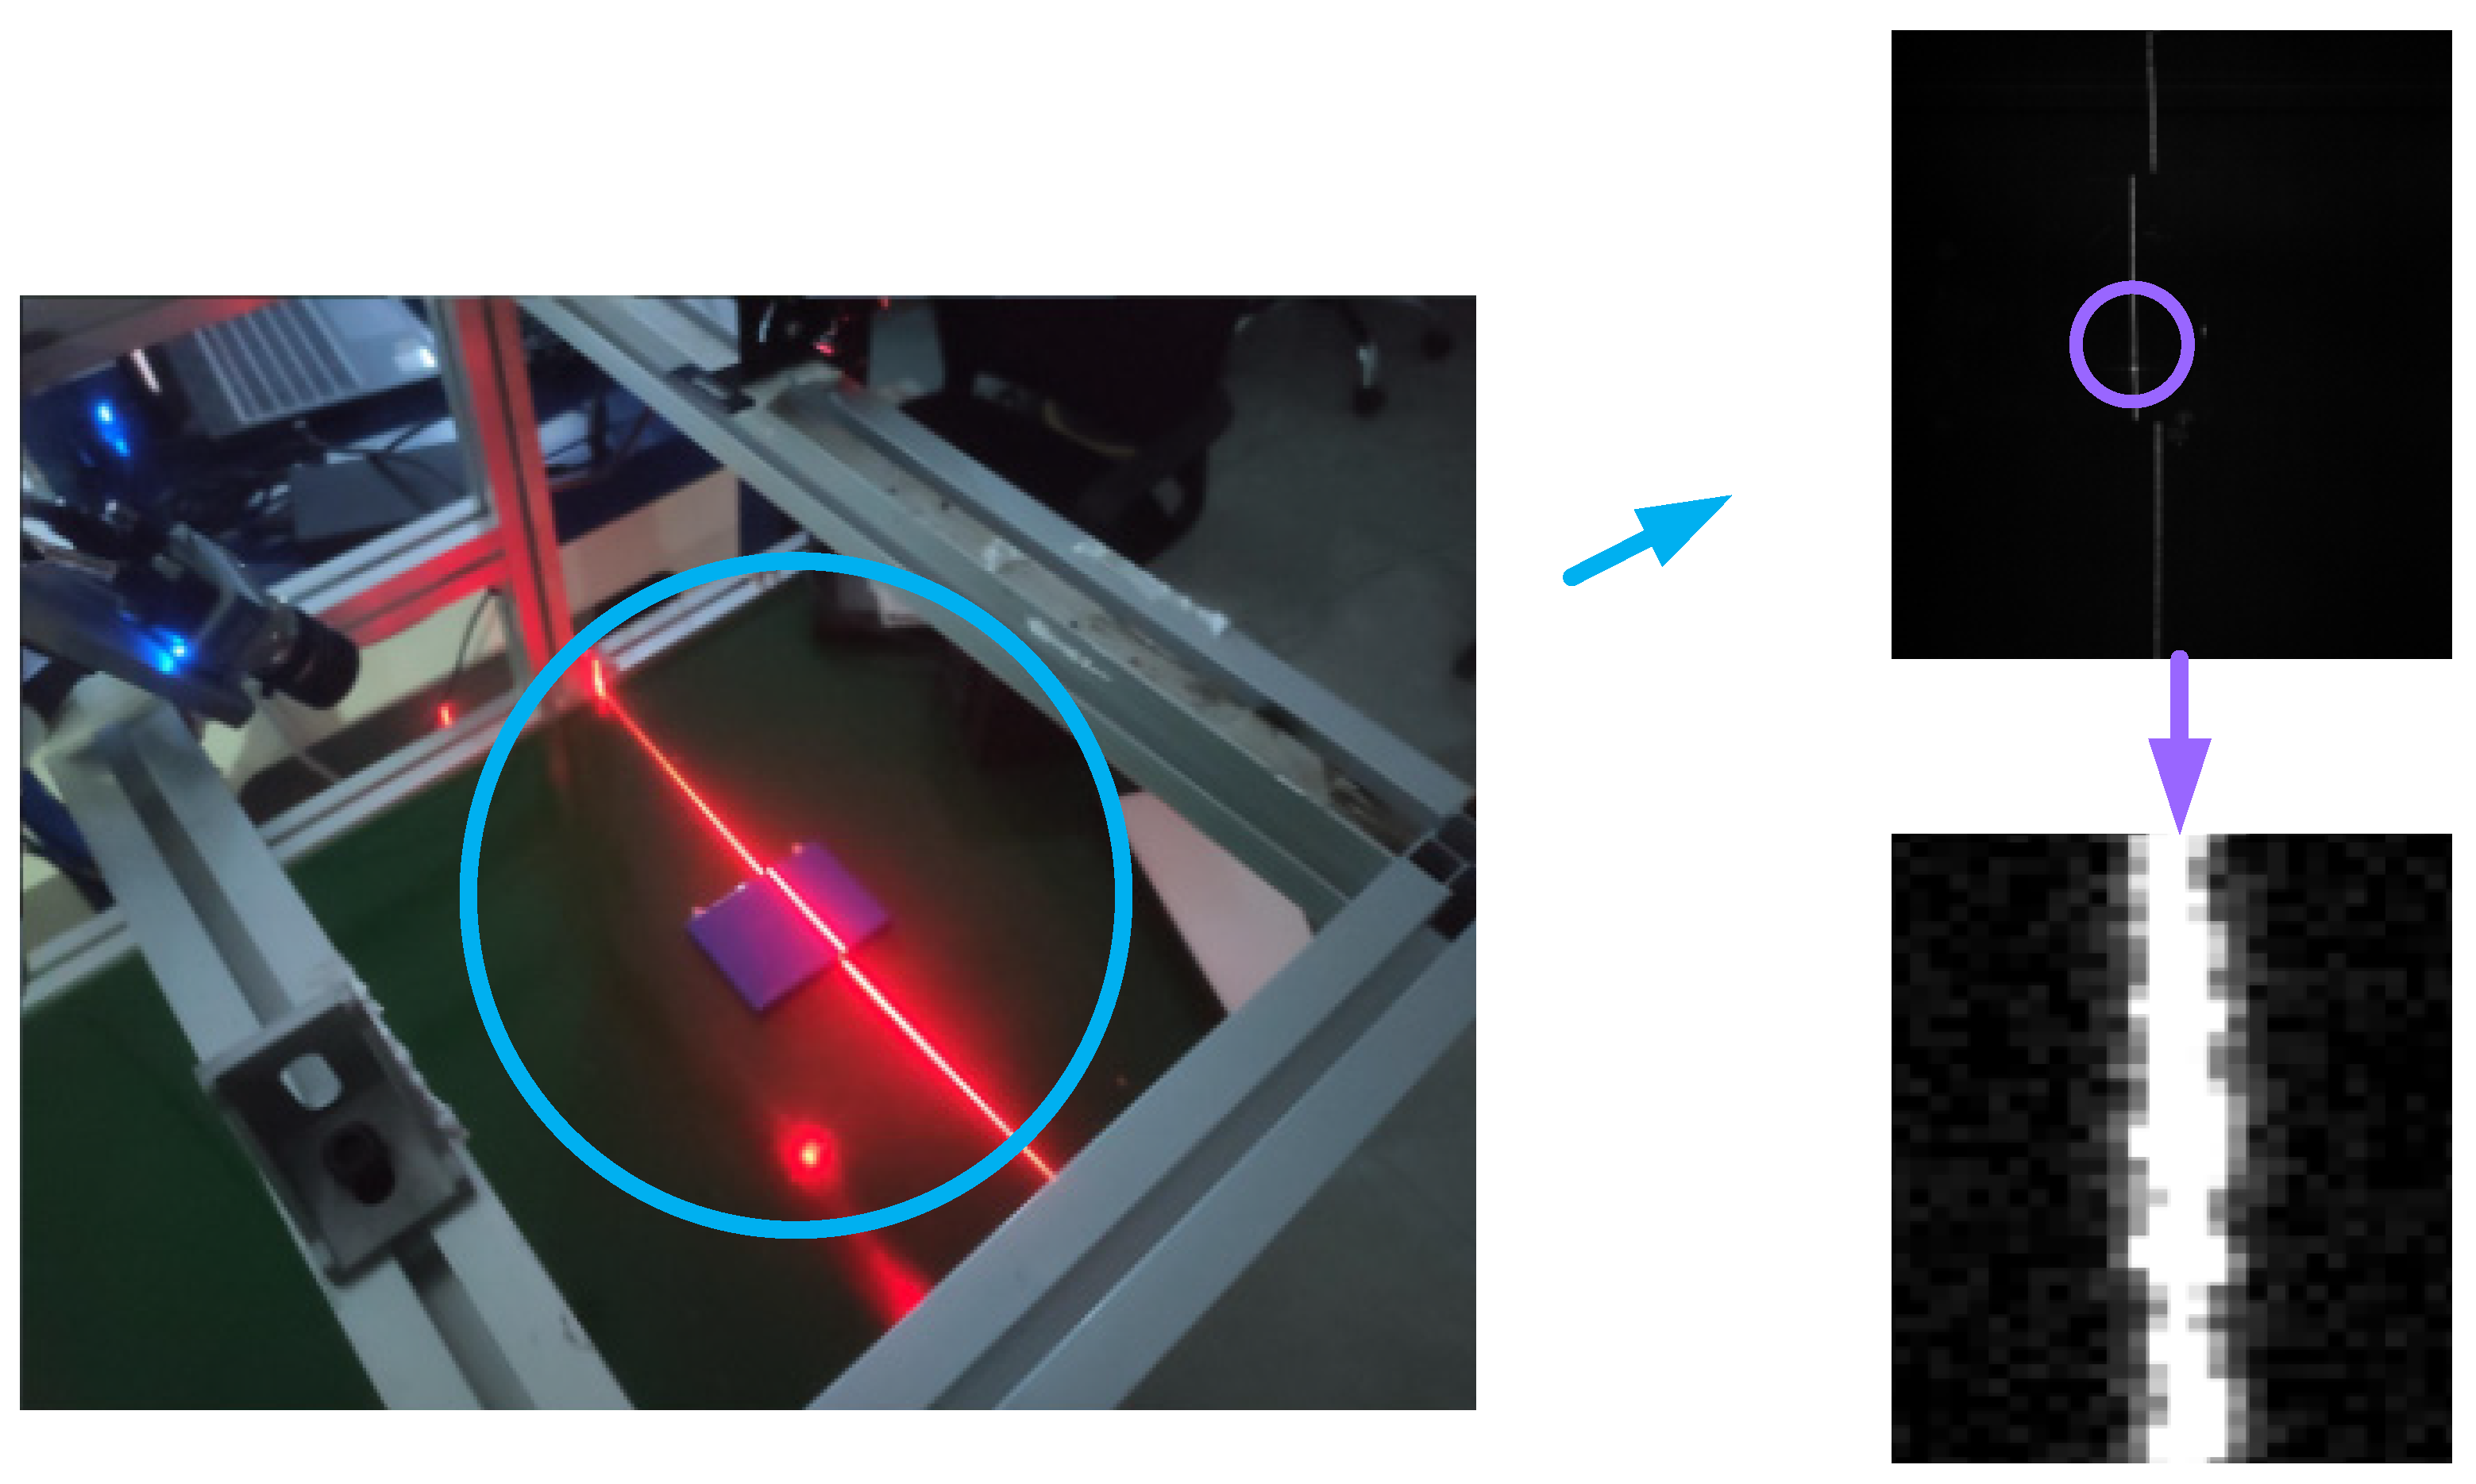
4.1. The Selection of the Camera, Line Laser, and Lithium Battery

The 3D reconstruction part of the lithium battery defect detection system is constructed by the laser triangulation method. The main hardware of this method requires an external camera in addition to the computer terminal. The following are mainly about the type selection of the camera and line laser, and the size introduction of the lithium battery.
The main acquisition target of the image acquisition system of the square lithium battery coating defect detection system is the laser line irradiated above the defect. The laser line and the lithium battery of the measured object have obvious contrast without color assistance. A camera with a black and white spectrum should be selected. The image acquisition system is a real-time online detection system with higher performance requirements for real-time transmission speed than general visual detection; the field of view only needs to meet all the information that needs to be extracted to contain the measured object. Therefore, the G3-GM12-M2590 area scan camera (Teledyne Dalsa, Billerica, MA, USA) as shown in Figure 10 can meet the requirements for the camera of this subject. The CMOS image sensor model is On-SemiPython5000P1 (Onsemi, Scottsdale, AZ, USA), the resolution is 2592 × 2048, and the image is realized by using the GigE Gigabit Ethernet interface (high-speed real-time transmission, pixel size 4.8 µm, black and white spectrum). The detailed parameters of the camera are shown in Table 1.
The line laser in the defect detection system of lithium battery is used as the key hardware equipment of the triangulation method. A high-power laser should be chosen as far as possible. The laser lines shining on the defects of lithium batteries should have high contrast, clarity, and a small line width for easy extraction of image acquisition equipment and processing of the computer terminal. Therefore, a one-word line laser YN-118c (Shenzhen Hongda Technology Laser Co., Ltd., Shenzhen, China) shown in Figure 11, is selected in this work; the laser power is 150 mw; the adjustable focal length wavelength is 650 nm; and the selected laser meets the basic experimental requirements. The specific laser parameters are shown in Table 2.
Finally, the ternary single lithium battery is selected with a size of 10 × 120 × 85 mm length and width, as shown in Figure 12.

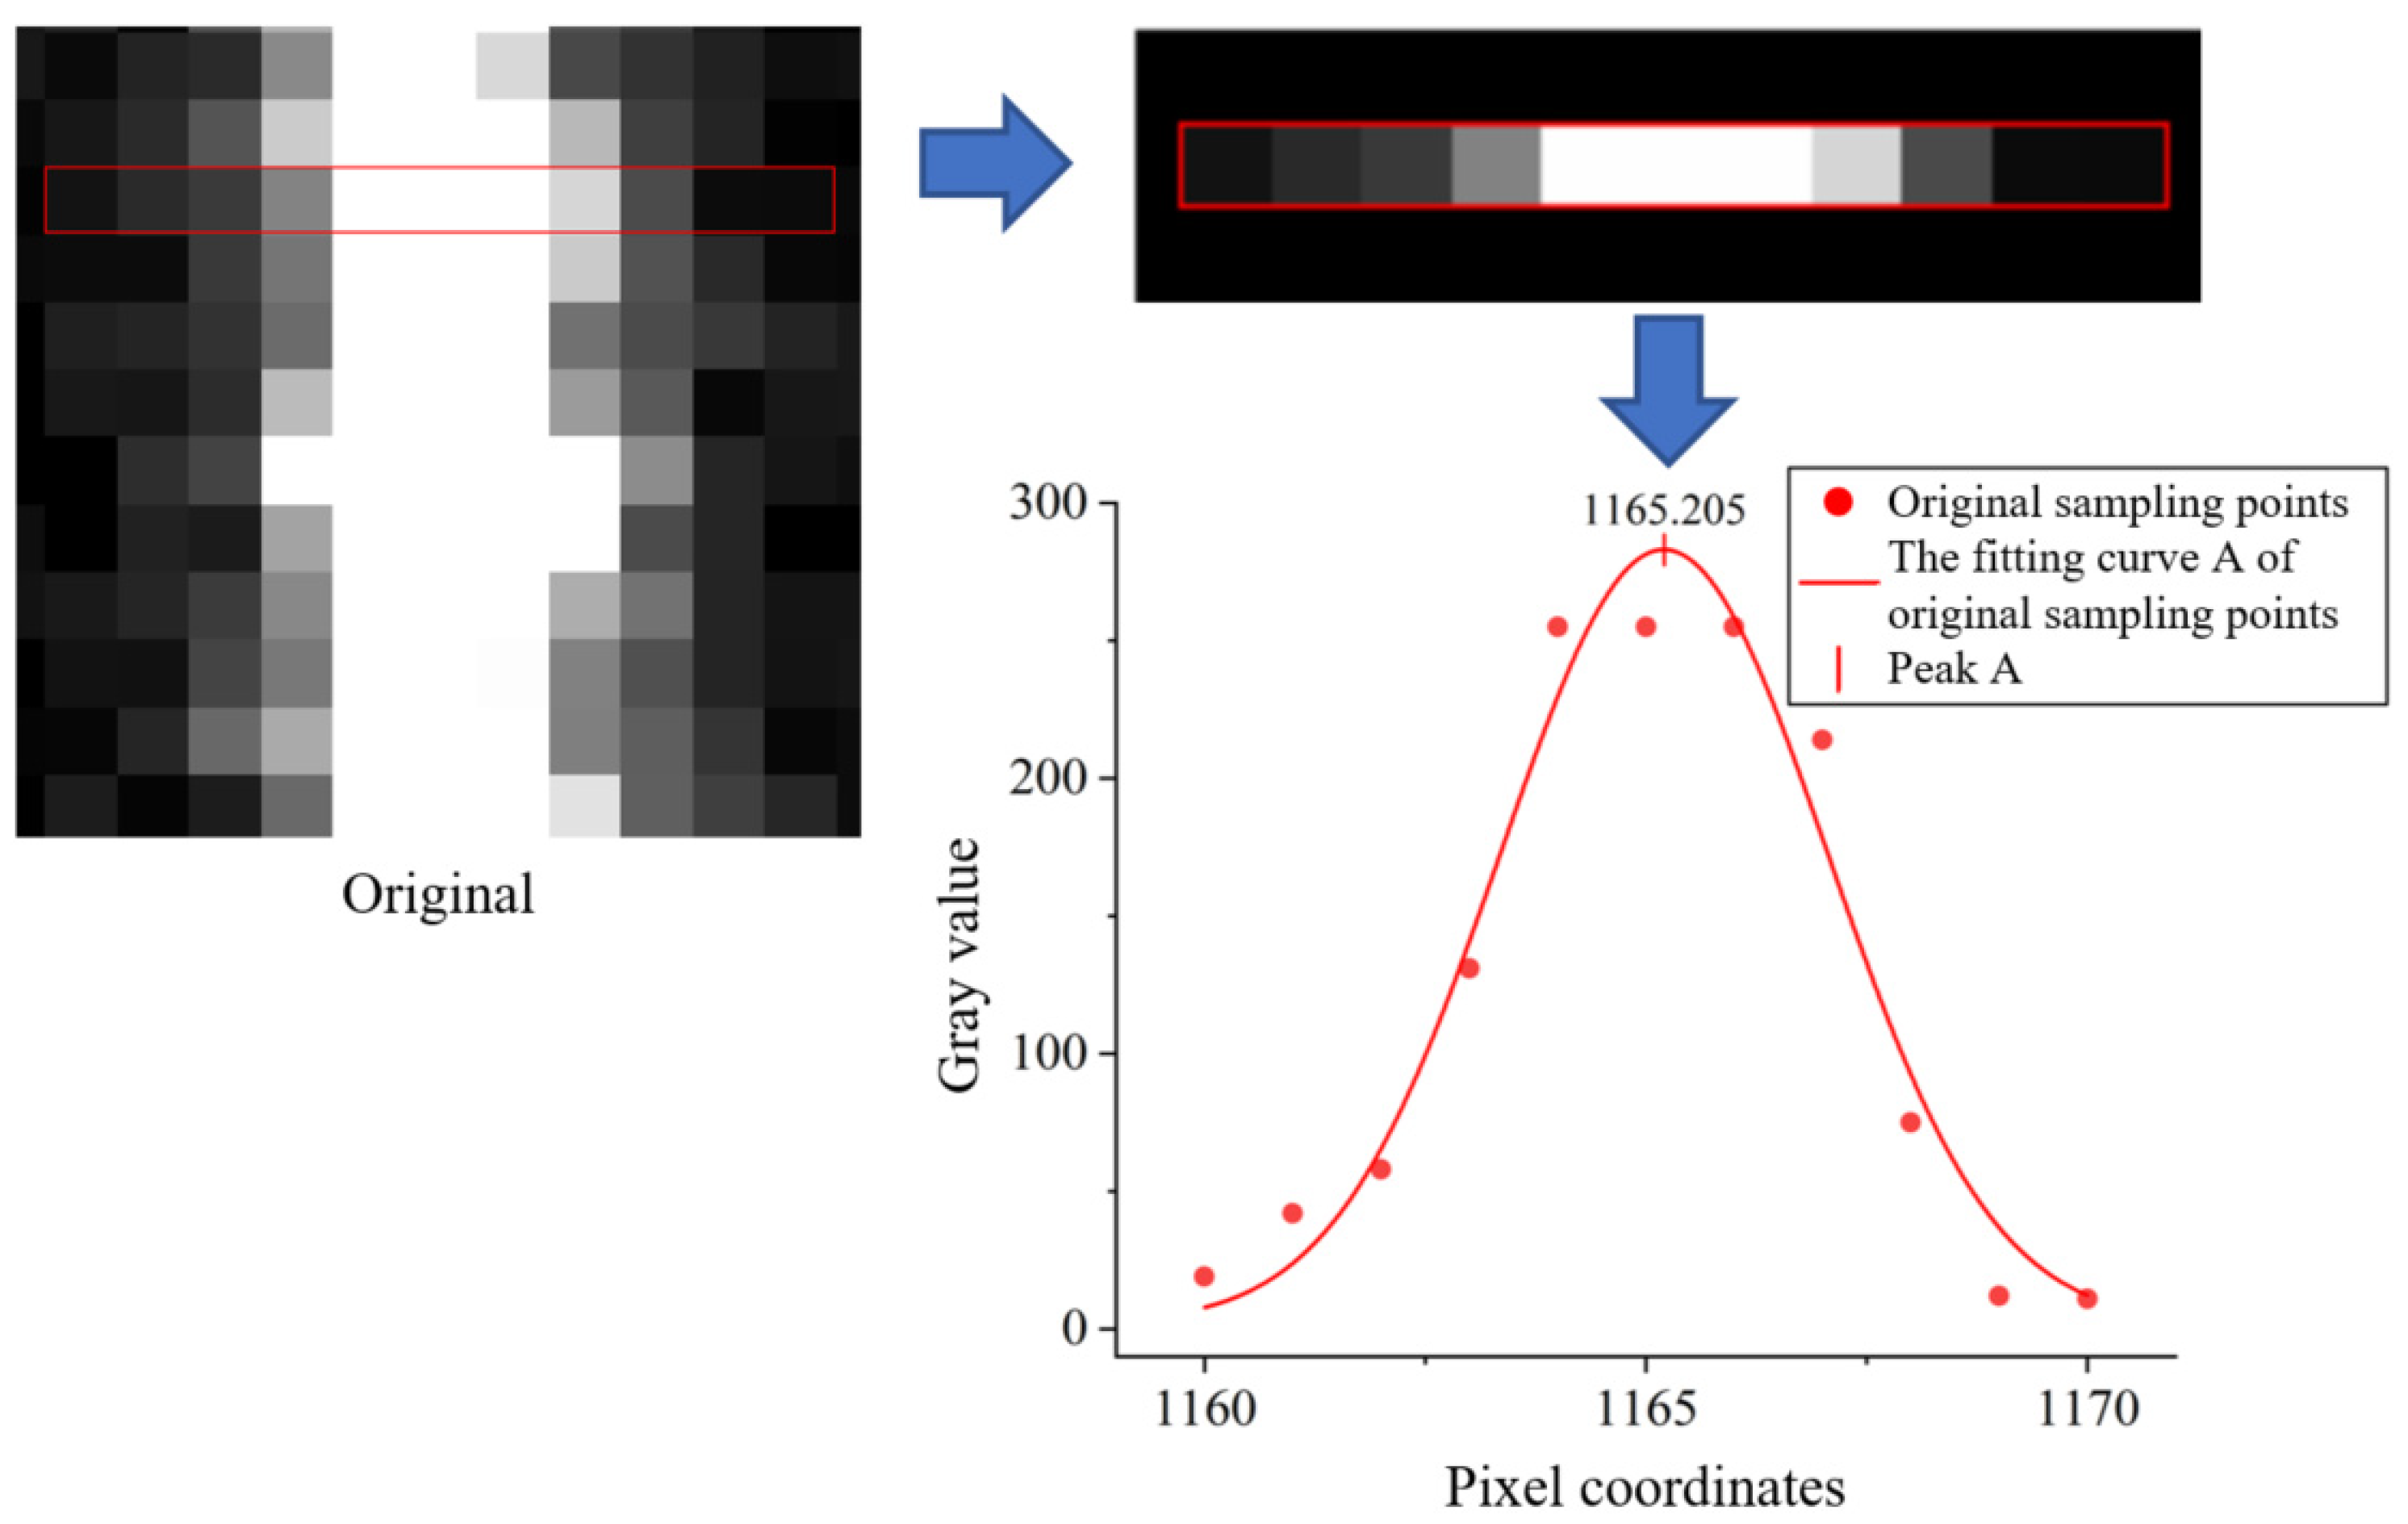
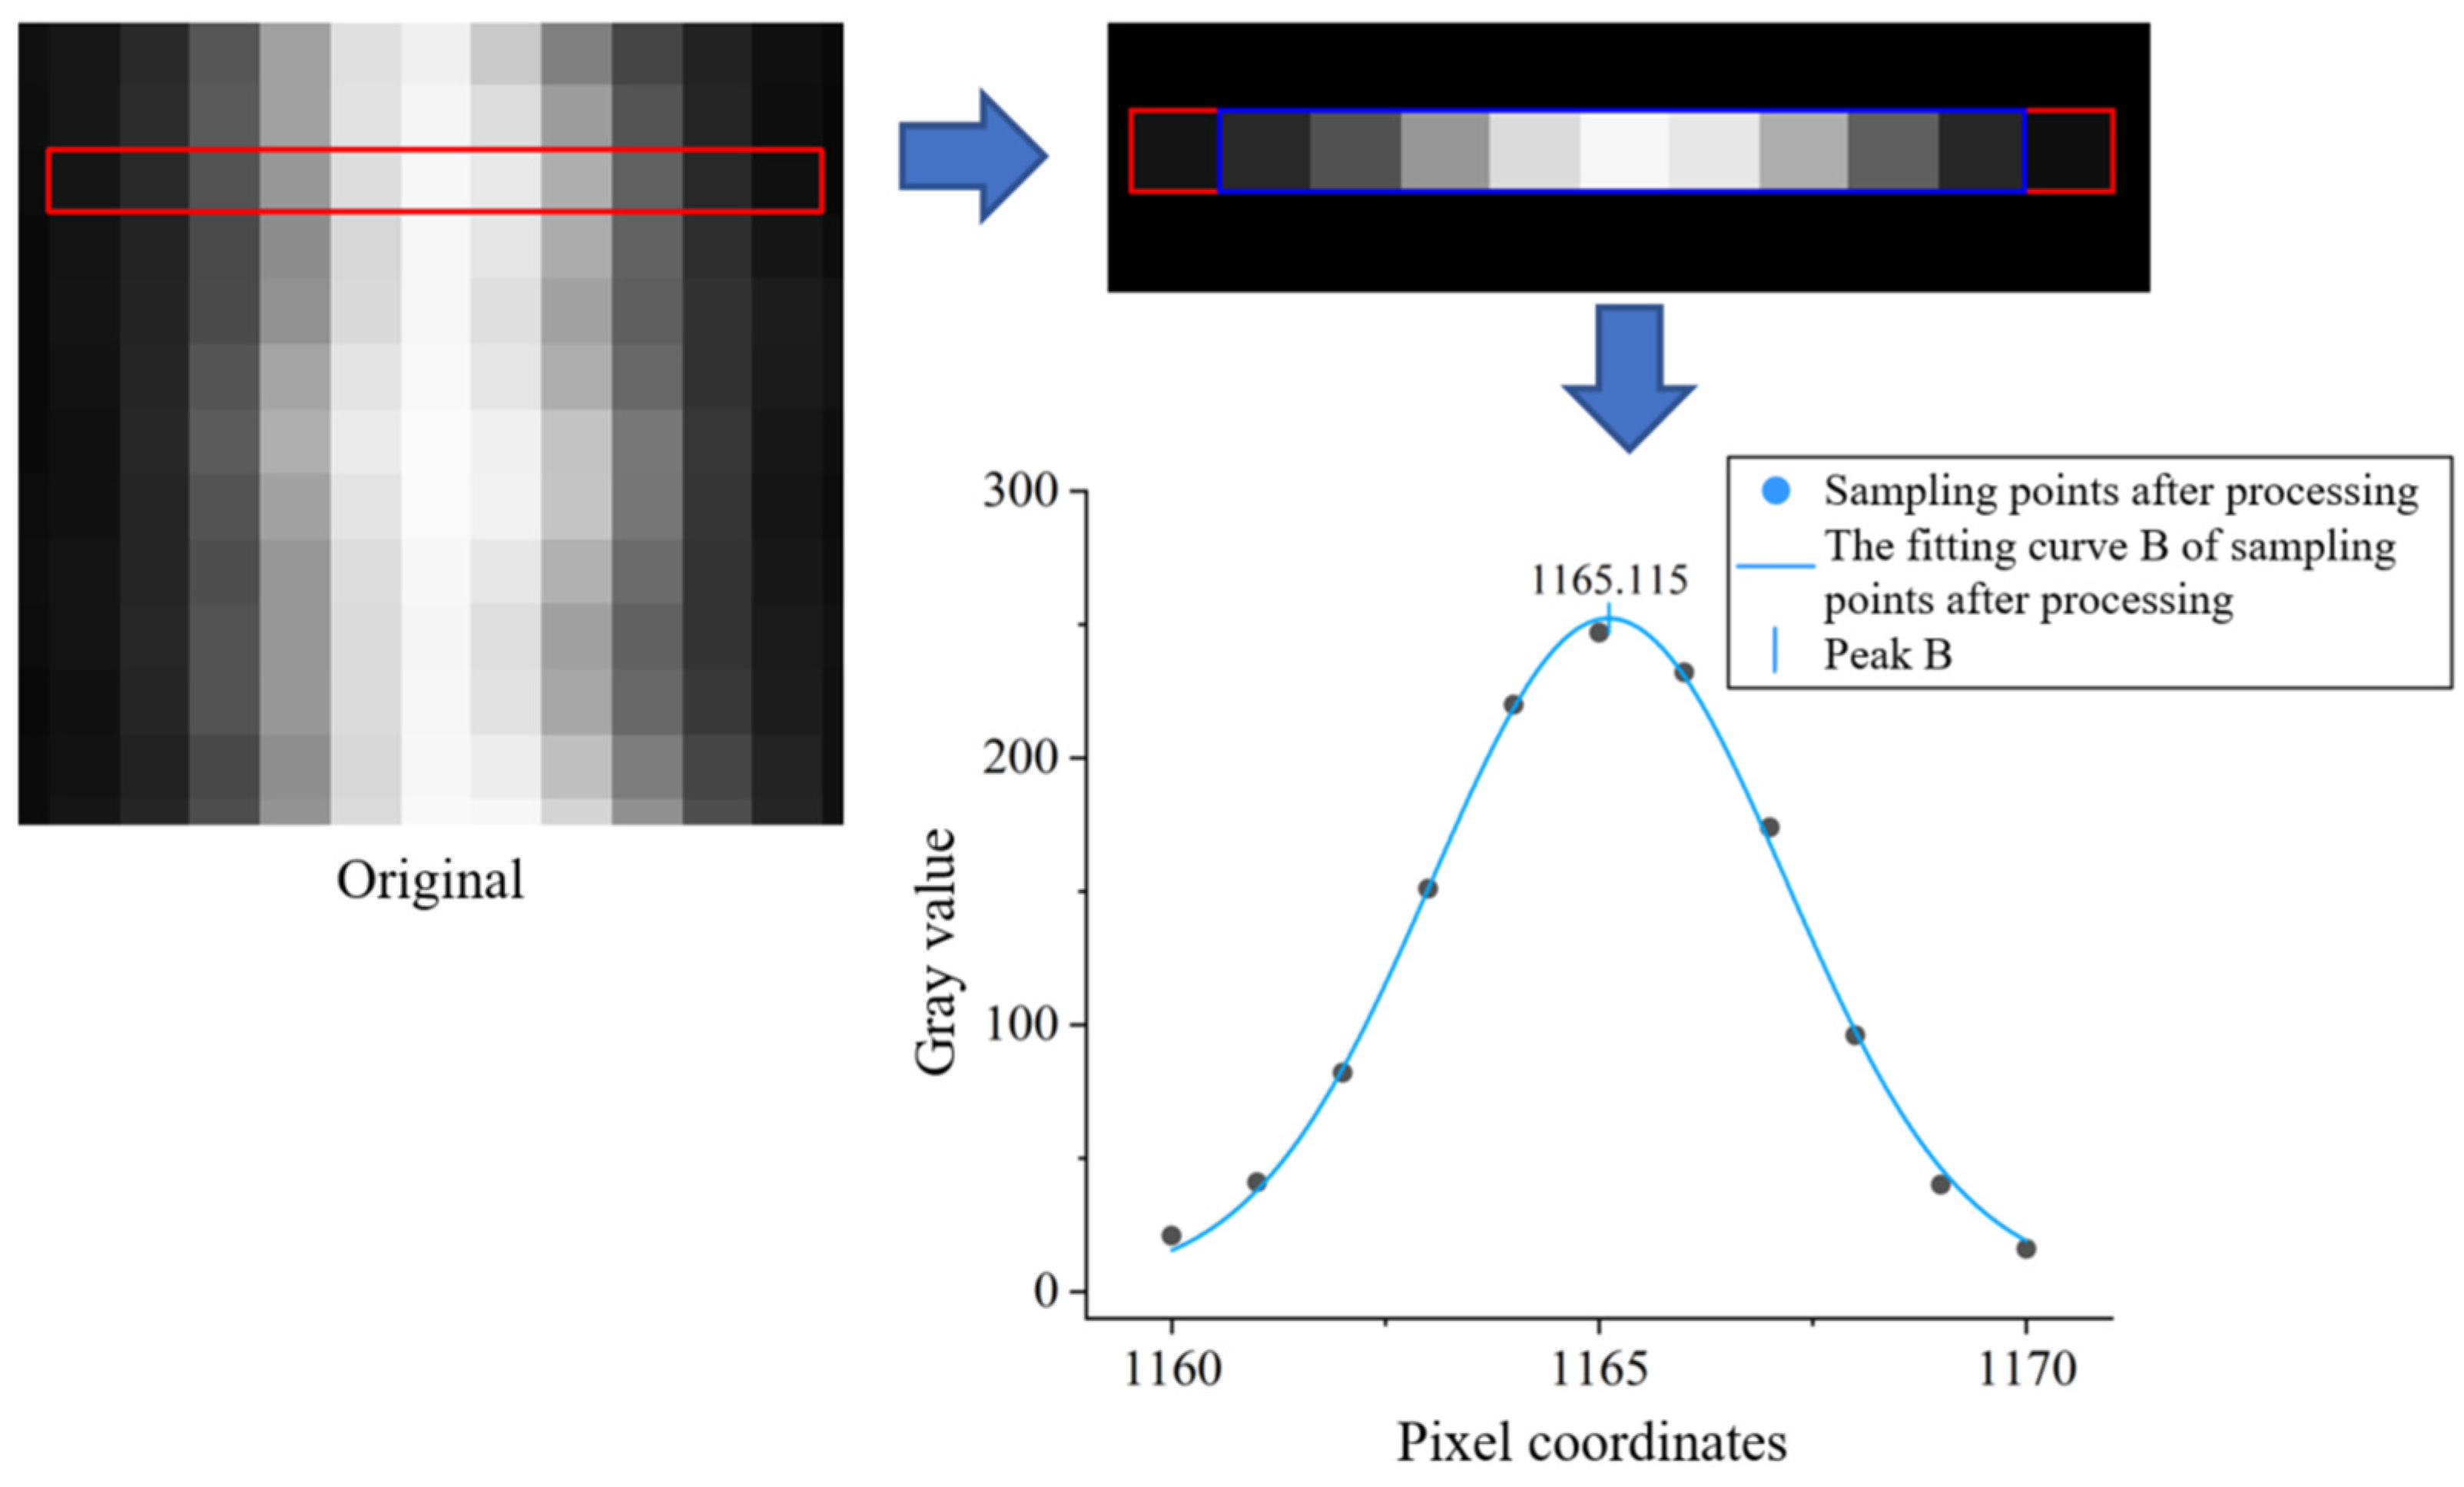
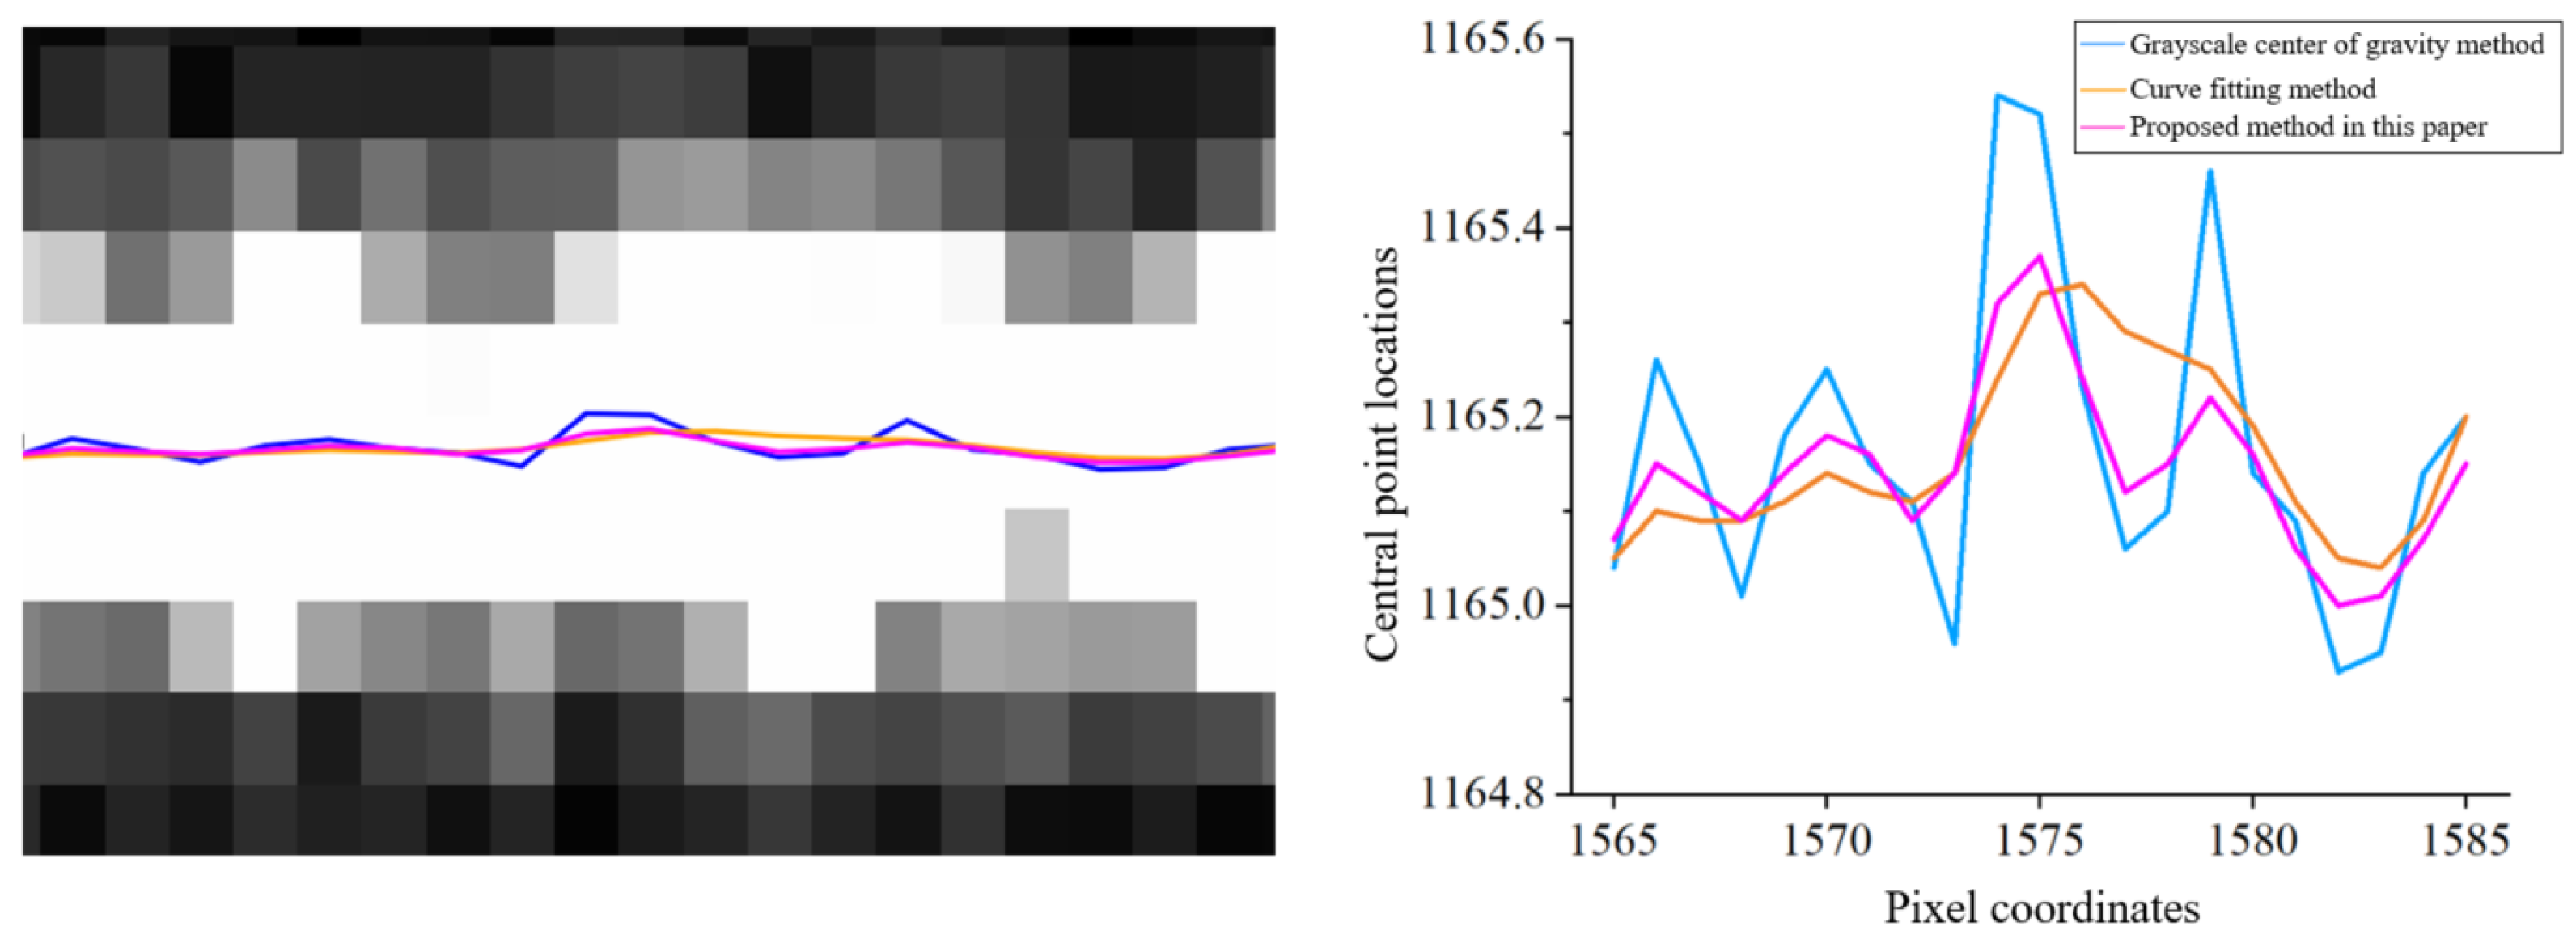
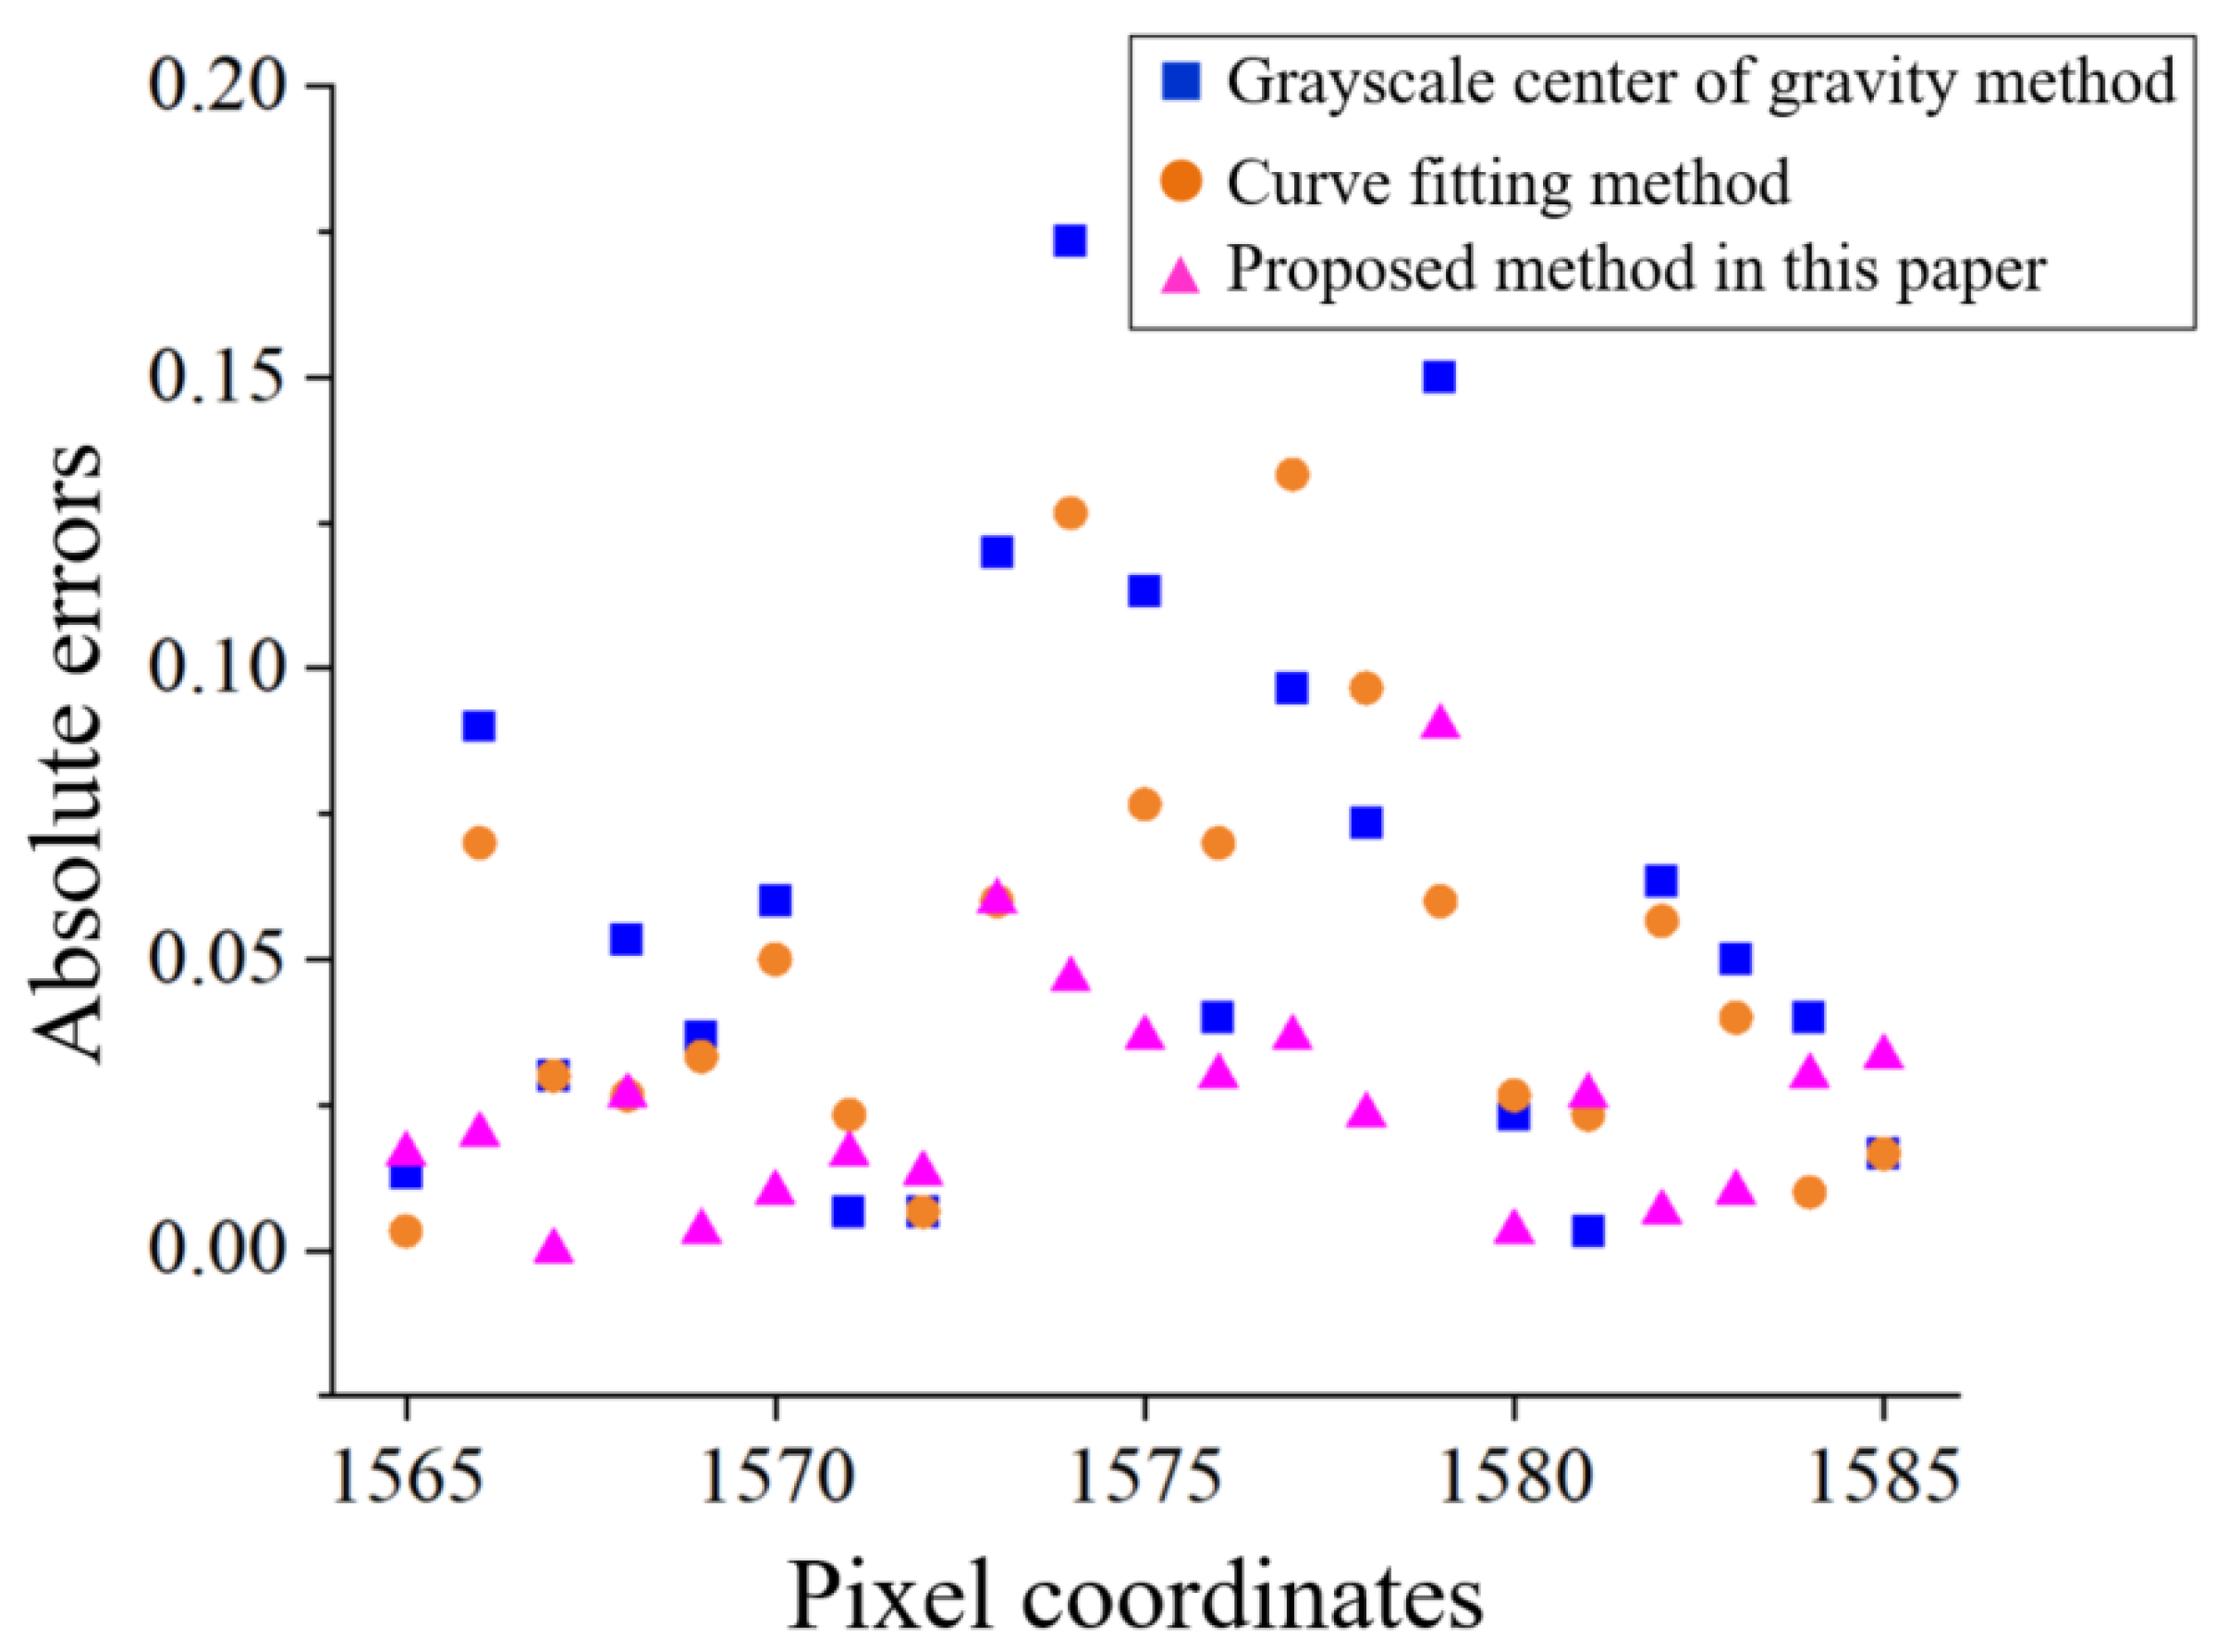
4.2. The Experimental Precision Analysis

As shown in Figure 13, the 3D reconstruction experimental platform was built based on the laser triangulation test in this work. The detection object is the red laser line on the surface of the lithium battery. The laser data is collected by a CMOS array industrial camera. The grayscale center of gravity method, curve fitting method, and the method proposed in this paper are used to extract the laser center line. Because the real coordinates in the center of the bar cannot be measured, the mean x^ of the three methods is used to estimate the truth. The sample data of laser lines and the result deviation of extraction methods are shown in Table 3, which represents the error analysis of 21 continuous cross-sections collected. Among them, the measurement value by the grayscale center of gravity method, the curve fitting method, and the method proposed in this paper is represented as x1, x2, and x3, respectively. The σi is the absolute value of the difference between the measured value xi and the estimated value x^, and the average absolute deviations MAE of each method are calculated, respectively.
The above three extraction methods are used to extract the center line of the laser fringe, respectively, to verify the accuracy of the proposed method in this work. The visualization results extracted by the methods are shown in Figure 14.
As can be seen from Figure 14, among the three methods in the experiment, the extraction effect of the method proposed in this paper is smoother than that of the grayscale center of gravity method, and can better reflect the gray characteristics than the curve fitting method. The absolute error values of sampling points extracted by the three methods are shown in Figure 15, and the MAE values of each method are calculated (Table 3). It can be seen that the average absolute deviation of the three methods after sorting was 0.060 pixels of the grayscale center of gravity method, 0.050 pixels of the curve fitting method, and 0.026 pixels of the proposed method in this work. The results show that the average absolute error of the improved laser line extraction method proposed in this paper was 2.3 times lower than that of the grayscale center of gravity method, and 1.9 times lower than that of the curve fitting method, which has the better extraction effect.
Since the real coordinates at the center of the laser beam cannot be measured, the average x^ of the three methods is used as the estimated true value. Residual refers to the difference between the measured value and the regression value, which is used to replace the true error in the experiment to verify and analyze the experimental accuracy. We used the Bessel standard deviation σ to evaluate the standard error of the method:
σ = i = 1 n v i 2 n 1
where vi represents the residual, xi is the measured value, x^ indicates the regression value, and n is the amount of data collected, i.e., vi = xix^ (i = 1, 2, 3). The residual data obtained from the three kinds of data are put into the Bessel formula to obtain the standard errors of extracting the center line by the three methods, so as to judge the accuracy level. The calculation results are shown in Table 4.
As can be seen from the standard errors of the three centerline extraction methods in the table above, the accuracy of the proposed method can reach 0.005 pixels, and the accuracy of laser line extraction is higher than that of the grayscale center of gravity method and the curve fitting method. In other words, the method proposed in this work is better than the grayscale center of gravity method and the curve fitting method.

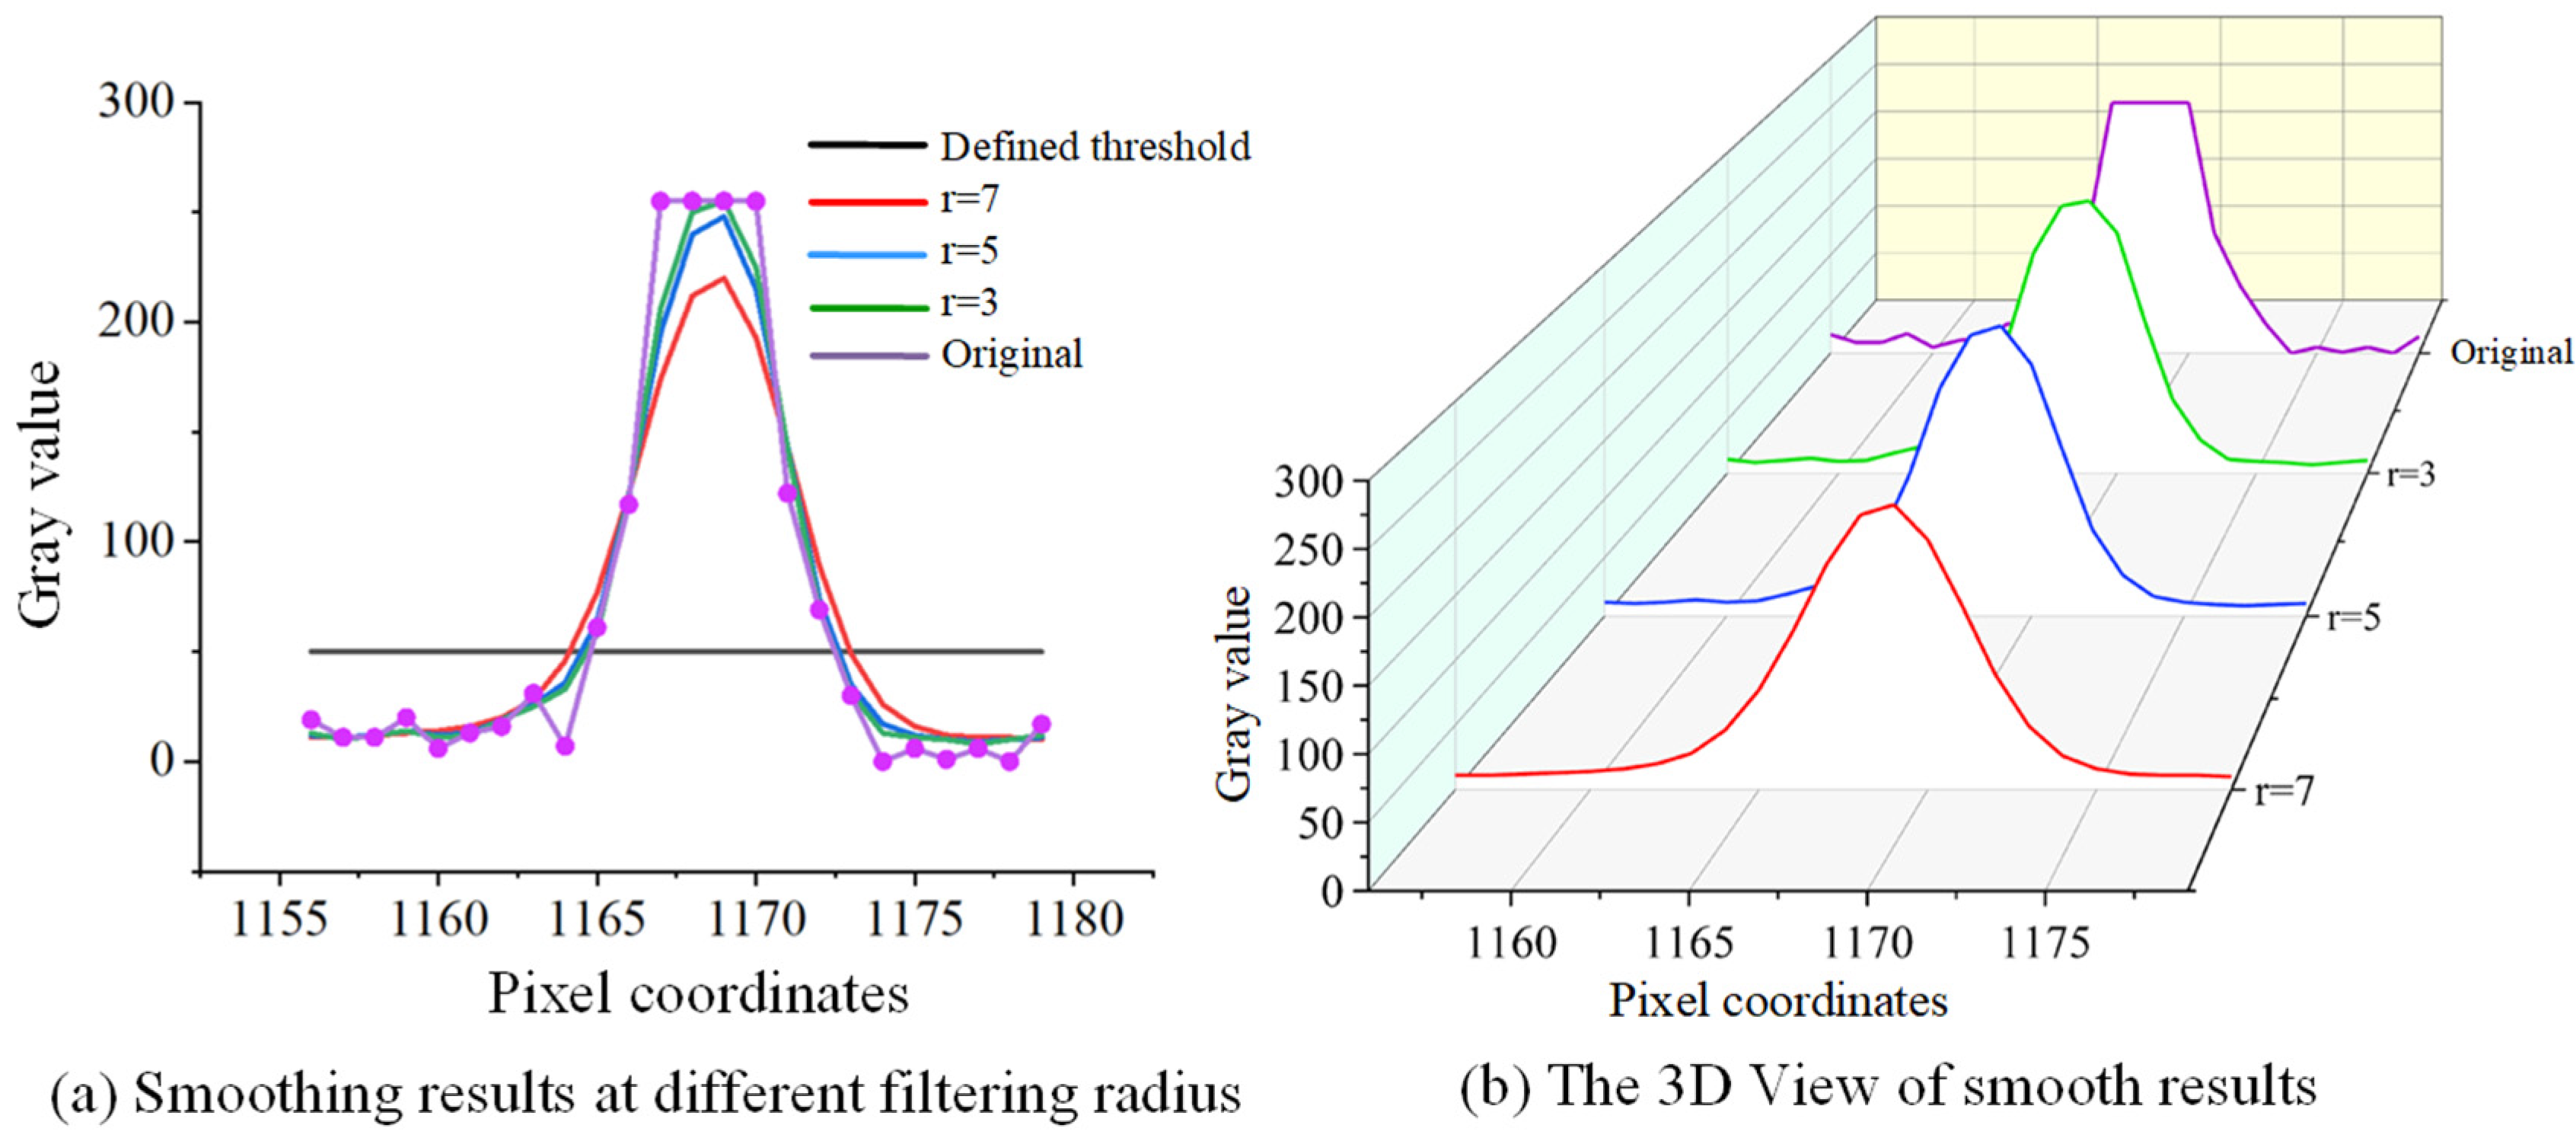
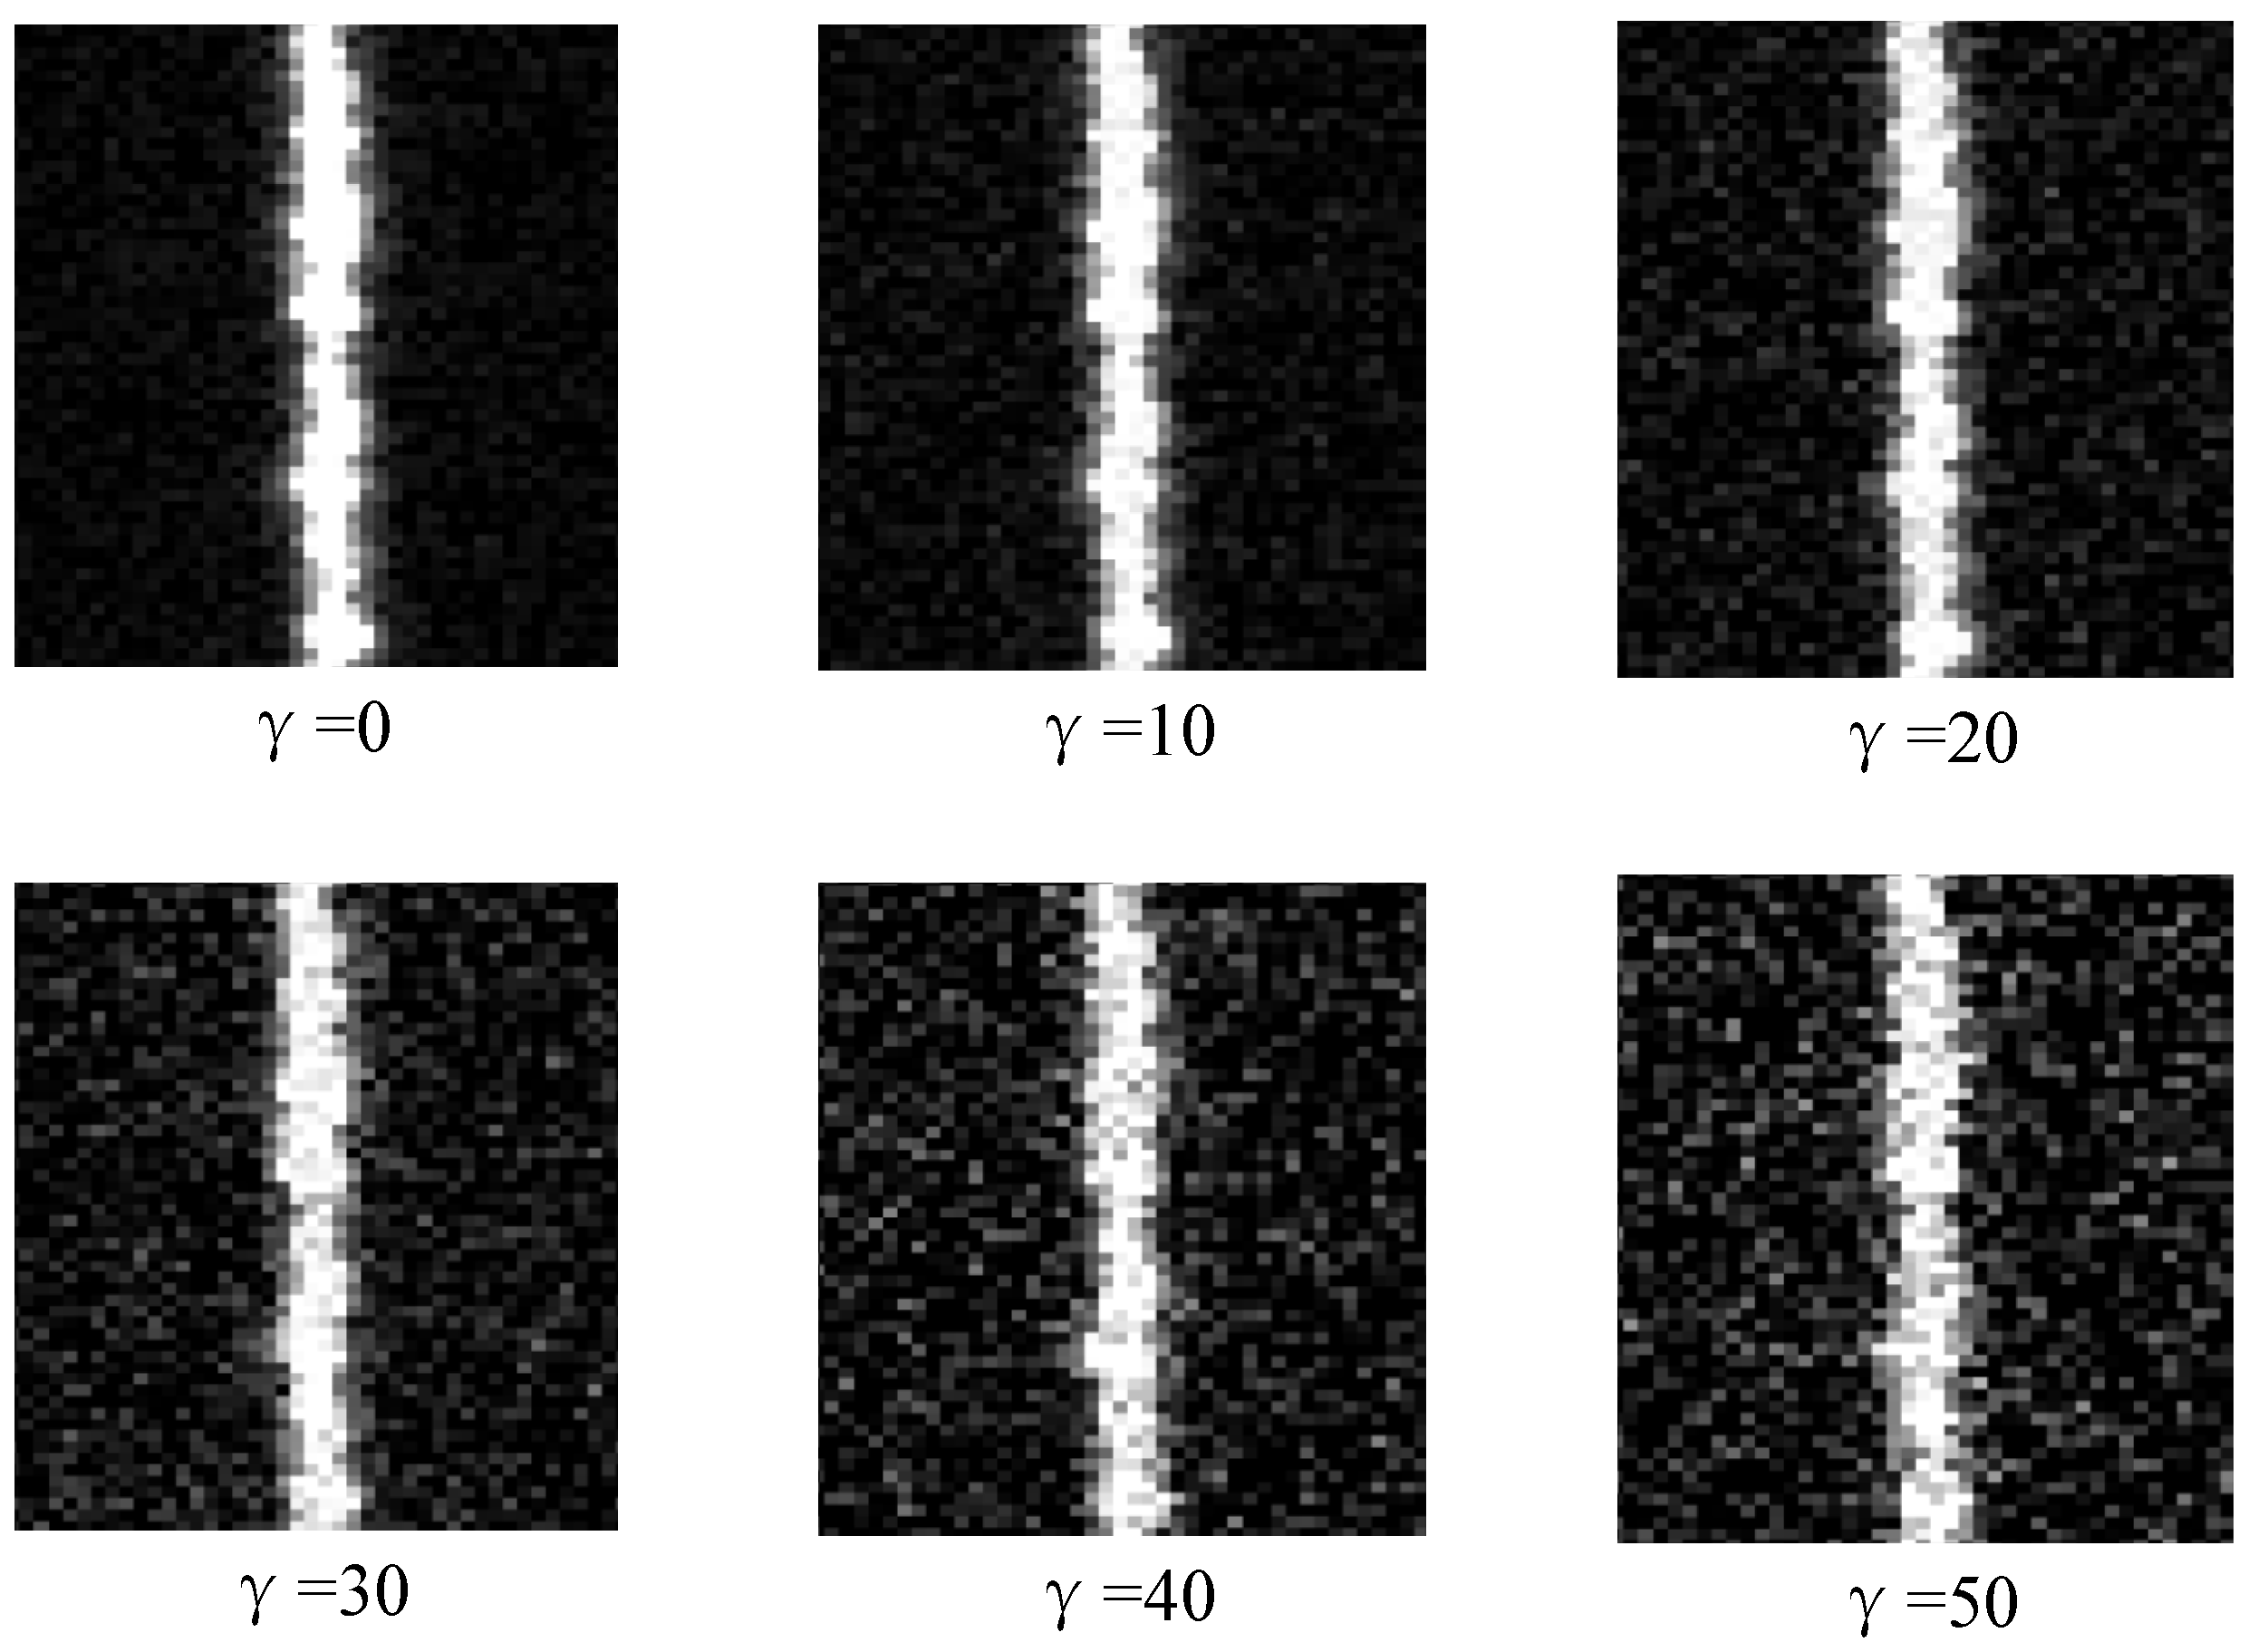
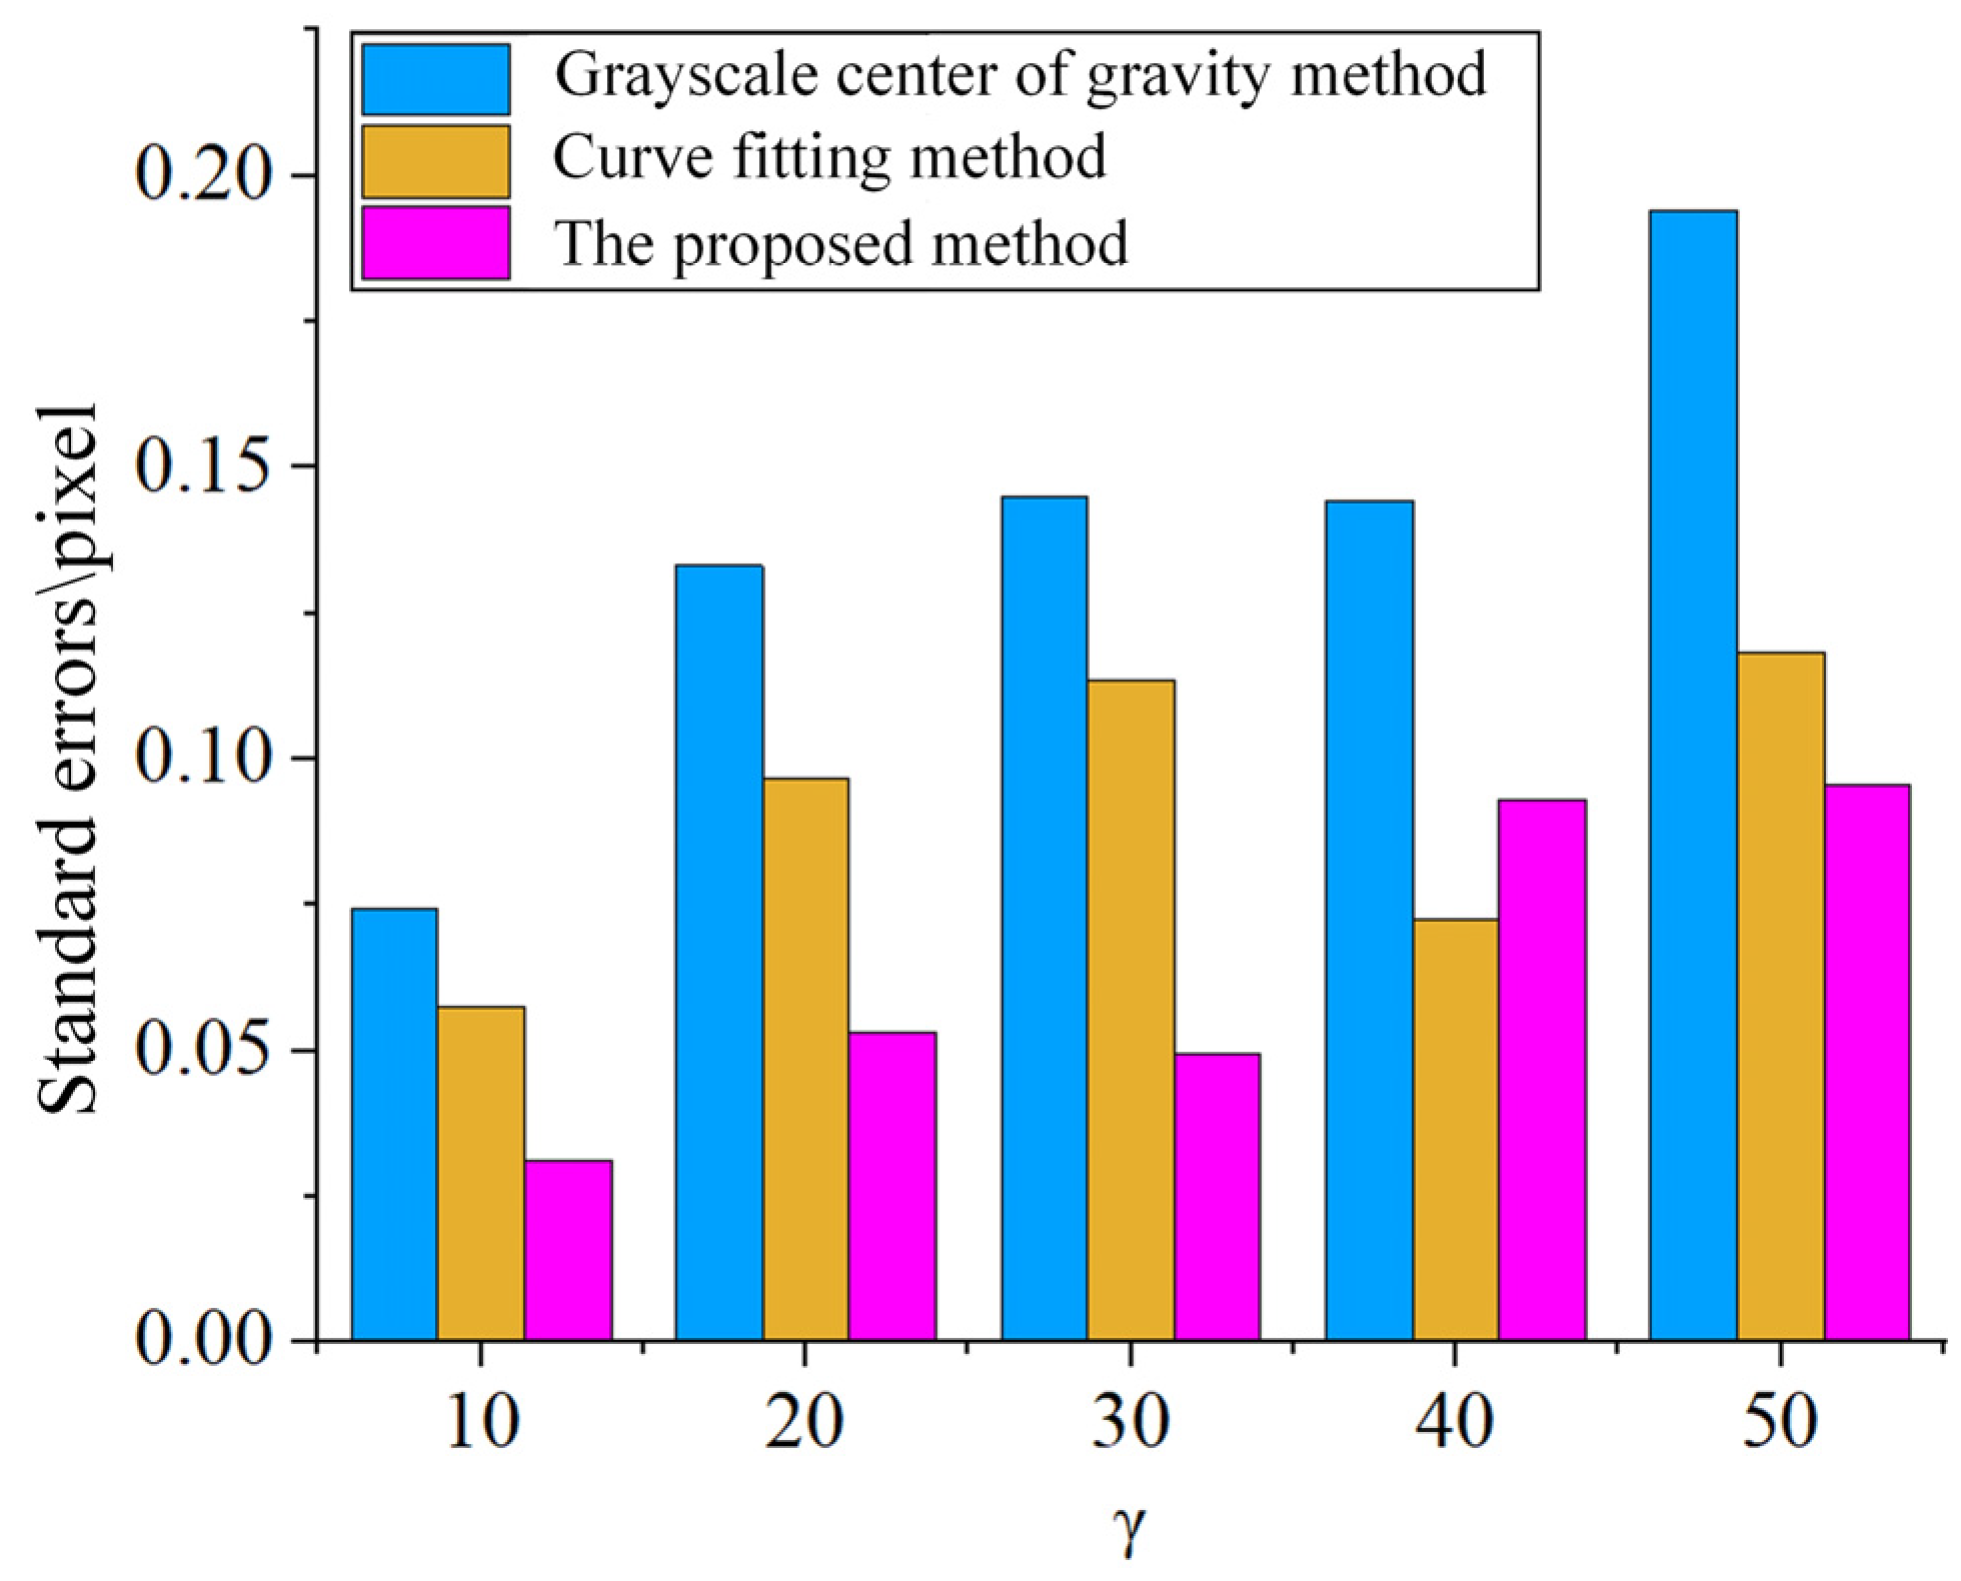
4.3. The Noise Resistance Analysis

Noise resistance refers to the anti-interference ability of image processing methods in different interference environments, and whether excellent processing methods can still show superior effects under interference environments is related to the robustness evaluation results of the system. In order to verify the anti-noise performance of the proposed method, Gaussian noise distribution γ in the range of 10~50 is added to the original image to simulate the interference scene, and the image containing Gaussian noise is carried out in the above experiment. The results of adding different γ are shown in Figure 16.
The grayscale center of gravity method compares the actual effect of the image containing Gaussian noise, the curve fitting method, and the method proposed in this paper. Figure 17 is the partial enlargement of the laser center line extracted by the above method, where γ was 50.
It can be seen that lines extracted by the grayscale center of gravity method fluctuated more, while those extracted by the curve fitting method and the method proposed in this work were less affected. The reason for this result is that the Gaussian noise changes the gray value near the laser line, and the grayscale center of gravity method is most affected by the gray value, so the fluctuation is more obvious. In order to quantify the evaluation indicators, the standard deviation mentioned above was used for comparison; the extraction results are shown in Figure 18.
According to Figure 18, the improved grayscale center of gravity method has higher noise resistance and lower sensitivity to the image gray value noise compared with the traditional grayscale center of gravity method. At the same time, the accuracy is higher than that of the curve fitting method, because the curve of the curve fitting method is too smooth to show the characteristics reflected by the gray value. To sum up, the method proposed in this paper not only reflects the characteristics of gray changes but also has relatively smooth curves with higher accuracy and noise resistance. Therefore, the method proposed in this paper has strong robustness, good noise resistance, and higher precision.

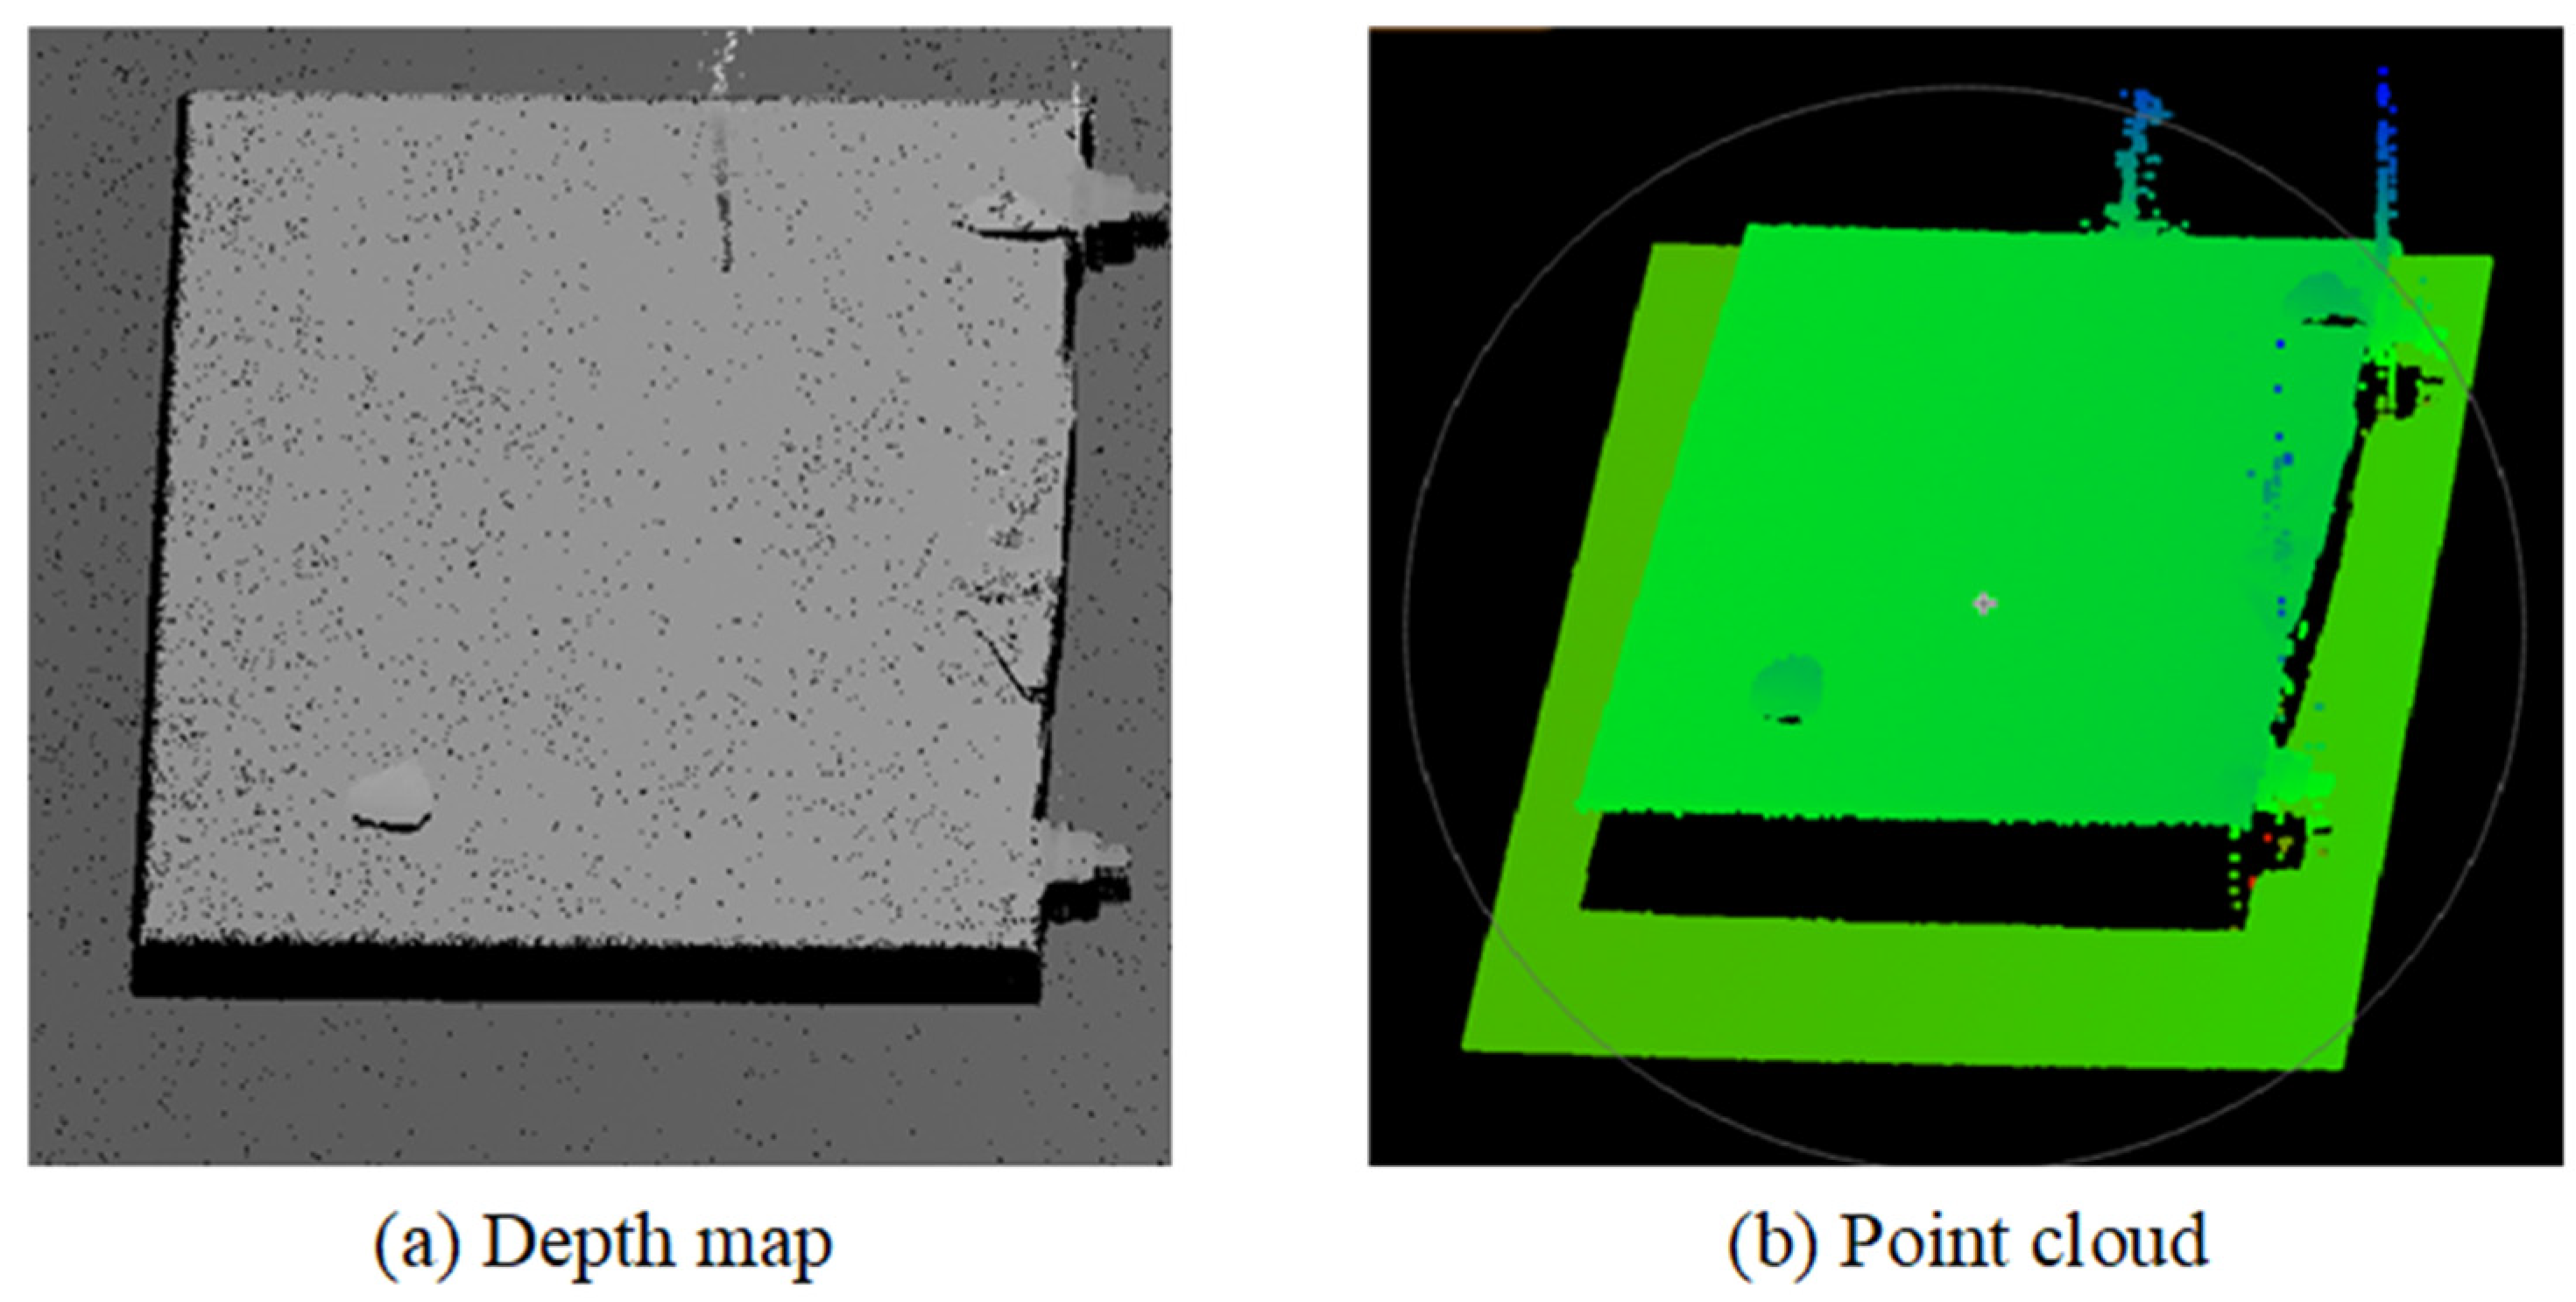
4.4. The 3D Reconstruction Result

The depth image and visualization image of the 3D model point cloud map are obtained in Figure 19 by using the triangulation shown in Figure 2 and the improved grayscale center of gravity method shown in Figure 9. The acquisition of the 3D model is convenient for subsequent extraction and analysis of defects on the 3D model of lithium battery surface. The improved centerline extraction method proposed in this paper greatly improves the accuracy of 3D point cloud data acquisition, which can more truly and accurately reflect the real state of the surface model of the measured object.

5. Conclusions and Future Works

The 3D scanning system is the most important part of the square lithium battery surface defect detection system. The target images are acquired through the image acquisition device in this system. After pretreatment, feature point extraction, using the system parameter coordinate conversion and other operational steps, get the 3D point coordinates and then complete the 3D reconstruction. The target process parameters are obtained by the camera calibration method, and the laser line extraction method is improved in the 3D reconstruction process based on the grayscale center of gravity method. The extraction accuracy and noise resistance of laser centerline extraction are improved.
Experimental results show that the average absolute error of the improved laser line extraction method proposed in this paper is 0.026 pixels, which is 2.3 times lower than the gray center of gravity method, 1.9 times lower than the curve fitting method, and the standard error can reach 0.005 pixels. Compared with the gray center of gravity method and the curve fitting method, the influence of gray value change on the center line extraction is more fully considered, and the center of light strip can be extracted more accurately. It can achieve sub-pixel accuracy, construct the 3D reconstruction model more accurately, and provide a data basis for the subsequent use of the model to calculate defects.
In future works, the defects in the detection object and the experimental equipment will be perfected. Because the point cloud is filtered according to the height of the plane, the smaller surface of the object may have limitations. So, the relationship between the point cloud data will be used to identify the defects, and the 2D plane vision will be combined to perfect the square lithium battery surface defect detection system.

Author Contributions

Conceptualization, R.Y. and B.W.; methodology, D.H. and L.W.; validation, H.L.; formal analysis, X.L.; data curation, M.H.; writing—original draft preparation, D.H. and B.W.; writing—review and editing, H.L.; funding acquisition, X.L. and D.H. All authors have read and agreed to the published version of the manuscript.

Funding

The support of the Lianyungang 521 High-level Talent Training Project (LYG06521202203), Qing Lan project for the excellent teaching team of Jiangsu province (2022), National Natural Science Foundation of China (51975568), the Natural Science Foundation of Jiangsu Province under Grant (BK20191341), the Independent Innovation Project of “Double-First Class” Construction of China University of Mining and Technology (2022ZZCX06), and Postgraduate Research and Practice Innovation Program of Jiangsu Province (KYCX23_2681) in carrying out this research are gratefully acknowledged.

Institutional Review Board Statement

Not applicable.

Informed Consent Statement

Not applicable.

Data Availability Statement

All the data that produce the results in this work can be requested from the corresponding author.

Conflicts of Interest

The authors declare that there are no conflict of interest regarding the publication of this article.

References

  1. Lang, X.L.; Zhang, Y.; Shu, S.B.; Liang, H.J.; Zhang, Y.Z. Lithium battery surface defect detection based on the YOLOv3 detection algorithm. In Proceedings of the 10th International Symposium on Precision Mechanical Measurements, Qingdao, China, 15–17 October 2021. [Google Scholar]
  2. Ni, J.Y.; Wu, Y.L.; Xu, J.N.; Liu, Y. RD-GRF for Automatic Classification of Surface Defects of Lithium-ion Battery Electrodes. In Proceedings of the 40th Chinese Control Conference (CCC), Shanghai, China, 26–28 July 2021; pp. 7395–7399. [Google Scholar]
  3. Chen, Y.G.; Shu, Y.F.; Li, X.M.A.; Xiong, C.W.; Cao, S.Y.; Wen, X.Y.; Xie, Z.C. Research on detection algorithm of lithium battery surface defects based on embedded machine vision. J. Intell. Fuzzy Syst. 2021, 41, 4327–4335. [Google Scholar] [CrossRef]
  4. Ma, L.Y.; Xie, W.; Zhang, Y. Blister Defect Detection Based on Convolutional Neural Network for Polymer Lithium-Ion Battery. Appl. Sci. 2019, 9, 1085. [Google Scholar] [CrossRef]
  5. Dandage, H.K.; Lin, K.M.; Lin, H.H.; Chen, Y.J.; Tseng, K.S. Surface defect detection of cylindrical lithium-ion battery by multiscale image augmentation and classification. Int. J. Mod. Phys. B 2021, 35, 2140011. [Google Scholar] [CrossRef]
  6. Wu, K.; Tan, J.; Liu, C.B. Cross-Domain Few-Shot Learning Approach for Lithium-Ion Battery Surface Defects Classification Using an Improved Siamese Network. IEEE Sens. J. 2022, 22, 11847–11856. [Google Scholar] [CrossRef]
  7. Liu, X.H.; Wu, L.Q.; Guo, X.Q.; Andriukaitis, D.; Krolczyk, G.; Li, Z.X. A novel approach for surface defect detection of lithium battery based on improved K-nearest neighbor and Euclidean clustering segmentation. Int. J. Adv. Manuf. Technol. 2023, 127, 971–985. [Google Scholar] [CrossRef]
  8. Zhao, L.M.; Ouyang, Q.; Chen, D.F.; Wen, L.Y. Surface defects inspection method in hot slab continuous casting process. Ironmak. Steelmak. 2011, 38, 464–470. [Google Scholar] [CrossRef]
  9. Arciniegas, J.R.; Gonzalez, A.L.; Quintero, L.A.; Contreras, C.R.; Meneses, J.E. Three-dimensional shape measurement system applied to superficial inspection of non-metallic pipes for the hydrocarbons transport. In Proceedings of the Conference on Dimensional Optical Metrology and Inspection for Practical Applications III, Baltimore, MD, USA, 5–6 May 2014. [Google Scholar]
  10. Kang, D.; Jang, Y.J.; Won, S. Development of an inspection system for planar steel surface using multispectral photometric stereo. Opt. Eng. 2013, 52, 039701. [Google Scholar] [CrossRef]
  11. Chien, K.C.C.; Tu, H.Y. Complex defect inspection for transparent substrate by combining digital holography with machine learning. J. Opt. 2019, 21, 085701. [Google Scholar] [CrossRef]
  12. Dawda, A.; Nguyen, M. Defects Detection in Highly Specular Surface using a Combination of Stereo and Laser Reconstruction. In Proceedings of the 35th International Conference on Image and Vision Computing New Zealand (IVCNZ), Electr Network, Wellington, New Zealand, 25–27 November 2020. [Google Scholar]
  13. Yang, P.C.; Hu, D.; Wang, C.Y.; Zhang, Y.X.; You, D.Y.; Gao, X.D.; Zhang, N.F. Weld Surface Imperfection Detection by 3D Reconstruction of Laser Displacement Sensing. In Proceedings of the 5th International Conference on Mechanical, Control and Computer Engineering (ICMCCE), Harbin, China, 25–27 December 2020; pp. 2102–2105. [Google Scholar]
  14. Liu, L.; Cai, H.; Tian, M.Z.; Liu, D.D.; Cheng, Y.; Yin, W. Research on 3D reconstruction technology based on laser measurement. J. Braz. Soc. Mech. Sci. Eng. 2023, 45, 297. [Google Scholar] [CrossRef]
  15. Lizcano, C.; Marquez, M. Three-dimensional surfaces reconstruction base on laser triangulation. In Proceedings of the 5th Iberoamerican Meeting on Optics/8th Latin American Meeting on Optics, Lasers, and Their Applications, Porlamar, Venezuela, 3–8 October 2004; pp. 1322–1327. [Google Scholar]
  16. Li, J.X.; Zhou, Q.; Li, X.H.; Chen, R.M.; Ni, K. An Improved Low-Noise Processing Methodology Combined with PCL for Industry Inspection Based on Laser Line Scanner. Sensors 2019, 19, 3398. [Google Scholar] [CrossRef] [PubMed]
  17. Chen, D.L.; He, X.F. Fast automatic three-dimensional road model reconstruction based on mobile laser scanning system. Optik 2015, 126, 725–730. [Google Scholar] [CrossRef]
  18. Wang, W.D. A novel rapid point-cloud surface reconstruction algorithm for laser imaging radar. Multimed. Tools Appl. 2019, 78, 8737–8749. [Google Scholar] [CrossRef]
  19. Liu, T.; Wang, N.N.; Fu, Q.; Zhang, Y.; Wang, M.H. Research on 3D Reconstruction Method Based on Laser Rotation Scanning. In Proceedings of the 16th IEEE International Conference on Mechatronics and Automation (IEEE ICMA), Tianjin, China, 4–7 August 2019; pp. 1600–1604. [Google Scholar]
  20. Jiang, T.G. Three-Dimensional Data Registration in Laser based 3D Scanning Reconstruction. In Proceedings of the 8th International Conference on Intelligent Human-Machine Systems and Cybernetics (IHMSC), Zhejiang University, Hangzhou, China, 11–12 September 2016; pp. 457–460. [Google Scholar]
  21. Sun, H.; Luo, Q.; Yang, Y.Y.; Cao, J.; Hao, Q. An innovative method of calculating target angle based on laser echo in laser imaging system. In Proceedings of the International Conference on Optical Instruments and Technology—Optoelectronic Measurement Technology and Systems, Beijing, China, 17–19 November 2013. [Google Scholar]
  22. Jia, N.N.; Li, Z.Y.; Ren, J.L.; Wang, Y.J.; Yang, L.Q. A 3D reconstruction method based on grid laser and gray scale photo for visual inspection of welds. Opt. Laser Technol. 2019, 119, 105648. [Google Scholar] [CrossRef]
  23. Li, S.H.; He, Y.X.; Li, Q.Q.; Chen, M. Using Laser Measuring and SFM Algorithm for Fast 3D Reconstruction of Objects. J. Russ. Laser Res. 2018, 39, 591–599. [Google Scholar] [CrossRef]
  24. Xu, X.B.; Fei, Z.W.; Yang, J.; Tan, Z.Y.; Luo, M.Z. Line structured light calibration method and centerline extraction: A review. Results Phys. 2020, 19, 103637. [Google Scholar] [CrossRef]
  25. He, Z.X.; Kang, L.P.; Zhao, X.Y.; Zhang, S.Y.; Tan, J.R. Robust laser stripe extraction for 3D measurement of complex objects. Meas. Sci. Technol. 2021, 32, 065002. [Google Scholar] [CrossRef]
  26. Li, Z.K.; Ma, L.P.; Long, X.L.; Chen, Y.Z.; Deng, H.T.; Yan, F.X.; Gu, Q.Y. Hardware-Oriented Algorithm for High-Speed Laser Centerline Extraction Based on Hessian Matrix. IEEE Trans. Instrum. Meas. 2021, 70, 5010514. [Google Scholar] [CrossRef]
  27. Yang, H.T.; Wang, Z.; Yu, W.B.; Zhang, P. Center Extraction Algorithm of Linear Structured Light Stripe Based on Improved Gray Barycenter Method. In Proceedings of the 33rd Chinese Control and Decision Conference (CCDC), Kunming, China, 22–24 May 2021; pp. 1783–1788. [Google Scholar]
  28. Yin, X.Q.; Tao, W.; Zhao, H. A Novel Breakpoint Detection Method Based on Dynamic Programming for Linear Laser Scanner. In Proceedings of the 10th International Symposium on Precision Engineering Measurements and Instrumentation (ISPEMI), Kunming, China, 8–10 August 2018. [Google Scholar]
  29. Tian, Q.G.; Zhang, X.Y.; Ma, Q.; Ge, B.Z. Utilizing polygon segmentation technique to extract and optimize light stripe centerline in line-structured laser 3D scanner. Pattern Recognit. 2016, 55, 100–113. [Google Scholar] [CrossRef]
  30. Chen, C.; Mei, X.S.; Hou, D.X.; Fan, Z.J.; Huang, W.W. A Voronoi-Diagram-based method for centerline extraction in 3D industrial line-laser reconstruction using a graph-centrality-based pruning algorithm. Optik 2022, 261, 169179. [Google Scholar] [CrossRef]
  31. Hou, W.Q.; Jing, H.C.; Guo, A.; Chen, Y.Q.; Song, D.S. Accurate laser centerline extraction algorithm used for 3D reconstruction of brake caliper surface. Opt. Laser Technol. 2023, 167, 109743. [Google Scholar] [CrossRef]
  32. Wang, J.; Cheng, W.; Li, W.L.; Ma, X.Q.; Yan, W.N. Research on extraction method of centerline of large format laser stripe. In Proceedings of the 2nd IYSF Academic Symposium on Artificial Intelligence and Computer Engineering, Xi’an, China, 8–10 October 2021. [Google Scholar]
Figure 1. The principle of the laser triangulation measuring method.
Applsci 13 09831 g001
Figure 2. The 3D reconstruction process based on the laser triangulation measuring method.
Applsci 13 09831 g002
Figure 3. The flow chart of the preprocessing method.
Applsci 13 09831 g003
Figure 4. The schematic diagram of the Gaussian blur.
Applsci 13 09831 g004
Figure 5. The smoothing results of the Gaussian blur.
Applsci 13 09831 g005
Figure 6. The image segmentation process.
Applsci 13 09831 g006
Figure 7. The ceiling phenomenon and its curve fitting.
Applsci 13 09831 g007
Figure 8. The Gaussian blur and its curve fitting.
Applsci 13 09831 g008
Figure 9. The improved grayscale center of gravity method.
Applsci 13 09831 g009
Figure 10. Camera G3-GM12-M2590.
Applsci 13 09831 g010
Figure 11. Line laser YN−118 c.
Applsci 13 09831 g011
Figure 12. The size of the lithium battery.
Applsci 13 09831 g012
Figure 13. Experimental computer data acquisition.
Applsci 13 09831 g013
Figure 14. The light strip center line graph.
Applsci 13 09831 g014
Figure 15. The centerline extraction deviation chart.
Applsci 13 09831 g015
Figure 16. The laser lines under different noise.
Applsci 13 09831 g016
Figure 17. The partial enlargements of three methods (γ = 50).
Applsci 13 09831 g017
Figure 18. The contrast of standard errors.
Applsci 13 09831 g018
Figure 19. The 3D reconstruction result.
Applsci 13 09831 g019
Table 1. Camera parameter list.
TypeArgument
Sensor model typeOn-Semi Python5000 P1, CMOS
Resolution2592 × 2048
Black and white/colorBlack and white
Support interfaceGigE Vision
Pixel size4.8 μm × 4.8 μm
Frame rate22 fps
Interface speed1 Gbps
Pixel depth8 bit
Supporting lensC-Mount; CS-Mount
Shutter typeGlobal shutter
Power requirementsSupport PoE power supply; 10–36 VDC
SynchronizationSoftware/hardware trigger, PTP
Exposure controlHardware trigger, API programming
Dimension21 × 29 × 44 mm
Weight46 g
Table 2. Line laser parameters table.
IndexArgument
Core power150 MW
Output wavelength60 nm
Dimensionφ22 × 70 mm
Operating temperature−10 °C~+55 °C
Operating voltageDC2.8 V~5.2 V
Working life13,000 h
Operating temperature−10 °C~+50 °C
Storage temperature−45 °C~+80 °C
Table 3. Sample data and the deviation.
Measurement
Methods
The Grayscale Centers
of Gravity Method
The Curve
Fitting Method
The Method Proposed
in This Paper
The Mean of
Three Methods
Pixel
Coordinates
Measured
Values x1/Pixel
Absolute Deviations σ1/PixelMeasured Values
x2/Pixel
Absolute
Deviations σ2/Pixel
Measured Values
x3/Pixel
Absolute
Deviations σ3/Pixel
The Estimated
True Values
x^/Pixel
15651165.0400.0131165.0500.0031165.0700.0171165.053
15661165.2600.0901165.1000.0701165.1500.0201165.170
15671165.1500.0301165.0900.0301165.1200.0001165.120
15681165.0100.0531165.0900.0271165.0900.0271165.063
15691165.1800.0371165.1100.0331165.1400.0031165.143
15701165.2500.0601165.1400.0501165.1800.0101165.190
15711165.1500.0071165.1200.0231165.1600.0171165.143
15721165.1100.0071165.1100.0071165.0900.0131165.103
15731164.9600.1201165.1400.0601165.1400.0601165.080
15741165.5400.1731165.2400.1271165.3200.0471165.367
15751165.5200.1131165.3300.0771165.3700.0371165.407
15761165.2300.0401165.3400.0701165.2400.0301165.270
15771165.0600.0971165.2900.1331165.1200.0371165.157
15781165.1000.0731165.2700.0971165.1500.0231165.173
15791165.4600.1501165.2500.0601165.2200.0901165.310
15801165.1400.0231165.1900.0271165.1600.0031165.163
15811165.0900.0031165.1100.0231165.0600.0271165.087
15821164.9300.0631165.0500.0571165.0000.0071164.993
15831164.9500.0501165.0400.0401165.0100.0101165.000
15841165.1400.0401165.0900.0101165.0700.0301165.100
15851165.2000.0171165.2000.0171165.1500.0331165.183
Average
Absolute
Deviations
MAE/pixel
0.0600.0500.026
Table 4. The standard deviations of different centerline extraction methods.
Extraction MethodsThe Grayscale Centers
of Gravity Method
The Curve
Fitting Method
The Proposed Method
in This Paper
Standard errors σ/pixel0.02730.01750.0051
Disclaimer/Publisher’s Note: The statements, opinions and data contained in all publications are solely those of the individual author(s) and contributor(s) and not of MDPI and/or the editor(s). MDPI and/or the editor(s) disclaim responsibility for any injury to people or property resulting from any ideas, methods, instructions or products referred to in the content.

