Article

Spatial, Temporal, and Vertical Variability of Ambient Environmental Conditions in Chinese Solar Greenhouses during Winter

1
Department of Agricultural Machinery Engineering, Graduate School, Chungnam National University, Daejeon 34134, Republic of Korea
2
Department of Smart Agricultural Systems, Graduate School, Chungnam National University, Daejeon 34134, Republic of Korea
3
Department of Biosystems Engineering and Soil Science, College of Agricultural Sciences and Natural Resources, University of Tennessee, Knoxville, TN 37996, USA
4
Department of Biological and Agricultural Engineering, College of Agriculture and Life Sciences, Texas A&M University, College Station, TX 77843, USA
5
Department of Agricultural and Industrial Engineering, Hajee Mohammad Danesh Science and Technology University, Dinajpur 5200, Bangladesh
6
Agricultural Technical Institute, Division of Horticultural Technologies, Ohio State University, Wooster, OH 44691, USA
7
College of Engineering, Shenyang Agricultural University, Shenyang 110866, China
*
Author to whom correspondence should be addressed.
Appl. Sci. 2023, 13(17), 9835; https://doi.org/10.3390/app13179835
Submission received: 25 July 2023 / Revised: 28 August 2023 / Accepted: 30 August 2023 / Published: 30 August 2023
(This article belongs to the Special Issue Advances in Technology Applied in Agricultural Engineering)

Abstract

:
The monitoring and control of environmental conditions are crucial as they influence crop quality and yield in Chinese solar greenhouses (CSGs). The objectives of this study were to assess the spatial, temporal, and vertical variability of major environmental parameters in CSGs during winter and to provide greenhouse climate/microclimate characteristics in order to facilitate the monitoring and control of greenhouse environmental conditions. A wireless sensor network (WSN) was deployed in two CSGs: one with crops and one without. Sensors were placed at different locations inside and outside the greenhouses, and the air temperature, humidity, CO2 concentration, light intensity, solar radiation, and wind conditions were measured and analyzed. Significant variability in the spatial, temporal, and vertical distribution of environmental factors was observed in both greenhouses. The average minimum and maximum temperatures and humidity inside the CSG with crops were 9.96 °C (4:00 h) and 24.5 °C (12:00 h), and 32.6% (12:00 h) and 92.1% (5:00 h), respectively. The temperature difference was 2.2 °C between layers in the CSG without crops and 1.4 °C between layers in the CSG with crops. The CO2 concentration in the different layers inside the CSG with crops was highest at night. The average maximum light intensity inside the CSG with crops was 32,660.19 lx, 36,618.12 lx, and 40,660.48 lx (12:00 h to 13:00 h) in the bottom, middle, and top layers, respectively. Sensor positioning in the greenhouse was evaluated by considering the sensors’ data variability. The findings of this study could aid in the development of a better monitoring and control system for CSG’s microclimate during winter. More research is needed on greenhouse microclimate control systems based on this variability analysis, which could improve crop quality and yield in greenhouses.

1. Introduction

The ever-growing world population is putting an increasing strain on the Earth’s resources, particularly on agricultural land. As cities continue to expand and urbanization takes over farmland, the amount of available arable land is shrinking, making it increasingly challenging to produce enough food to feed the world’s population [1]. Furthermore, global climate change is causing extreme weather events such as droughts, floods, and heat waves, which can adversely impact crop yields [2]. Agricultural production is further affected by the depletion of natural resources, including water and nutrients, as well as the growing prevalence of pests and diseases [3]. Meeting rising food needs while safeguarding natural resources demands creative solutions and sustainable approaches. Natural conditions and input availability may challenge optimal crop growth [4]. Crop growth is affected by several environmental factors, including air temperature, relative humidity, carbon dioxide concentration, soil temperature, and soil water content [5]. Plastic-covered greenhouses can be utilized to artificially control the micro-climate and regulate environmental conditions for crop growth [6].
Greenhouses are enclosed environments that can be actively controlled to increase the yield of crops and vegetables, especially high-priced vegetables and off-season crops. The production of greenhouse crops is generally 2–3 times higher than that of open-field crops [7,8]. Due to their benefits for plant and vegetable cultivation, greenhouses have become widely used [9]. Chinese solar greenhouses (CSGs) are distinctive agricultural structures consisting of a rear, north-facing wall, and a transparent, south-facing wall. The rear wall saves energy from sunlight in the daytime and releases heat into the greenhouse throughout the night. The low operational costs of CSGs, stemming from their energy-saving properties, have made them highly popular in China [10,11]. The cultivation of vegetables in solar greenhouses in China grew from approximately 3.3 million hectares in 2012 [12] to 3.8 million hectares in 2020 [13]. However, during the winter, conventional greenhouses often face challenges in maintaining optimum growing conditions for crops and vegetables. This is primarily due to the low air and soil temperatures inside the greenhouse, which can limit plant growth and development [14]. Additionally, shorter day lengths and reduced solar radiation during the winter months can further inhibit plant growth and productivity [15]. In winter, greenhouse heating expenses can hinder production due to their high energy cost [16]. Solar greenhouses offer a solution by harnessing solar energy to create a warm environment for cold-climate crop growth. In China, solar greenhouse design often integrates passive solar heating methods like insulation, heat storage, and angled glazing to optimize solar energy capture [17]. The use of solar greenhouses extends the growing season and increases the yields of crops such as vegetables, fruits, and flowers [18]. Effective management practices, encompassing ideal temperature, humidity, light levels, and proper pest and disease control, are vital for maximizing the benefits.
The microclimate within CSGs, especially the temperature, humidity, and radiation, is critically important for ensuring crop growth as well as high yields and quality [19]. The temperature distribution throughout the greenhouse and the control of temperature and humidity within an appropriate range is essential for ensuring the uniform growth of crops [20]. In tropical areas with strong solar radiation, coverings and ventilation are necessary for reducing the air temperature of greenhouses. By contrast, cold regions demand regular plant health checkups, especially during the harsh winter season [21]. Several studies have analyzed environmental microclimate conditions to evaluate and optimize crop growth conditions and to improve the energy efficiency of greenhouses. The microclimate and transpiration of tomato plants have been investigated [22] in a sunken solar greenhouse located in North China. The findings revealed that the sunken design of the greenhouse improved the microclimate by lowering temperature fluctuations and increasing relative humidity. The greenhouse maintained temperatures over 20 °C higher than those outside, leading to robust tomato growth and satisfactory yields. Hou et al. [23] studied microclimate parameters in naturally ventilated solar greenhouses under various scenarios: mature plants, young plants, and no plants in northwest China. The findings demonstrated that ventilation rate, external temperature, and humidity affected internal conditions, with up to 5.1 °C and 8.16 °C vertical temperature differences in mature and young plant greenhouses, respectively. Liu et al. [24] compared the indoor environmental factors in a double-film solar greenhouse and in a traditional Chinese greenhouse that were both in a cold region. The results showed that the solar greenhouse had a higher air temperature, soil temperature, and humidity, while the traditional greenhouse had lower air temperature and humidity. The study indicated that using a double-film solar greenhouse in cold regions can improve tomato growth and yield due to lower wind speed and higher photosynthetic photon flux density. Dong et al. [25] presented a time-dependent model to predict the thermal environment of CSGs in Canada. The average inaccuracy in forecasting the temperature of the north wall and the ground surface was 4.2 °C and 2.3 °C, respectively. The study also found that the thermal performance of greenhouses was influenced by factors like insulation properties, ventilation, and heating systems. Ryu et al. [26] analyzed the spatial, vertical, and temporal variability of ambient environments in strawberry and tomato greenhouses during winter. Significant variations in temperature, relative humidity, and CO2 concentration within and between the two types of greenhouses were found. The temperature variability was higher in tomato greenhouses, while relative humidity was more variable in strawberry greenhouses. Furthermore, the variability of CO2 concentration was influenced by the greenhouse ventilation and heating systems. Fan et al. [27] monitored the microclimate of solar greenhouses at different times of day and found that the temperature and humidity indicated the thermal efficiency of the solar greenhouses. Ahamed et al. [28] conducted a sensitivity analysis of a heating simulation model within a CSG in Canada during the coldest winter months (December to February) and found that small changes in the inside temperature and humidity had a substantial effect on the heating demand; furthermore, approximately 13–20% supplemental heat was required to extend the crop planting period during the winter days. Tadj et al. [29] used several heating techniques to study the temperature and humidity distribution in greenhouses. Heating pipes increased the uniformity of climatic parameters inside the greenhouse. Furthermore, differences in temperature and humidity between crops and the air increased the activity of plants and the transpiration of crops. Wei et al. [30] characterized CO2 concentration in a solar greenhouse through three experiments and investigated the impact of CO2 concentration changes on plant yield. CO2 concentration dropped notably in the afternoon compared to mornings, with ventilation significantly affecting these levels.
In addition, certain studies focused on sensor fusion inside the greenhouse for environmental monitoring and control. Using a wireless sensor network, Touhami et al. [31] suggested a polynomial algorithm for monitoring the microclimate of greenhouses automatically and a linear equations model for optimizing plant productivity. Changes in temperature, humidity, solar radiation, and soil pH were evaluated through simulation, and the execution time was 2.09 s. Wang and Wang [32] proposed a fuzzy-PID controller with a wireless monitoring system to control the environmental conditions of greenhouses and to monitor their microclimate. The test demonstrated that the sensor nodes functioned accurately, collecting multiple greenhouse parameters simultaneously. The system can maintain optimal greenhouse conditions by regulating parameters such as temperature, humidity, and light intensity. Nicolosi et al. [33] highlighted the use of a flexible control system to monitor the microclimate of the greenhouse using a neural network solution. Based on the outside temperature forecast, heating and cooling devices were controlled, and the inside temperature was adjusted and improved for crop production. A fuzzy logic-based control system was proposed by Azaza et al. [34]. Wireless data monitoring systems were used to monitor and control the internal environmental data such as temperature, humidity, CO2, and illuminance. Ferentinos et al. [35] observed that environmental variability within a greenhouse can be achieved and that it is economically feasible with the sensor fusion technique and the installation of multiple measuring points. Balendonck et al. [36] suggested a low-cost wireless sensor network to examine the horizontal temperature and humidity distribution inside a greenhouse. The static and instantaneous variation in average temperature and humidity were found to be 1.0–3.4 °C and 9–40%, and 5.6–9.0 °C and 11.8–42.3%, respectively. The number of sensors used during the experiment affected the accuracy of the measurement of temperature and humidity in a larger greenhouse. The data from the sensors were closely connected, and redundancy was also avoided. Therefore, data analysis within the different nodes should be handled carefully to improve accuracy and reliability under the requirements in order to comply with the application’s demands [37].
Analyzing environmental microclimate conditions in CSGs is essential to evaluate and optimize crop growth conditions and to improve energy efficiency. Monitoring environmental parameters such as temperature, humidity, CO2 levels, solar radiation, etc., helps maintain ideal growth conditions, leading to better yields. This information also enables the development of smart control systems for automated greenhouse management, optimizing resource use, and curbing energy consumption. Utilizing wireless sensor networks and integration technologies is essential for the precision control and management of greenhouse conditions. To maximize the monitoring and control of environmental factors in CSGs, the use of various sensors and their positioning depending on the degree of variability in environmental factors is required. The objective of this study was to investigate the spatial, vertical, and temporal variability of environmental variables in two CSGs during winter, offering insights for efficient environmental management through wireless sensor networks and sensor location.

2. Materials and Methods

2.1. Data Collection Site

The data collection was conducted using two CSGs of the same size (60 m × 8 m), which were oriented lengthwise in the east–west direction at Shenyang Agriculture University, Liaoning, China (41°49′46″ N, 123°33′51″ E). This study was conducted under two different scenarios: a greenhouse with crops and a greenhouse without crops. Figure 1 shows the cross-section of the structure of the two CSGs, which featured a sturdy north-facing wall with a partial roof on the north side and a cover over the southern side. The north wall (0.45 m thick) was a layered structure of brick with Styrofoam insulation and an air layer. The north roof (0.2 m thick) was made of several layers of wood, Styrofoam, and other structural materials. The cover placed on the south roof (0.00012 m thick) during the daytime was made of polyvinyl chloride (PVC) film, and a cotton blanket (0.50 m thick) was laid over the roof each night. During the daytime, the south roof of the greenhouse was covered with a thin plastic film to allow entry of the sunlight; at night, it was covered with a cotton blanket to provide insulation. The front and rear slope elevation angles of the greenhouse roof were 32° and 41.20°, respectively, and the rear slope horizontal projection was 0.16 m. The vent was opened at 11:00 h and closed at 13:30 h in the daytime during the winter season, except on snowy days. Sunrise and sunset were between 6:40 h to 7:05 h and 16:05 h to 16:25 h, respectively.
Strawberry (Fragaria ananassa; variety: Yanli) was planted on 10 September 2018 in one of the CSGs, and the soil under the plants was covered by a black plastic film. The plant-to-plant and row-to-row distances were 15 cm and 20 cm, respectively. The number of rows was two per ridge, and the ridge length was 6.90 m. The interval between the ridges was 1.0 m, and the total number of ridges was 56.

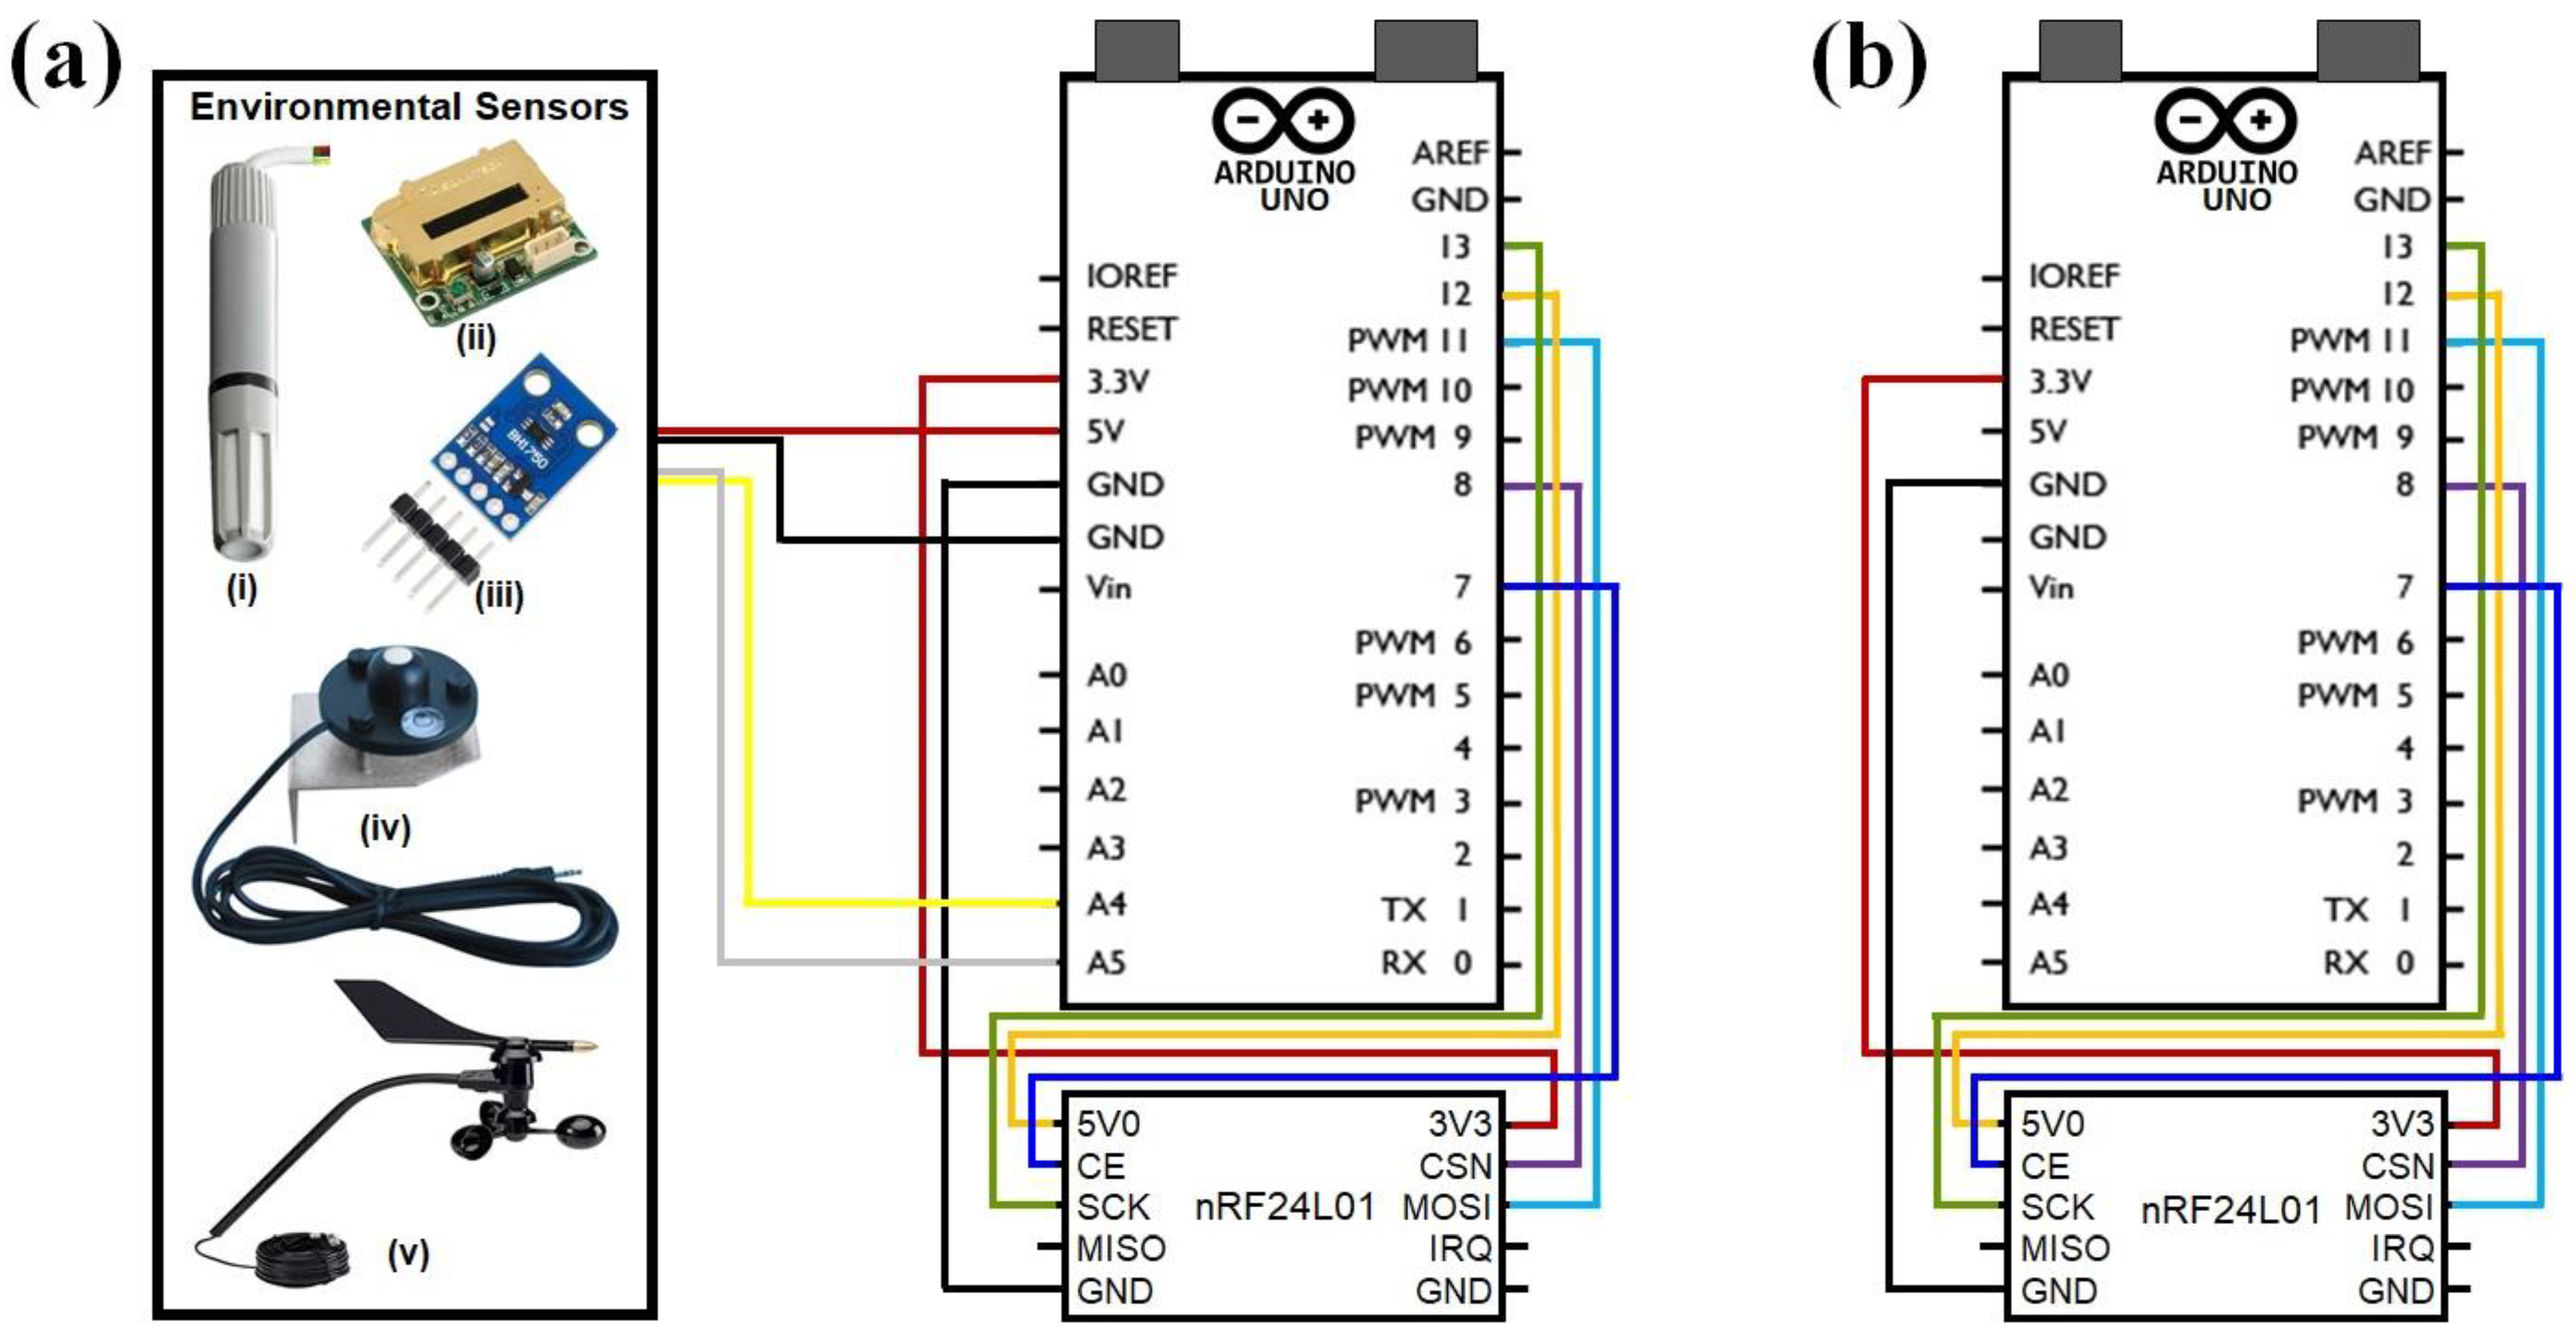
2.2. Sensors and Wireless Sensor Network (WSN)

Table 1 shows the environmental variables measured in the CSGs and the specifications of the sensors used for the measurements. Air temperature and humidity were measured using a temperature and humidity sensor (AM2315, Aosong Electronics Co., Ltd., Guangzhou, China). The sensor consists of a capacitive sensor wet component and a high-precision temperature measuring unit with a microprocessor. The carbon dioxide (CO2) concentration was detected with a CO2 sensor (SH-300-ND, SOHA TECH Co., Ltd., Seoul, Republic of Korea) using a cutting-edge NDIR (non-dispersive infrared) method. A light intensity sensor (BH1750FVI, Rohm Co., Ltd., Kyoto, Japan) employing a photoresistor technique was used to obtain the light intensity inside and outside of the greenhouses. Solar radiation was estimated using a silicon pyranometer sensor (Watchdog 3670WS2, Spectrum Technologies, Inc., Aurora, IL, USA), and an anemometer (Davis 7911, Davis Instruments Corp. Inc., Hayward, CA, USA) was used to measure the wind speed and direction outside of the CSGs.
A wireless sensor network (WSN) was used to collect data from the sensors using an Arduino UNO 328 (Arduino, arduino.cc) microcontroller with a 2.4 GHz radio/wireless data transmission module (nRF24L01, Shenzhen Yuzens Electronics Co., Ltd., Shenzhen, China) with a wireless data transmission range of approximately 1000 m [38]. Arduino is an open-source software and hardware platform, and the core of the Arduino UNO processor is the ATmega328. It has 14 digital input/output roads (6 of the roads can be used as a PWM output), 6 analog input roads, 32 kB of flash memory, and 1 kB of EEPROM [39]. NRF24L01 is a new high-speed (20 bit/s) data transceiver for the worldwide 2.4–2.5 GHz ISM frequency band. NRF24L01 has several low-powered operation modes, such as power-down mode and standby mode. The wireless system consists of nodes, gateways, and servers. The sensor nodes were composed of an Arduino UNO 328 microcontroller, respective sensors, power sources, and nRF24L01 2.4 GHz radio/wireless transceiver modules. For the wireless sensor network gateway, nRF24L01 2.4 GHz radio/wireless transceiver modules were also attached to the same node. The gateway functions to collect data from each node and sends them to the server, which employs the Parallax Data Acquisition Tool (PLX-DAQ) to store and display the gathered information to the PC. Figure 2 shows the wiring connection between Arduino UNO, nRF24L01, temperature, and humidity sensors in the wireless network system.

2.3. Data Collection and Analytical Procedure

The experimental greenhouse was divided into three vertical planes, and each plane was divided into three layers. All measurements were taken in these three vertical planes of the greenhouse. The bottom, middle, and top layers of each plane were located 0.50 m, 1.75 m, and 3.0 m above the ground, respectively, and each layer was also divided into three points for sensor placement, which were 1.0 m, 4.0 m, and 7.0 m from the north wall. The bottom and middle layers contained three temperature and humidity sensor nodes each, and the top layer contained one sensor node at the center point. Each plane contained seven temperature and humidity sensor nodes. A total of 21 temperature and humidity sensors (Figure 3a, numbered 1-21) were placed inside each greenhouse. One CO2 sensor and one light intensity sensor were placed in the center of each layer of the middle plane. A total of three CO2 and three light intensity sensors were placed inside each greenhouse. Five sensors for measuring the outside air temperature, humidity, airflow and airflow direction, solar radiation, and light intensity were placed 0.5 m above the top of the greenhouse. Figure 3a shows the positions of the data acquisition sensor nodes in different cross-sections of the greenhouse as well as those for the outside data. Figure 3b shows the distance and height between sensors in a cross-section of the greenhouse. All sensors were installed inside and outside of the Chinese solar greenhouse, and data were collected. The experiment was conducted in two selected CSGs during November and December 2018, which lasted for approximately three weeks. This period was chosen because it allowed for the cultivation of strawberries at different growth stages, facilitating comparative analysis. Due to the consistency in parameter fluctuations seen from the preliminary test on various days, a day with the maximum solar radiation was selected for this analysis [23,40]. Descriptive statistical analysis methods (average, one-way ANOVA, and least significant difference (LSD) all-pairwise comparisons test) were used in this study. A software package, Statistix 10 (Analytical Software, Tallahassee, FL, USA), was used for the statistical analysis.
During the experiments, the WSN recorded all the data from the inside and outside of the greenhouse. The sensor nodes consisted of Arduino UNO 328 microcontrollers, sensors, power sources, and nRF24L01 2.4 GHz wireless transceiver modules. After wiring the sensors with Arduino UNO, a code for each of the sensor nodes was sketched in the Arduino software IDE 1.8.7 (Arduino, arduino.cc). This was uploaded, and the program was run for data collection. Real-time data were collected from the sensors and were then remotely and directly plotted in an MS Excel sheet using the parallax data acquisition tool (PLX-DAQ, Parallax Inc., Rocklin, CA, USA) through serial communication. The transmitter nodes were referred to as slaves, and the receiver nodes were referred to as masters. The slaves transmitted the sensor data, while the receivers received it from the slaves.
The sensor nodes were calibrated after the system was fabricated, as some of the sensors from the same manufacturer might vary in their readings. To calibrate the sensors, data were taken for approximately 15 min under known temperature and humidity conditions. Three replications of this calibration were performed. Figure 4a shows the schematic diagram of the data receiving, processing, and transmission process when using Arduino Uno microprocessor and wireless transceiver modules, as well as the visualization and monitoring that was conducted through the PLX-DAQ tool. Figure 4b shows the data visualization using PLX-DAQ from the sensor nodes and gateway.

3. Results and Discussions

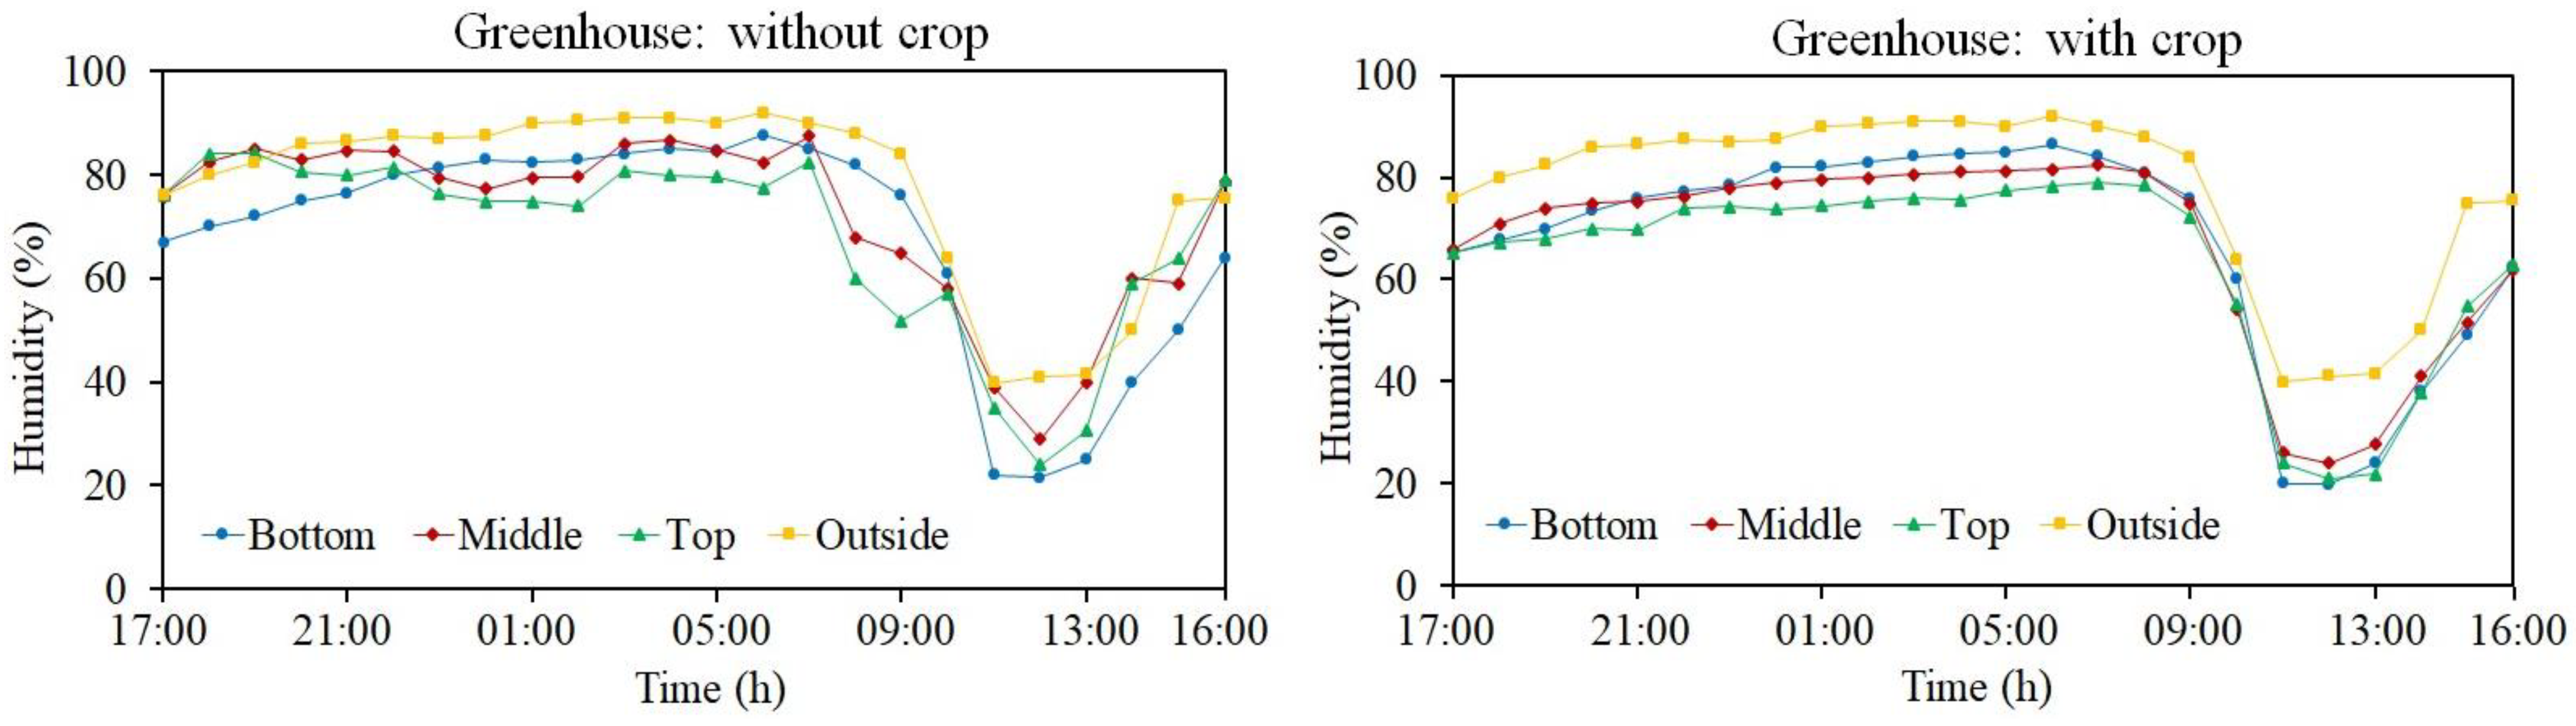
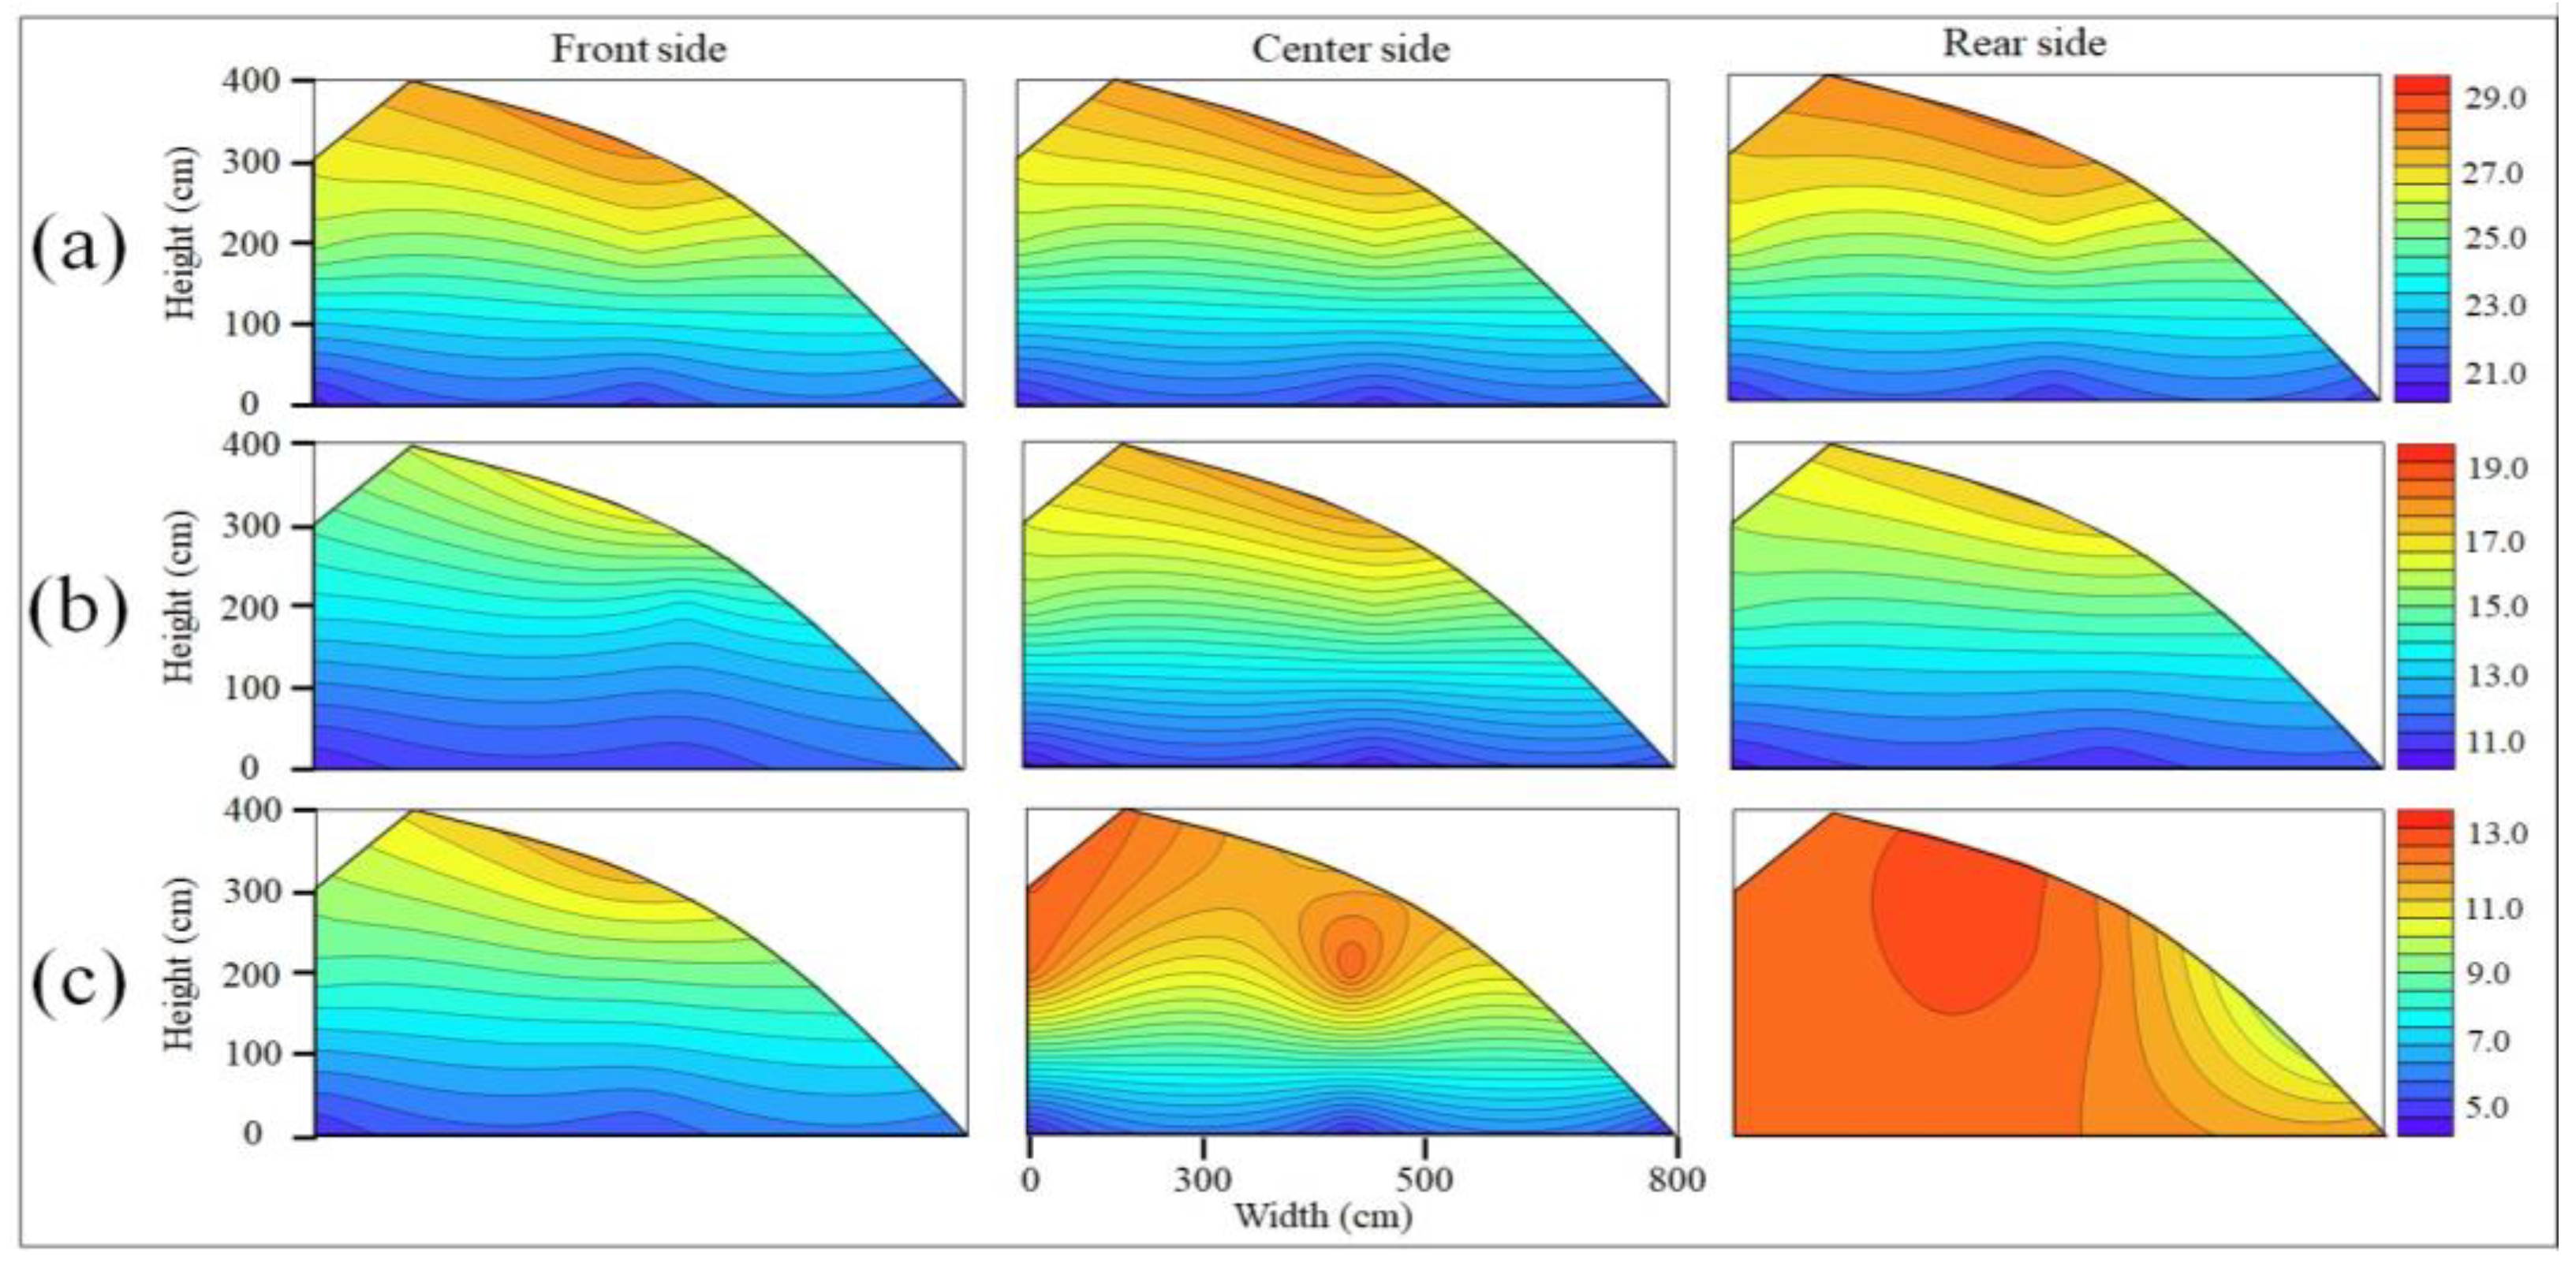
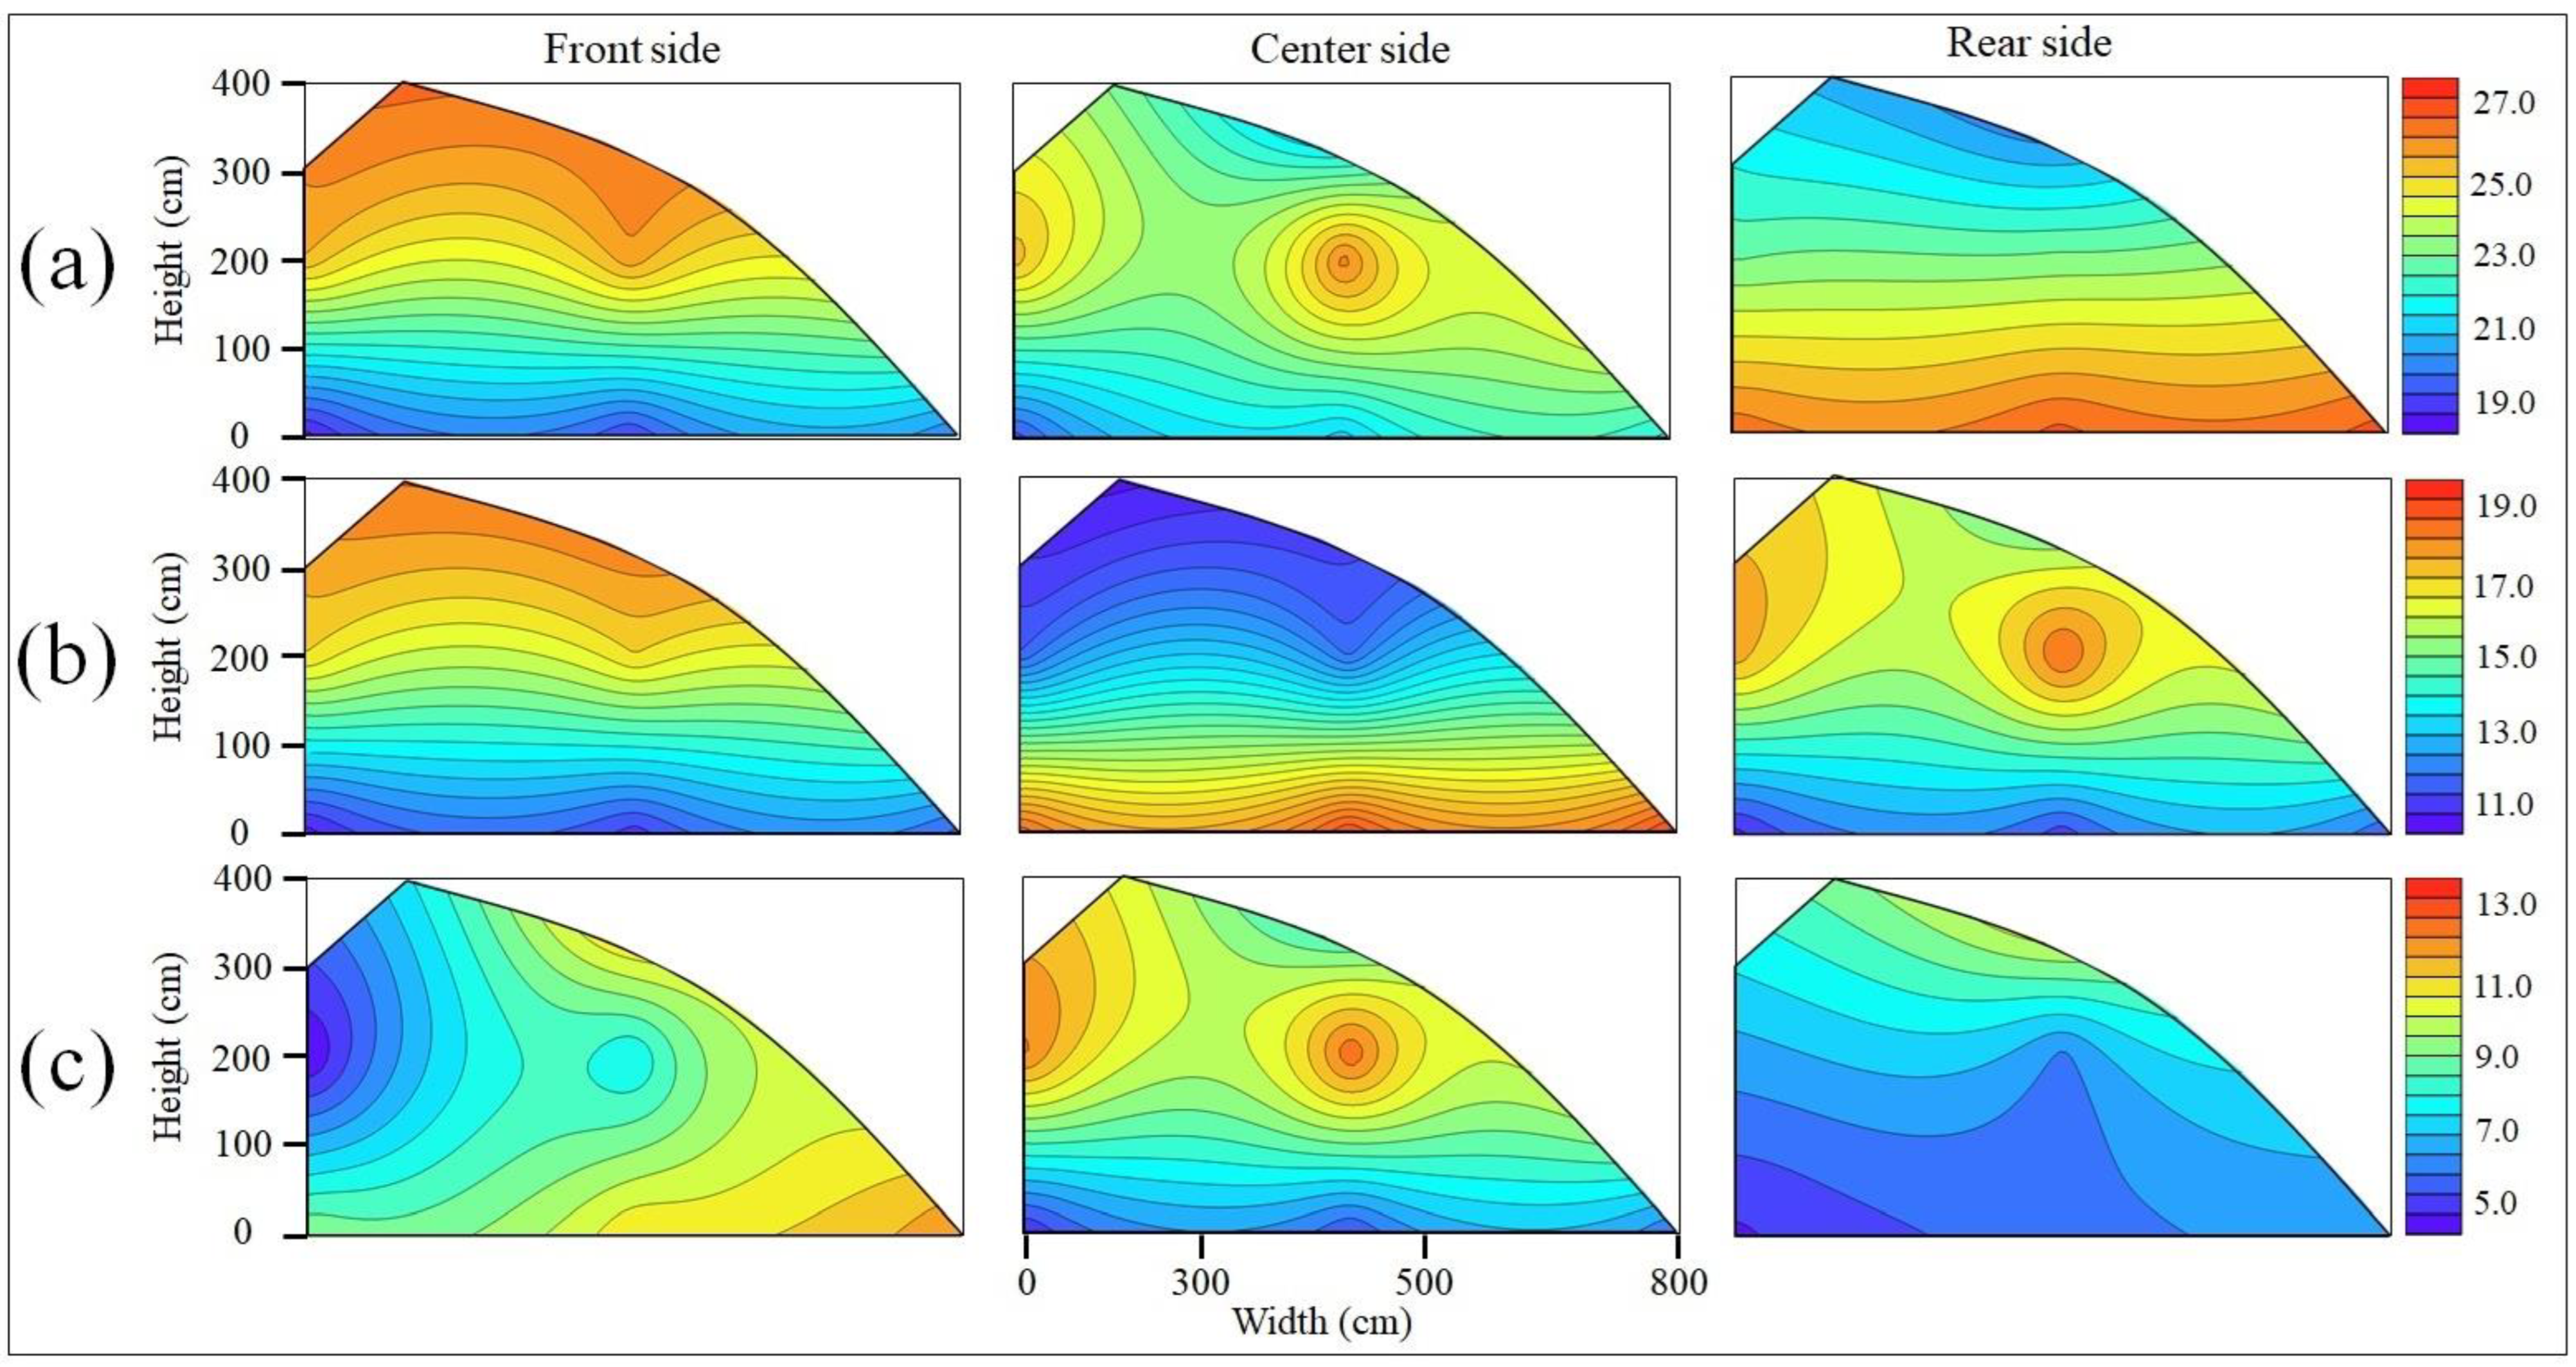
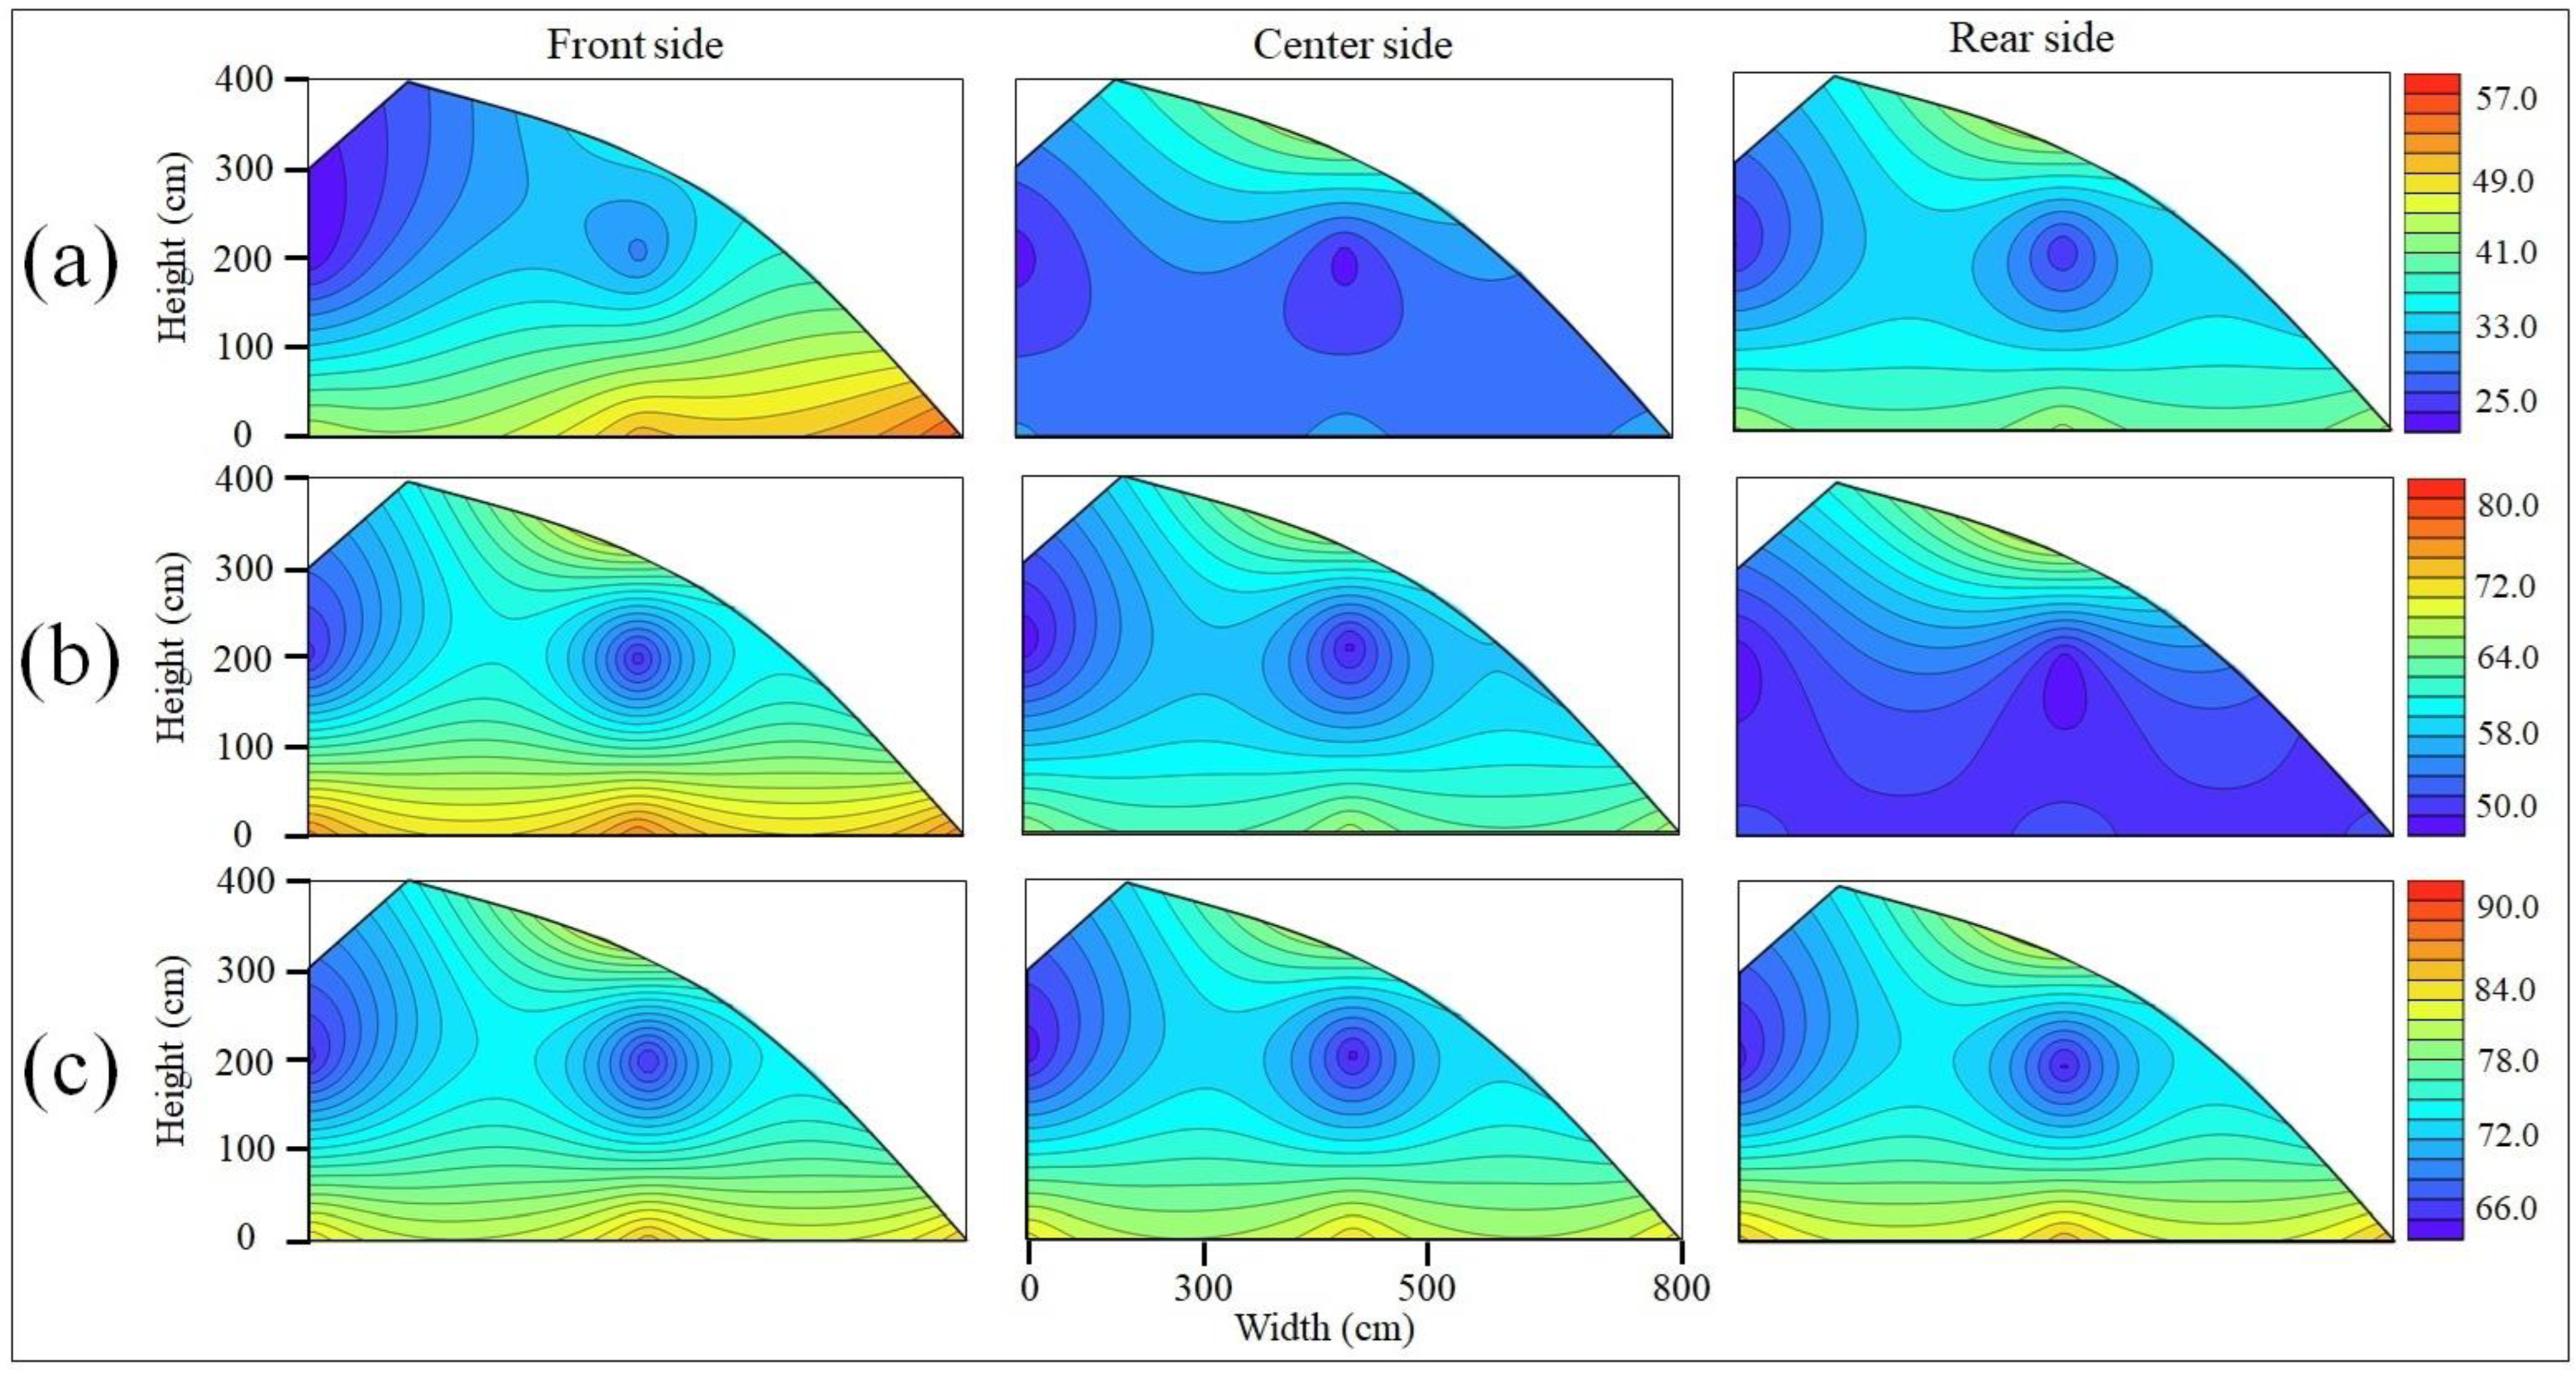
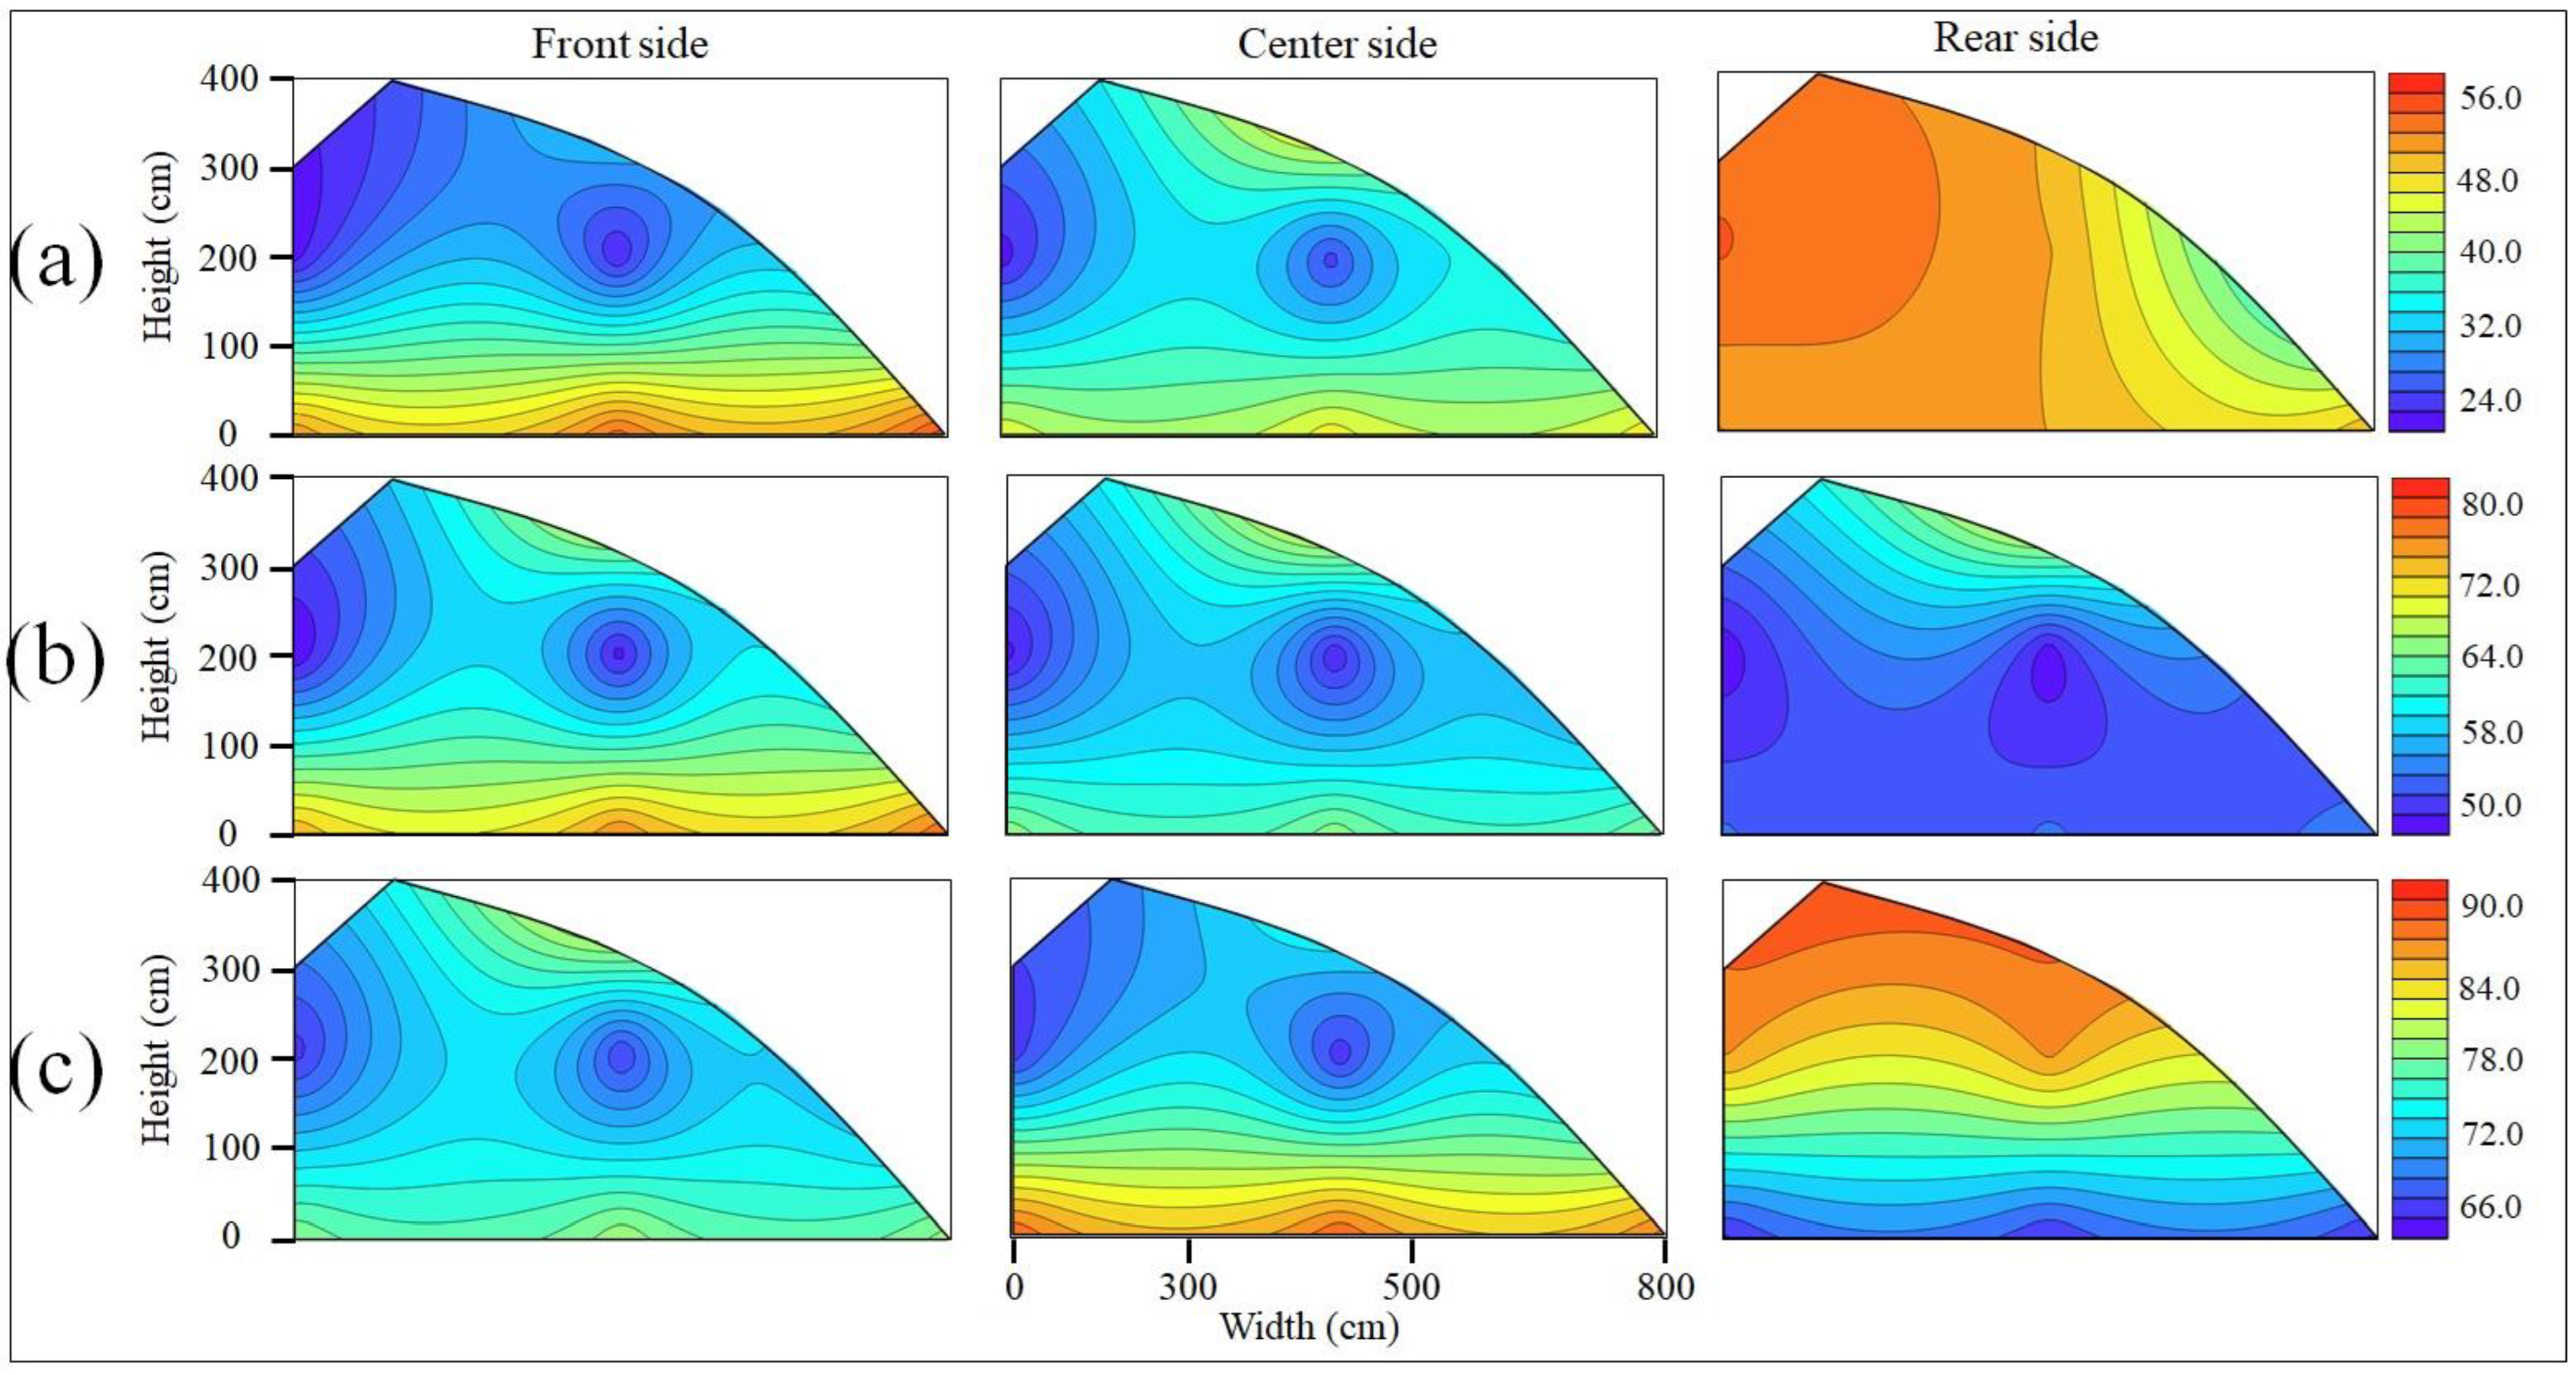
3.1. Variability in Temperature and Humidity

The indoor air temperature of a greenhouse can impact various factors such as water and carbon fluxes within the plant, fruit quality [41,42], and energy consumption [43]. Air temperature also has an effect on the humidity condition. Therefore, the proper control and management of indoor air temperature is crucial to ensure optimal microclimate conditions in the greenhouse. Figure 4 and Figure 5 show the overall variability in the temperature and humidity inside and outside both greenhouses (with and without crops) during the experiments in the winter. The air temperature both inside and outside the greenhouse gradually increased to a peak value and then decreased over time. Significantly, the maximum indoor and outdoor temperatures occurred at different times, with a delay observed in the maximum indoor temperature. The hourly minimum and maximum temperatures outside the greenhouses were −9.2 °C (8:00 h) and 3.6 °C (11:00 h), respectively; the hourly minimum and maximum humidity outside the greenhouses were 16.1% (13:00 h) and 94.2% (5:00 h and 6:00 h), respectively. The hourly average temperature showed an upward trend from 9:00 h to 12:00 h, followed by a gradual decrease thereafter. On the other hand, the humidity exhibited a rapid increase between 13:00 h and 15:00 h and continued to rise steadily until 7:00 h. The hourly minimum and maximum temperatures inside the CSG without crops were 8.84 °C (5:00 h) and 30.3 °C (12:00 h), respectively, and the humidity was 25.63% (12:00 h) and 94.26% (15:00 h), respectively. Similarly, the hourly minimum and maximum temperatures inside the CSG with crops were 9.96 °C (4:00 h) and 24.5 °C (12:00 h), respectively, and humidity was 32.6% (12:00 h) and 92.1% (5:00 h), respectively. The air temperatures within the two greenhouses followed a pattern that was quite similar. The inside temperature began to increase once the cotton blanket was removed at 8:00 h and reached its maximum temperature at around 12:00 h. Once the temperature started to drop, the rate at which the air temperature dropped slowed down when the blanket was placed over the south roof at 15:00 h. As shown in Figure 5, the air temperatures within the greenhouse were comparable whether crops were present or not, except for the lower layer, which was very warm (especially during the night). The temperature differences between the layers in both CSGs are also depicted in Figure 5, indicating a temperature difference of approximately 2.2 °C between layers in the CSG without crops and around 1.4 °C between layers in the CSG with crops. The daily average temperature inside both greenhouses was approximately 16.4 °C, which was higher than the average outside temperature.
The humidity differences between the layers in both greenhouses are shown in Figure 6. In the CSG without crops, the humidity difference was lower throughout the daytime, and differences between layers were smaller compared with the CSG with crops. The differences during the night were more pronounced, and humidity was higher in the lower layer than in the top layer. During the day and night, the differences in the humidity between the layers of the CSG with crops were more pronounced. During the daytime, the humidity of the bottom layer was lower than that of the top layer because the crop respiration rate was higher; however, the humidity of the bottom layer was higher than the other two layers at night. The humidity inside both CSGs was approximately 15.6% lower than the outside humidity. Snowfall was observed during the experiment at night; however, it had little effect on the environmental conditions inside the greenhouses due to the cotton blanket. Thus, temperature and humidity varied at different times and heights within the CSGs.
The experimental data from both solar greenhouses (with and without crops) with three different layers (bottom, medium, and top) were analyzed using the Kriging method in Surfer 8.0 (Golden Software, LLC, Golden, CO, USA). Figure 7 and Figure 8 show the spatial and vertical variability of the temperature using the 1 h average from 11:00 to 12:00, 16:00 to 17:00, and 22:00 to 23:00 h for the winter experiment in both greenhouses. The temperature levels on the three distinct sides were comparable, as were the temperatures inside each layer, which were also homogeneous. In the CSG with crops, the highest temperature of 28.22 °C was found in the top layer of the rear side between 11:00 and 12:00 h, and the lowest temperature of 5.42 °C was found in the lower layer of the rear side between 22:00 and 23:00 h. For the CSG without crops, the maximum temperature reached 27.81 °C in the middle layer of the center side from 11:00 to 12:00 h, while the minimum temperature was 5.18 °C in the lower layer of the rear side between 22:00 and 23:00 h. During the observed time period, it was found that the front and center sides of the CSG were relatively warmer, potentially indicating a heat loss induced by the structural flaws. To address this, implementing additional heating or repairing the defective parts could be effective remedies. Temperature variations were found to be consistent across all locations within the CSG. The presence of crops restricted air mobility within the greenhouse, leading to a warmer bottom layer compared to the bottom layer without crops. As sunset approached, the air temperature in both greenhouses decreased. However, the brick wall surrounding the greenhouse radiated stored energy during the night, thus helping to maintain a warm environment, albeit with slightly cooler temperatures in the bottom layer compared to the middle and top layers. Snowfall and rain had minimal effects on the overall temperature distribution within both greenhouses.
Figure 9 and Figure 10 show the spatial and vertical variability of the average inside humidity of the CSGs with and without crops for the front, middle, and rear sides at different heights. The humidity level at the center was lower than that at the front and rear. In the case of the CSG with crops, the maximum humidity was 88.32% in the bottom layer of the front side from 11:00 to 12:00 h, whereas the minimum humidity was 25.62% in the middle layer of the center side from 16:00 to 17:00 h. For the CSG without crops, the maximum humidity was 89.41% in the top layer of the rear side from 22:00 to 23:00 h, whereas the minimum humidity was 23.33% in the middle layer of the front side from 11:00 to 12:00 h. The humidity distribution was more stable in the greenhouse with crops than in the greenhouse without crops. During the winter, the temperature and humidity increased and decreased significantly. Monitoring the temperature and humidity with sensors is critically important for determining how the environment inside greenhouses could be best controlled to enhance crop growth and productivity.

3.2. CO2 Variability

The average maximum and minimum CO2 concentrations outside the greenhouses were 504 ppm (10:00 h) and 387 ppm (7:00 h), respectively. The average maximum and minimum CO2 concentration inside the greenhouse without crops was 710 ppm (09:00 h) and 510 ppm (07:00 h) in the top layer, respectively. The average maximum and minimum CO2 concentrations inside the greenhouse with crops were 959 ppm (01:00 h) and 508 ppm (07:00 h) in the middle and top layers, respectively. Plants require CO2 for photosynthesis. The optimal level of CO2 varies depending on the plant and light conditions in the CSG. When the light intensity decreases in the greenhouse, photosynthesis and CO2 consumption decrease. Figure 11 illustrates the daily variation in the CO2 concentration at various layers within and outside of both greenhouses. The CSG with crops (Figure 11a) demonstrated a considerable daily fluctuation in CO2 levels. The cotton blanket was closed throughout the night, and the CO2 content grew monotonically as a result of plant respiration, which slowed down with time and reached 700 to 959 ppm. As soon as the cotton blanket was opened, crop photosynthesis caused the CO2 levels to decrease significantly to 500–600 ppm. Light intensity was in opposition to the trend, which showed a significant connection between the two variables. A similar pattern was observed by Zhao et al. [44] in tomato plants and by Zhang et al. [45] in their study. In the CSG without crops (Figure 11b), there were incredibly small fluctuations throughout the day.
CO2 levels in ambient air are typically about 340 ppm by volume, and all plants grow well at this level [46]. However, when CO2 levels are increased by 1000 ppm, photosynthesis rises correspondingly, resulting in an increase in available sugars and carbohydrates for plant development [47] and inducing a favorable effect on crop yield [48]. According to Figure 11, the CSG with crops demonstrated optimal growing conditions between 600 and 1000 ppm CO2. The maximum CO2 concentration was found at 2:00–3:00 h, and the minimum CO2 concentration was found at 17:00–18:00 h in the CSG with crops.

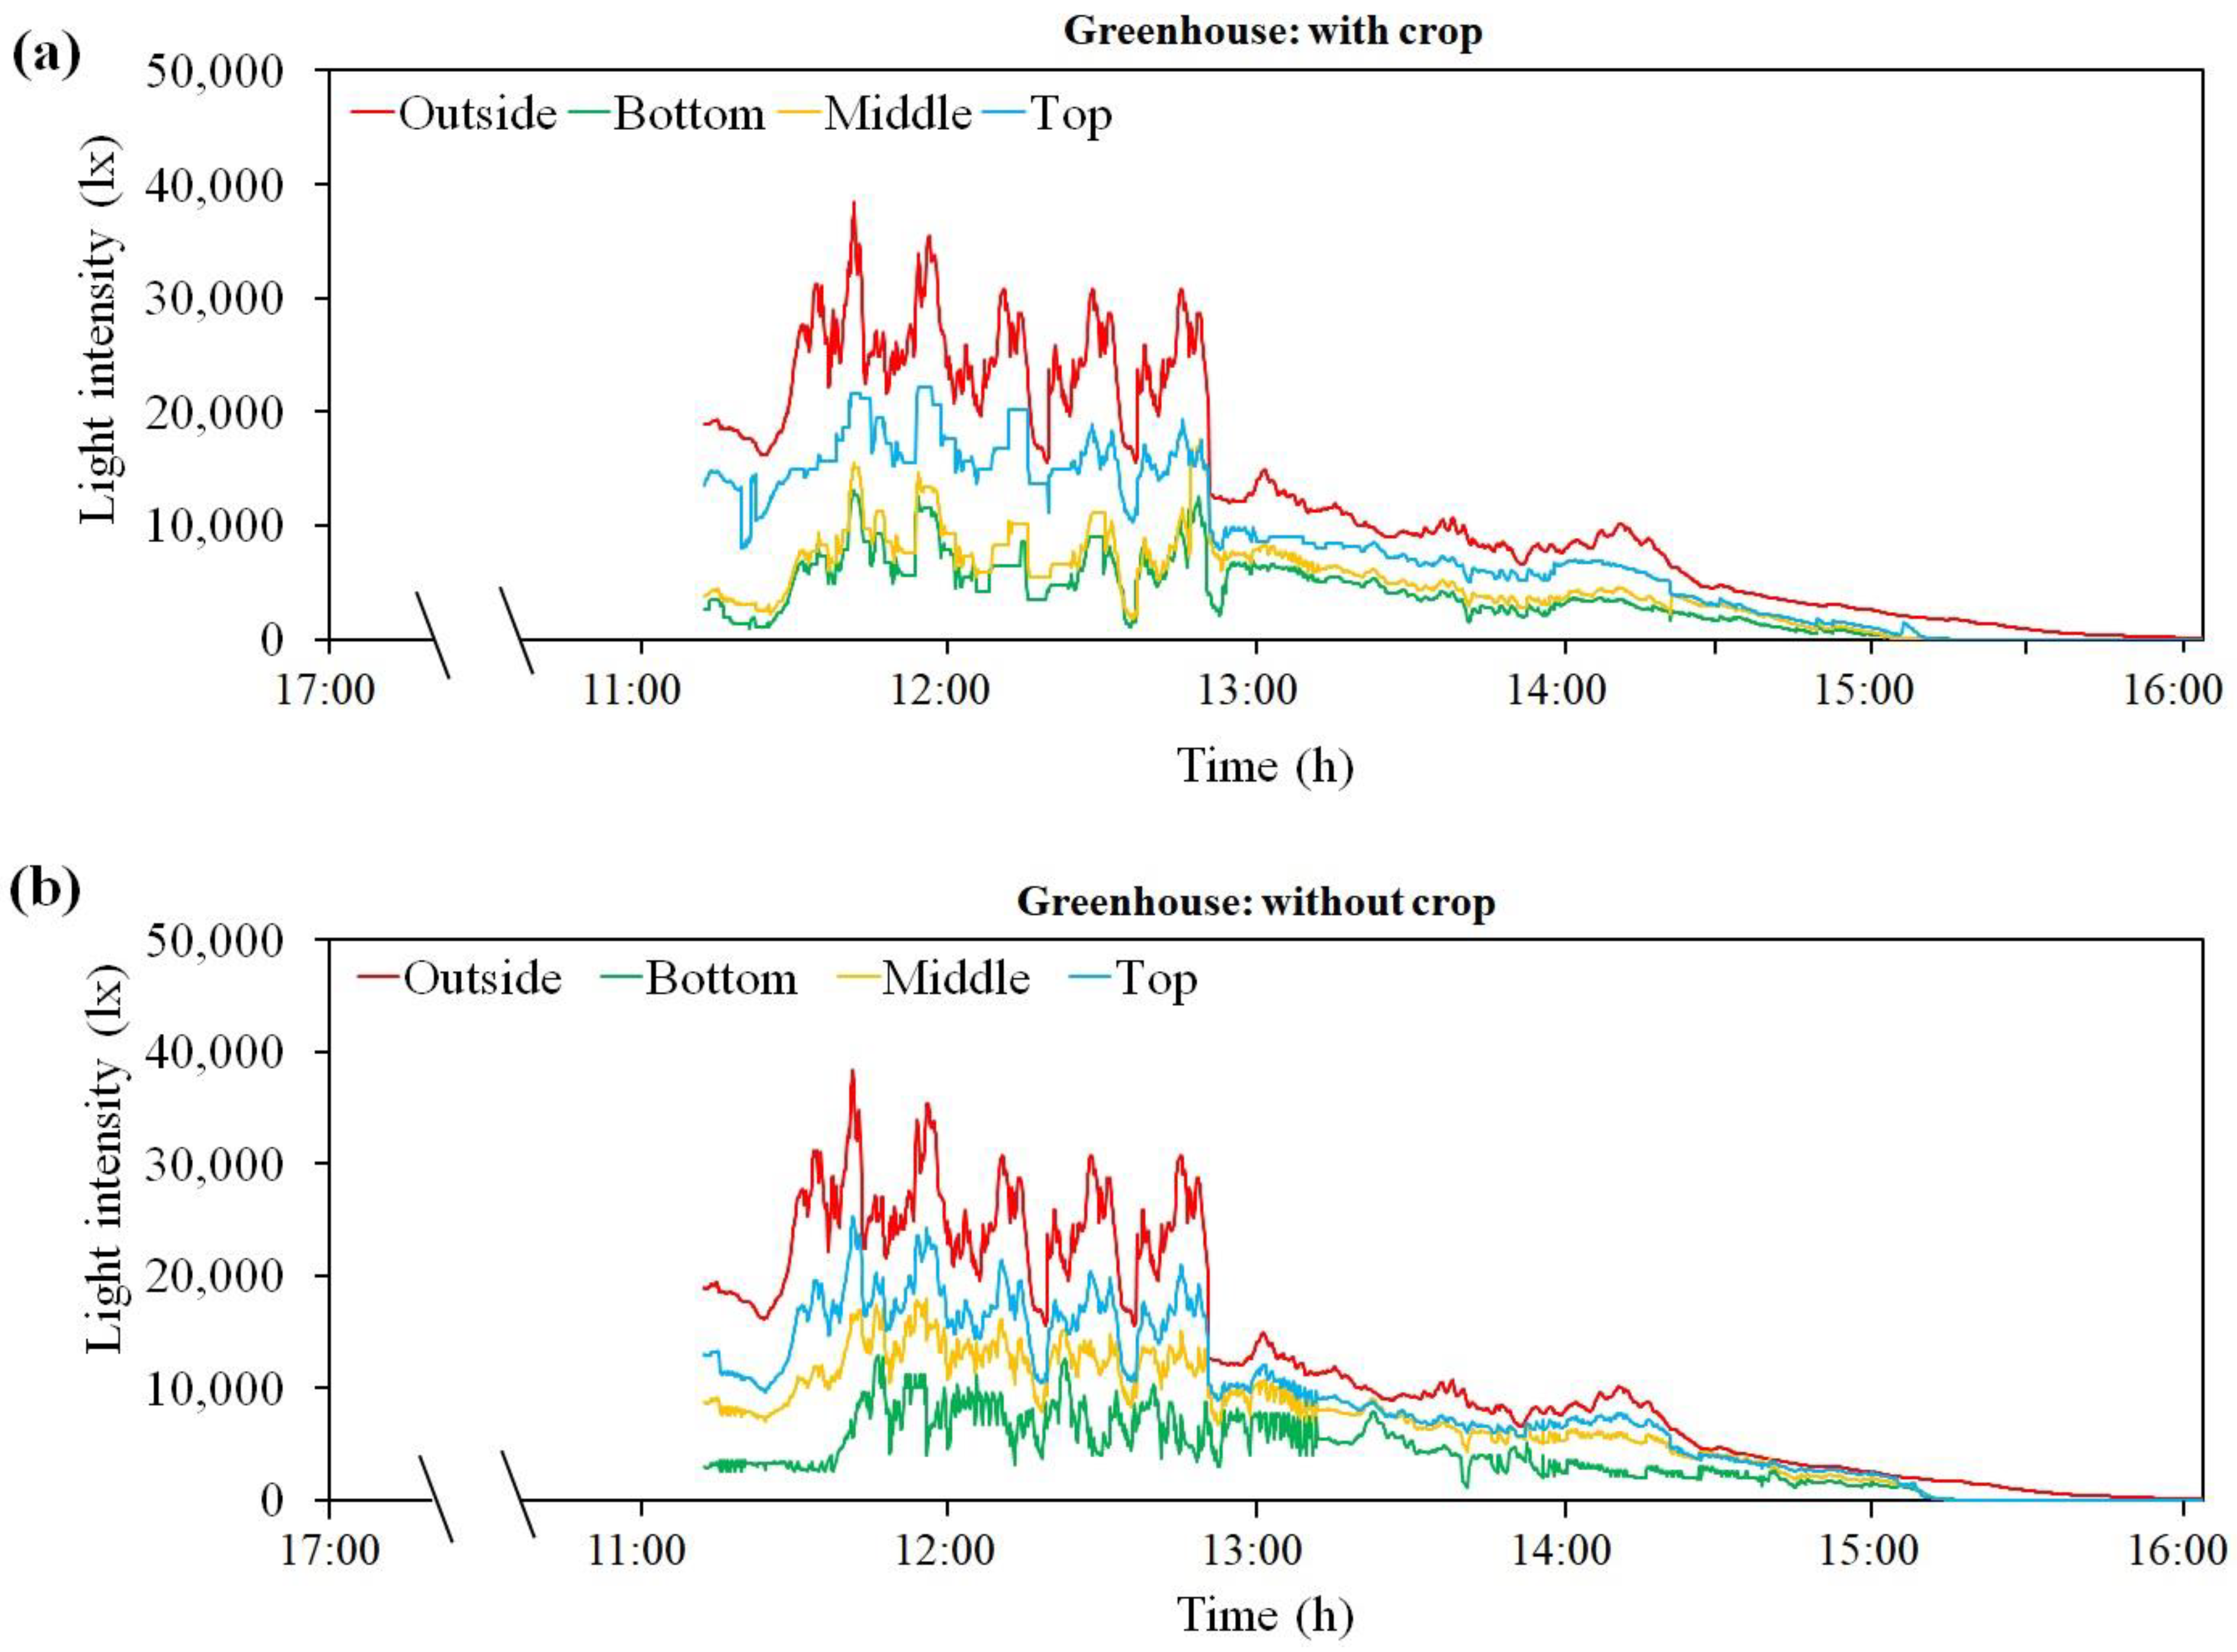
3.3. Solar Radiation and Light Intensity

As the conditions were sunny during the experiment, solar radiation had a direct effect on the CSGs. The maximum average solar radiation was 222.40 Wm−2 from 12:00 h to 13:00 h. Figure 12 shows the total solar radiation for a day at the experimental site. In accordance with the optical properties of the plastic film, the CSG in Shenyang is oriented 5–6° from south to west, which maximizes the amount of sunlight entering the CSG through the south roof. At the same time, it is particularly difficult to measure the actual radiation absorbed by the north wall and the ground [49]. The south roof not only provides proper lighting conditions inside the greenhouse but also provides heat from solar radiation to the wall and ground. The heat accumulated throughout the day was released to maintain a stable environment inside the greenhouse and to fulfill the fundamental temperature needs for crop viability when solar radiation was not available at night. Furthermore, the capacity of the walls and ground to block solar radiation should be taken into consideration while building greenhouses.
The average maximum light intensity outside the greenhouses was 54,612.5 lx (12:00 h to 13:00 h). The average maximum inside light intensity in the CSG without crops was 38,612.5 lx, 44,412.5 lx, and 48,612.5 lx (12:00 h to 13:00 h) in the bottom, middle, and top layers, respectively. The average maximum light intensity in the CSG with crops was 32,660.19 lx, 36,618.12 lx, and 40,660.48 lx (12:00 h to 13:00 h) in the bottom, middle, and top layers, respectively. Figure 13 displays the average outside light intensity and the light intensity at different layers inside two greenhouses, revealing a significant variation pattern throughout the day. Upon opening the curtain at 8:00 h, crop photosynthesis begins, leading to a linear increase in light intensity from 8:30 h to 11:30 h inside each greenhouse. Thereafter, the growth rate declined between 11:30 h and 12:30 h due to decreased CO2 concentration. From 13:00 h to 15:00 h, there was a linear decrease in light intensity, and the cotton blanket was closed at 15:00 h. The average minimum light intensity was 0 lx (20:00 h to 4:00 h) both inside and outside of both greenhouses. It was observed that the CSG with crops had a higher light intensity at the bottom layer compared to the CSG without crops. Additionally, in the CSG with crops, the light intensity was more similar between the bottom and middle layers, whereas the CSG without crops exhibited greater disparity between these layers. Thus, the presence of crops significantly impacted the light intensity distribution within the CSGs. The orientation of the greenhouse plays a crucial role in light distribution. Before midday, the eastern side experiences weaker light, while the western side receives stronger light, and this occurs vice versa in the afternoon [45].
The weather was windy. At midday, the maximum average wind speed was 8.3 ms−1 from the northeast (NE). The wind was from the southeast (SE) in the late afternoon. There was hardly any wind at night. Figure 14 shows the wind direction and speed during the experiment. The wind speed outside the greenhouse played a crucial role in maintaining optimal growing conditions, promoting plant health, and preventing the various issues associated with heat, humidity, diseases, and pollination.

3.4. The Scenario of Sensor Location for Optimum Monitoring and Control

The installation of sensors that are based on variability would be ideal for the best environmental monitoring and management in a greenhouse. When there is more unpredictability in the environment, it would be desirable to have more sensors to monitor the circumstances, but this would raise the cost [50]. Ideally, sensors should be placed at varying heights as the crops grow, with the best positions being near the canopy for luminous intensity and CO2 concentration. For temperature and humidity, sensor placement options include near the ground surface, halfway up the crop canopy, or both. Spatial locations of sensors should consider variability, including average, maximum, and minimum values, as well as the positions of components like windows, heaters, and coolers [51]. Potential sensor installation areas include the center and sides, where windows and entrance gates are located [52]. The specific location of sensors should reflect their intended purpose. Table 2 presents the results of a statistical analysis conducted on temperature and humidity variations within the CSG with crops and the CSG without crops. The aim was to assess whether the data measured at different sensor locations were statistically different.
To determine the significance, the Tukey HSD test was executed. The bar plots displayed in Figure 15 represent the distribution of temperature and humidity data recorded at each layer of the CSG with crops and without crops. Different letters are placed above the bar to indicate the significant differences (at p < 0.05) according to the Tukey HSD test. These distinct letters signify that the groups exhibited statistical differences. The analysis revealed significant differences in temperatures and humidity measured at various locations for both the CSG with crops and the CSG without crops. These findings emphasize the importance of carefully selecting the optimal sensor location, as there may be seasonal differences in the internal greenhouse environment that affect the air temperature data used for internal environment control.
The variability of ambient conditions within a controlled environment is crucial for sensor-based monitoring and control. This study focused on understanding how factors such as temperature, humidity, and light levels vary across different spatial locations, time periods, and vertical heights within these CSGs. Environmental conditions vary among various spatial locations within CSGs, including temperature, humidity, CO2, and light conditions. Precisely measuring and managing these factors requires understanding these differences. Temporal variability involves changes over time in winter, including daily fluctuations. Vertical variability examines the variations in temperature, humidity, and light at different heights from the ground. Given the challenging conditions for plant growth in winter, this study emphasizes the significance of seasonal factors. It seeks to determine how the design and management of CSGs impact the maintenance of ideal conditions. Understanding spatial, temporal, and vertical variations enables growers to implement precise strategies for optimal plant growth and yield, even during unfavorable seasons.
Sensor-based systems are employed to monitor and control the ambient conditions in CSGs effectively. These systems employ a network of strategically positioned sensors within the CSG environment. These sensors provide real-time information about parameters like temperature, humidity, light, CO2 levels, and other relevant parameters. The collected data are then processed and analyzed using advanced algorithms and machine learning techniques. By considering the variability of ambient conditions, sensor-based monitoring and control systems can dynamically adjust environmental parameters to maintain optimal growing conditions for plants. Furthermore, by integrating machine learning algorithms, the system can learn from historical data and make predictions about future variations in ambient conditions. This predictive capability enables proactive adjustments to be made in advance, ensuring that the CSG maintains stable and optimal growing conditions.
Overall, a consideration of the variability of ambient conditions within CSGs is crucial for the successful implementation of sensor-based monitoring and control systems. Increasing the number of sensors and the diversity of their positions would provide more robust insights, although the benefits of using additional sensors should be weighed against their costs. By accurately measuring and responding to these variations, CSGs can provide consistent and ideal growth environments for plants, leading to improved crop yield, quality, and resource efficiency.

4. Conclusions

The aim of this study was to assess the spatial, vertical, and temporal variability of environmental variables in CSGs in winter and to provide basic information that could be used to aid the monitoring and control of environmental factors in CSGs. The average minimum and maximum temperatures inside the CSG without crops were 8.84 °C (5:00 h) and 30.3 °C (12:00 h), respectively; the average minimum and maximum humidity were 25.63% (12:00 h) and 94.26% (15:00 h), respectively. The average minimum and maximum temperatures inside the CSG with crops were 9.96 °C (4:00 h) and 24.5 °C (12:00 h), respectively; the average minimum and maximum humidity were 32.6% (12:00 h) and 92.1% (5:00 h), respectively. The temperature difference between layers in the CSG without crops was approximately 2.2 °C, and the difference between layers in the CSG with crops was approximately 1.4 °C. The temperature increased during the day, and the temperature of the top layer was higher than the temperature of the bottom layer inside the greenhouse without crops. In addition, air mobility within the greenhouse was limited by the effect of crops; consequently, the bottom layer was warmer in the greenhouse with crops than in the greenhouse without crops. The concentration of CO2 in the different layers inside the solar greenhouse with crops was highest at night. The average maximum solar radiation was 222.24 Wm−2 (12:00 h to 13:00 h). The average maximum light intensity in the CSG without crops was 38,612.5 lx, 44,412.5 lx, and 48,612.5 lx (12:00 h to 13:00 h) in the bottom, middle, and top layers, respectively. The average maximum light intensity inside the CSG with crops was 32,660.19 lx, 36,618.12 lx, and 40,660.48 lx from 12:00 h to 13:00 h in the bottom, middle, and top layers, respectively. The crops affected the light intensity inside the greenhouse. At midday, the maximum average wind speed was 8.3 ms−1 from the NE. Variability in the ambient conditions in the greenhouse should be considered for sensor placement and sensor-based monitoring, as well as for effective control of the ambient conditions in CSGs. Future research should focus on long-term monitoring, crop-specific effects, the integration of advanced control systems, and emerging technologies so as to enhance crop productivity and environmental sustainability in CSGs.

Author Contributions

Conceptualization, M.N.R. and S.-O.C.; methodology, M.N.R. and S.-O.C.; software, M.N.R., M.N.I. and M.Z.I.; validation, M.N.R., M.S.N.K., M.C., M.-K.J. and S.-O.C.; formal analysis, M.N.R., M.N.I., M.C., M.A.G. and M.A.; investigation, M.S.N.K., M.-K.J. and S.-O.C.; resources, M.-K.J. and S.-O.C.; data curation, M.N.R., M.N.I., M.C. and M.Z.I.; writing—original draft preparation, M.N.R.; writing—review and editing, M.N.R., M.S.N.K. and S.-O.C.; visualization, M.N.R., M.N.I., M.A.G. and M.A.; supervision, S.-O.C.; project administration, S.-O.C.; funding acquisition, S.-O.C. All authors have read and agreed to the published version of the manuscript.

Funding

This research was supported by the Korea Institute of Planning and Evaluation for Technology in Food, Agriculture, Forestry and Fisheries (IPET) through the Technology Commercialization Support Program, funded by the Ministry of Agriculture, Food and Rural Affairs (MAFRA) (project No. 821051-03), Republic of Korea.

Institutional Review Board Statement

Not applicable.

Informed Consent Statement

Not applicable.

Data Availability Statement

Not applicable.

Conflicts of Interest

The authors declare no conflict of interest.

References

  1. Ray, D.K.; Mueller, N.D.; West, P.C.; Foley, J.A. Yield trends are insufficient to double global crop production by 2050. PLoS ONE 2018, 13, e0198604. [Google Scholar] [CrossRef] [PubMed]
  2. IPCC. Climate Change and Land: An IPCC Special Report on Climate Change, Desertification, Land Degradation, Sustainable Land Management, Food Security, and Greenhouse Gas Fluxes in Terrestrial Ecosystems; Intergovernmental Panel on Climate Change: Geneva, Switzerland, 2019.
  3. Liu, J.; Hull, V.; Godfray, H.C.J.; Tilman, D.; Gleick, P.; Hoff, H.; Pahl-Wostl, C.; Xu, Z.; Chung, M.G.; Sun, J. Nexus approaches to global sustainable development. Nat. Sustain. 2018, 1, 466–476. [Google Scholar] [CrossRef]
  4. Li, T.; Li, H.; Li, Y.; Li, Y. Effects of environment control on tomato growth and fruit quality in greenhouses. J. Agric. Sci. 2018, 10, 197. [Google Scholar]
  5. Liu, X.; Yu, X.; Feng, B. Effects of environmental factors on tomato quality in greenhouses. Int. J. Agric. Biol. 2017, 19, 1235–1240. [Google Scholar]
  6. Hashemabadi, D.; Kashi, A.K.; Babaeian, E.; Hamidoghli, Y. Effects of greenhouse covering materials on the crop performance: A review. Renew. Sustain. Energy Rev. 2019, 103, 61–76. [Google Scholar]
  7. Migliaro, D.; Giuffrida, F.; Leonardi, C. Greenhouse tomato fruit quality. Sci. Hortic. 2015, 197, 601–611. [Google Scholar]
  8. Righini, H.; Rodriguez, J.P.; Arancibia, R.A.; Ortiz, R. Lettuce production in controlled environments. Acta Hortic. 2011, 918, 229–234. [Google Scholar]
  9. Sanchez-Molina, J.A.; Ming, L.; Rodriguez, F.; Guzman, J.L.; Hui, W.; Xinting, Y. Development and test verification of air temperature model for Chinese solar and Spainish Almeria-type greenhouses. Int. J. Agric. Biol. Eng. 2017, 10, 66–76. [Google Scholar] [CrossRef]
  10. Fuller, R.; Zahnd, A. Solar greenhouse technology for food security: A case study from Humla District, NW Nepal. Mt. Res. Dev. 2012, 32, 411–419. [Google Scholar] [CrossRef]
  11. Qiu, R.; Du, T.; Kang, S.; Chen, R.; Wu, L. Assessing the SIMDualKc model for estimating evapotranspiration of hot pepper grown in a solar greenhouse in Northwest China. Agric. Syst. 2015, 138, 1–9. [Google Scholar] [CrossRef]
  12. Song, H.; Guo, J.; Ren, T.; Chen, Q.; Li, B.; Wang, J. Increase of soil pH in a solar greenhouse vegetable production system. Soil Sci. Soc. Am. J. 2012, 76, 2074–2082. [Google Scholar] [CrossRef]
  13. Xu, Q.; Hu, K.; Zhang, H.; Han, H.; Li, J. Organic vegetable cultivation reduces resource and environmental costs while increasing farmers’ income in the North China Plain. Agronomy 2020, 10, 361. [Google Scholar] [CrossRef]
  14. Al-Masri, M.R.; Al-Ghouti, M.A. Sustainable greenhouse production during the winter season. Int. J. Environ. Sci. Technol. 2021, 18, 593–604. [Google Scholar]
  15. Hong, S.Y.; Kim, S.H.; Kwon, Y.S. Performance of a semi-transparent photovoltaic greenhouse for winter crop production. J. Renew. Sustain. Energy 2018, 10, 013703. [Google Scholar]
  16. Wang, Y.; Zhen, Y. The low-temperature response of greenhouse crops: A review. Acta Hortic. 2017, 1164, 225–230. [Google Scholar]
  17. Liu, X.; Wu, X.; Xia, T.; Fan, Z.; Shi, W.; Li, Y.; Li, T. New insights of designing thermal insulation and heat storage of Chinese solar greenhouse in high latitudes and cold regions. Energy 2022, 242, 122953. [Google Scholar] [CrossRef]
  18. Huang, B.; Zhu, X.; Shi, Z.; Zhou, L.; Guo, X. Performance of a semi-underground solar greenhouse for vegetable production in Northwest China. Energy Build. 2022, 222, 110087. [Google Scholar]
  19. Singh, M.C.; Singh, J.; Singh, K. Development of a microclimate model for prediction of temperatures inside a naturally ventilated greenhouse under cucumber crop in soilless media. Comput. Electron. Agric. 2018, 154, 227–238. [Google Scholar] [CrossRef]
  20. Lee, C.K.; Chung, M.; Shin, K.Y.; Im, Y.H.; Yoon, S.W. A study of the effects of enhanced uniformity control of greenhouse environment variables on crop growth. Energies 2019, 12, 1749. [Google Scholar] [CrossRef]
  21. Saberian, A.; Sajadiye, S.M. The effect of dynamic solar heat load on the greenhouse microclimate using CFD simulation. Renew. Energy 2019, 138, 722–737. [Google Scholar] [CrossRef]
  22. Yang, L.; Liu, H.; Cohen, S.; Gao, Z. Microclimate and Plant Transpiration of Tomato (Solanum lycopersicum L.) in a Sunken Solar Greenhouse in North China. Agriculture 2022, 12, 260. [Google Scholar] [CrossRef]
  23. Hou, Y.; Li, A.; Li, Y.; Jin, D.; Tian, Y.; Zhang, D.; Wu, D.; Zhang, L.; Lei, W. Analysis of microclimate characteristics in solar greenhouses under natural ventilation. Build. Simul. 2021, 14, 1811–1821. [Google Scholar] [CrossRef]
  24. Liu, Y.; Liu, X.; Chai, Y.; Yang, L.; Wei, W.; Gu, J.; Kang, H. Experimental study on indoor environmental factors of double film solar greenhouse and traditional Chinese greenhouse in cold region. Energy Explor. Exploit. 2022, 40, 1760–1787. [Google Scholar] [CrossRef]
  25. Dong, S.; Ahamed, M.S.; Ma, C.; Guo, H. A time-dependent model for predicting thermal environment of mono-slope solar greenhouses in cold regions. Energies 2021, 14, 5956. [Google Scholar] [CrossRef]
  26. Ryu, M.J.; Ryu, D.K.; Chung, S.O.; Hur, Y.K.; Hur, S.O.; Hong, S.J.; Sung, J.H.; Kim, H.H. Spatial, vertical, and temporal variability of ambient environments in strawberry and tomato greenhouses in winter. J. Biosyst. Eng. 2014, 39, 47–56. [Google Scholar] [CrossRef]
  27. Fan, X.; Chengwei, M.; Mei, Q.; Yang, L.; Binbin, G.; Jianyu, Z.; Yanfei, C.; Guotao, S.; Chenxia, L. Investigation and assessment on microclimate environment of solar greenhouse in North China. Chin. J. Agrometeorol. 2014, 35, 17–25. [Google Scholar]
  28. Ahamed, M.S.; Guo, H.; Tanino, K. Sensitivity analysis of CSGHEAT model for estimation of heating consumption in a Chinese-style solar greenhouse. Comput. Electron. Agric. 2018, 154, 99–111. [Google Scholar] [CrossRef]
  29. Tadj, N.; Bartzanas, T.; Fidaros, D.; Draoui, B.; Kittas, C. Influence of heating system on greenhouse microclimate distribution. Trans. ASABE 2010, 53, 225–238. [Google Scholar] [CrossRef]
  30. Wei, M.; Xing, Y.; Wang, X.; Ma, H. CO2 environment in solar greenhouse in Northern China and effects of CO2 enrichment on photosynthetic rate and dry matter production of cucumber. Acta Hortic. 2002, 633, 115–120. [Google Scholar] [CrossRef]
  31. Touhami, A.; Benahmed, K.; Parra, L.; Bounaama, F.; Lloret, J. An intelligent monitoring of greenhouse using wireless sensor networks. Smart Struct. Syst. 2020, 26, 117–134. [Google Scholar]
  32. Wang, L.; Wang, B. Greenhouse microclimate environment adaptive control based on a wireless sensor network. Int. J. Agric. Biol. Eng. 2020, 13, 64–69. [Google Scholar] [CrossRef]
  33. Nicolosi, G.; Volpe, R.; Messineo, A. An innovative adaptive control system to regulate microclimatic conditions in a greenhouse. Energies 2017, 10, 722. [Google Scholar] [CrossRef]
  34. Azaza, M.; Tanougast, C.; Fabrizio, E.; Mami, A. Smart greenhouse fuzzy logic based control system enhanced with wireless data monitoring. ISA Trans. 2016, 61, 297–307. [Google Scholar] [CrossRef] [PubMed]
  35. Ferentinos, K.P.; Katsoulas, N.; Tzounis, A.; Bartzanas, T.; Kittas, C. Wireless sensor networks for greenhouse climate and plant condition assessment. Biosyst. Eng. 2017, 153, 70–81. [Google Scholar] [CrossRef]
  36. Balendonck, J.; Van Os, E.A.; Van Der Schoor, R.; Van Tuijl, B.A.J. Monitoring spatial and temporal distribution of temperature and relative humidity in greenhouses based on wireless sensor technology. Trials 2010, 52, 443–452. [Google Scholar]
  37. Liu, Z.; Zhang, J.; Li, S. Research into key techniques of the agricultural greenhouse monitoring system based on internet of things. Int. J. Smart Home 2016, 10, 1–10. [Google Scholar] [CrossRef]
  38. Iqbal, Z.; Islam, N.; Jang, B.E.; Ali, M.; Kabir, M.S.N.; Lee, D.H.; Na, K.D.; Park, S.B.; Chung, S.O. Monitoring the operating status of an automatic harmful fly collector for smart greenhouses. J. Biosyst. Eng. 2019, 44, 258–268. [Google Scholar] [CrossRef]
  39. Wang, Y.; Chi, Z. System of wireless temperature and humidity monitoring based on Arduino Uno platform. In Proceedings of the 2016 Sixth International Conference on Instrumentation & Measurement, Computer, Communication and Control (IMCCC), Harbin, China, 21–23 July 2016. [Google Scholar] [CrossRef]
  40. Wei, B.; Guo, S.; Wang, J.; Li, J.; Wang, J.; Zhang, J.; Qian, C.; Sun, J. Thermal performance of single span greenhouses with removable back walls. Biosyst. Eng. 2016, 141, 48–57. [Google Scholar] [CrossRef]
  41. Ruiz-Nieves, J.M.; Ayala-Garay, O.J.; Serra, V.; Dumont, D.; Vercambre, G.; Génard, M.; Gautier, H. The effects of diurnal temperature rise on tomato fruit quality. Can the management of the greenhouse climate mitigate such effects? Sci. Hortic. 2021, 278, 109836. [Google Scholar] [CrossRef]
  42. Tang, Y.; Ma, X.; Li, M.; Wang, Y. The effect of temperature and light on strawberry production in a solar greenhouse. Sol. Energy 2020, 195, 318–328. [Google Scholar] [CrossRef]
  43. Vadiee, A.; Martin, V. Energy management in horticultural applications through the closed greenhouse concept, state of the art. Renew. Sustain. Energy Rev. 2012, 16, 5087–5100. [Google Scholar] [CrossRef]
  44. Zhao, J.; Li, Z.; Wang, W.; Li, J.; Cao, R. Spatial and temporal distribution test and analysis of tomato planting environment parameters in solar greenhouse. J. Shanxi Agric. Sci. 2019, 47, 2172–2176+2181. [Google Scholar]
  45. Zhang, C.; Liu, H.; Wang, C.; Zong, Z.; Wang, H.; Zhao, X.; Wang, S.; Li, Y. Testing and analysis on the spatial and temporal distribution of light intensity and co2 concentration in solar greenhouse. Sustainability 2023, 15, 7001. [Google Scholar] [CrossRef]
  46. Rangaswamy, T.C.; Sridhara, S.; Ramesh, N.; Gopakkali, P.; El-Ansary, D.O.; Mahmoud, E.A.; Abdelmohsen, S.A.; Abdelbacki, A.M.; Elansary, H.O.; Abdel-Hamid, A.M. Assessing the impact of higher levels of CO2 and temperature and their interactions on tomato (Solanum lycopersicum L.). Plants 2021, 10, 256. [Google Scholar] [CrossRef] [PubMed]
  47. Kellogg, W.W.; Schware, R. Climate Change and Society: Consequences of Increasing Atmospheric Carbon Dioxide; Routledge: London, UK, 2019. [Google Scholar]
  48. Sokolov, S. Optimization of greenhouse microclimate parameters considering the impact of CO2 and light. J. Eng. Sci. 2023, 10, G14–G21. [Google Scholar] [CrossRef]
  49. Zhang, X.; Lv, J.; Xie, J.; Yu, J.; Zhang, J.; Tang, C.; Li, J.; He, Z.; Wang, C. Solar Radiation allocation and spatial distribution in Chinese solar greenhouses: Model development and application. Energies 2020, 13, 1108. [Google Scholar] [CrossRef]
  50. Ryu, M.J.; Chung, S.O.; Kim, K.D.; Huh, Y.K.; Hur, S.O.; Ha, S.K.; Han, K.H.; Kim, H.H. Determination of sensor locations for monitoring of greenhouse ambient environment. In Proceedings of the 11th International Conference on Precision Agriculture, Indianapolis, IN, USA, 15–18 July 2012. [Google Scholar]
  51. Arnesano, M.; Revel, G.; Seri, F. A tool for the optimal sensor placement to optimize temperature monitoring in large sports spaces. Autom. Constr. 2016, 68, 223–234. [Google Scholar] [CrossRef]
  52. Feng, L.; Li, H.; Zhi, Y. Greenhouse CFD simulation for searching the sensors optimal placements. In Proceedings of the 2013 Second International Conference on Agro-Geoinformatics (Agro-Geoinformatics), Fairfax, VA, USA, 12–16 August 2013. [Google Scholar]
Figure 1. Experimental CSGs at Shenyang Agriculture University, Liaoning, China: (a) cross-sectional view of the CSG, (b) exterior view of the CSG without crops, (c) interior view of the CSG without crops, (d) external view of the GSG with crops, and (e) interior view of the CSG with crops.
Applsci 13 09835 g001
Figure 2. The wiring connection of (a) nRF24L01, Arduino UNO, and environmental sensors ((i) temperature and humidity, (ii) CO2, (iii) light sensor, (iv) solar radiation, and (v) wind speed and direction) as a transmitter node, and (b) nRF24L01 and Arduino UNO as a receiver node.
Applsci 13 09835 g002
Figure 3. Wireless sensor network (WSN) during the experiment: (a) positions of the sensors in both greenhouses, (b) sensor-to-sensor distance inside and outside of the greenhouse, (c) arrangement of the sensor nodes inside the greenhouse with plants, and (d) positions of the external sensors on top of the greenhouse.
Applsci 13 09835 g003
Figure 4. (a) Schematic diagram of the data receiving, processing, and transmission process, as well as the visualization and monitoring using the PLX-DAQ tool. (b) Data visualization using PLX- DAQ from the sensor nodes and gateway.
Applsci 13 09835 g004
Figure 5. Temporal variation in the temperature inside both greenhouses in different layers and the temperature outside the greenhouses.
Applsci 13 09835 g005
Figure 6. Temporal variation in the humidity inside both greenhouses in different layers and the temperature outside the greenhouses.
Applsci 13 09835 g006
Figure 7. Temperature distribution inside the CSG with crops. (a) The average temperature distribution for 11:00–12:00 h, (b) the average temperature distribution for 16:00–17:00 h, and (c) the average temperature distribution for 22:00–23:00 h.
Applsci 13 09835 g007
Figure 8. Temperature distribution inside the CSG without crops. (a) The average temperature distribution for 11:00–12:00 h, (b) the average temperature distribution for 16:00–17:00 h, and (c) the average temperature distribution for 22:00–23:00 h.
Applsci 13 09835 g008
Figure 9. Humidity distribution inside the CSG with crops. (a) The average humidity distribution for 11:00–12:00 h, (b) the average humidity distribution for 16:00–17:00 h, and (c) the average humidity distribution for 22:00–23:00 h.
Applsci 13 09835 g009
Figure 10. Humidity distribution inside the CSG without crops (a) The average humidity distribution for 11:00–12:00 h, (b) the average humidity distribution for 16:00–17:00 h, and (c) the average humidity distribution for 22:00–23:00 h.
Applsci 13 09835 g010
Figure 11. The ambient CO2 concentrations inside the solar greenhouses: (a) with crops and (b) without crops.
Applsci 13 09835 g011
Figure 12. Outside solar radiation at the experimental site.
Applsci 13 09835 g012
Figure 13. Different layers in the light intensity inside and outside the greenhouses: (a) with crops and (b) without crops.
Applsci 13 09835 g013
Figure 14. Wind speed and direction at the experimental site.
Applsci 13 09835 g014
Figure 15. The bar graph depicts the measured temperature and humidity data from different sensor locations in the CSG with and without plants. The letters placed above the bar represent the significant differences (at p < 0.05) determined through the Tukey HSD test.
Applsci 13 09835 g015
Table 1. Environmental variables measured, and the specification of sensors used.
VariableTemperatureHumidityCO2Light IntensitySolar RadiationWind SpeedWind Direction
ModelAM2315AM2315SH-300-NDBH1750FVIWatchdog 3670WS2Davis 7911Davis 7911
Range−20–80 °C0–100%0–3000 ppm0–65,535 lx0–1500
W m−2
0.5–89
m s−1
0°–360°
Resolution0.1 °C0.1%1 ppm0.1 lx0.1 W m−20.1 m s−1
Accuracy±0.1 °C2%2%±5%±1%±5%
Table 2. Statistical analysis on the temperature and humidity variations within the CSG with and the CSG without crops.
TreatmentCSG with CropsCSG without Crops
Temperature (°C)Humidity (%)Temperature (°C)Humidity (%)
T111.950 c68.112 b18.783 a67.217 b
T213.274 b64.196 c16.821 b65.837 c
T314.002 a70.715 a15.483 c69.058 a
CV5.022.135.012.27
LSD0.45871.00820.47521.0093
Significance (%)************
a,b,c Different letters in the same column indicate different data levels (p  0.05). T1 = bottom layer, T2 = middle layer, T3 = top layer, CV = coefficient of variance (%), Sig = level of significance (*** highly significant).
Disclaimer/Publisher’s Note: The statements, opinions and data contained in all publications are solely those of the individual author(s) and contributor(s) and not of MDPI and/or the editor(s). MDPI and/or the editor(s) disclaim responsibility for any injury to people or property resulting from any ideas, methods, instructions or products referred to in the content.

