Article

Prediction of Part Shrinkage for Injection Molded Crystalline Polymer via Cavity Pressure and Melt Temperature Monitoring

1
R&D Center for Smart Manufacturing, Chung Yuan Christian University, Taoyuan 32023, Taiwan
2
R&D Center for Semiconductor Carrier, Chung Yuan Christian University, Taoyuan 32023, Taiwan
*
Author to whom correspondence should be addressed.
Appl. Sci. 2023, 13(17), 9884; https://doi.org/10.3390/app13179884
Submission received: 6 July 2023 / Revised: 16 August 2023 / Accepted: 28 August 2023 / Published: 31 August 2023

Abstract

:
During an injection molding process, different parts of the molded material are subjected to various thermal–mechanical stresses, such as variable pressures, temperatures, and shear stresses. These variations form different pressure–temperature paths on the pressure–volume–temperature diagram. If these paths cannot converge at a specific target volume value during ejection, it often leads to different levels of shrinkage and associated warping, which pose a significant challenge for molders during mold trials and part quality control. The situation is particularly complicated when molding crystalline polymers because the degree of crystallinity depends on the processing conditions and may vary across different locations. In this study, we propose an innovative and practical approach to improving part shrinkage when molding crystalline polymers. For the first time, we utilized melt temperature profile monitoring rather than the previous mold temperature measurement to detect the crystallization process and determine the time taken to complete the crystallization at different melt and mold temperatures. In addition, we used response surface methodology to build a crystallization time prediction model. The feasibility of the prediction model was verified by determining the warpage of parts molded at various cooling times. Based on this model, we varied the packing pressure, packing time, and melt temperatures to determine the correlation with part shrinkage. Through regression analysis, the time-averaged solidification pressure values can accurately control part shrinkage. Two prediction models provide reasonable accuracy and efficiency for part shrinkage control, as demonstrated by subsequent verification experiments.

1. Introduction

Injection molding is a widely used process for mass production of plastic parts owing to its advantages, such as net shaping of complex geometry parts, allowing the use of various materials, and rapid production times. However, part quality can be influenced by numerous factors, such as material properties, mold design, part geometry, and processing conditions [1,2,3,4]. During the injection molding process, different parts of the molded material are subjected to various thermal–mechanical stresses due to disparities in pressure, temperature, shear stress, and other factors. These variations form different pressure–temperature paths on the pressure–volume–temperature (PVT) diagram. If these paths cannot converge or meet at a common, specific volume value during ejection, they can lead to uneven shrinkage and warping [2,3,4]. Achieving high dimensional accuracy and defect-free parts is a challenge for molders in their daily operations since they rely heavily on their molding expertise to conduct mold trials. Although computer-aided engineering simulations conducted in various commercial software programs can assist in identifying more suitable processing conditions, issues such as path differences in pressure and temperature and molding-induced molecular orientation remain. These issues cause anisotropic properties and uneven shrinkage, which are difficult to solve. Previous research has focused on shrinkage issues based on PVT relationships [3,4,5,6,7,8,9,10]. The influence of factors such as cavity pressure, mold temperature, filling-to-packing switchover, and other factors on shrinkage has also been reported [11,12,13,14]. Generally, the melt temperature, mold temperature, packing pressure, and packing time, including the profiled packing pressure and multistage packing, are critical factors that significantly influence the final part shrinkage. For crystalline polymers, the PVT relationship diagram is even more complicated because of phase changes (Figure 1a) [15].
Controlling the extent of molded part shrinkage in crystalline polymers is particularly difficult because the processing conditions also affect the degree of crystallinity (DOC) [16,17,18,19], which plays a significant role in determining part shrinkage. To avoid the ambiguity of DOC-induced uncertainties for shrinkage or PVT behavior (Figure 1b), the solidification process during crystallization is often monitored [17,18,19,20]. Previous studies have reported methods for detecting crystallization. Because of the limitations of contact-type temperature sensors, the detection of crystallization or the associated enthalpy transformation [21,22,23] must be combined with a temperature profile simulation within the melt. Usually, this involves assuming the crystallization kinetics [23] and verifying the temperature profile at the cavity surface where the temperature is measured. To solve this limitation, we proposed an infrared-type temperature sensor manufactured by Futaba. The infrared sensor, whose validity was verified in earlier studies [24,25], can detect the temperature inside the melt (Figure 2), particularly the melt temperature in the center of the cavity gap, where the maximum temperature occurs [26]. By analyzing the variation in the measured melt temperature profile, the enthalpy transformation process and the start and end of crystallization can be determined. The cooling rate decreases during the crystallization process because of the release of latent heat. Upon the completion of crystallization, the cooling rate increases and reverts to the original variation trend. Thus, the crystallization completion time can be identified from the slope of the temperature variation curve. The minimum value, indicating the end of crystallization, can be observed on the measured temperature profile. Crystallization and DOC are not only influenced by solidification characteristics but also by packing parameters. In this study, we used the enthalpy transformation detection method to determine the crystallization time at various melt and mold temperatures under the appropriate packing parameters. First, a prediction model for the crystallization time was built using response surface methodology (RSM) [27,28]. The applicability of the crystallization completion model was assessed by analyzing the warpage of the parts molded at various cooling times. When the post-filling time (i.e., the packing plus cooling time) was larger than the crystallization time, the part warpage remained relatively constant, indicating that incomplete crystallization did not significantly contribute to the warpage. Once crystallization completion is confirmed, molding conditions can be adjusted and optimized accordingly. The influence of packing-based parameters on part shrinkage, including packing pressure and time at various melt temperatures, was then analyzed using regression analysis. A prediction model for part shrinkage variation and time-averaged packing pressure was constructed. Both models were verified via experiments to test the accuracy of the predictions. The verified prediction models can serve as useful guidelines for improving and optimizing molded part shrinkage. For further understanding of processing conditions on part qualities based on the morphology view point, one can refer to the study by Pantani et al. [29].

2. Experimental Procedure

2.1. Equipment

The experiments were performed using 150-ton-capacity FCS HT-150-SV injection molding machines. This machine uses a servoelectric system to achieve a high-accuracy injection dose and high-precision injection speed simultaneously.
A water-based mold temperature controller, BYW-1220FS, produced by CENS in Taiwan, was used. The maximum water temperature that can be reached with this equipment is 120 °C.
The molded specimen was a flat plate with 3 mm thickness, 100 mm length, and 80 mm width. The thickness of the fan gate was 2.4 mm (Figure 3a). Three temperature sensors (Futaba EPSSZT, Amplifier EPT-001) were installed on the sides of the cavity, and three pressure sensors (PRIAMUS 6001A, Amplifier 5050A) were embedded on the opposite core side. The corresponding locations along the melt flow direction are depicted in Figure 3b. The Futaba infrared temperature sensor usually detects the maximum melt temperature, which is usually present in the center of the cavity gap. A three-dimensional laser scanner (SICK, Ranger 3–30) was used to measure the part height, from which the warpage at seven specified locations can be obtained (Figure 3b). The shrinkage can be determined by comparing the measured part length with the designed cavity length (Figure 3c).

2.2. Molding Materials Used

Polypropylene (PP-7533), produced by LCY, was used for the experiments. The suggested molding temperature range was between 190 °C and 270 °C, and the mold temperature was between 20 °C and 50 °C.

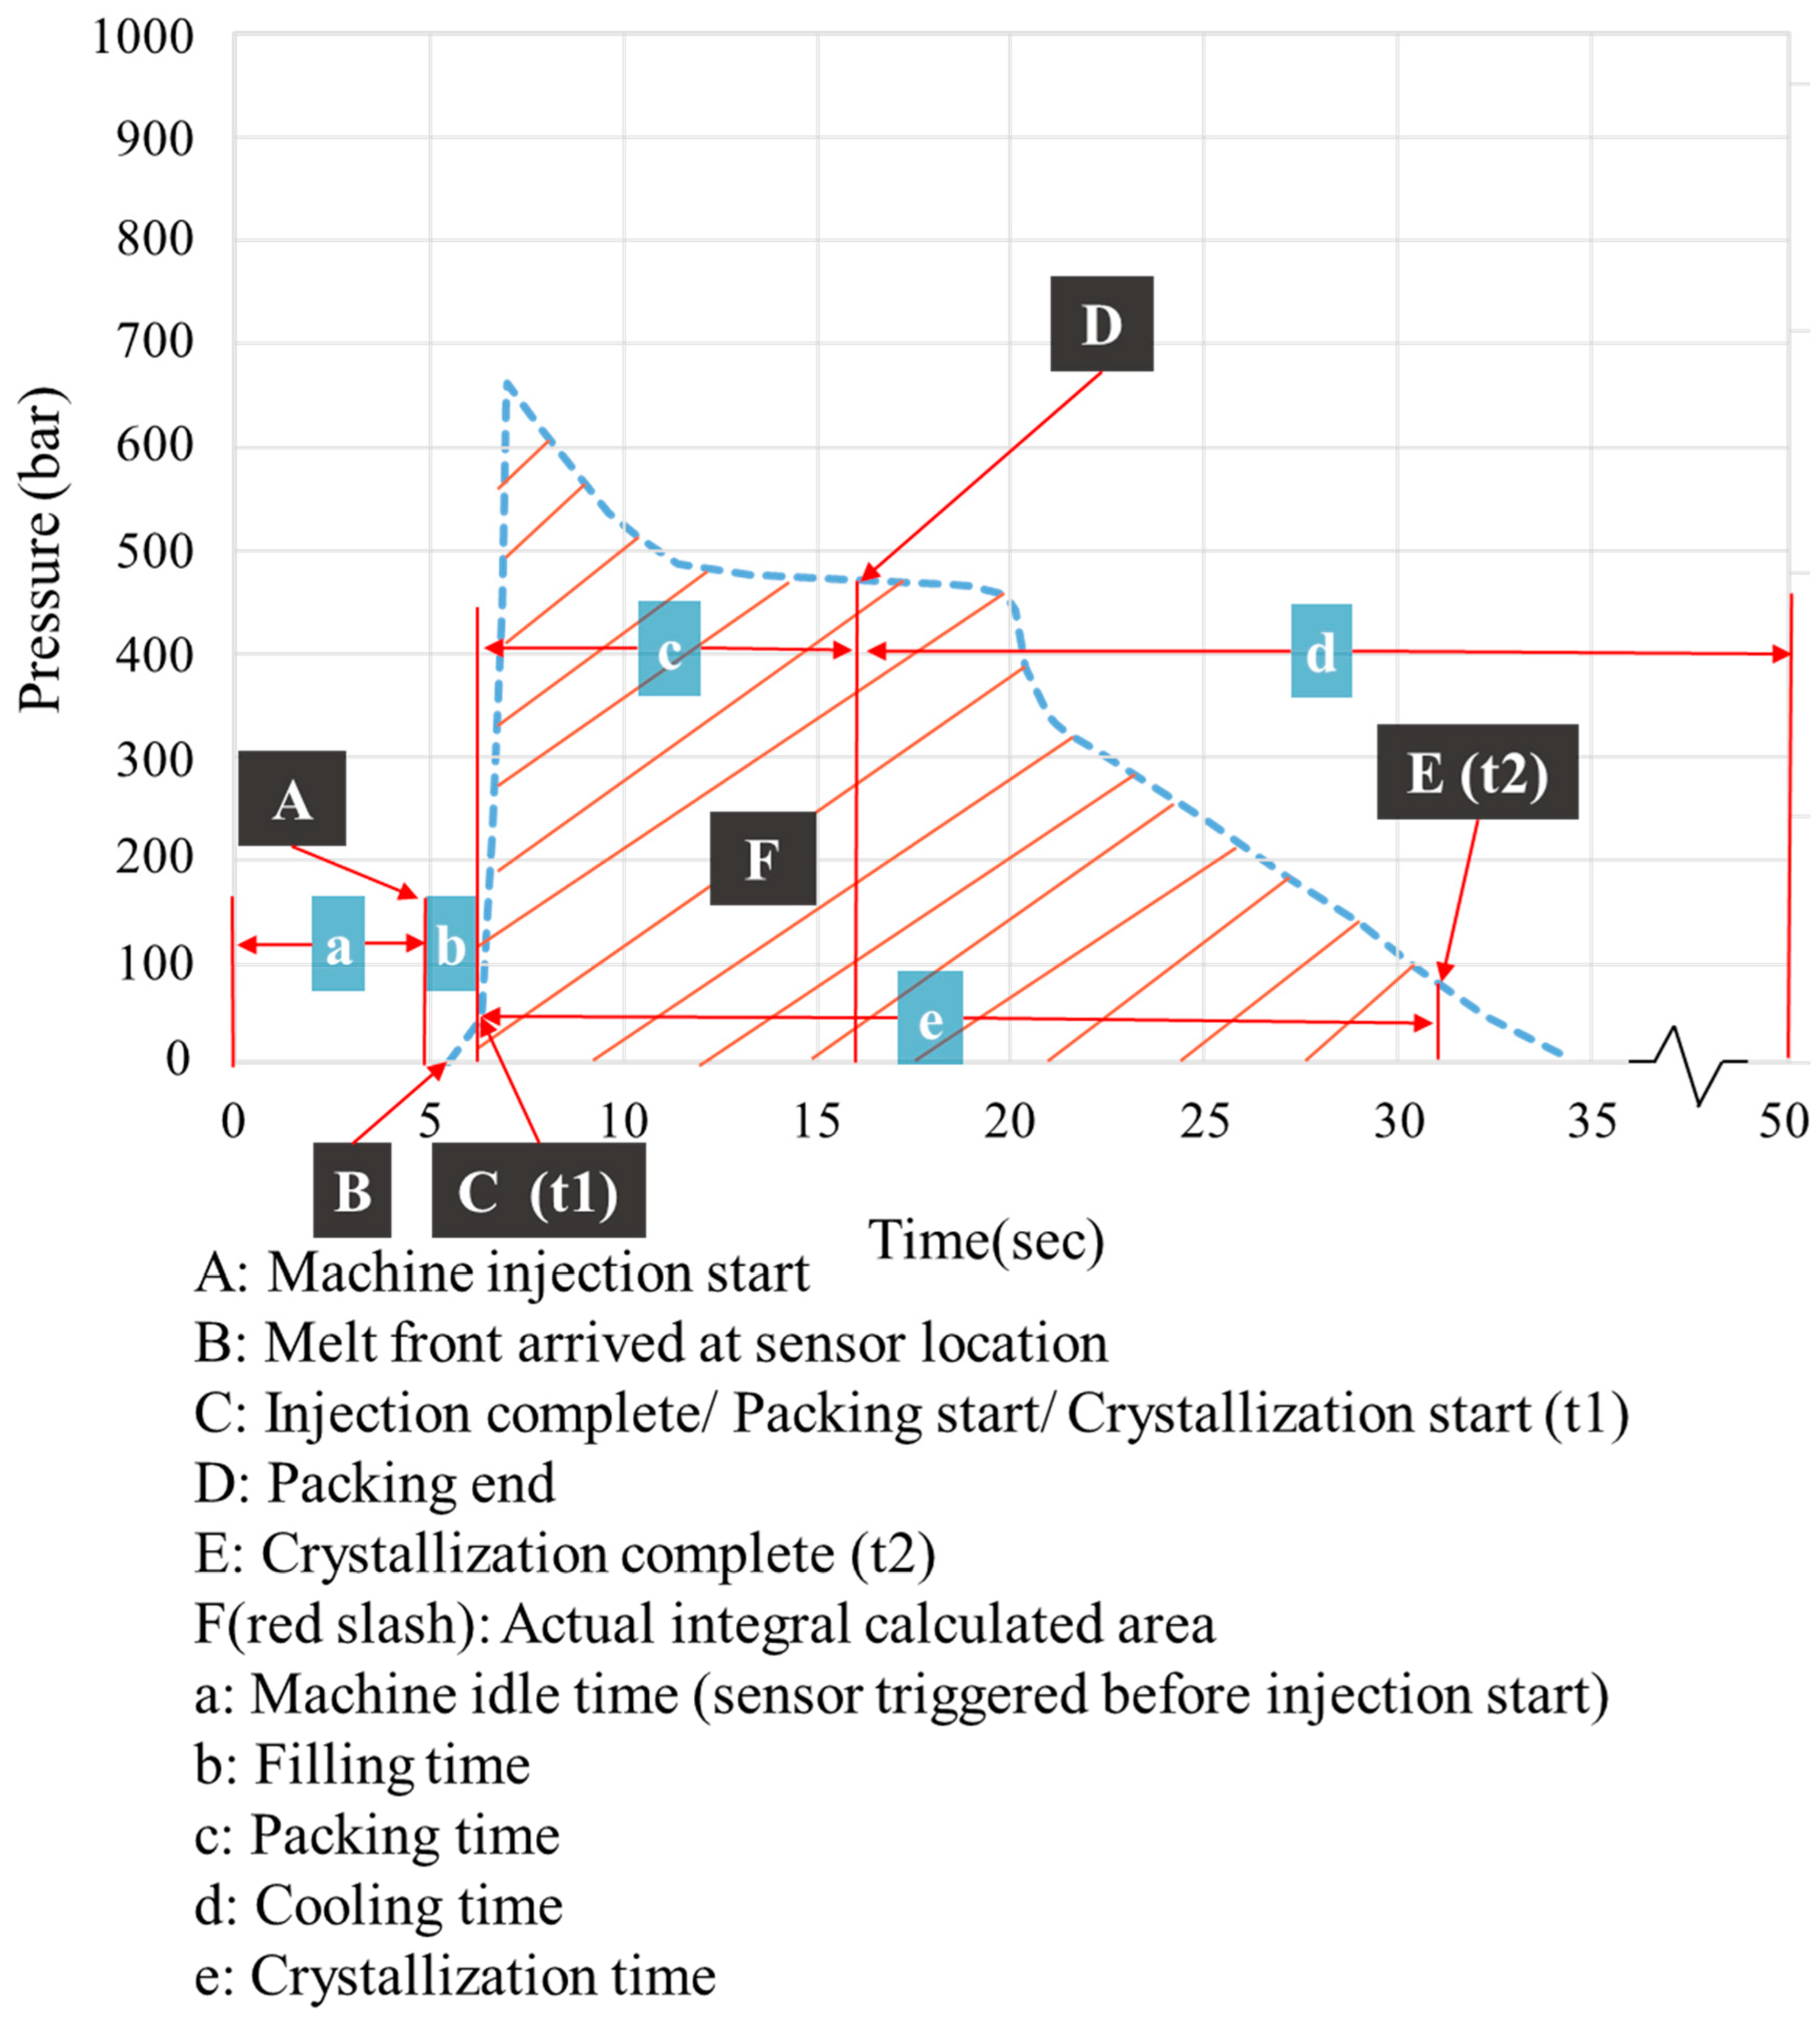
2.3. Verification and Prediction Model for the Complete Crystallization Time

Injection molding was performed using the processing conditions listed in Table 1. For each molding condition, five samples were molded. The injection speed, packing pressure, and packing time were determined using preliminary molding trials to avoid unnecessary influence on the crystallization process. The cooling time was set to a duration that ensured complete crystallization. The fixed molding parameters are shown in Table 1. The temperature profile was monitored during each set of experiments. Three melt temperature stages can be identified from the temperature profile shown in Figure 4. The melt temperature drops quickly in the initial stage. In the second stage, crystallization (or a phase change) occurs at a fixed temperature and is associated with heat release. In the third stage, the melt temperature decreases slowly (Figure 4). Once crystallization is complete, the melt temperature decreases at a specific rate, constituting the third stage of the temperature profile. The completion of crystallization and the crystallization time can be determined from the time at which the minimum slope of melt temperature variation occurs and/or the end of the temperature plateau. To avoid ambiguity, the crystallization completion time was identified as the time when the minimum cooling rate occurs. A schematic illustrating this is shown in Figure 5a,b. To establish an initial prediction model for the crystallization time, RSM [25,26] was used based on the results obtained from thirteen sets of experiments. This model is based on a second-order polynomial and is as follows:
tcrys. = A + B × Tmold + C × Tmelt + D × Tmold 2 + E × Tmelt 2 + F × Tmelt × Tmold
where tcrys denotes the crystallization completion time, Tmelt is the melt temperature, and Tmold is the mold temperature. A residual analysis was conducted to make the necessary adjustments to the model.

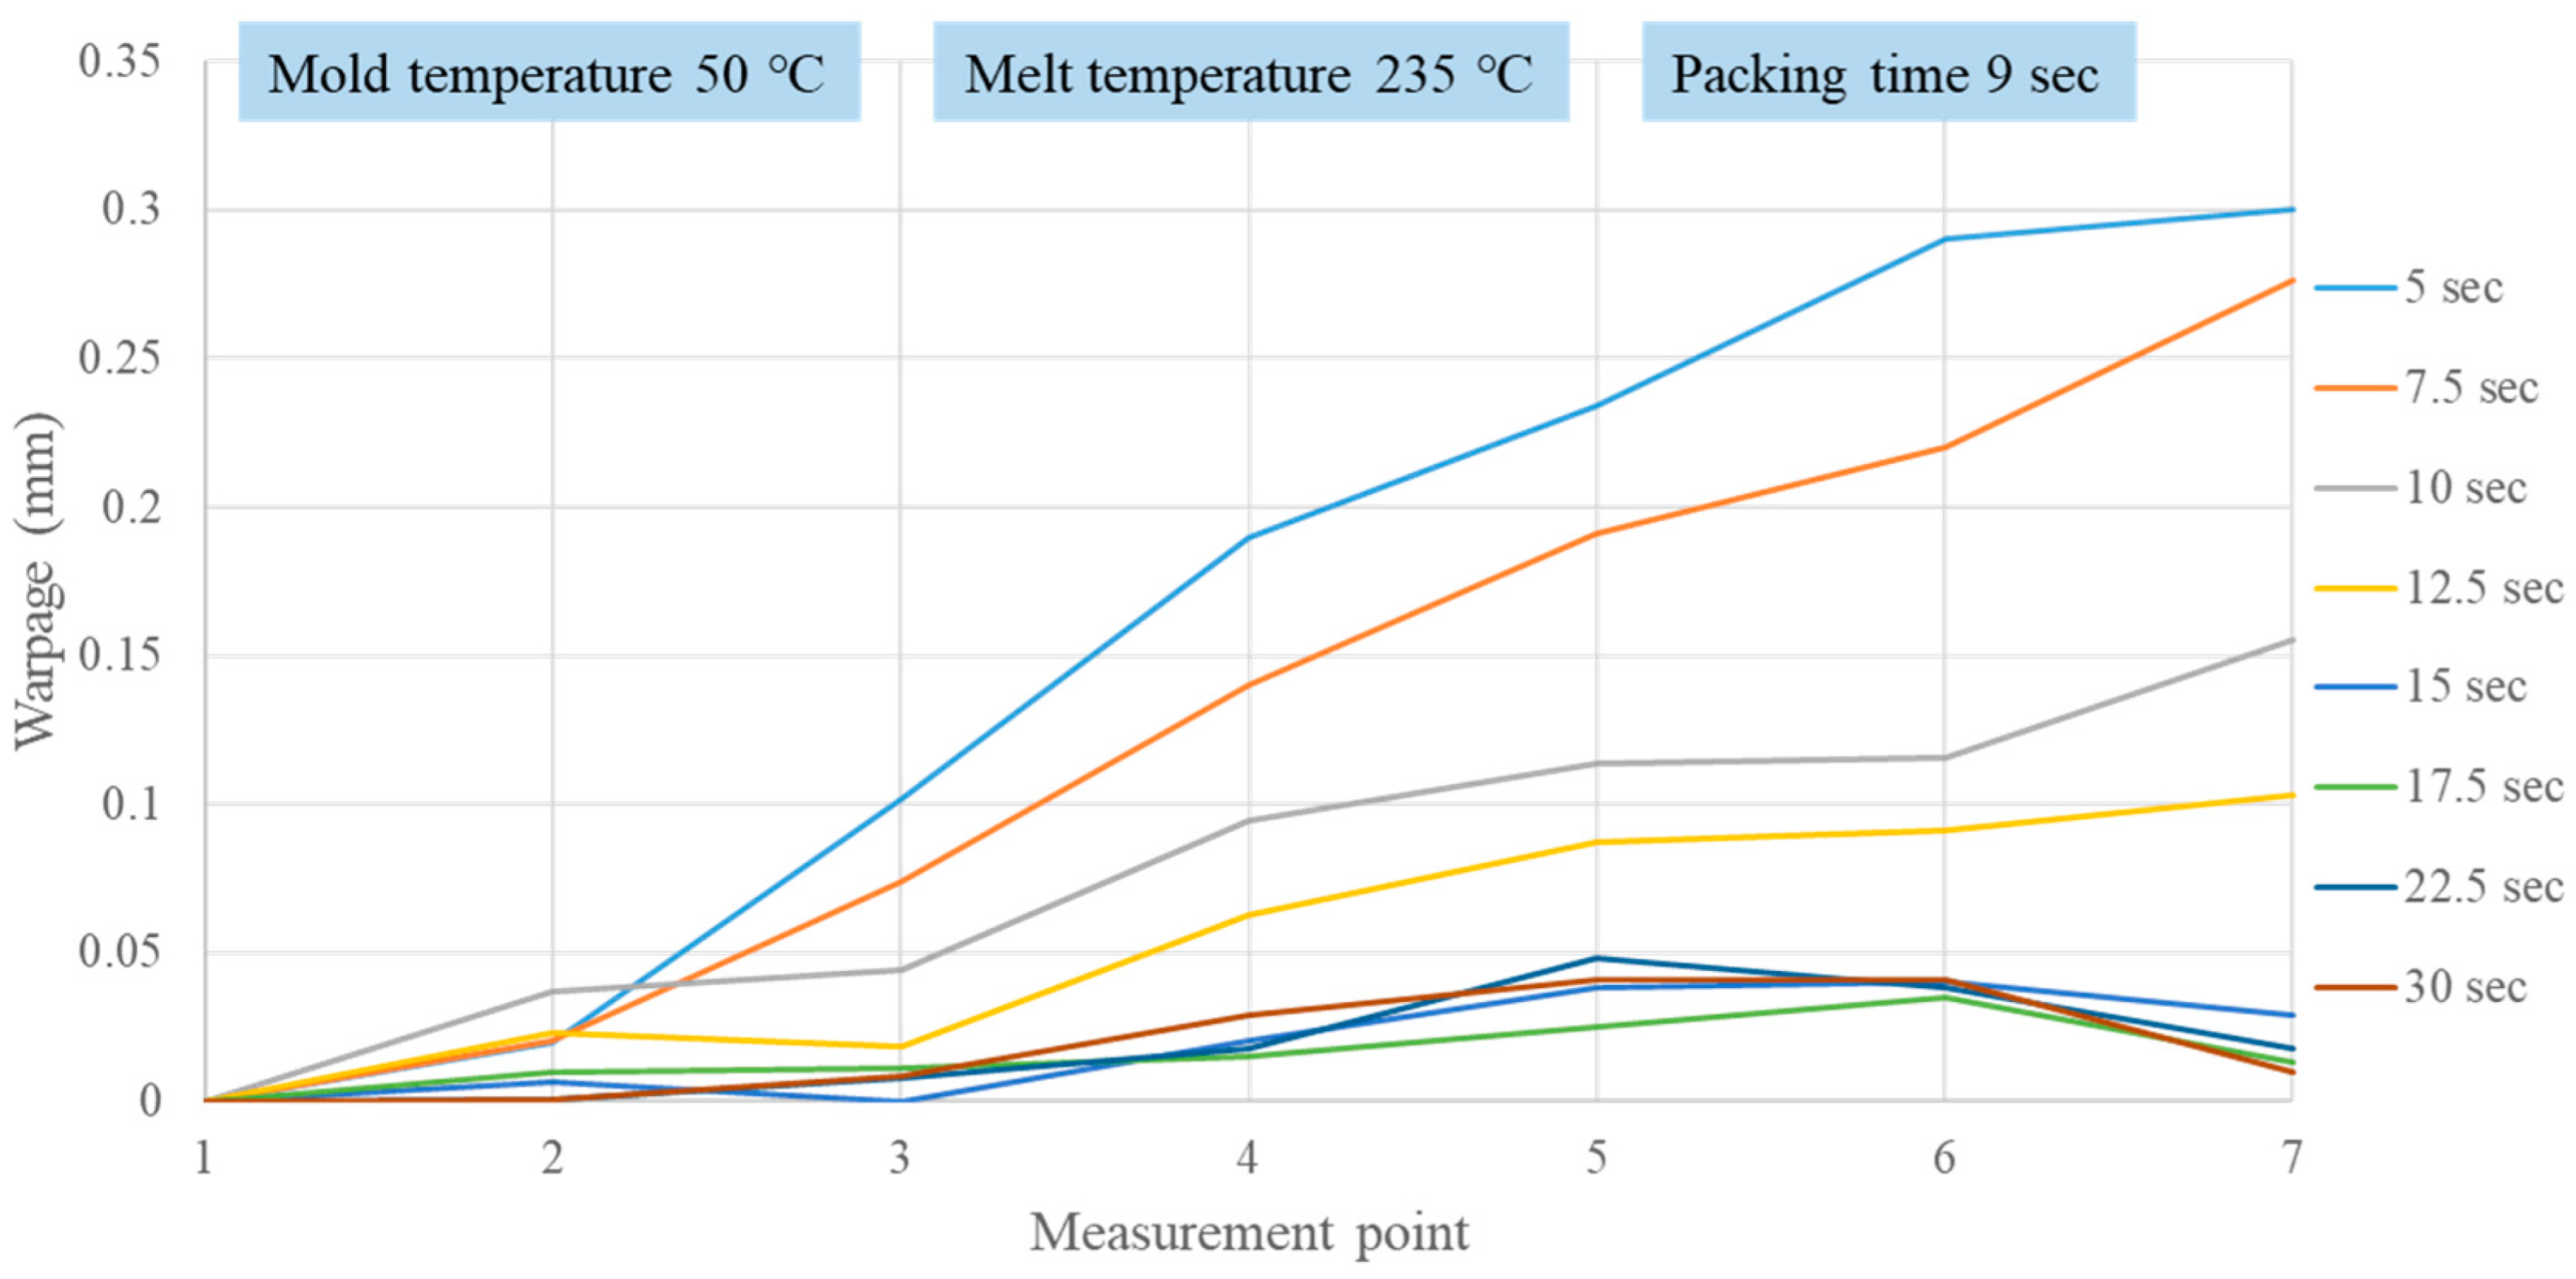
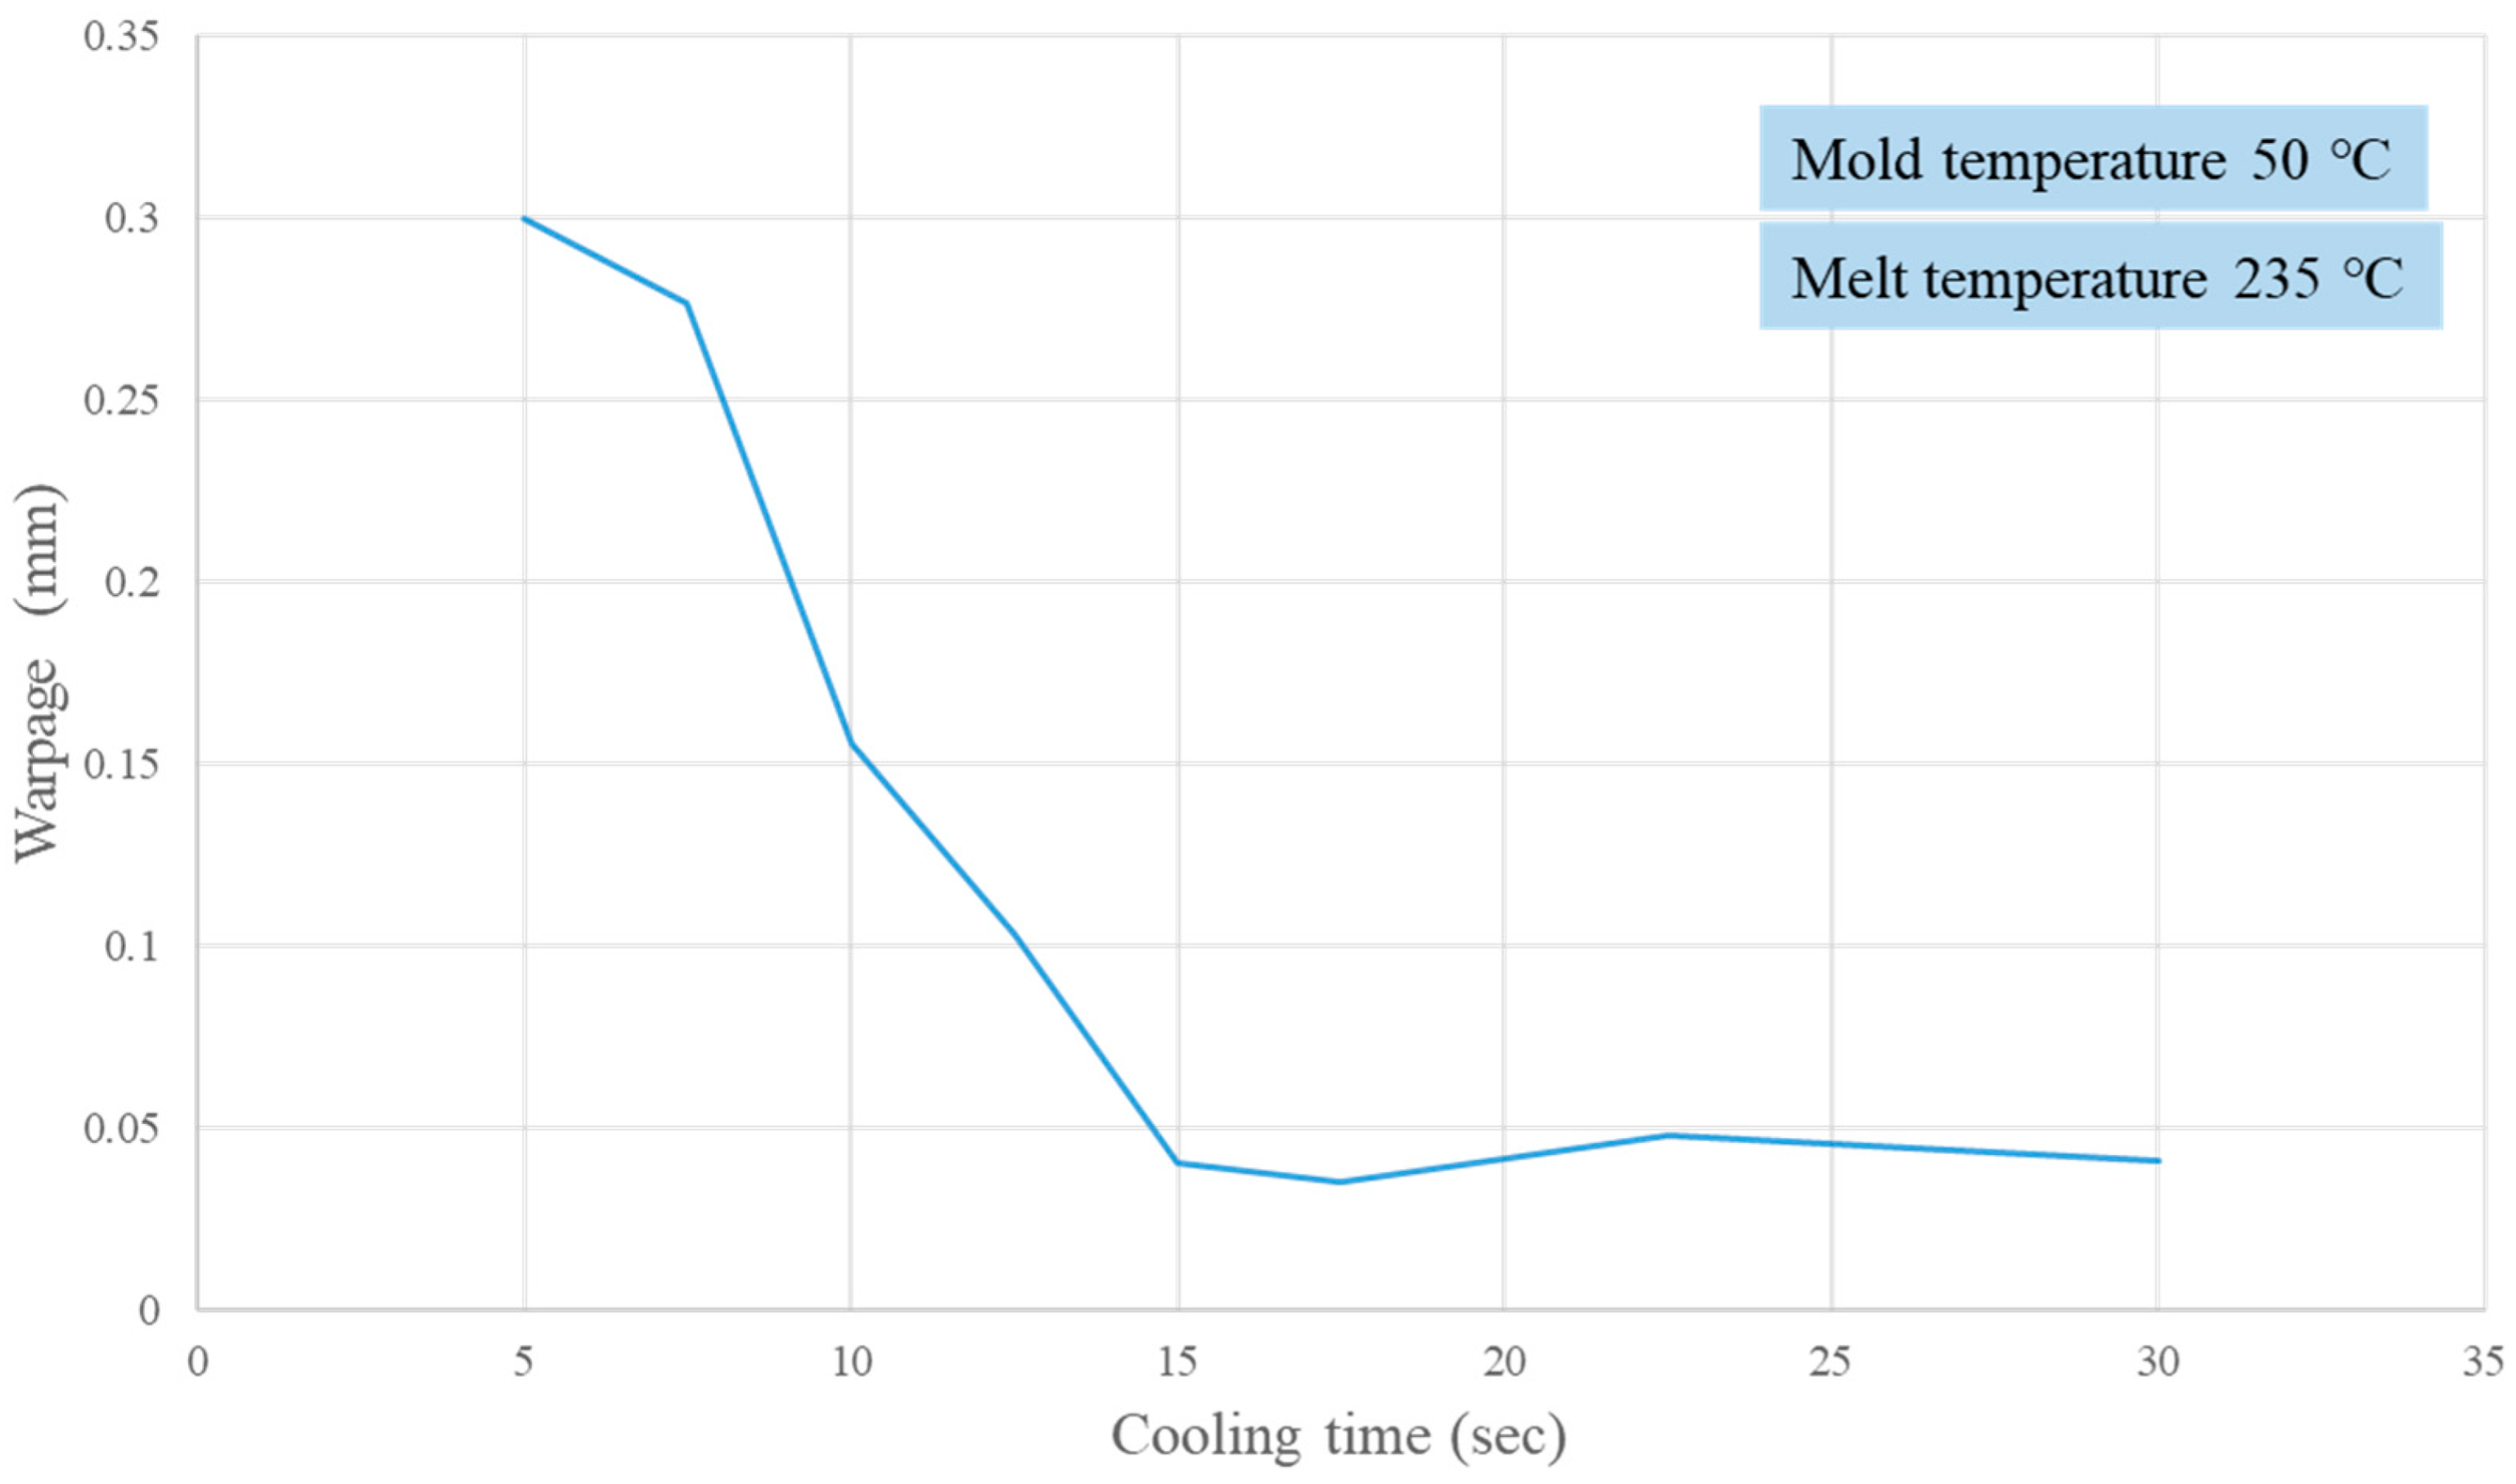
2.4. Correlating Crystallization Completion with the Extent of Part Warpage

For the designed experiments, cooling times shorter and longer than the observed crystallization completion time were used to correlate the crystallization completion with the extent of the part warpage. The experimental conditions and results are listed in Table 2.

2.5. Influence of Time-Averaged Cavity Pressure on Part Warpage

For the second phase of injection molding experiments, a full-factorial experiment design was used to vary the melt temperature, packing pressure, and packing time, and the process conditions are shown in Table 3. The contribution of each parameter and the influence of cross-interactions were analyzed. The time-averaged cavity pressure was first calculated from the pressure profile integral using the following equation, and a case illustration is shown in Figure 6. Figure 6 depicts the pressure evolution during various stages of the injection phase. The pressure starts to rise when the melt front arrives at the sensor location. Once the melt is filled with the cavity, pressure quickly rises to the target packing pressure and holds this value for some time (depending on packing time) in the packing phase. After the end of the packing process, the pressure continues to drop until it reaches atmospheric pressure or when the part is ejected. Once the mold cavity is filled, melt crystallization starts (t1). When crystallization is over (t2), the melt is assumed to be solidified, and packing becomes noneffective. The time-averaged packing pressure, PSavg, is defined as
P S a v g = 1 Δ t t 1 t 2 p ¯ t d t
where t1 and t2 represent the packing starting and crystallization completion time, respectively. Δt is the time interval between t1 and t2. The mean pressure value was then averaged at three measured locations (near the gate, designated as NG; in the middle, designated as MID; and far away from the gate, designated as FG) and correlated with the measured part shrinkage.
A linear regression model was constructed to correlate the time-averaged cavity pressure and measured shrinkage using first-, second-, and third-order functions, as shown in Equations (3)–(6):
  S V = L 0 L L 0 × 100 %
where SV is the measured shrinkage, L0 is the original length of the cavity, and L is the molded part length. The correlation between the time-averaged solidification pressure, PSav, and part shrinkage, SV, can be represented by
S V = A 1 B 1 × P S a v g
S V = A 2 B 2 × P S a v g + C 2 × P S a v g 2
S V = A 3 B 3 × P S a v g + C 3 × P S a v g 2 + D 3 × P S a v g 3
where Ai, Bi, Ci, and Di (i = 1, 2, 3) are constants to be determined from the relevant data. The appropriate function was confirmed using residual analysis [27,28].

2.6. Verification Experiments for Prediction Models

Verification experiments were performed to validate the accuracy of the crystallization time model and the averaged cavity pressure integral model. Two sets of experiments were performed separately, with the molding conditions listed in Table 4 and Table 5.

3. Results and Discussion

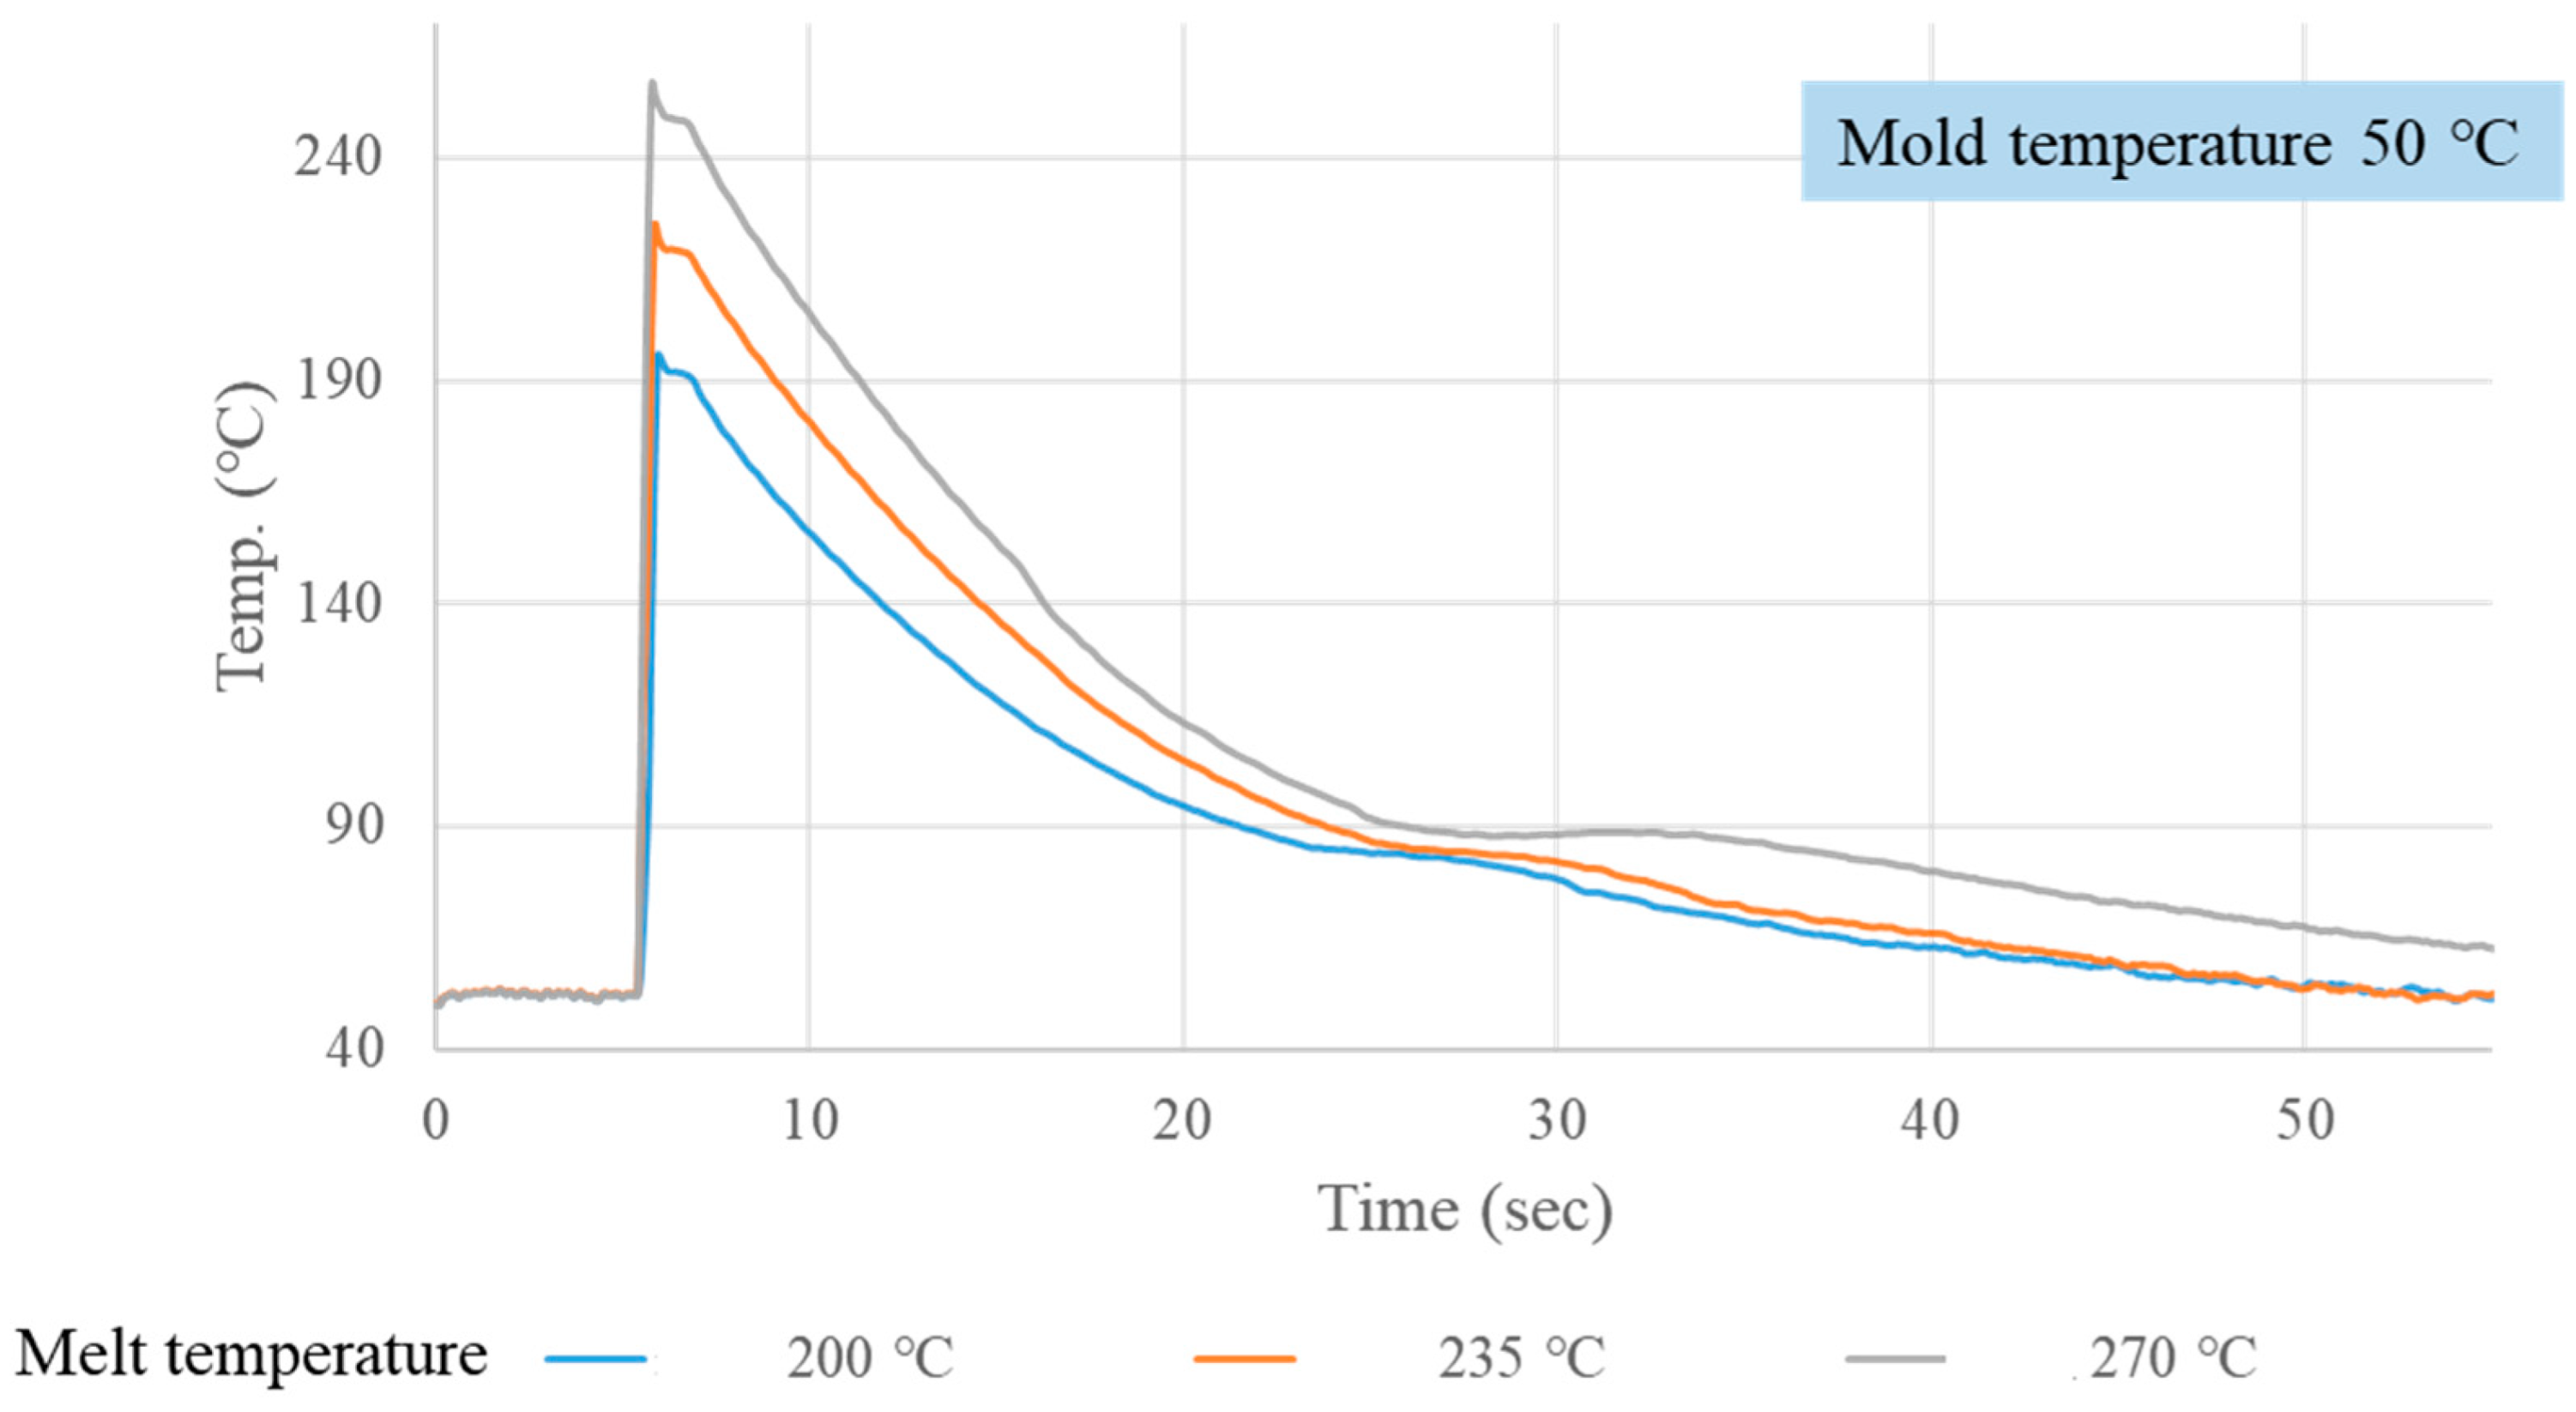
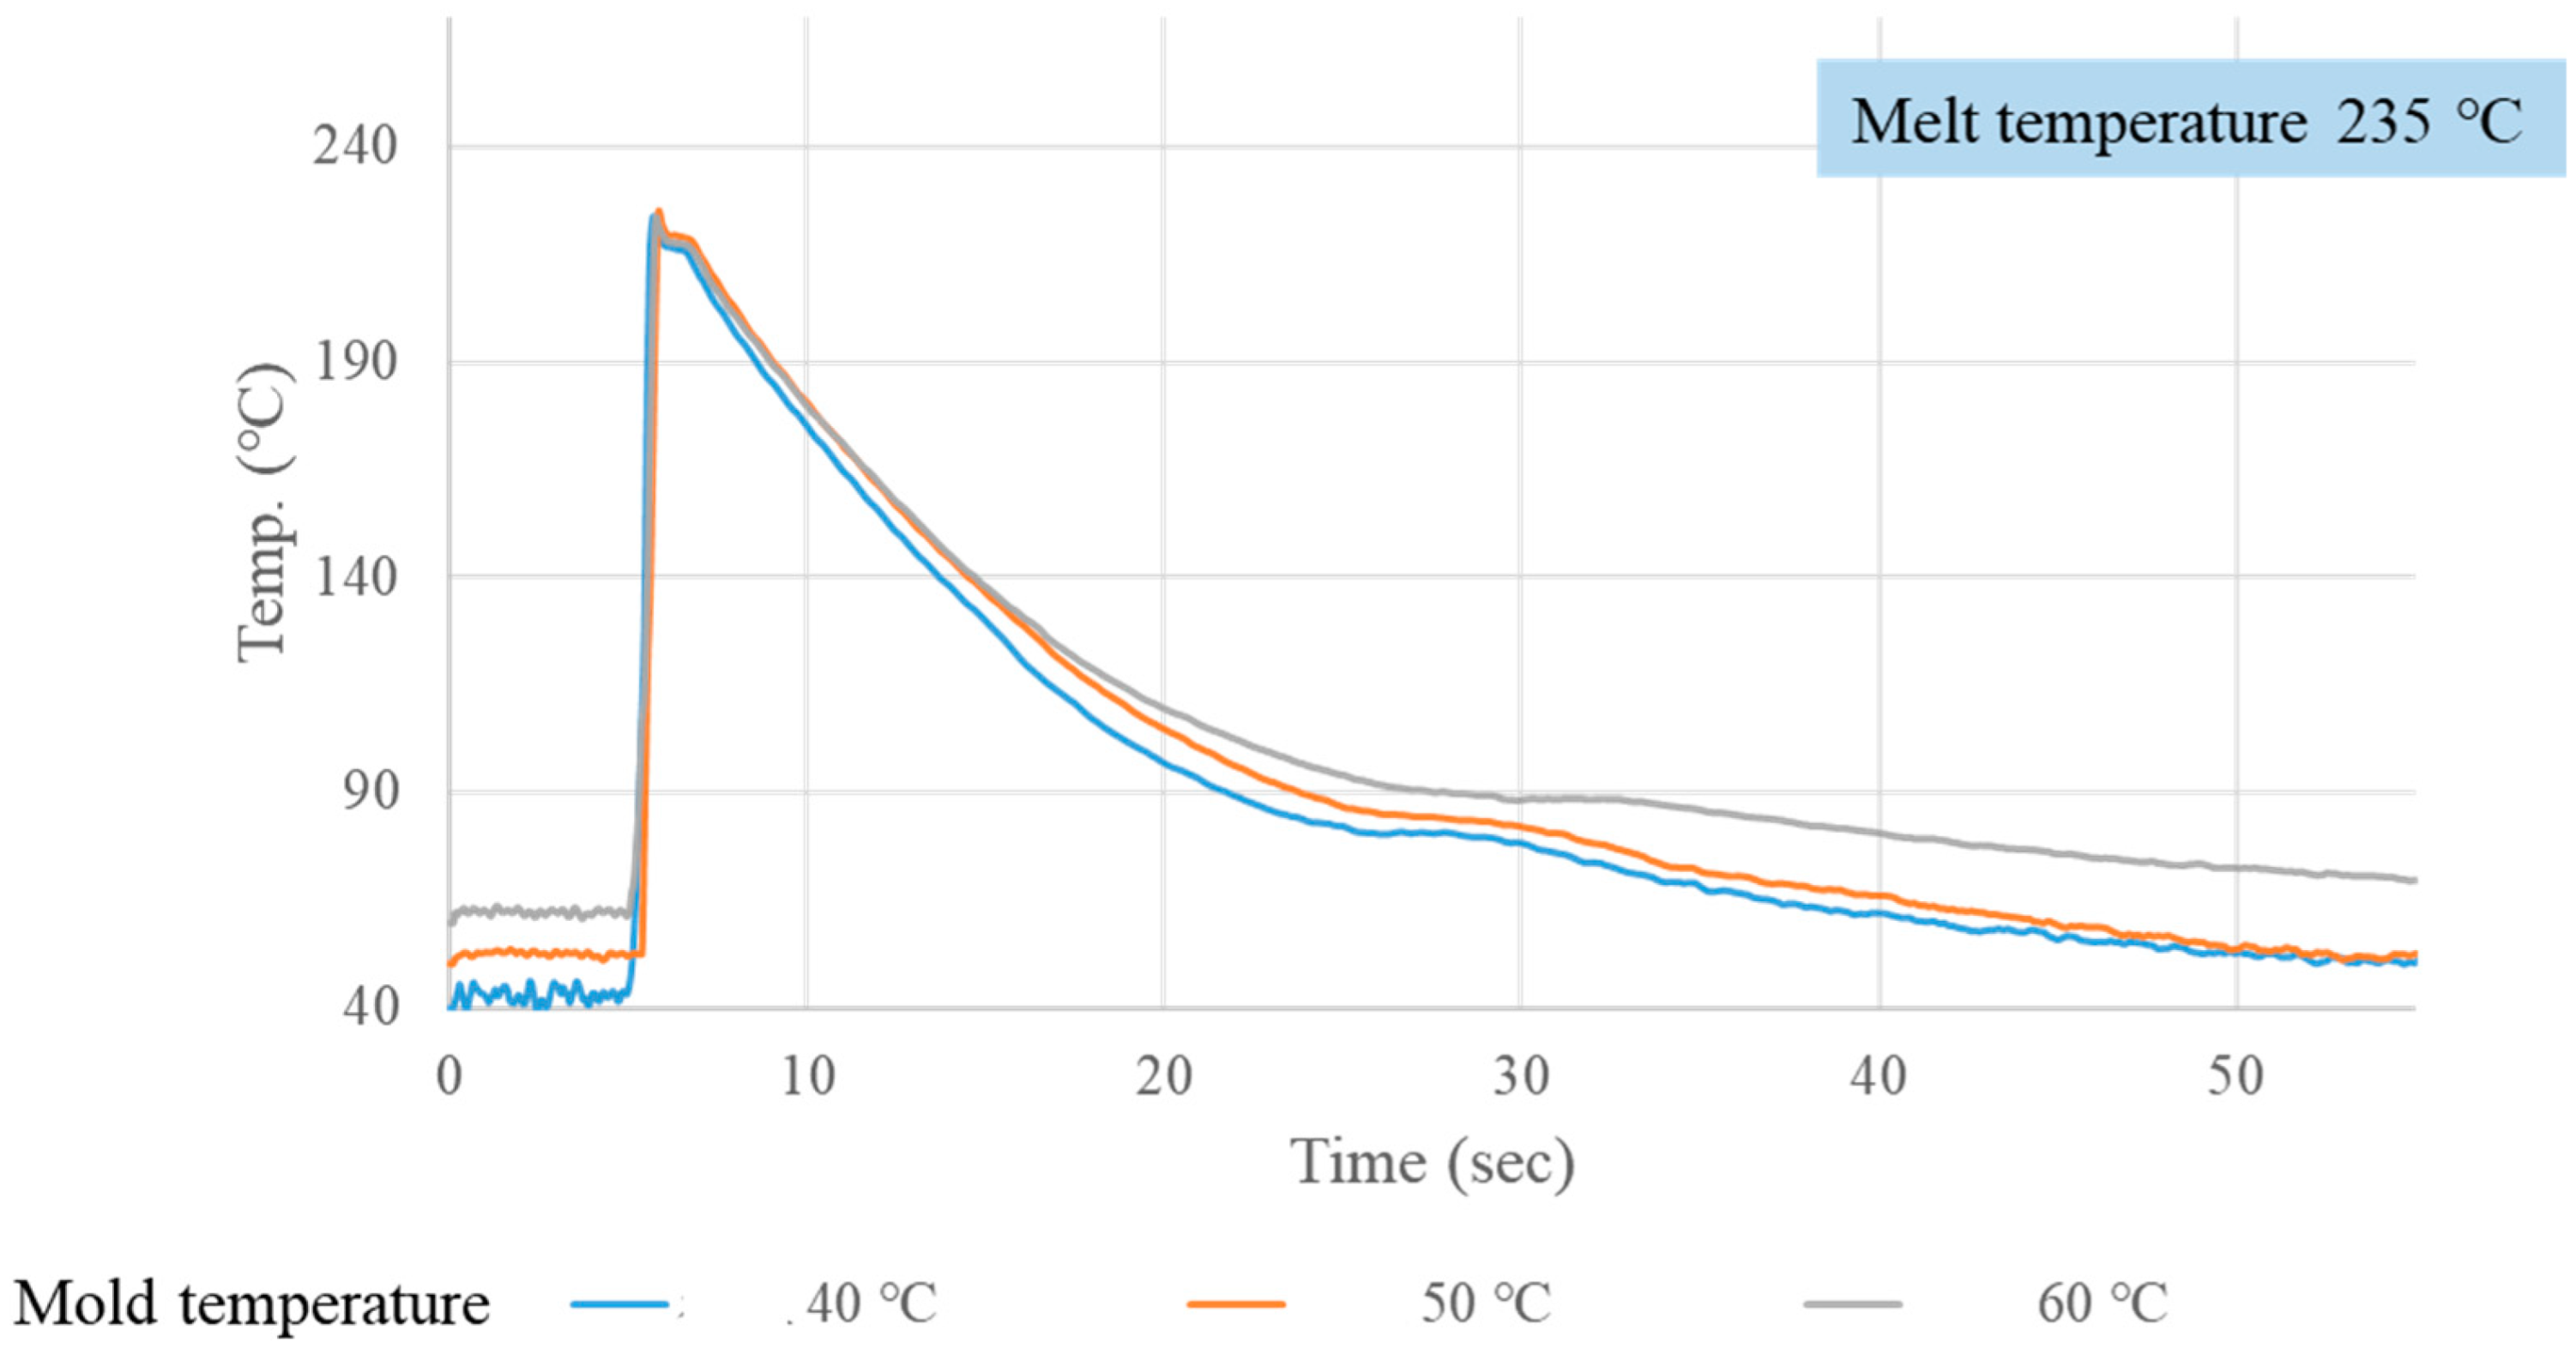
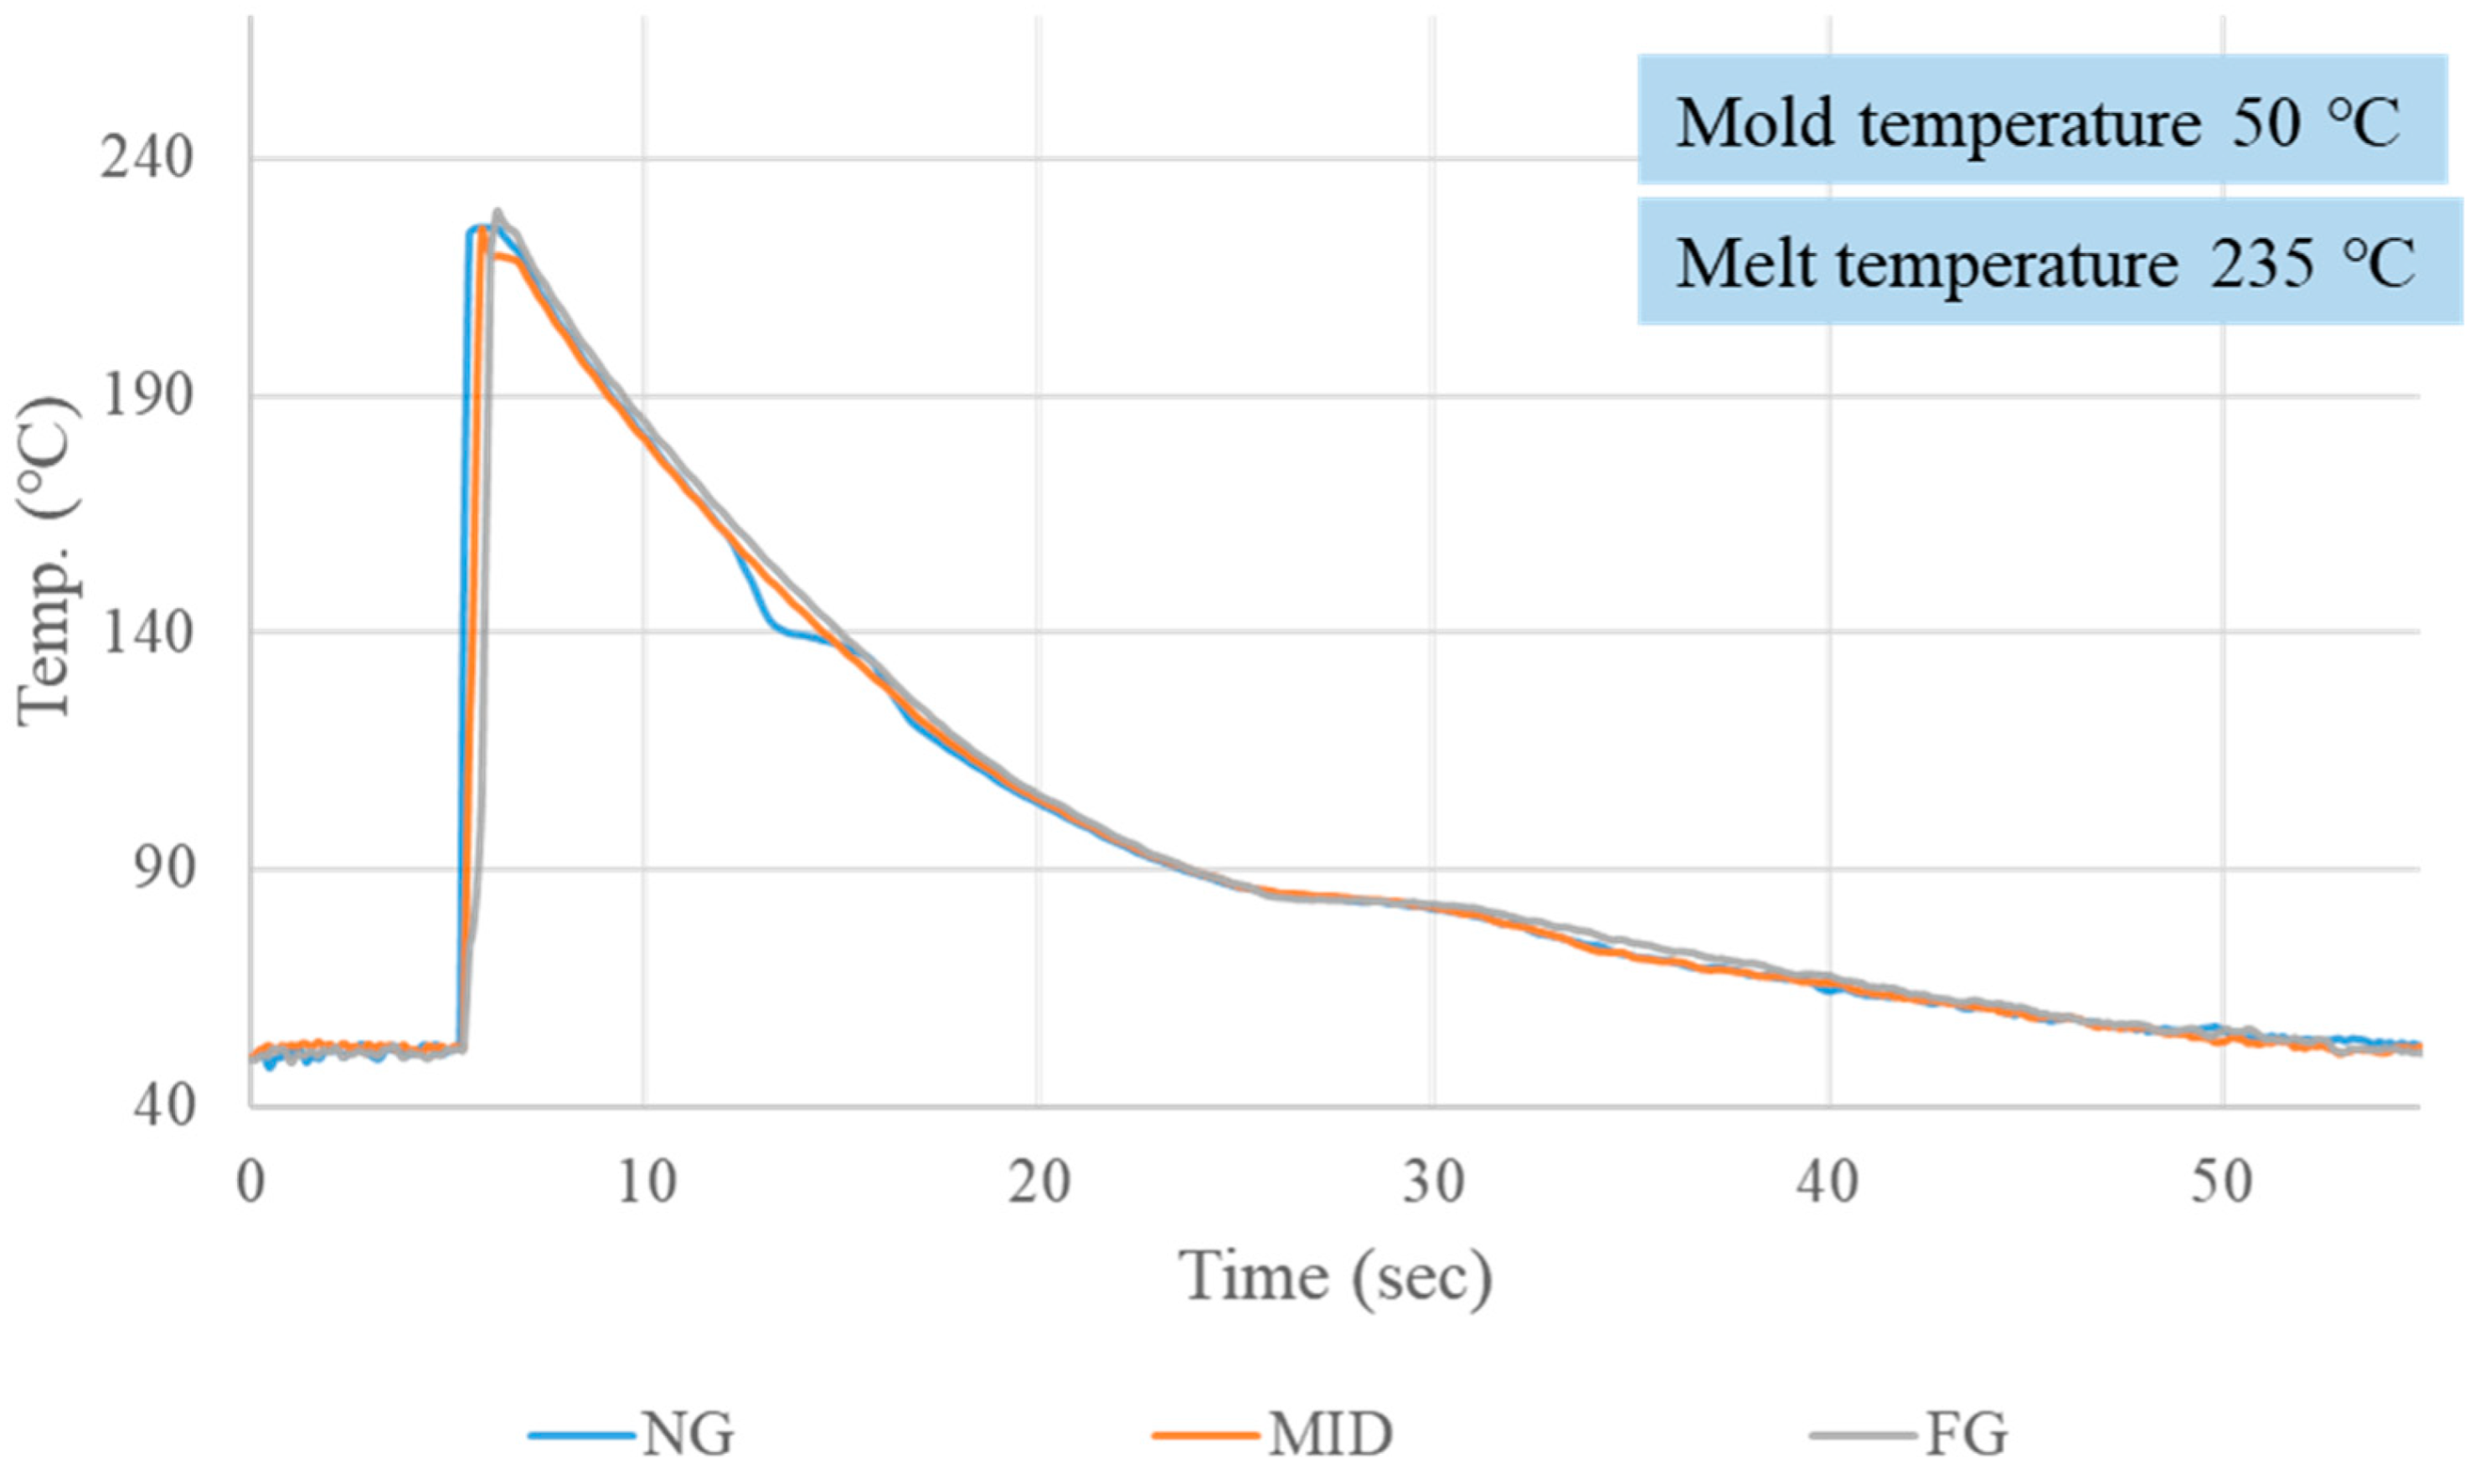
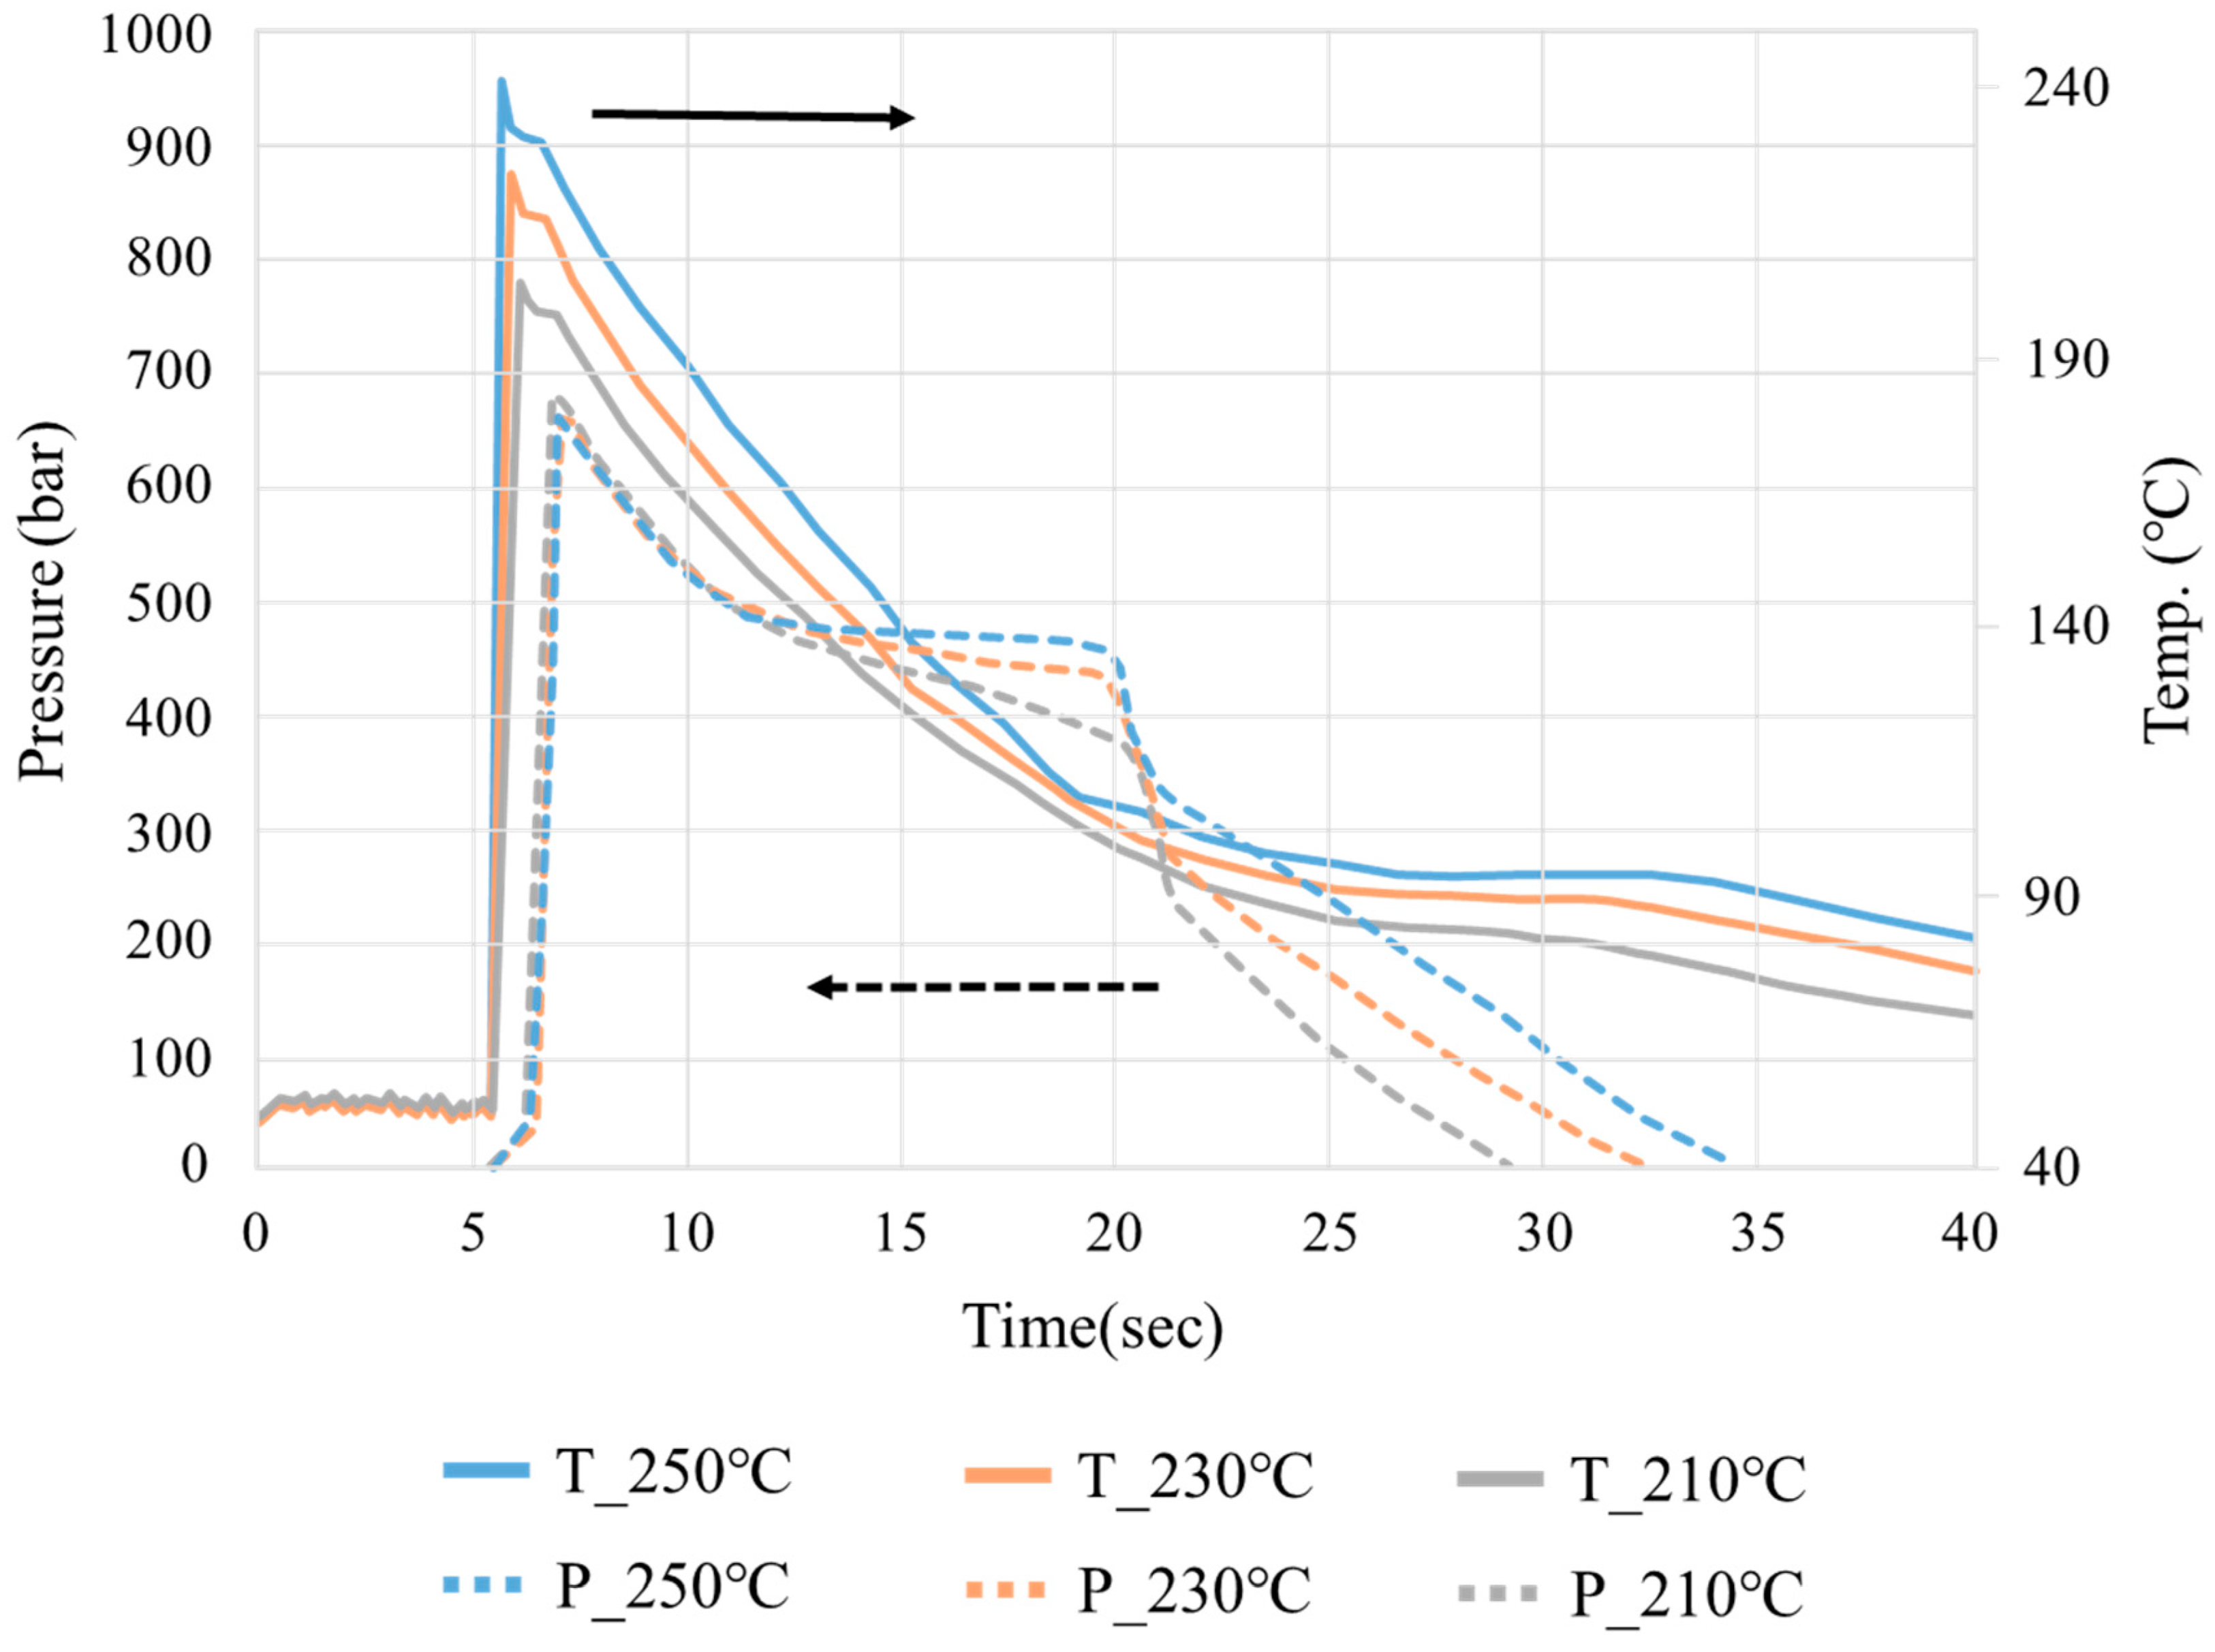
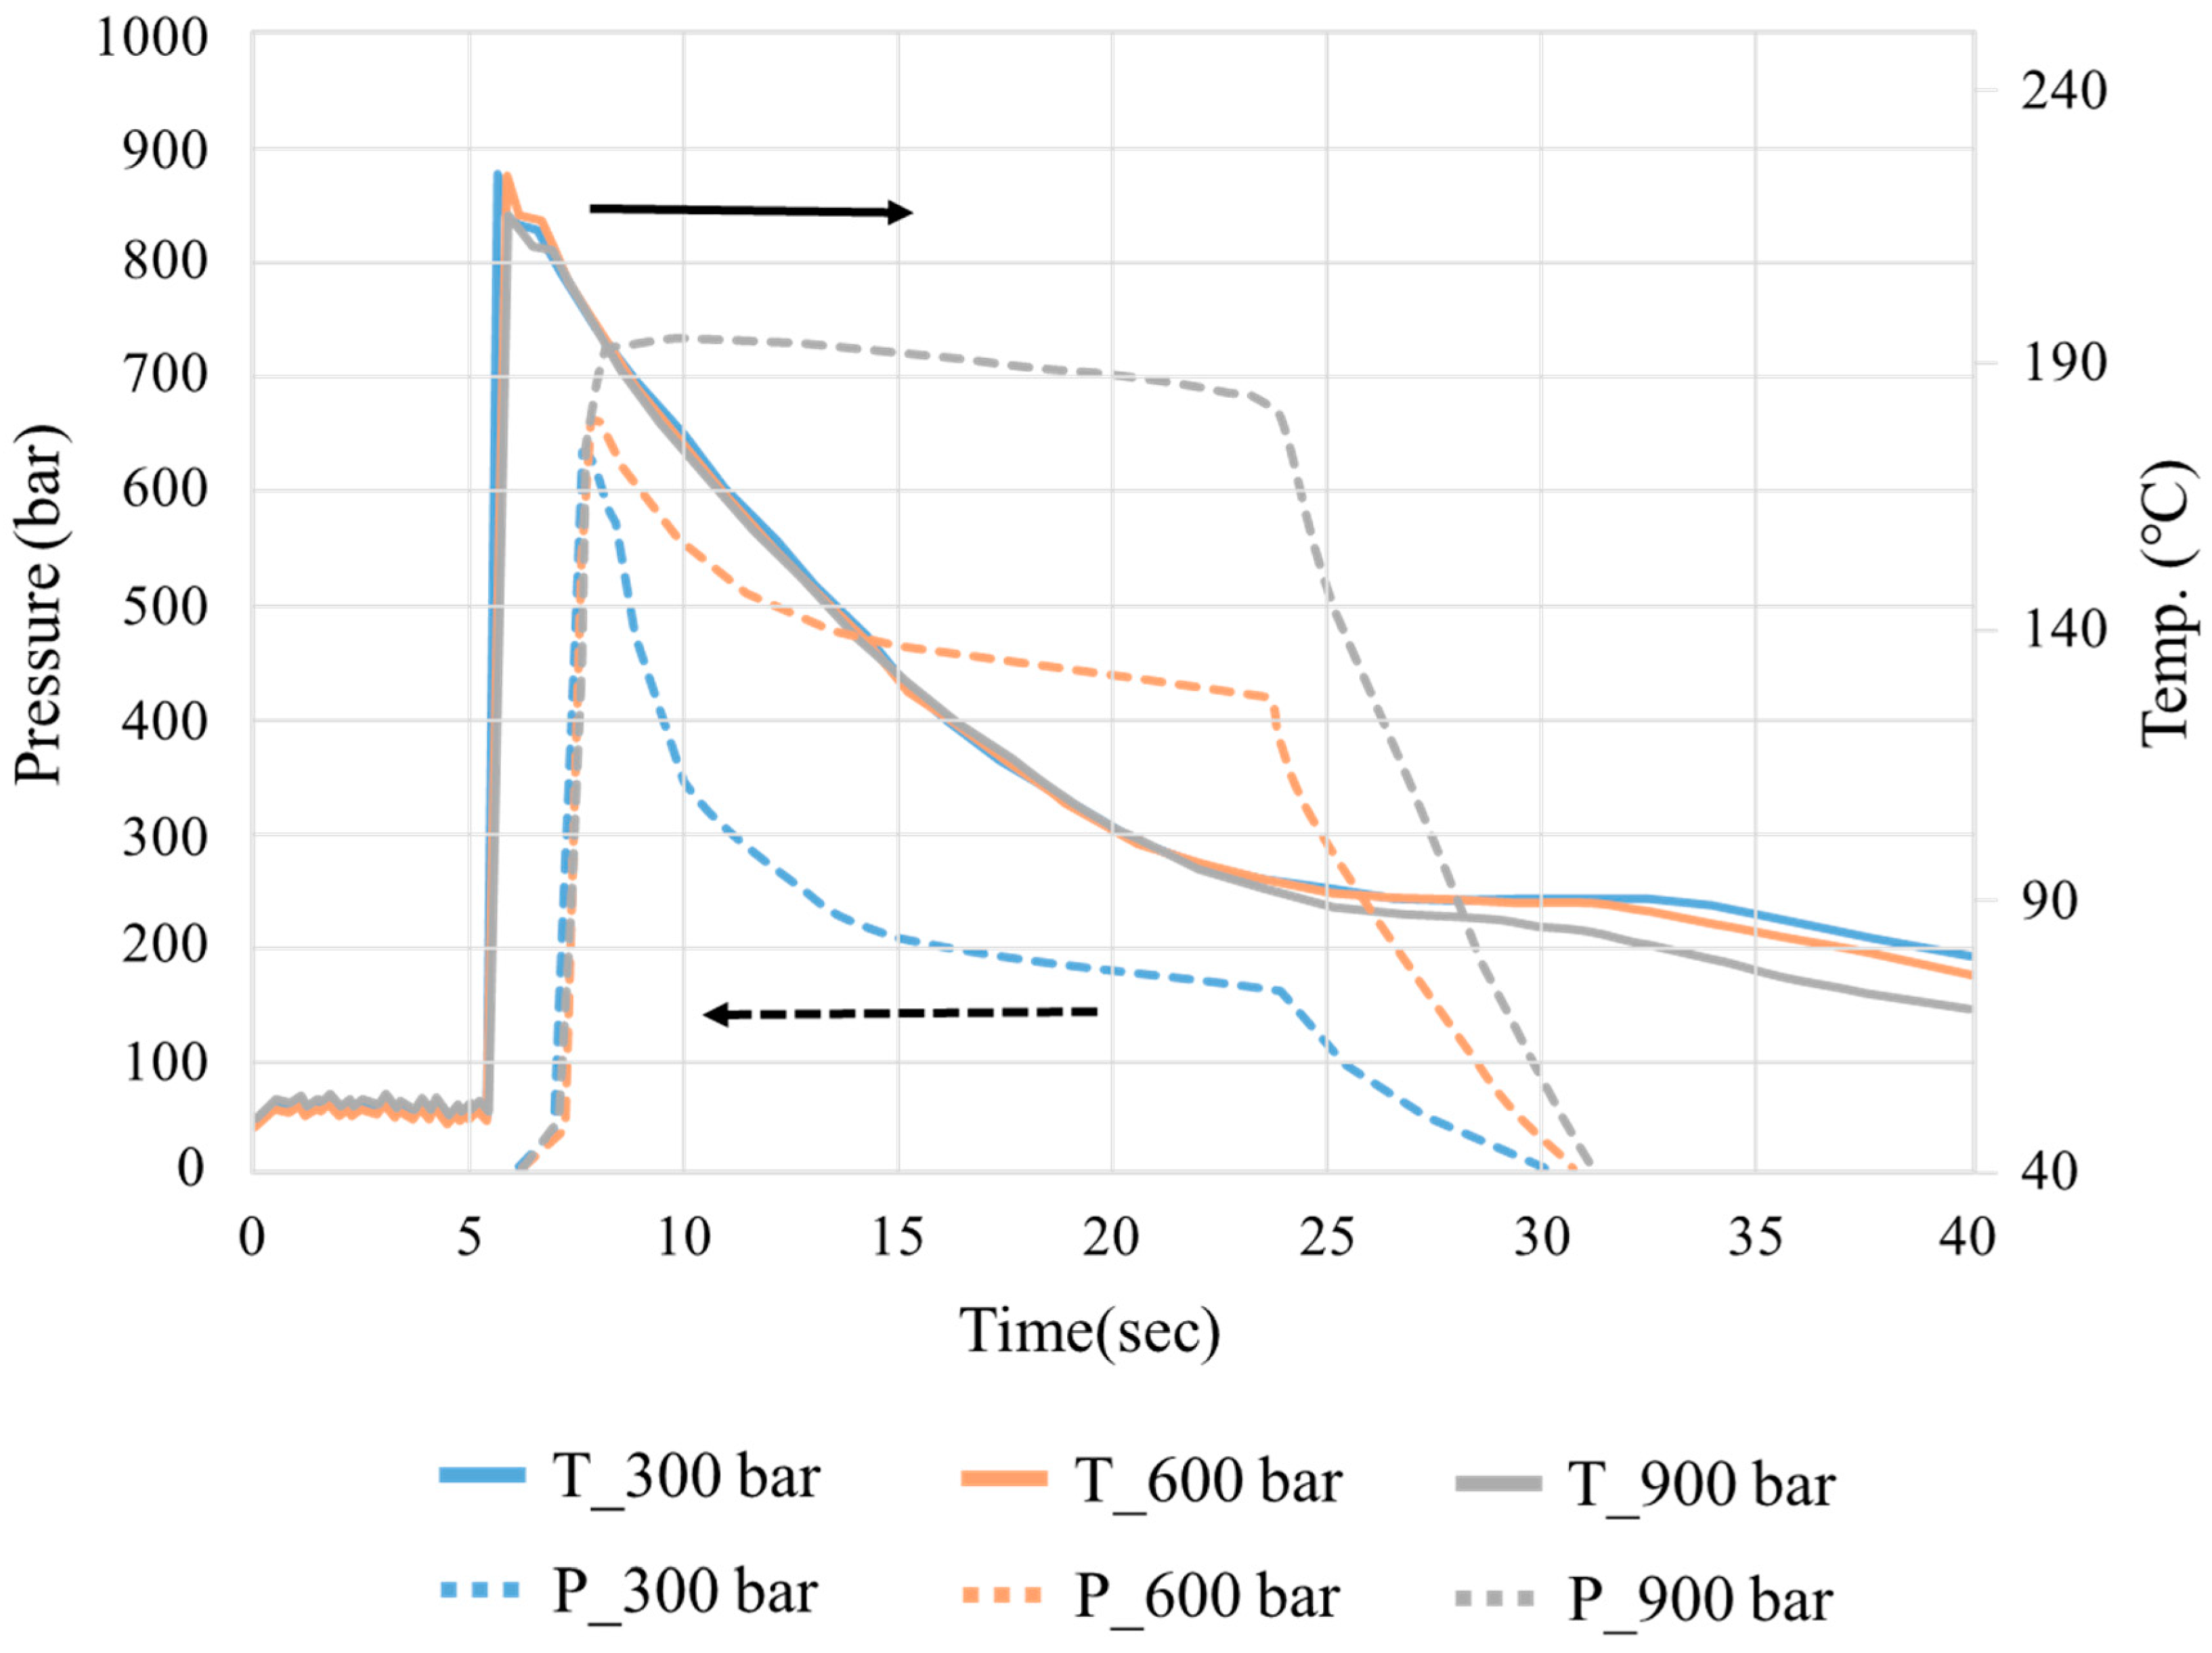
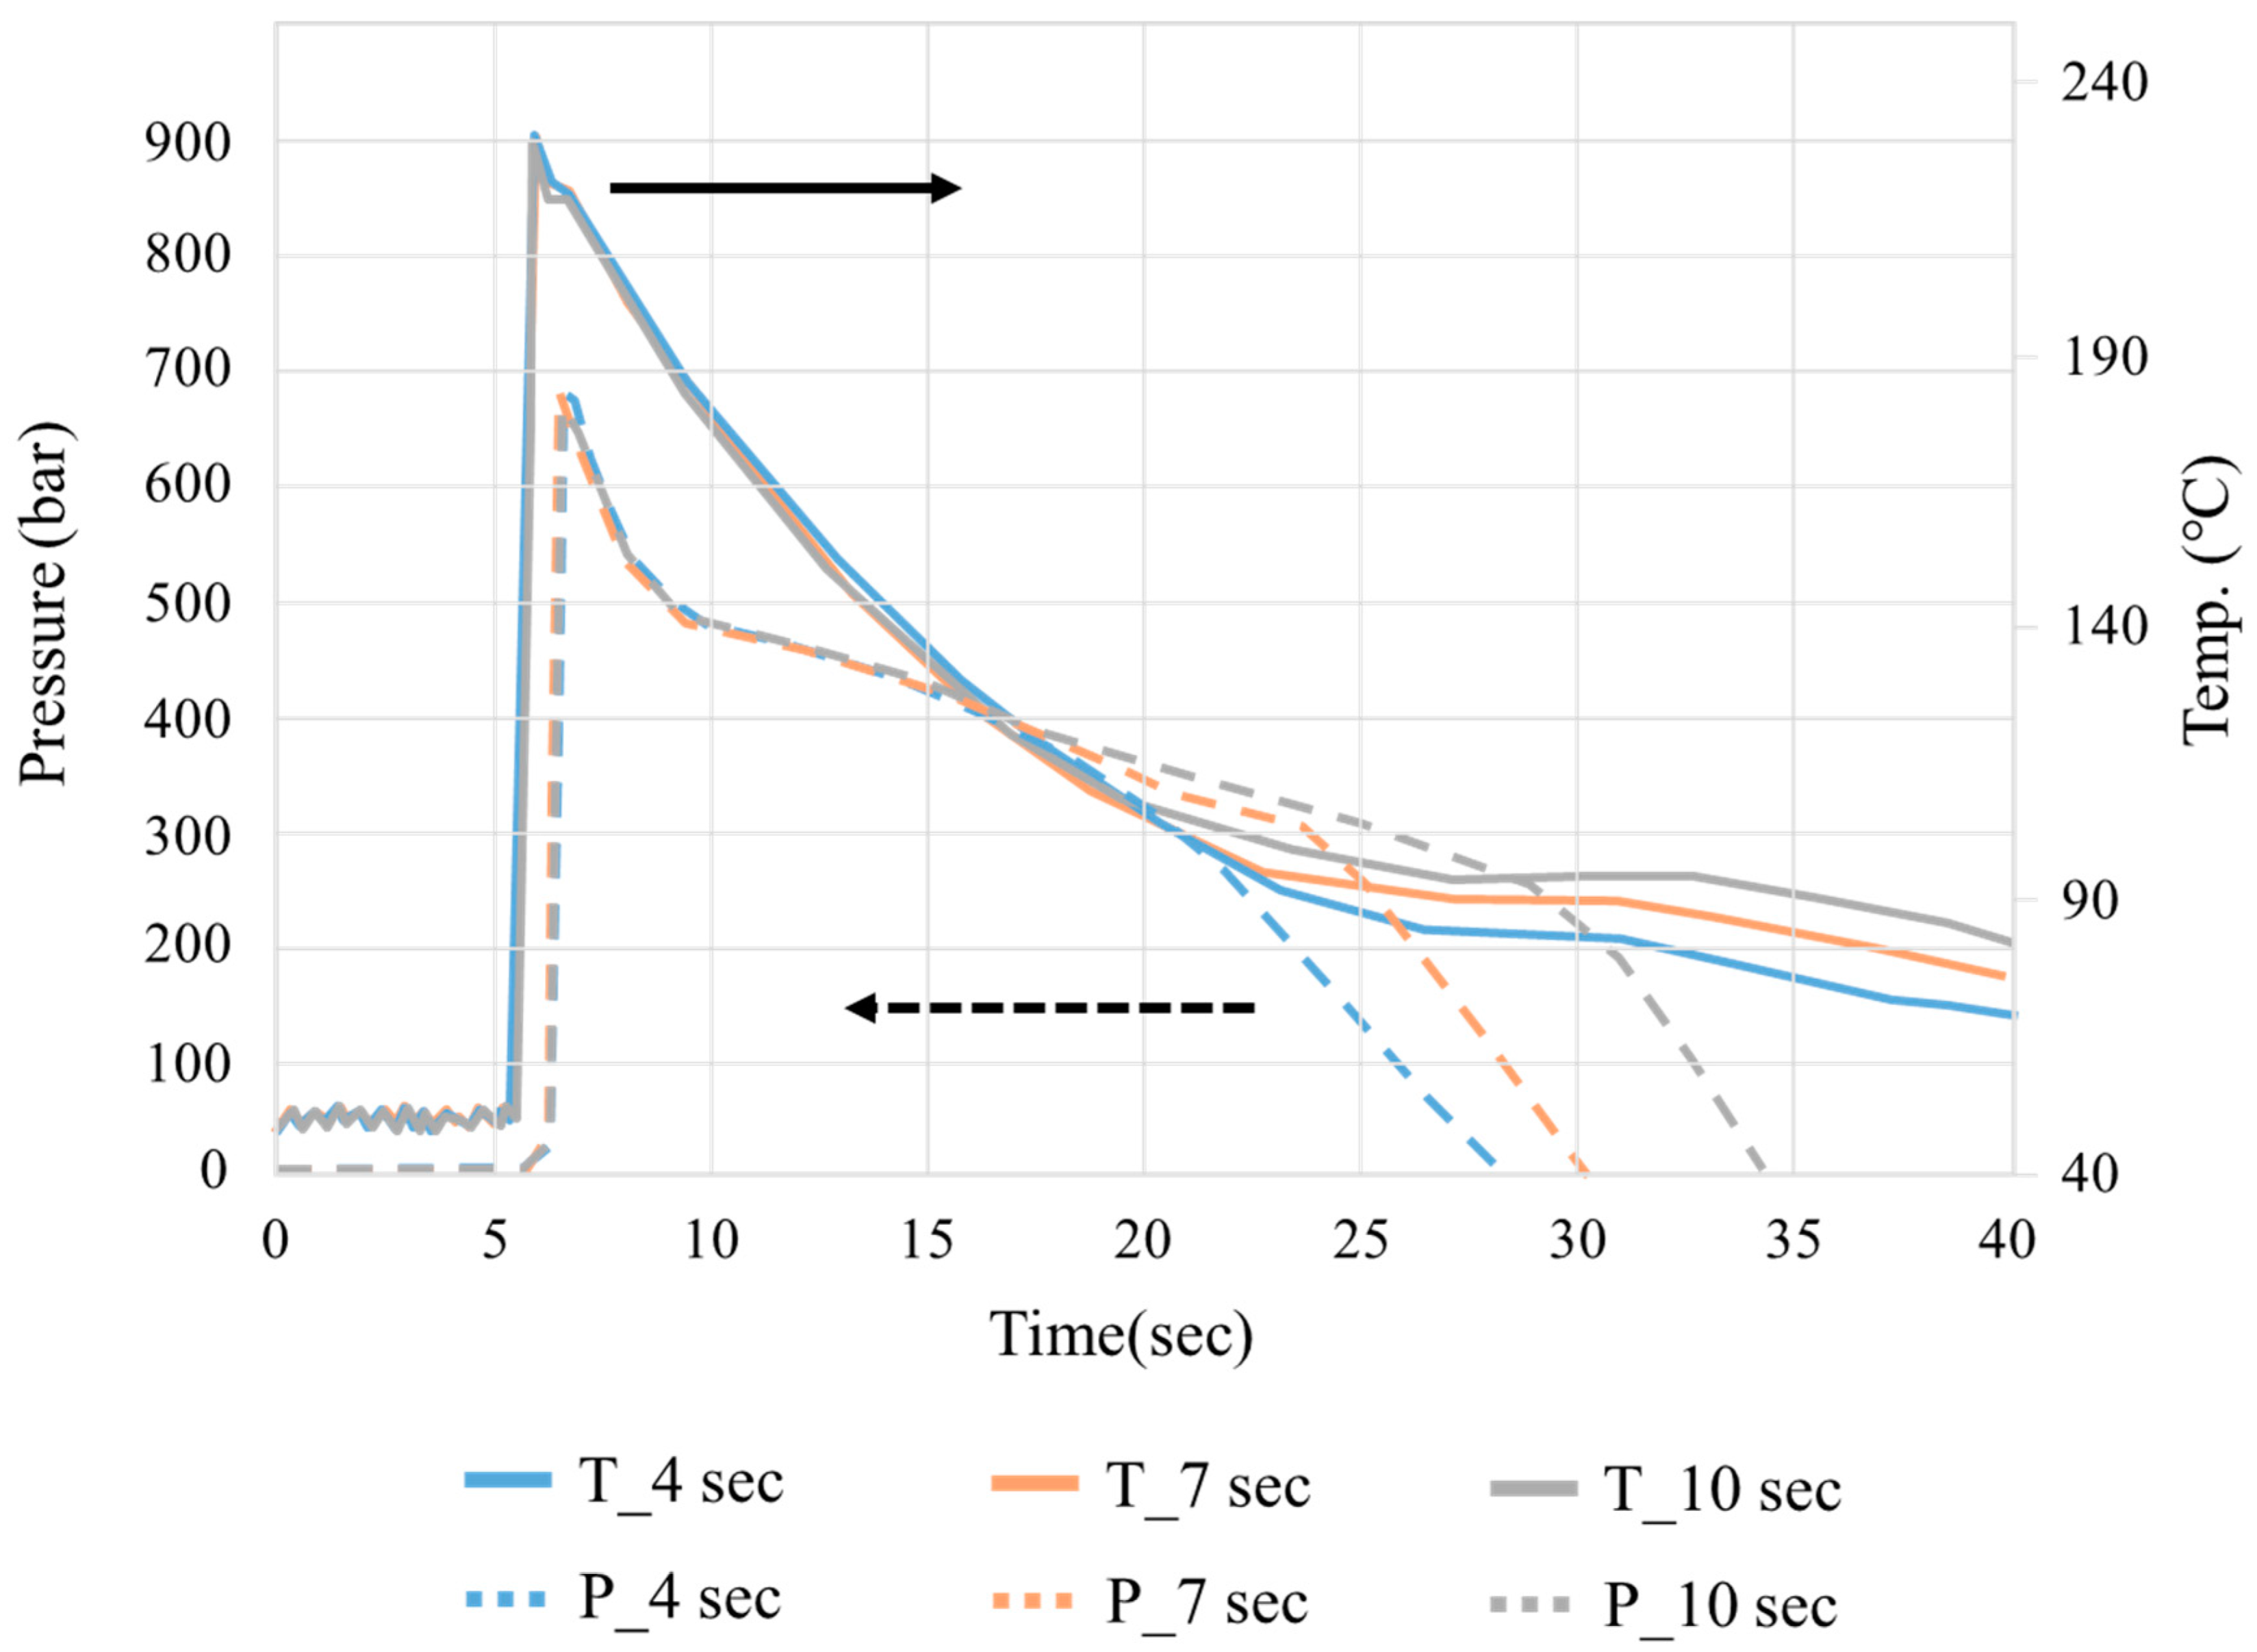
3.1. Crystallization Completion Monitoring

Temperature profiles were measured at different melt and mold temperatures in the middle of the cavity (Figure 7 and Figure 8). The three-stage variation characteristics were clearly defined, and the melt temperature variations were less sensitive to the cavity location (Figure 9). Since the plateau of the temperature profiles is not always clear, the slope of the temperature, i.e., the cooling rate, is derived from the time at which the minimum cooling rate was identified as the completion time of crystallization (as shown in Figure 5b). It was assumed that when the crystallization process is over, the balance between heat release and heat loss from mold cooling no longer exists, leading to faster temperature drops. The calculated crystallization times for the experiments at various cavity positions are shown in Table 6.

3.2. Verifying Crystallization Completion Time from Part Warpage

To further verify the accuracy of the calculated crystallization time, additional experiments were performed with different cooling times (defined as the end of the packing time to the time at which the part was ejected) and correlated with warpage distribution along the cavity positions. The results are shown in Figure 10, with a graph illustrating the relationship between the warpage and cooling time shown in Figure 11. When the cooling exceeded 15 s, the warpage remained relatively constant, indicating the completion of crystallization. Conversely, for cooling times below 15 s, crystallization continued to occur, leading to subsequent shrinkage and the associated post-molding warpage. The measured crystallization completion time was approximately 24 s (noted with a red border in Table 6), which is consistent with that value (15 s cooling time plus 9 s packing time, Table 2).

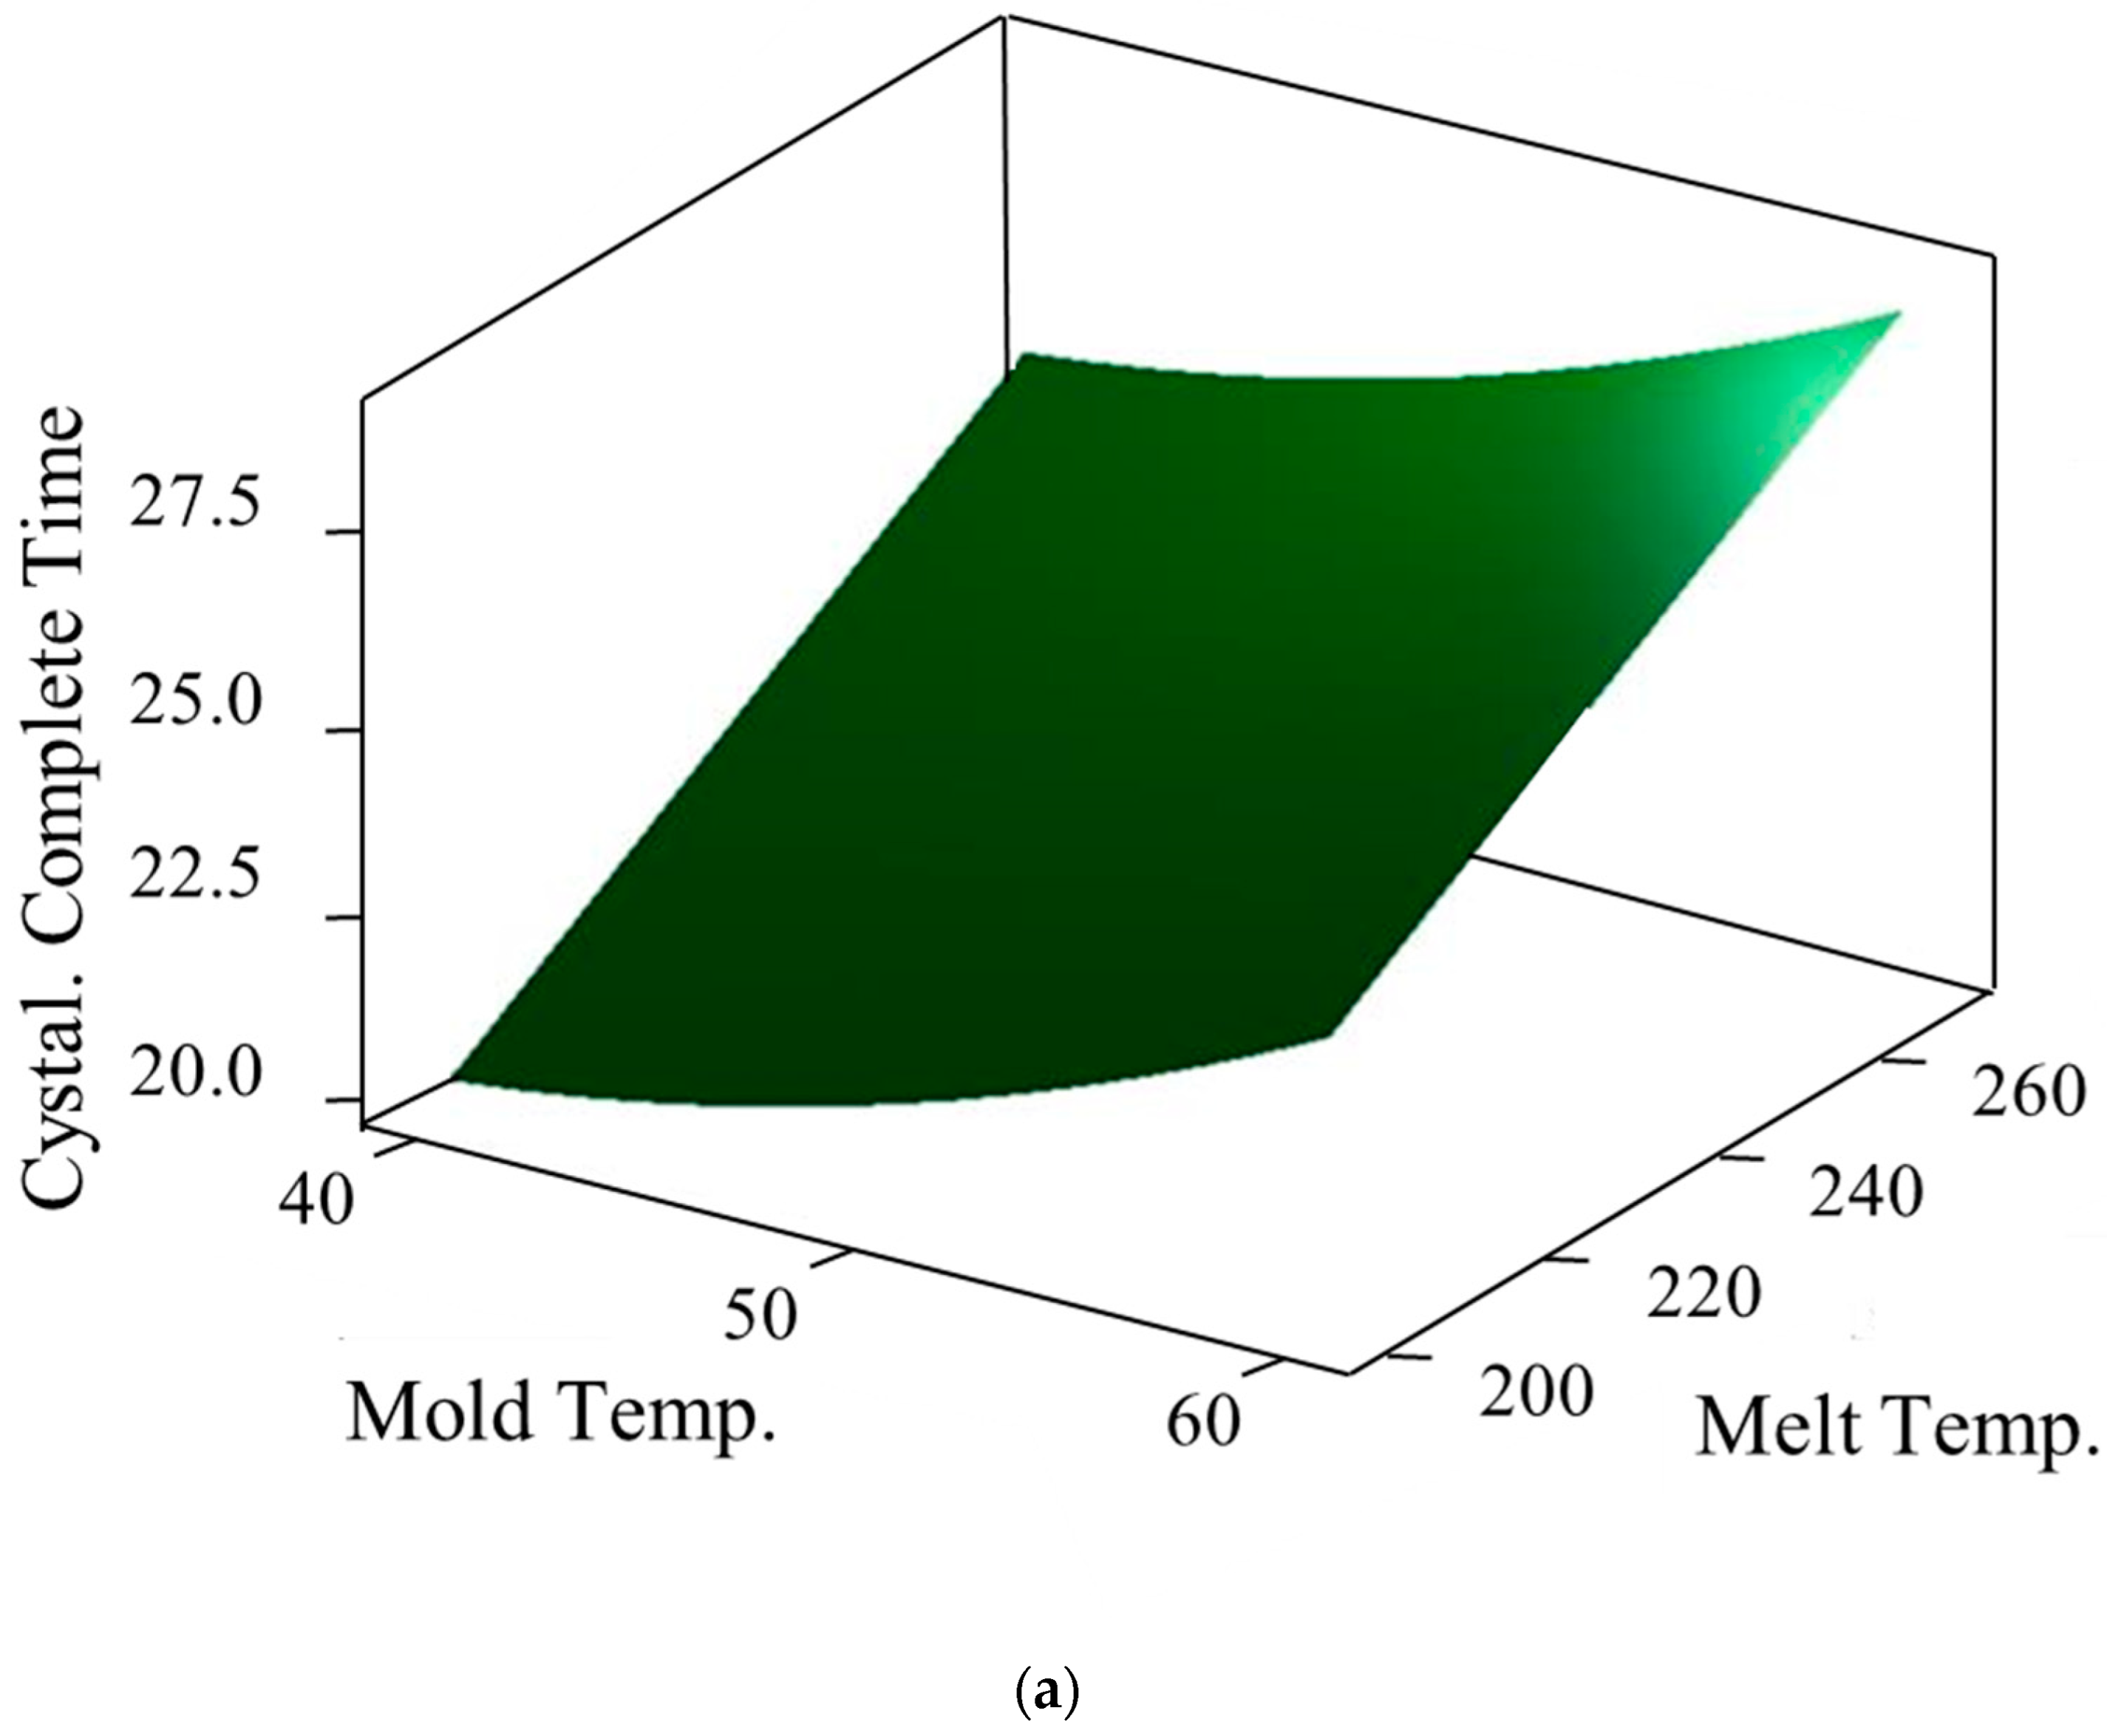
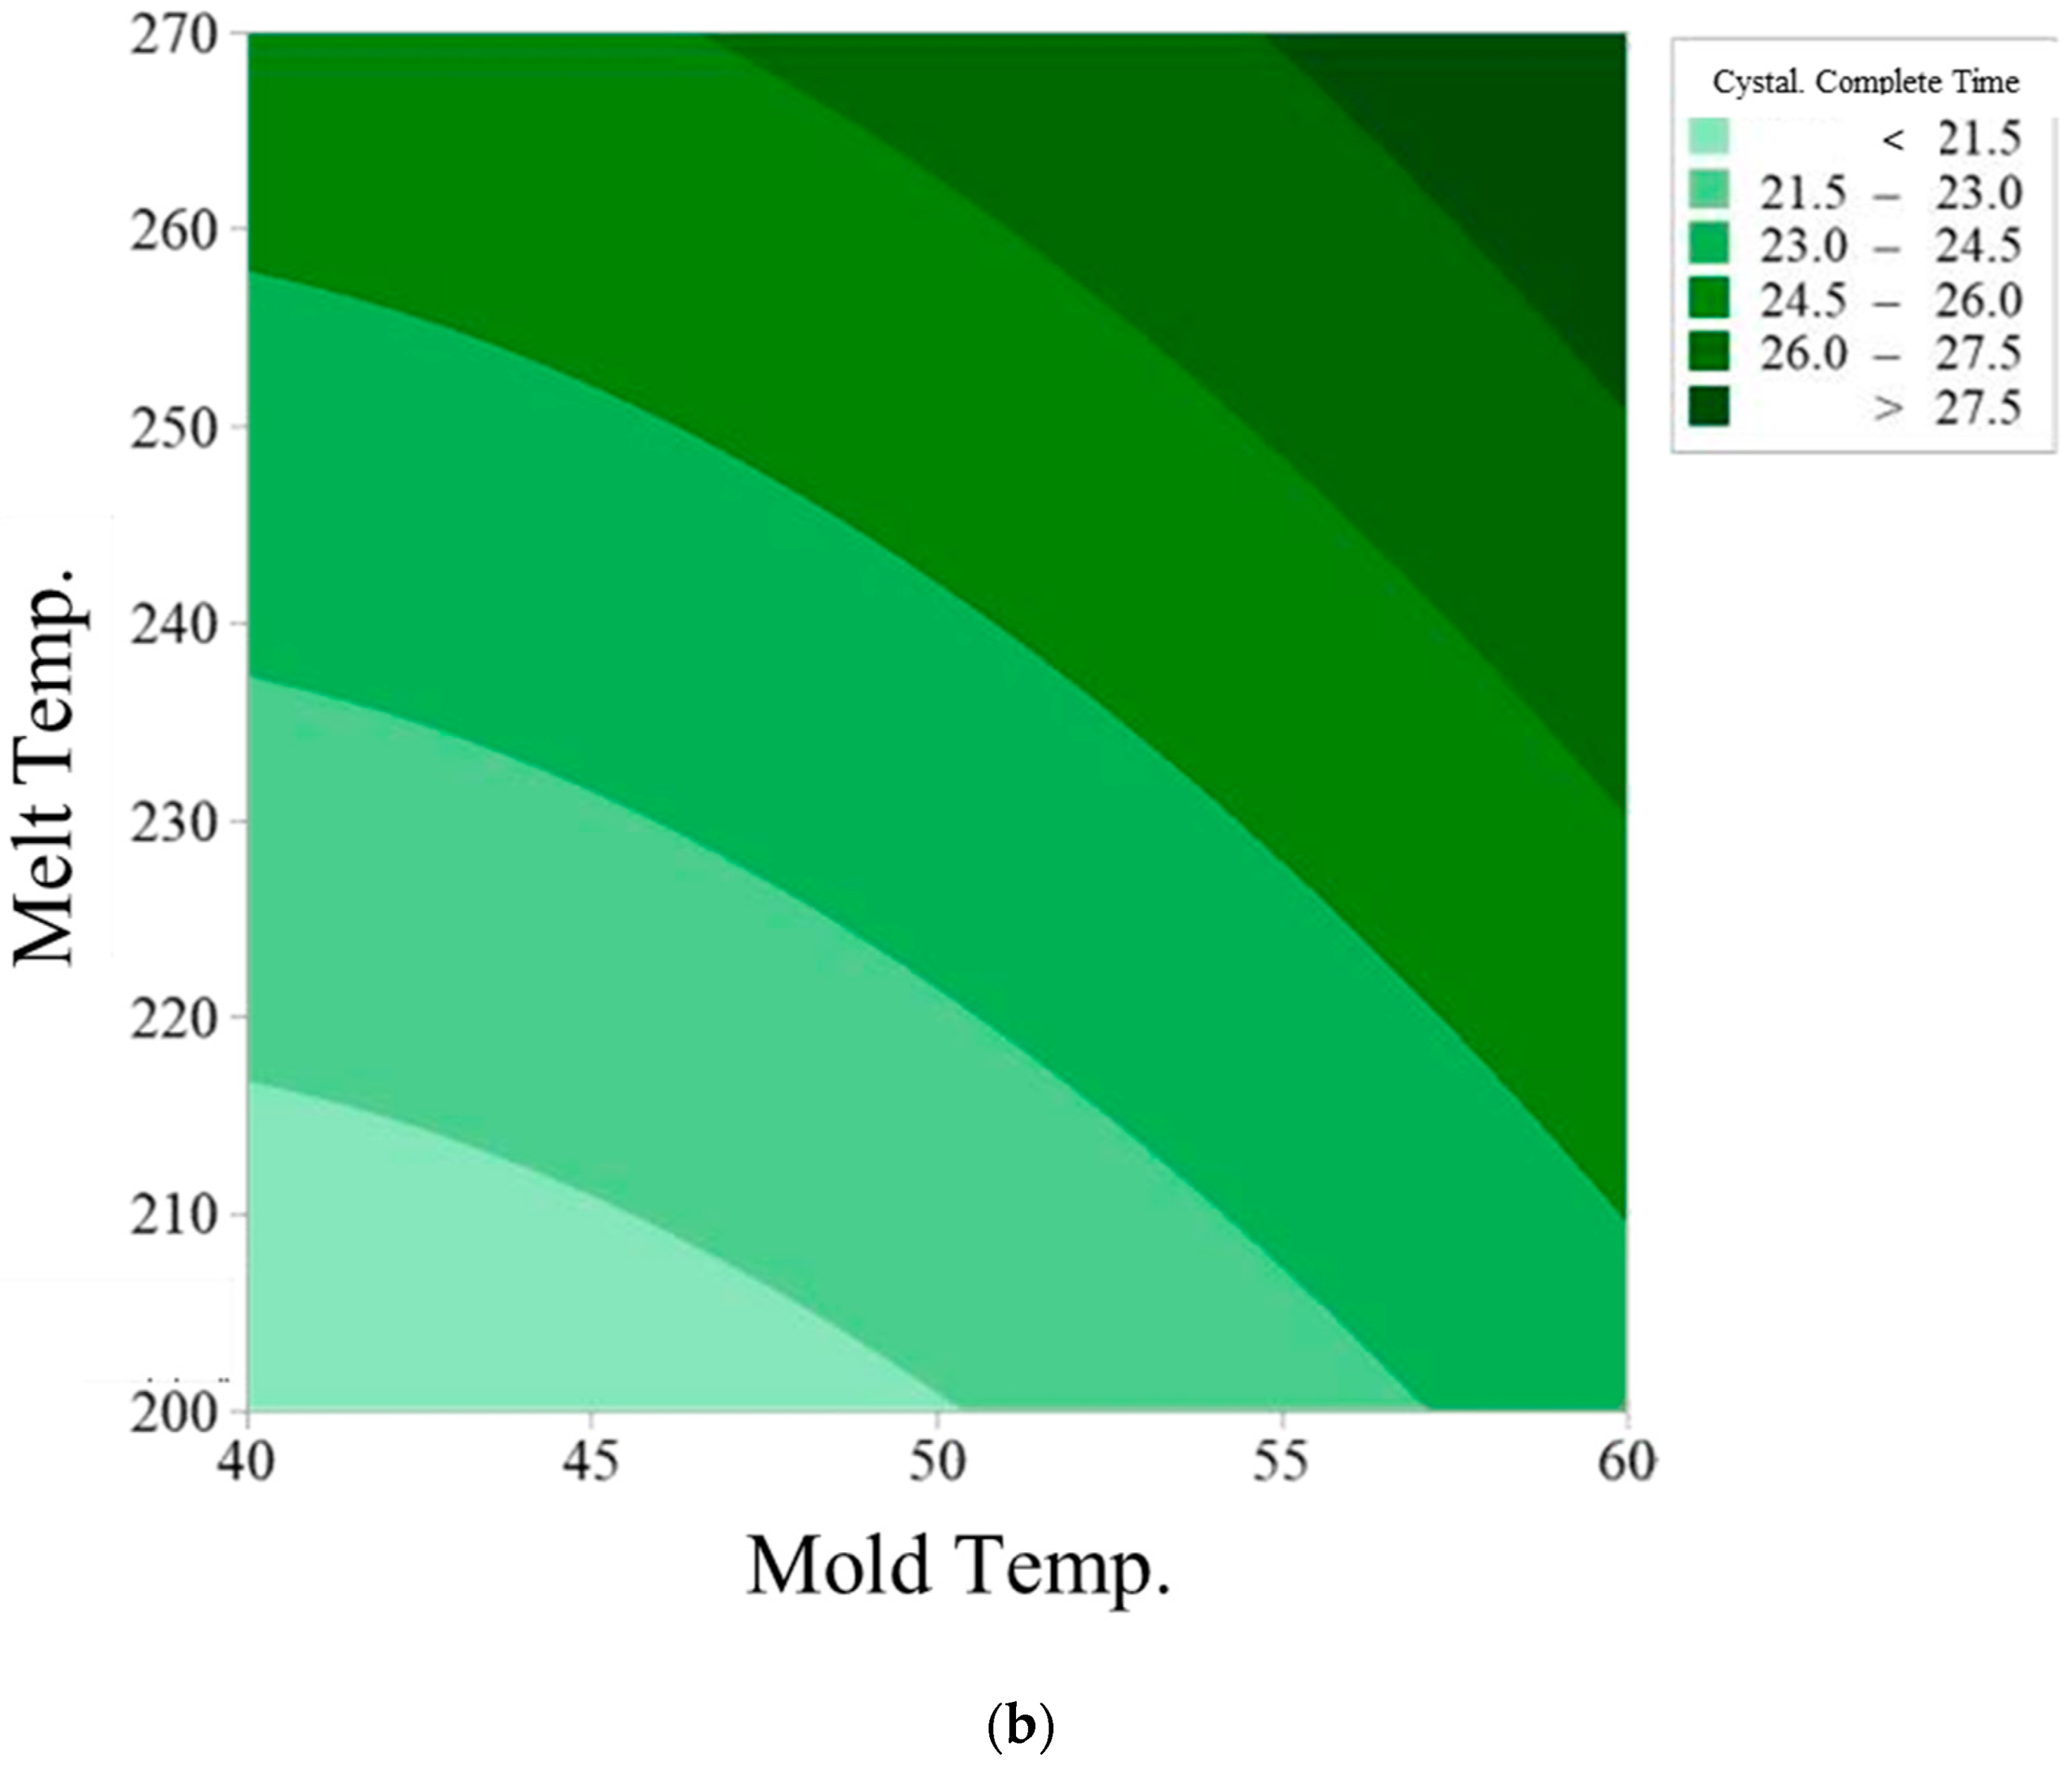
3.3. Prediction Model of Crystallization Completion Time

The initial prediction model can then be established as
t c r y s . = 13.37 0.447 × T m o l d + 0.0748 × T m e l t + 6.12 × 10 3 × T m o l d 2 9 × 10 6 × T m e l t 2 + 4.7 × 10 5 × T m e l t × T m o l d
Following the standard procedure of analysis of variance (ANOVA) and residual evaluation [27,28] using the statistical software Minitab11, https://www.sfi-minitab.com.tw/product/minitab/features.php (accessed on 30 July 2021), the initial model can be adjusted to
t c r y s . = 13.2 04.32 × T m o l d + 0.07308 × T m e l t + 6.08 × 10 3 × T m o l d 2
The adjusted R-square improved from 98.08% to 99.08% (a 0.26% improvement), and the predicted R-square increased from 96.01% to 98.61% with a 2.6% improvement. Details can be found elsewhere [30]. The response surface for the revised model is shown in Figure 12a, and the contour line is given in Figure 12b.

3.4. Prediction Model of Part Shrinkage Varying with the Time-Averaged Packing Pressure

Three illustrations were used to demonstrate the correlation between part shrinkage and melt temperature, packing pressure, and packing time. The influence of melt temperature on the cavity pressure in the middle of the cavity is shown in Figure 13. A higher melt temperature allows for easier pressure transfer from the gate to the cavity. Generally, the higher the melt temperature, the longer the crystallization time and the packing pressure value, resulting in a higher averaged pressure integral (Table 7). The influence of the packing pressure and time on the cavity pressure profiles is demonstrated in Figure 14 and Figure 15, respectively. Notably, higher packing pressure and time lead to higher cavity pressure and increased pressure duration. As a result, the averaged pressure integral values are higher. The results of Table 7 indicate that packing pressure affects the pressure integral most significantly. Packing time also has a secondary impact on the pressure integral, and its influence increases with packing pressure. The observed results are consistent with previous results [11].
Using Equation (2), the averaged solidification cavity pressure can be calculated based on the pressure profiles at different locations. The averaged values are listed in the end column of Table 7. The measured and calculated data of time-averaged pressure and shrinkage were used to fit the three shrinkage prediction models (Equations (4)–(6)) that were previously described). After conducting ANOVA and residual analysis using Minitab software [30,31], the adjusted and non-adjusted coefficients of determination for the three models are shown in Table 8. Based on this result, a second-order function was chosen, and the results are as follows:
S V = 1.910 0.004115 × P S a v g + 6 × 10 6 × P S a v g 2
The model-predicted values versus the measured shrinkage are given in Figure 16.

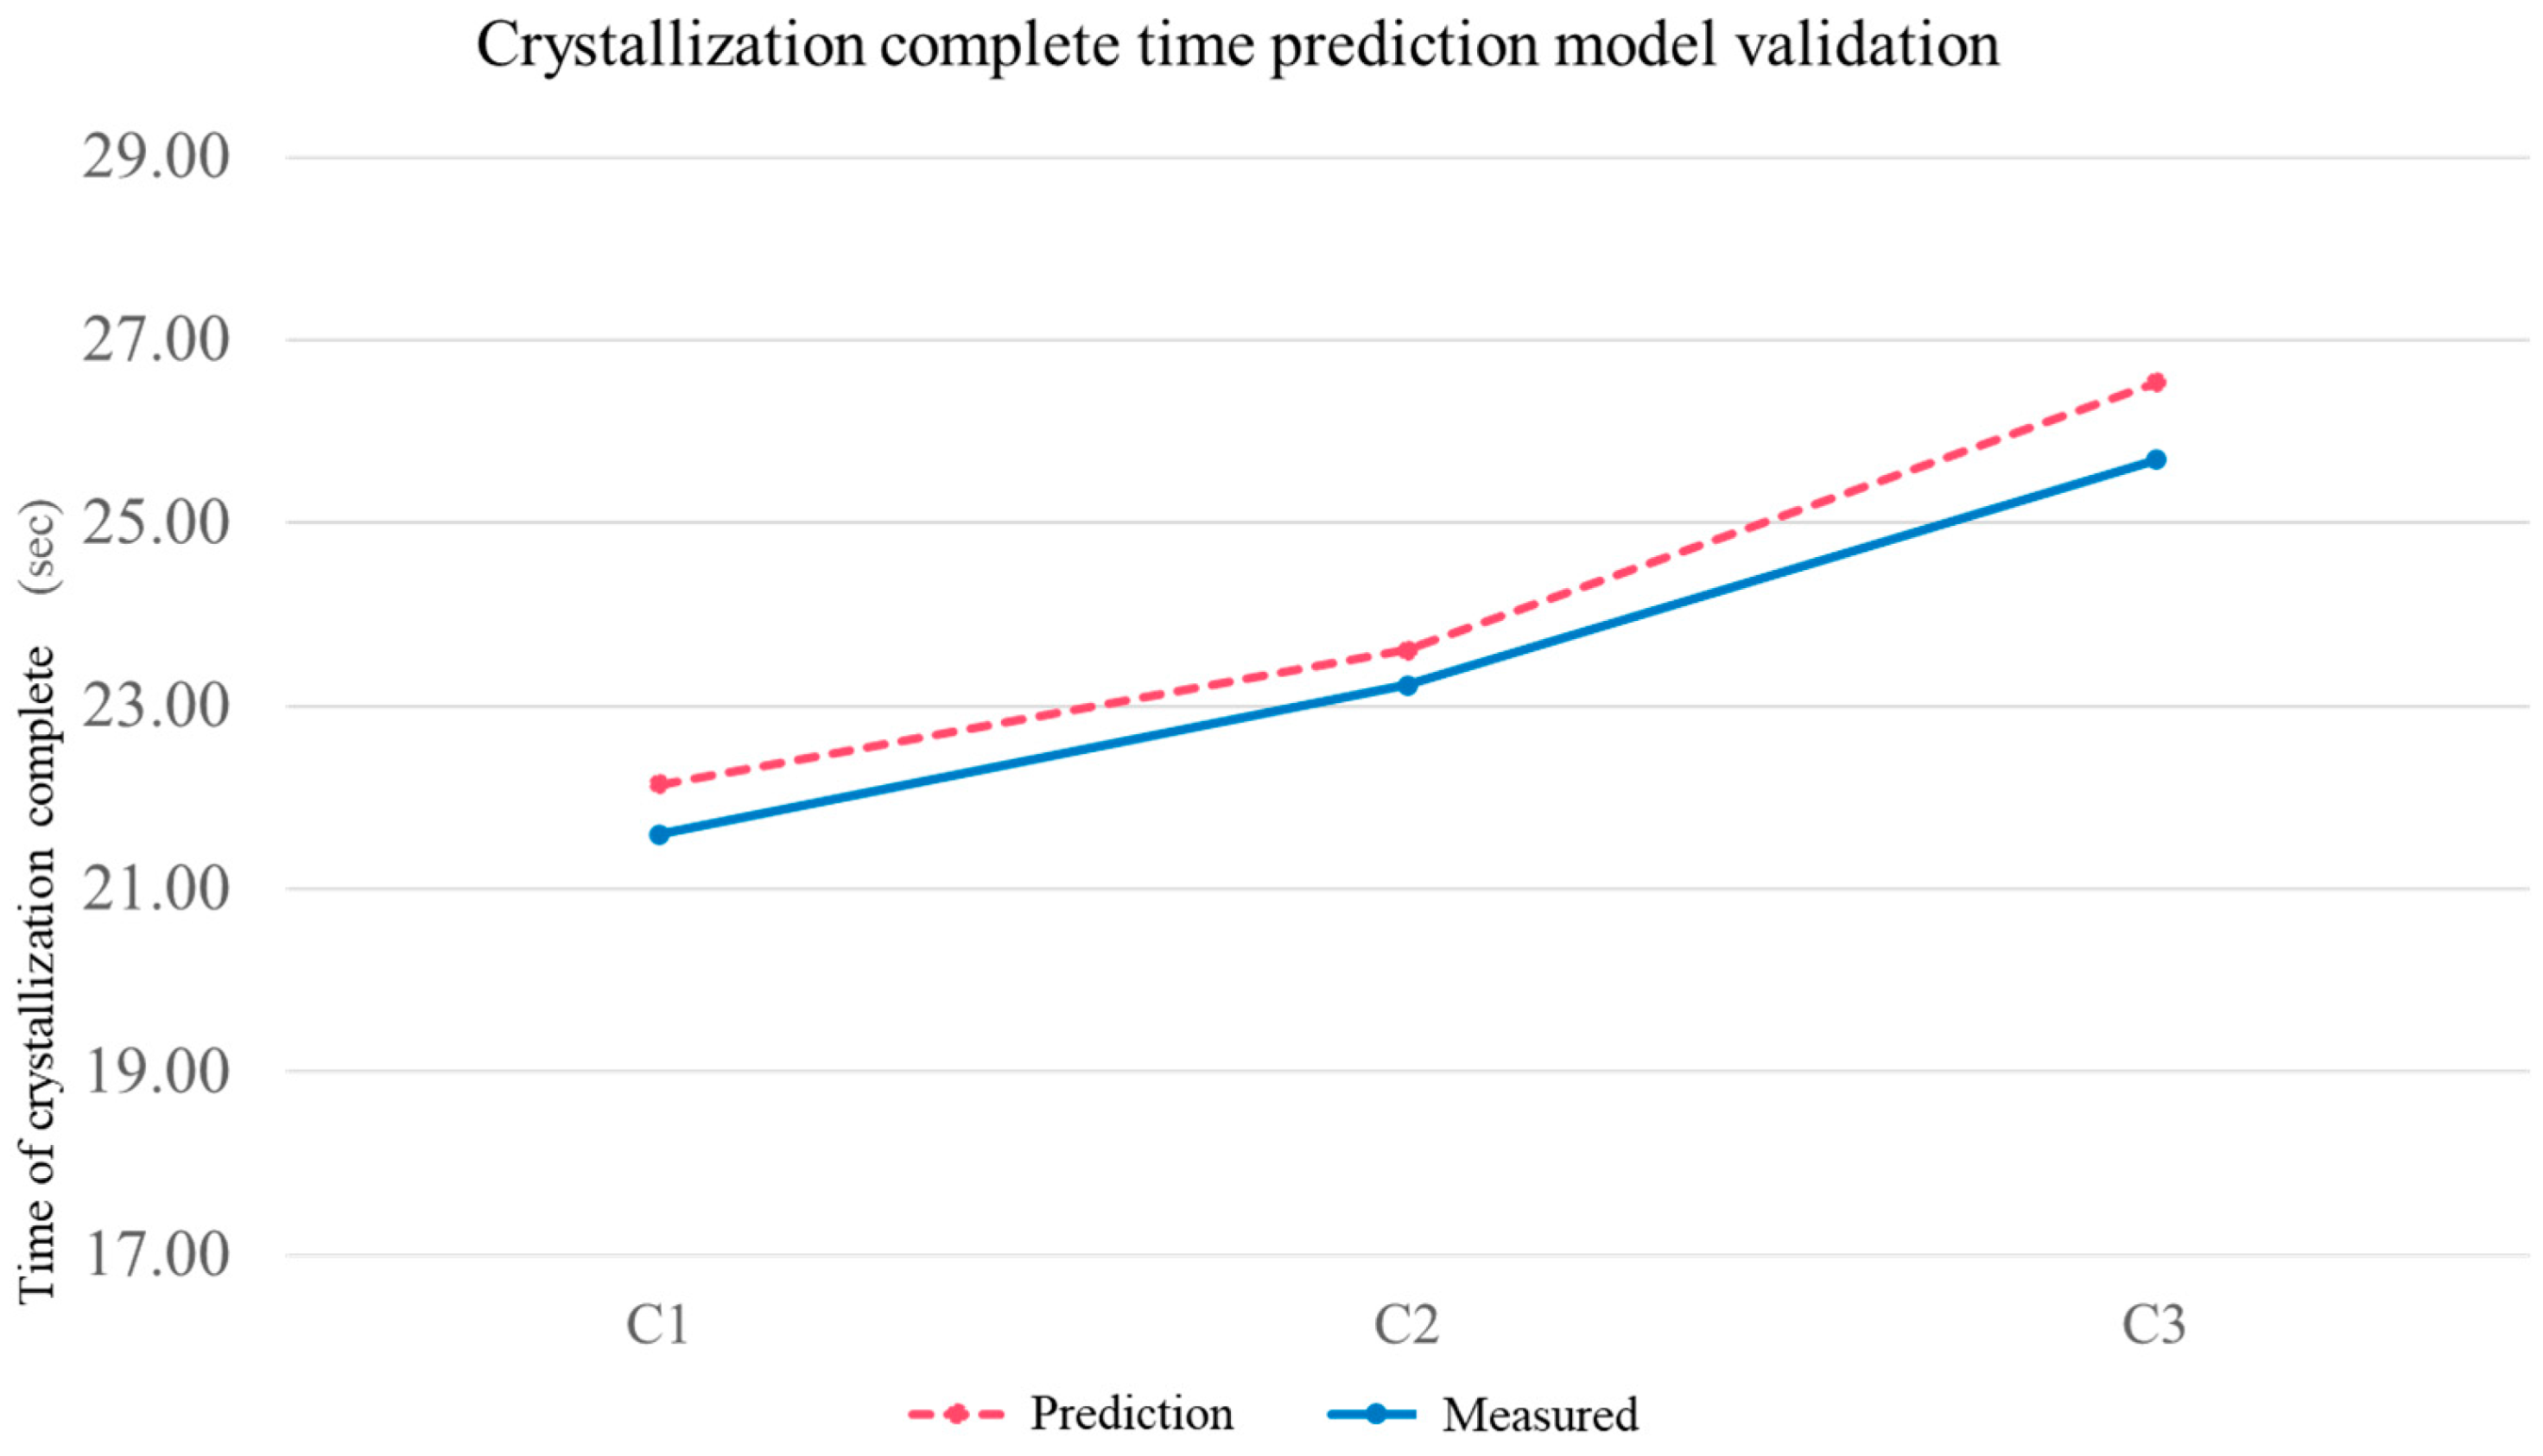
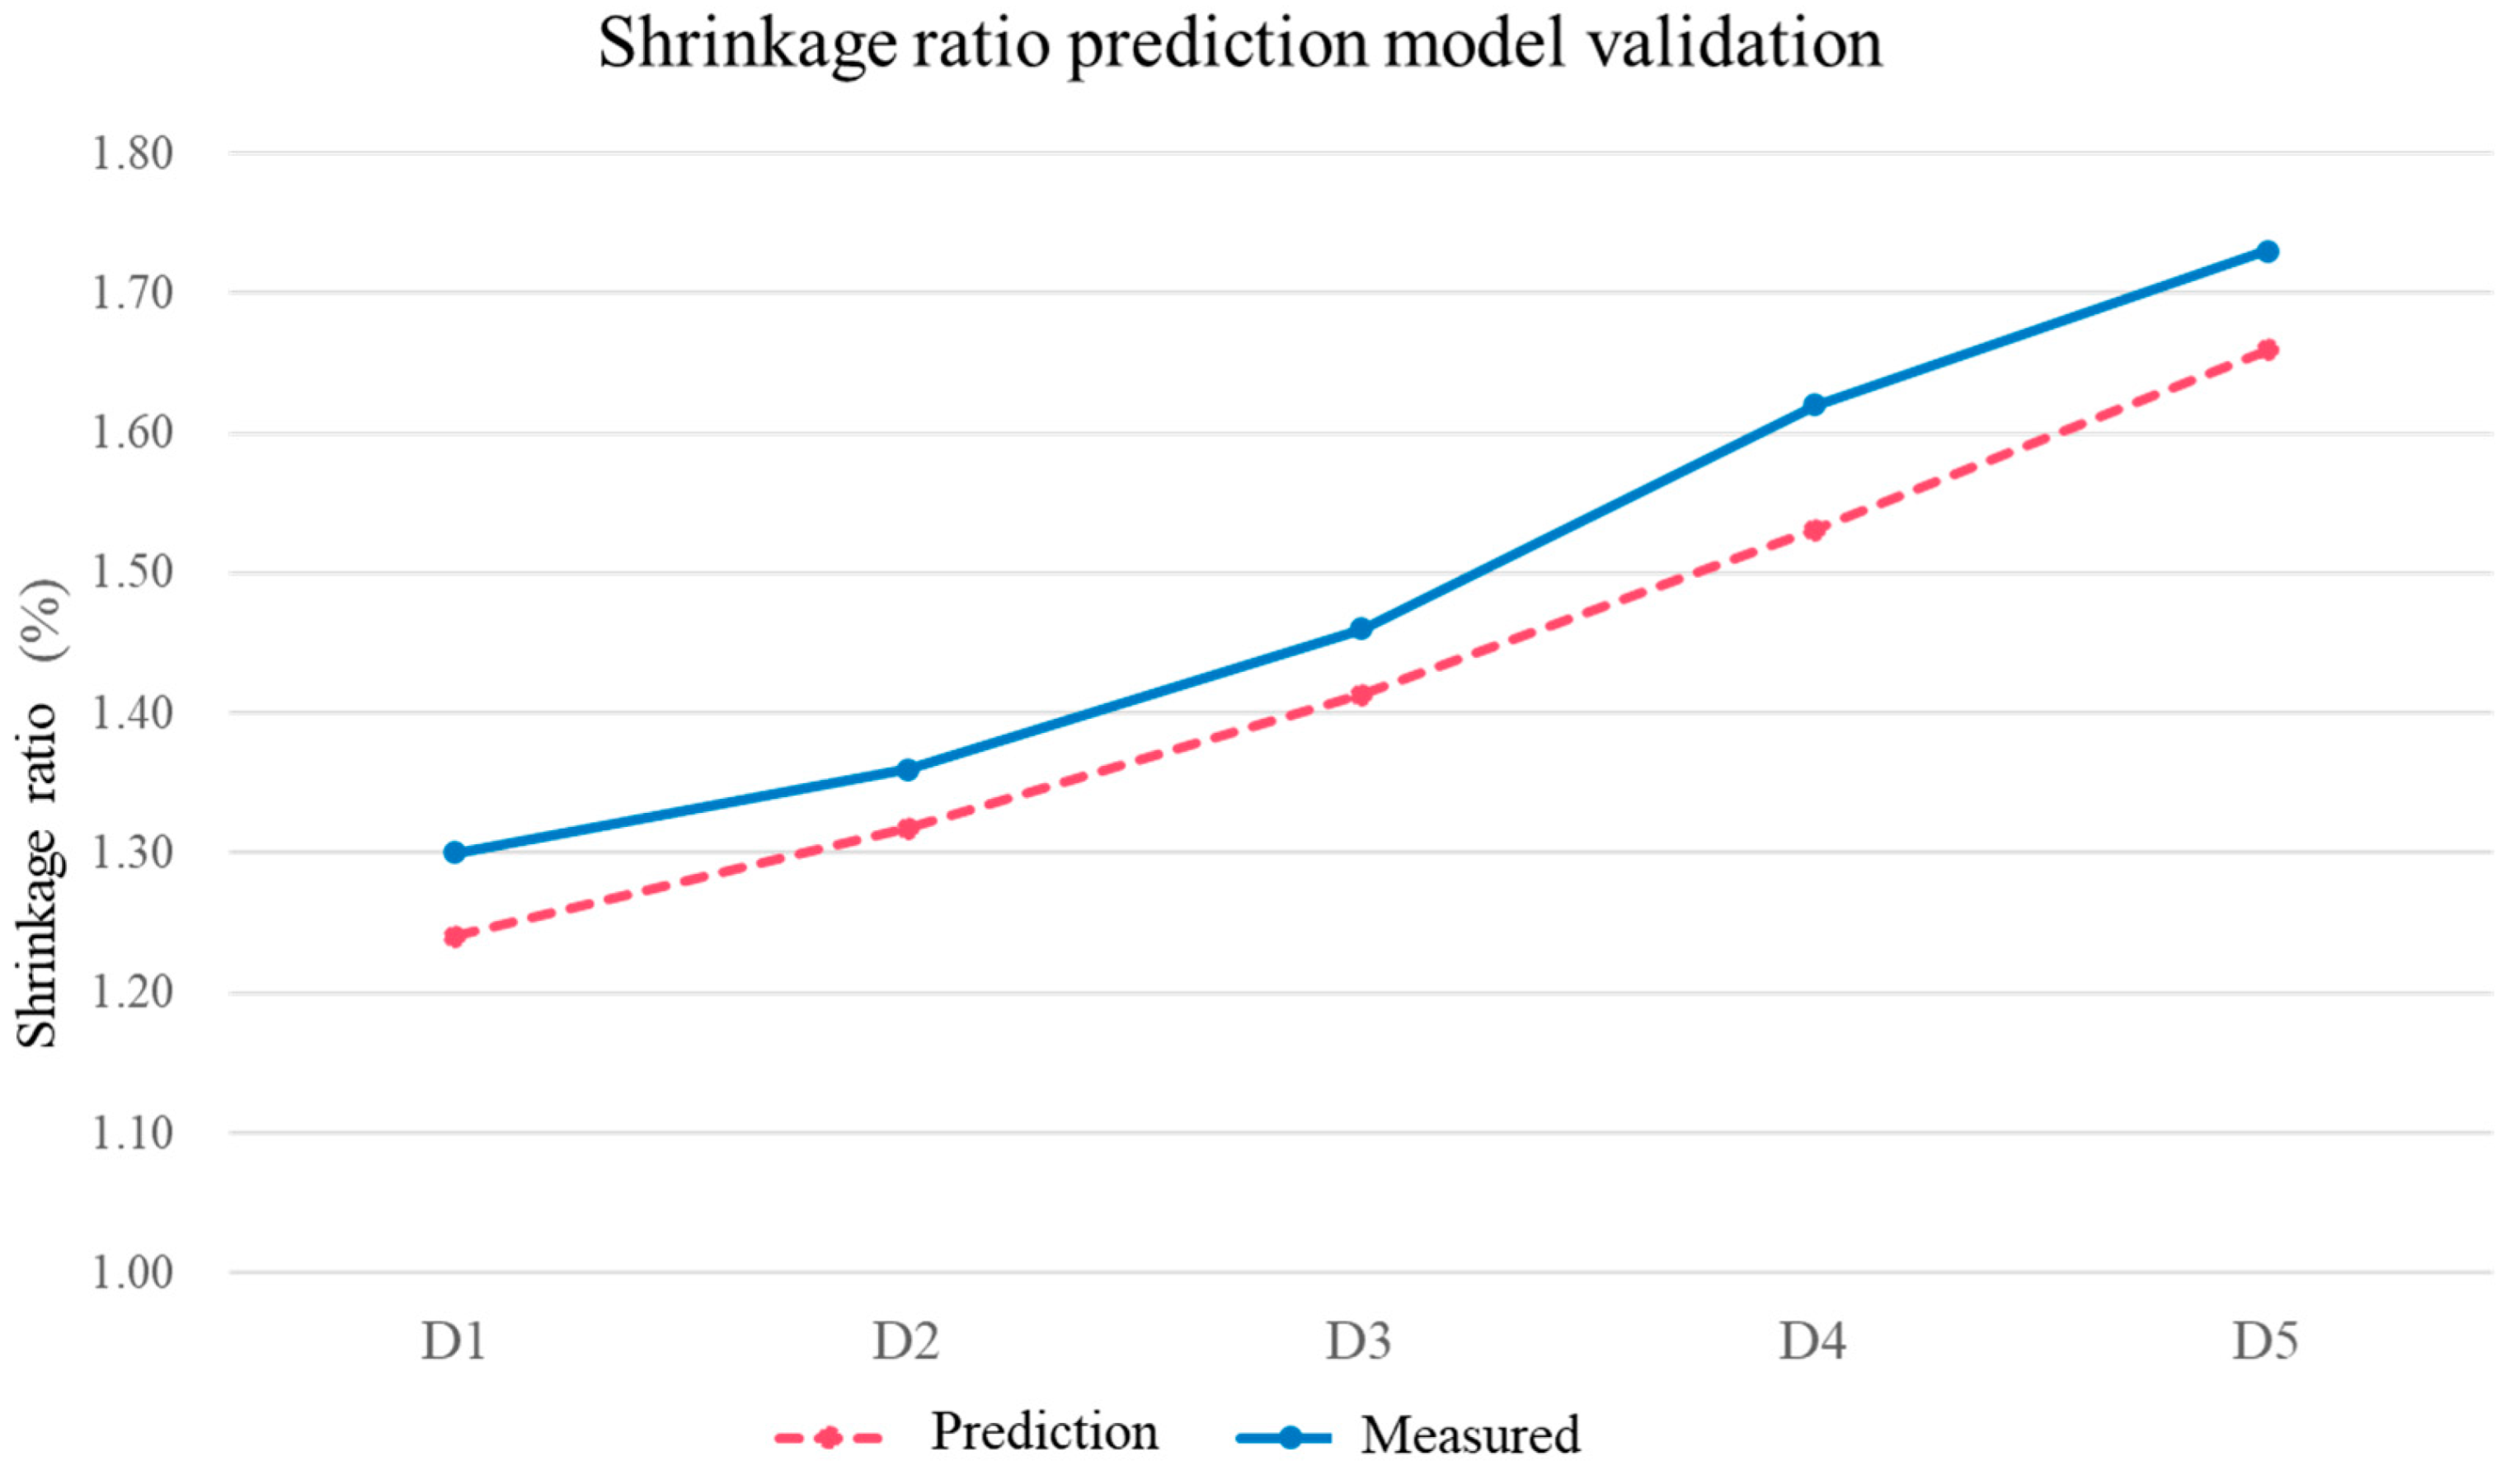
3.5. Verification Experiments

The results of the verification experiments, with maximum errors of 1.53% and 0.1%, respectively, are shown in Figure 17 and Figure 18, indicating the appropriateness of both models for improving part shrinkage by choosing suitable process conditions.
Table 7. Measured and calculated results of time-averaged pressure.
GroupMelt Temp.
(°C)
Packing Pressure
(Bar)
Packing Time
(S)
tcrys. (S)PSavg (Bar)
B12109001022.31307.02
B2210900721.78280.52
B3210900421.48150.62
B42106001021.67191.56
B5210600721.60170.77
B6210600423.54119.22
B72103001022.4379.08
B8210300722.2769.14
B9210300422.6058.15
B102309001023.74342.48
B11230900723.36261.16
B12230900424.72119.65
B132306001023.49203.01
B14230600723.23152.35
B15230600424.4699.61
B162303001024.7478.36
B17230300724.5268.74
B18230300425.1450.20
B192509001025.21336.84
B20250900724.60210.53
B21250900427.04108.73
B222506001024.89199.10
B23250600725.69136.91
B24250600427.0077.44
B252503001025.8982.14
B26250300726.1865.96
B27250300427.0346.07
Table 8. Adjusted and non-adjusted coefficients of determination for the three types of functions with different orders.
EquationsCoefficients
Linear equation:
S V = 1.767 0.002024 × P S a v g
R-sq   R-sq (Adj.)
89.36%  89.16%
Quadratic equation:
S V = 1.910 0.004115 × P S a v g + 6 × 10 6 × P S a v g 2
R-sq   R-sq (Adj.)
94.00%  93.76%
Cubic equation:
S V = 1.901 0.003899 × P S a v g + 4 × 10 6 × P S a v g 2 + 10 10 × P S a v g 3
R-sq   R-sq (Adj.)
94.00%  93.64%

4. Conclusions

Achieving a target part shrinkage for injection-molded crystalline polymer usually includes a dilemma for molders due to the uncertainty of crystallinity and process-dependent variations. If the completion of the crystallization process can be assured, then the optimization of molding conditions to obtain good part qualities becomes easier. In this study, we proposed a new methodology to detect the enthalpy change of crystalline polymers by monitoring the melt temperature using an infrared temperature sensor. The end of the crystallization was identified as the time when the minimum cooling rate of the measured temperature curve occurred. We then constructed a model to predict the crystallization completion time based on experiments at various melt and mold temperatures using response surface methodology. The validity of the predicted model was further verified by examining part warpage molded under various cooling times. The warpage variation and distribution demonstrated that when the cooling time is longer than the crystallization time, the part warpage stabilizes and the warpage resulting from incomplete crystallization is excluded, indicating the appropriateness of the predicted crystallization times. To further improve the part shrinkage, we conducted another set of experiments focusing on the influence of packing pressure and time and the possible associated effects of the melt temperature. Using regression analysis, we used the experimental results to build a prediction model that correlates time-averaged cavity pressure with part shrinkage. The predicted model well fits the experimental data. Both models were further verified with designed experiments, demonstrating accuracies of 1.53% and 0.1% for the influence of crystallization time and time-averaged packing pressure on shrinkage, respectively. The predicted models can easily optimize the molding conditions to improve part shrinkage and minimize warpage.

Author Contributions

Conceptualization, S.-C.C.; Methodology, B.-L.T.; Validation, C.-C.H.; Formal analysis, B.-L.T. and C.-C.H.; Investigation, B.-L.T. and C.-C.H.; Resources, N.-T.C. and E.-N.S.; Data curation, B.-L.T. and C.-C.H.; Writing—original draft, S.-C.C.; Writing—review & editing, S.-C.C. and C.-T.F.; Visualization, B.-L.T. and C.-T.F.; Supervision, S.-C.C., N.-T.C. and E.-N.S.; Project administration, S.-C.C.; Funding acquisition, N.-T.C. and E.-N.S. All authors have read and agreed to the published version of the manuscript.

Funding

This research was financially supported by the National Science and Technology Council under grant 111-2622-8-033-002 and Smart Manufacturing R&D Centers for Semiconductor Carrier of Chung Yuan Christian University, Taiwan, ROC.

Institutional Review Board Statement

Not applicable.

Informed Consent Statement

Not applicable.

Data Availability Statement

Not applicable.

Conflicts of Interest

The authors declare no conflict of interest.

References

  1. Chen, Z.; Turng, L.S. A Review of Current Developments in Process and Quality Control for Injection Molding. Adv. Polym. Technol. 2005, 24, 165–182. [Google Scholar] [CrossRef]
  2. Johannaber, F. Injection Molding Machines, 3rd ed.; Hanser Publishers: Munich, Germany, 1994; p. 29. [Google Scholar]
  3. Chang, Y.H.; Chen, S.C.; Ting, Y.H.; Feng, C.T.; Hsu, C.C. The investigation of novel dynamic packing technology for injection molded part quality control and its production stability by using real-time PVT control method. Polymer 2022, 14, 2720–2736. [Google Scholar] [CrossRef] [PubMed]
  4. Chang, Y.H.; Wei, T.H.; Chen, S.C.; Lou, Y.F. The Investigation on PVT Control Method Establishment for Scientific Injection Molding Parameter Setting and Its Quality Control. Polym. Eng. Sci. 2020, 60, 2895–2907. [Google Scholar] [CrossRef]
  5. Zoller, P.; Walsh, D.J. Standard Pressure-Volume-Temperature Data for Polymers. J Polym. Sci. A. Polym Chem. 1995, 34, 1365. [Google Scholar]
  6. Berry, J.M.; Brostow, W.; Hess, M.; Jacobs, E.G. P-V-T Relations in A Series of Longitudinal Polymer Liquid Crystals with Varying Mesogen Concentration. Polymer 1998, 39, 4081–4088. [Google Scholar] [CrossRef]
  7. Wang, J.; Xie, P.; Ding, Y.; Yang, W. On-Line Testing Equipment of P–V–T Properties of Polymers Based on An Injection Molding Machine. Polym. Test. 2009, 28, 228–234. [Google Scholar] [CrossRef]
  8. Wang, J.; Xie, P.; Yang, W.; Ding, Y. Online Pressure–Volume–Temperature Measurements of Polypropylene Using A Testing Mold to Simulate The Injection- Molding Process. J. Appl. Polym. Sci. 2010, 118, 200–208. [Google Scholar] [CrossRef]
  9. Sanchez, R.; Aisa, J.; Martinez, A.; Mercado, D. On The Relationship Between Cooling Setup and Warpage in Injection Molding. Measurement 2012, 45, 1051–1056. [Google Scholar] [CrossRef]
  10. Wang, J.; Hopmann, C.; Röbig, M.; Hohlweck, T.; Alms, J. Modeling of pressure-specific volume-temperature behavior of polymers considering the dependence of cooling and heating processes. Mater. Des. 2020, 196, 109110. [Google Scholar] [CrossRef]
  11. Bushko, W.C.; Stokes, V.K. Estimates for Material Shrinkage in Molded Parts Caused by Time-Varying Cavity Pressures. Polym. Eng. Sci. 2019, 59, 1648–1656. [Google Scholar] [CrossRef]
  12. Chang, T.C. Robust process control in injection molding—Process capability comparison for five switchover modes. J. Inject. Molding Technol. 2002, 6, 239–246. [Google Scholar]
  13. Kazmer, D.O.; Velusamy, S.; Westerdale, S.; Johnston, S.; Gao, R.X. A Comparison of Seven Filling to Packing Switchover for Injection Molding. Polym. Eng. Sci. 2010, 50, 2031–2043. [Google Scholar] [CrossRef]
  14. Zhou, X.; Zhang, Y.; Mao, T.; Zhou, H. Monitoring and dynamic control of quality stability for injection molding process. J. Mater. Process. Tech. 2017, 249, 358–366. [Google Scholar] [CrossRef]
  15. Hopmann, C.; Kahve, C.; Schmitz, M. Development of a novel control strategy for a highly segmented injection mold tempering for inline part warpage control. Polym. Eng. Sci. 2020, 60, 2428–2438. [Google Scholar] [CrossRef]
  16. Rizvi1, S.J.A. Effect of injection molding parameters on crystallinity and mechanical properties of isotactic polypropylene. Int. J. Plast. Technol. 2017, 21, 404–426. [Google Scholar] [CrossRef]
  17. Le, M.C.; Belhabib, S.; Nicolazo, C.; Vachot, P.; Mousseau, P.; Sarda, A.; Deterre, R. Pressure influence on crystallization kinetics during injection molding. J. Mater. Process. Technol. 2011, 211, 1757–1763. [Google Scholar] [CrossRef]
  18. Gao, X.; Huang, Z.; Zhou, H.; Zhang, Y.; Liang, J. Influence of Injection Rate on Crystallization of Injection Molded ß-Nucleated Isotactic Polypropylene. Polym. Eng. Sci. 2017, 57, 172–173. [Google Scholar] [CrossRef]
  19. Wang, G.; Hou, S.; Cao, J.; Ding, P.; Shen, J.; Chen, J. Reinforcing and toughening isotactic polypropylene through shear-induced crystallization and β-nucleating agent induced crystallization. J. Polym. Res. 2018, 25, 233–240. [Google Scholar] [CrossRef]
  20. Zhao, P.; Yang, W.; Wang, X.; Li, J.; Yan, B.; Fu, J. A novel method for predicting degrees of crystallinity in injection molding during packing stage. Proc. Inst. Mech. Eng. Part B J. Eng. Manuf. 2017, 233, 204–214. [Google Scholar] [CrossRef]
  21. Yang, B.; Miao, J.B.; Min, K.; Xia, R.; Qian, J.S.; Wang, X. Solidification Behavior of High-Density Polyethylene During Injection Molding Process: Enthalpy Transformation Method. J. Appl. Polym. Sci. 2013, 128, 1922–1929. [Google Scholar] [CrossRef]
  22. Yang, B.; Fu, X.R.; Yang, W.; Liang, S.P.; Hu, S.; Yang, M.B. Simulation of Phase-Change Heat Transfer During Cooling Stage of Gas-Assisted Injection Molding of High-Density Polyethylene via Enthalpy Transformation Approach. Polym. Eng. Sci. 2009, 10, 1234–1242. [Google Scholar] [CrossRef]
  23. Yang, B.; Fu, X.R.; Yang, W.; Huang, L.; Yang, M.B.; Feng, J.M. Numerical Prediction of Phase-Change Heat Conduction of Injection-Molded High Density Polyethylene Thick-Walled Parts Via the Enthalpy Transforming Model with Mushy Zone. Polym. Eng. Sci. 2008, 48, 1707–1717. [Google Scholar] [CrossRef]
  24. Futaba Web. Available online: https://mms.mtb.futaba.co.jp/en/products/resintemperature/ (accessed on 30 July 2021).
  25. Abeykoon, C.; Martin, P.J.; Kelly, A.L.; Brown, E.C. A review and Evaluation of Melt Temperature Sensors for Polymer Extrusion. Sens. Actuators 2012, 181, 16–27. [Google Scholar] [CrossRef]
  26. Maier, C. Infrared Temperature Measurement of Polymers. Polym. Eng. Sci. 1996, 36, 1502–1512. [Google Scholar] [CrossRef]
  27. Heidari, B.S.; Oliaei, E.; Shayesteh, H.; Davachi, S.M.; Hejazi, I.; Seyfi, J.; Bahrami, M.; Rashedi, H. Simulation of mechanical behavior and optimization of simulated injection molding process for PLA based antibacterial composite and nanocomposite bone screws using central composite design. J. Mech. Behavior Bio. Mat. 2017, 65, 160–176. [Google Scholar] [CrossRef]
  28. Xu, R.T.; Wang, T.H.; Huang, C.T.; Chen, P.H.; Jong, W.R.; Chen, S.C.; Hsu, D.; Chang, R.Y. Study on Machine Identification and its Effect on the RSM Optimization in Injection Molding; SPE Technical Papers: Richardson, TX, USA, 2022. [Google Scholar]
  29. Pantani, R.; Coccorullo, I.; Speranza, V.; Titomanlio, G. Modeling of Morphology Evolution in the Injection Molding. Prog. Polym. Sci. 2005, 30, 1185–1222. [Google Scholar] [CrossRef]
  30. Cai, B.L. Study on Establishment of Enthalpy Transition Method and Average Solidification Pressure for Semi-Crystalline Polymer of Injection Molding Quality Prediction Method. Ph.D. Dissertation, Chung Yuan Christian University, Taoyuan City, Taiwan, 2022. [Google Scholar]
  31. Oliaei, E.; Heidari, B.S.; Davachi, S.M.; Bahrami, M.; Davoodi, S.; Hejazi, I.; Seyfi, J. Warpage and shrinkage optimization of injection-molded plastic spoon parts for biodegradable polymers using Taguchi, ANOVA and artificial neural network methods. J. Mat. Sci. Technol. 2016, 32, 710–720. [Google Scholar] [CrossRef]
Figure 1. Schematic of (a) a PVT diagram for a crystalline polymer and assumed PT path; (b) the change in the PVT curve due to the degree of crystallization in a semi-crystalline polymer.
Applsci 13 09884 g001
Figure 2. Schematic of the infrared temperature sensor that measures the maximum temperature within the melt. In contrast, a thermocouple only measures the temperature at the contact point of the cavity surface.
Applsci 13 09884 g002
Figure 3. (a) Geometry of the flat plate specimen and embedded sensors noted with positions. (b) Locations for warpage measurement. (c) Measured length L of the molded part (Original cavity length is L0.)
Applsci 13 09884 g003
Figure 4. Schematic of three stages of melt temperature variations during a crystallization process.
Applsci 13 09884 g004
Figure 5. (a) Typical temperature profile resulting from crystallization, where (b) the minimum cooling rate occurs at the end of crystallization.
Applsci 13 09884 g005
Figure 6. Illustration of pressure integral calculation from which the time-averaged solidification pressure can be evaluated. Evolution of pressure profile at various stages of processing are noted.
Applsci 13 09884 g006
Figure 7. Illustrations of measured temperature profiles under different melt temperatures at MID.
Applsci 13 09884 g007
Figure 8. Illustrations of measured temperature profiles under different mold temperatures at MID.
Applsci 13 09884 g008
Figure 9. Illustrations of measured temperature profiles at different part locations.
Applsci 13 09884 g009
Figure 10. Warpage distribution at different cavity positions with different cooling times.
Applsci 13 09884 g010
Figure 11. Maximum warpage versus cooling time.
Applsci 13 09884 g011
Figure 12. (a) Response chart and (b) contour plot of crystallization time prediction model.
Applsci 13 09884 g012aApplsci 13 09884 g012b
Figure 13. Pressure and temperature curves at MID molded under different melt temperatures.
Applsci 13 09884 g013
Figure 14. Pressure and temperature curves at MID molded under different packing pressures.
Applsci 13 09884 g014
Figure 15. Pressure and temperature curves at MID molded under different packing times.
Applsci 13 09884 g015
Figure 16. Variation in the shrinkage ratio with the time-averaged solidification pressure.
Applsci 13 09884 g016
Figure 17. Verification results of crystallization completion time for the prediction model.
Applsci 13 09884 g017
Figure 18. Verification results of the part shrinkage ratio for the prediction model.
Applsci 13 09884 g018
Table 1. Experimental parameters for crystallization detection.
Varying Process Parameters
RSM GroupMold Temp. (°C)Melt Temp. (°C)
A140200
A260200
A340270
A460270
A540235
A660235
A750200
A850270
A950235
A1050235
A1150235
A1250235
A1350235
Fixed process parameters
Injection speed (mm/s)20
Velocity/pressure switch position (mm)4
Packing pressure (bar)800
Packing time (s)9
Cooling time (s)45
Table 2. Molding experimental parameters to determine part warpage with varying cooling times.
Fixed Process Parameters
Injection speed(mm/s)20
Velocity/pressure switch position(mm)4
Packing pressure(bar)800
Packing time(s)9
Melt temperature(°C)235
Mold temperature(°C)50
Cooling time(s)5, 7.5, 10, 12.5, 15, 17.5, 22.5, 30
Table 3. Experimental design with a combination of processing conditions.
GroupMelt Temp. (°C)Packing Pressure (Bar)Packing Time
(S)
B121090010
B22109007
B32109004
B421060010
B52106007
B62106004
B721030010
B82103007
B92103004
B1023090010
B112309007
B122309004
B1323060010
B142306007
B152306004
B1623030010
B172303007
B182303004
B1925090010
B202509007
B212509004
B2225060010
B232506007
B242506004
B2525030010
B262503007
B272503004
Table 4. Verification experiment design with various melt temperatures.
Varying Process Parameters
GroupMelt Temp. (°C)
C1210
C2230
C3250
Fixed process parameters
Mold temperature (°C)50
Injection speed (mm/s)20
Velocity/pressure switch position (mm)4
Packing pressure (bar)800
Packing time (s)9
Cooling time (s)45
Table 5. Verification experiment design with various packing times.
Varying Process Parameters
GroupPacking Time (S)
D111
D29
D37
D45
D53
Fixed process parameters
Mold temperature (°C)50
Melt temperature (°C)270
Injection speed (mm/s)20
Velocity/pressure switch position (mm)4
Packing pressure (bar)800
Cooling time (s)45
Table 6. Results of crystallization completion time at different cavity positions.
Mold Temp. (°C)Melt Temp. (°C)Crystallization Completion Time (S)
NGMIDFGAverage
4020021.0120.3919.1620.18
4023523.6822.8222.9123.14
4027025.7024.8125.2625.26
5020022.2221.3721.2421.61
5023524.3524.1523.6924.06
5027027.8025.7426.1626.57
6020024.7722.7023.8923.78
6023526.2826.9525.6226.28
6027030.5028.4428.0929.01
Disclaimer/Publisher’s Note: The statements, opinions and data contained in all publications are solely those of the individual author(s) and contributor(s) and not of MDPI and/or the editor(s). MDPI and/or the editor(s) disclaim responsibility for any injury to people or property resulting from any ideas, methods, instructions or products referred to in the content.

