

Modelling of Earphone Design Using Principal Component Analysis


Abstract
:1. Introduction
1.1. Aim and Objectives
- To develop a simplified formulation of the earphone design problem in order to capture and characterize the design parameters and the expected sound quality outcomes.
- To deduce the mathematical expression based on linear regression for the predictive model.
- To develop a simplified mathematical model using the principal component analysis technique.
- To contrast and compare the predictive performance of the two modelling approaches.
- To give recommendations on the design of earphones based on the analytic findings of the research.
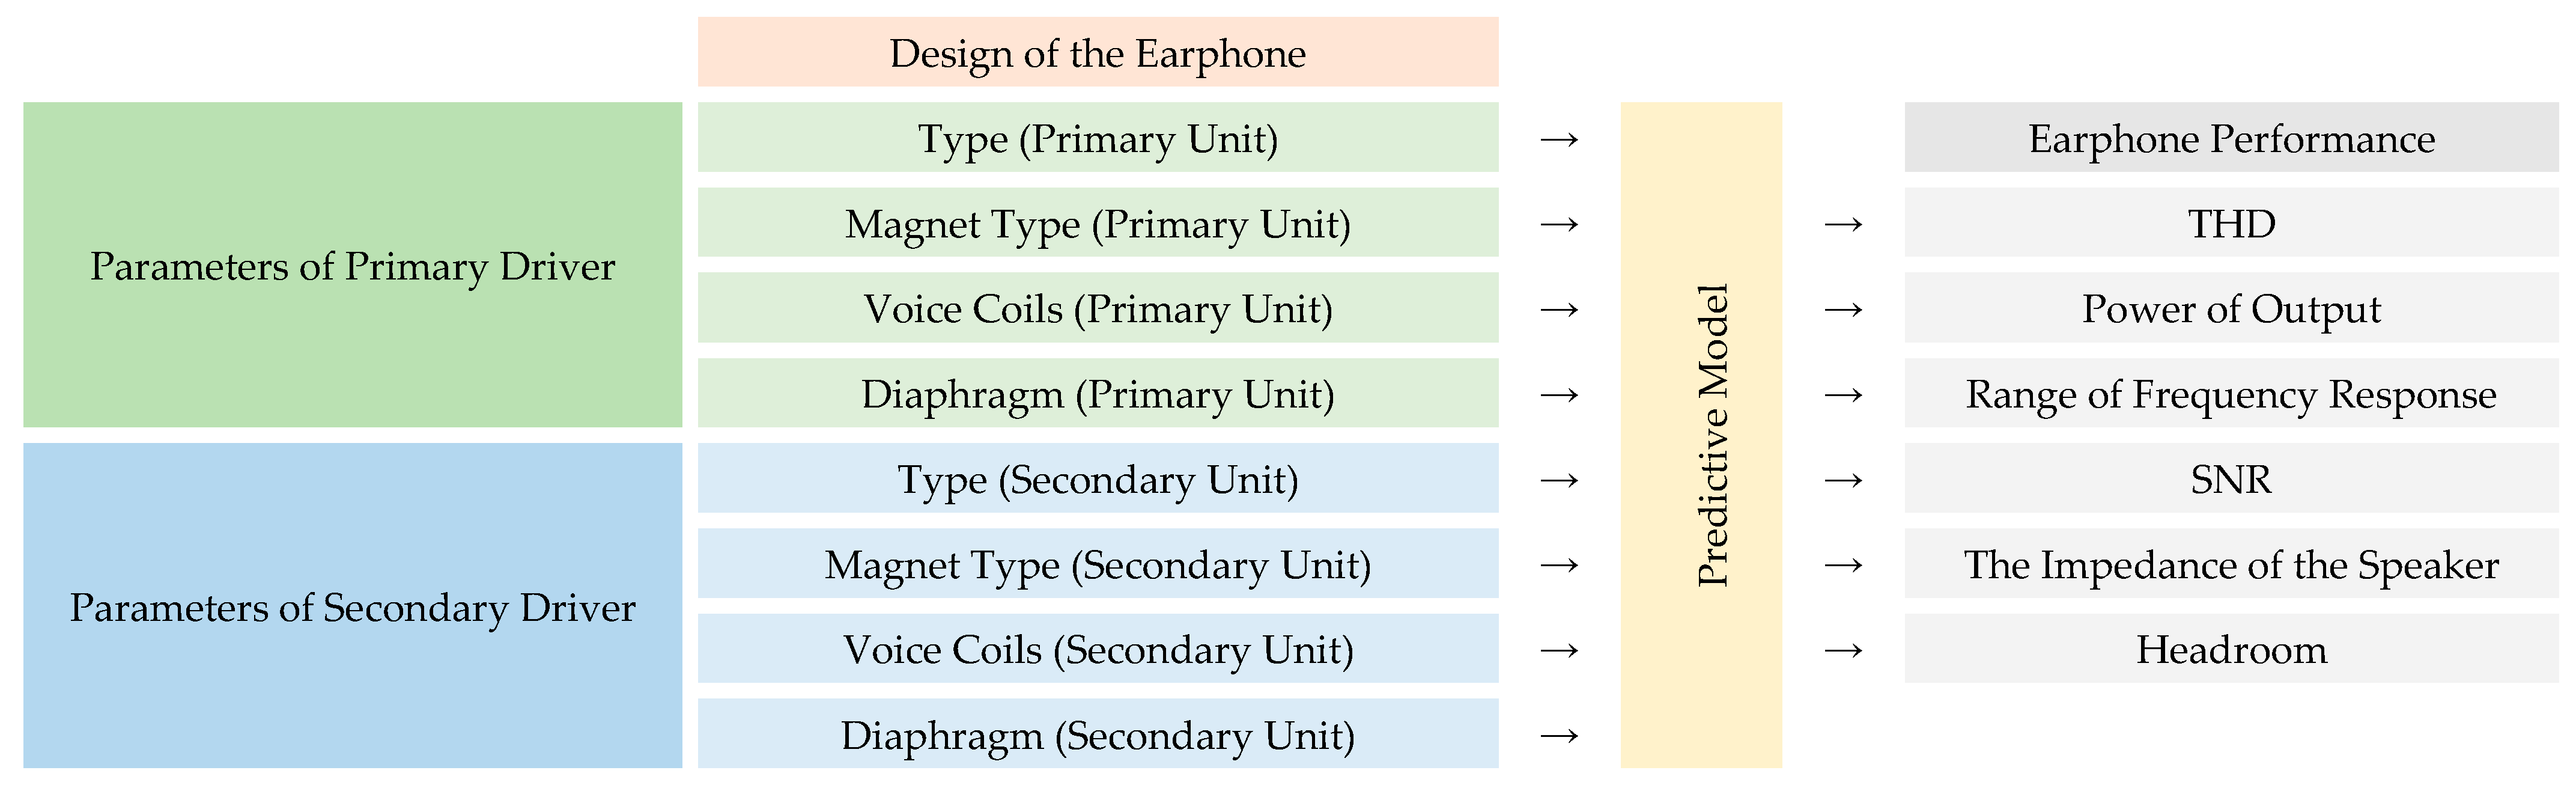
1.2. Design Parameters
1.3. Sound Quality Performance
1.4. Organization of the Report
2. Materials and Methods
2.1. Development of Research Framework
2.2. Steps of the Study
2.3. Overview of the Training Set
2.4. Development of the Predictive Models
3. Results
3.1. Descriptive Analysis of the Testing Data
3.2. Alignment of the Model Based on Principal Component Analysis
3.3. Comparison of the Predictive Performance
4. Discussion
5. Conclusions
Author Contributions
Funding
Data Availability Statement
Acknowledgments
Conflicts of Interest
References
- Patel, V.; Cheer, J.; Fontana, S. Design and Implementation of an Active Noise Control Headphone with Directional Hear-through Capability. IEEE Trans. Consum. Electron. 2020, 66, 32–40. [Google Scholar] [CrossRef]
- Widén, S.E.; Möller, C.; Kähäri, K. Headphone Listening Habits, Hearing Thresholds and Listening Levels in Swedish Adolescents with Severe to Profound HL and Adolescents with Normal Hearing. Int. J. Audiol. 2018, 57, 730–736. [Google Scholar] [CrossRef]
- Xiao, F.; Chan, P.K. A Performance-aware Low-quiescent Headphone Amplifier in 65-nm CMOS. IEEE J. Solid-State Circuits 2017, 52, 505–516. [Google Scholar] [CrossRef]
- Lui, K.H.; Lee, K.M. An Investigation of the Earphone Design with Regression Analysis. In Proceedings of the First Australian International Conference on Industrial Engineering and Operations Management, Sydney, Australia, 20–22 December 2022. [Google Scholar]
- Beattie, J.R.; Esmonde-White, F.L. Exploration of Principal Component Analysis: Deriving Principal Component Analysis Visually Using Spectra. Appl. Spectrosc. 2021, 75, 361–375. [Google Scholar] [CrossRef] [PubMed]
- Klich, R. Amplifying Sensory Spaces: The In- and Out-puts of Headphone Theatre. Contemp. Theatre Rev. 2017, 27, 366–378. [Google Scholar] [CrossRef]
- Overberg, J. ‘Skipping the Quality Abracadabra’: Academic Resistance to Quality Management in Finnish Higher Education Institutions and Quality Managers’ Strategies to Handle It. Qual. High. Educ. 2019, 25, 227–244. [Google Scholar] [CrossRef]
- Diy-Audio-Heaven, “Headphone Driver Types|Diy-Audio-Heaven”. Available online: https://diyaudioheaven.wordpress.com/headphones/headphone-driver-types/ (accessed on 7 July 2023).
- Denk, F.; Hiipakka, M.; Kollmeier, B.; Ernst, S.A. An Individualised Acoustically Transparent Earpiece for Hearing Devices. Int. J. Audiol. 2018, 57 (Suppl. S3), 5–25. [Google Scholar] [CrossRef]
- McCracken, T.R.; Fabie, J.E.; Burton, J.A.; Munawar, S.; Holcomb, M.A.; Dubno, J.R. Earphone and Aided Word Recognition Differences in Cochlear Implant Candidates. Otol. Neurotol. 2018, 39, 6–15. [Google Scholar] [CrossRef] [PubMed]
- Smull, C.C.; Madsen, B.; Margolis, R.H. Evaluation of Two Circumaural Earphones for Audiometry. Ear Hear. 2019, 40, 177–183. [Google Scholar] [CrossRef]
- Bi, H.; Sun, Y.; Liu, J.; Cao, L. Smartear: Rhythm-based Tap Authentication Using Earphone in Information-centric Wireless Sensor Network. IEEE Internet Things J. 2022, 9, 885–896. [Google Scholar] [CrossRef]
- Ramatsoma, H.; Koekemoer, D.; Clark, J.L.; Malan, K. One-eartip Solution for Pure-tone Audiometry and Acoustic Immittance Measurements: Using Insert Earphone with an Immittance Probe Ear Tip. Int. J. Audiol. 2021, 61, 251–257. [Google Scholar] [CrossRef] [PubMed]
- Alaei, A.; Saghaeian Nejad, S.M.; Gieras, J.F.; Lee, D.-H.; Ahn, J.-W. Reduction of High-Frequency Injection Losses, Acoustic Noise and Total Harmonic Distortion in IPMSM Sensorless Drives. IET Power Electron. 2019, 12, 3197–3207. [Google Scholar] [CrossRef]
- Hang, L.; Subramaniam, U.; Bayrak, G.; Moayedi, H.; Ghaderi, D.; Minaz, M.R. Influence of a Proposed Switching Method on Reliability and Total Harmonic Distortion of the Quasi Z-source Inverters. IEEE Access 2020, 8, 33088–33100. [Google Scholar] [CrossRef]
- Sánchez, A.R.; Moreno, R.L.; Ferreira, L.H.; Crepaldi, P.C. Biasing Technique to Improve Total Harmonic Distortion in an Ultra-low-power Operational Transconductance Amplifier. Iet Circuits Devices Syst. 2019, 13, 920–927. [Google Scholar] [CrossRef]
- Martin, D.W.; Anderson, L.J. Headphone Measurements and Their Interpretation. J. Acoust. Soc. Am. 1947, 19, 63–70. [Google Scholar] [CrossRef]
- Liu, Y.; You, S.; Tan, J.; Zhang, Y.; Liu, Y. Assessment and Enhancement of the U.S. Power Grids toward Extra-high Photovoltaic Generation Penetrations-An Industry Perspective. IEEE Trans. Power Syst. 2018, 33, 3438–3449. [Google Scholar] [CrossRef]
- Hiipakka, M.; Tikander, M.; Karjalainen, M. Modeling the External Ear Acoustics for Insert Headphone Usage. J. Audio Eng. Soc. 2010, 58, 269–281. [Google Scholar]
- Christensen, A.T.; Hess, W.; Silzle, A.; Hammershøi, D. Magnitude and Phase Response Measurement of Headphones at the Eardrum. In Proceedings of the 51st International Conference: Loudspeakers and Headphones, Helsinki, Finland, 22–24 August 2013; Volume 3, pp. 1–10. [Google Scholar]
- Olive, S.; Welti, T.; Mcmullin, E. Listener preference for different headphone target response curves. In Proceedings of the 134th International Convention, Rome, Italy, 4–7 May 2013; p. 8867. [Google Scholar]
- Struck, C.J. Refinements in the Electroacoustic Testing of Headphones. In Proceedings of the 2016 AES Conference on Headphone Technology, Aalborg, Denmark, 24–26 August 2016; p. 1. [Google Scholar]
- Christer, P.V.; Mathieu, L.; Søren, B.; Flemming, C. Identifying the Dominating Perceptual Differences in Headphone Reproduction. J. Acoust. Soc. Am. 2016, 140, 3664–3674. [Google Scholar]
- Kandukuri, J.; Yu, S.; Yao, T.; Yuan, B. Modulation of Ultrasound-switchable Fluorescence for Improving Signal-to-noise Ratio. J. Biomed. Opt. 2017, 22, 076021. [Google Scholar] [CrossRef]
- Martinez-Luengo, M.; Shafiee, M.; Kolios, A. Data Management for Structural Integrity Assessment of Offshore Wind Turbine Support Structures: Data Cleansing and Missing Data Imputation. Clinical 2019, 173, 867–883. [Google Scholar] [CrossRef]
- Santoro, G.; Vrontis, D.; Thrassou, A.; Dezi, L. The Internet of Things: Building a Knowledge Management System for Open Innovation and Knowledge Management Capacity. Technol. Forecast. Soc. Chang. 2018, 136, 347–354. [Google Scholar] [CrossRef]
- Li, X.-M.; Zhang, B.; Li, P.; Zhou, Q.; Lu, R. Finite-horizon H State Estimation for Periodic Neural Networks Over Fading Channels. IEEE Trans. Neural Netw. Learn. Syst. 2020, 31, 1450–1460. [Google Scholar] [CrossRef] [PubMed]
- Guo, C.-Y.; Chou, Y.-C.; Stoean, R. A Novel Machine Learning Strategy for Model Selections—Stepwise Support Vector Machine (Stepsvm). PLoS ONE 2020, 15, e0238384. [Google Scholar] [CrossRef] [PubMed]
- Liu, Y.; Ji, S.; Su, Z.; Guo, D.; Wang, Y. Multi-objective AGV Scheduling in an Automatic Sorting System of an Unmanned (Intelligent) Warehouse By Using Two Adaptive Genetic Algorithms and a Multi-adaptive Genetic Algorithm. PLoS ONE 2019, 14, e0226161. [Google Scholar] [CrossRef] [PubMed]
- Razzaq, S.; Shujahat, M.; Hussain, S.; Nawaz, F.; Wang, M.; Ali, M.; Tehseen, S. Knowledge Management, Organizational Commitment and Knowledge-worker Performance: The Neglected Role of Knowledge Management in the Public Sector. Bus. Process Manag. J. 2019, 25, 923–947. [Google Scholar] [CrossRef]


| Parameters of the Design * | Possible Options | Assigned Values | N (Total = 388) | % (Total = 100%) |
|---|---|---|---|---|
| Type (Primary Unit) | Dynamic Unit/Moving Coil | 1 | 196 | 50.52% |
| Balanced Armature Unit | 2 | 90 | 23.20% | |
| Planar Magnetic Unit | 3 | 102 | 26.29% | |
| Magnet Type (Primary Unit) | N35 Grade | 1 | 119 | 30.67% |
| N40 Grade | 2 | 114 | 29.38% | |
| N45 Grade | 3 | 85 | 21.91% | |
| N45 Grade | 4 | 70 | 18.04% | |
| Voice Coils (Primary Unit) | Copper Wire | 1 | 161 | 41.49% |
| Aluminum Wire with Copper Covered | 2 | 106 | 27.32% | |
| Silver Wire | 3 | 121 | 31.19% | |
| Diaphragm (Primary Unit) | Polyethylene Terephthalate | 1 | 141 | 36.34% |
| Polyethene Naphtholate | 2 | 98 | 25.26% | |
| Polyetheretherketone (PEEK) | 3 | 77 | 19.85% | |
| PEEK + Polyurethane | 4 | 72 | 18.56% | |
| Type (Secondary Unit) | No Secondary Unit Included | 0 | 86 | 22.16% |
| Dynamic Unit/Moving Coil | 1 | 83 | 21.39% | |
| Balanced Armature Unit | 2 | 100 | 25.77% | |
| Planar Magnetic Unit | 3 | 119 | 30.67% | |
| Magnet Type (Secondary Unit) | No Secondary Unit Included | 0 | 86 | 22.16% |
| N35 Grade | 1 | 80 | 20.62% | |
| N40 Grade | 2 | 74 | 19.07% | |
| N45 Grade | 3 | 78 | 20.10% | |
| N45 Grade | 4 | 70 | 18.04% | |
| Voice Coils (Secondary Unit) | No Secondary Unit Included | 0 | 86 | 22.16% |
| Copper Wire | 1 | 127 | 32.73% | |
| Aluminum Wire with Copper Covered | 2 | 71 | 18.30% | |
| Silver Wire | 3 | 104 | 26.80% | |
| Diaphragm (Secondary Unit) | No Secondary Unit Included | 0 | 86 | 22.16% |
| Polyethylene Terephthalate | 1 | 83 | 21.39% | |
| Polyethene Naphtholate | 2 | 75 | 19.33% | |
| Polyetheretherketone (PEEK) | 3 | 75 | 19.33% | |
| PEEK + Polyurethane | 4 | 69 | 17.78% |
| Sound Quality Performance | Performance Range | Remark | Assigned Values |
|---|---|---|---|
| THD (THD) Under Frequency Signal with 10 kHz | Serious Level of THD | This level of THD is considered to be a significant issue, as it can cause significant degradation of the audio quality and introduce unwanted artefacts into the sound. Hence, the distortion measured in the designed earphone was greater than 10%. | 1 |
| Sensible Level of THD | This level of THD is noticeable but not necessarily problematic. It may be acceptable for some applications but not for others that require high-quality audio. Hence, the distortion measured in the designed earphone was approximately 9%. | 2 | |
| Slightly High Level of THD | At this level, the THD is slightly higher than ideal but may not be noticeable to all listeners. Thus, the distortion measured in the designed earphone was roughly 7%. | 3 | |
| Moderate Level of THD | This level of THD is noticeable and may affect the overall audio quality. It is generally considered to be suboptimal for most applications. As a result, the distortion measured in the designed earphone was approximately 5%. | 4 | |
| Slightly Low Level of THD | This level of THD is slightly lower than ideal but may not be noticeable to all listeners. Thus, the distortion measured in the designed earphone was roughly 3%. | 5 | |
| Insensible Level of THD | At this level, the THD is so low that it is imperceptible to most listeners. Then, the distortion measured in the designed earphone was approximately 1%. | 6 | |
| Zero Level of THD | This level of THD refers to a situation where there is no THD present in the audio signal. Thus, the distortion measured in the designed earphone was less than 1%. | 7 | |
| Power of Output | Extremely Low Level of Power of Output | This level of power of output refers to a situation where the power of output of a device or system is exceedingly low, to the point where it is barely measurable or completely negligible. As a result, the measured power of output was less than 80 milliwatts. | 1 |
| Low Level of Power of Output | At this level, the power of output of a device or system is still relatively low, but it can be measured and may be sufficient for some applications. However, it may not be sufficient for more demanding applications. Thus, the measured power of output of the designed earphone was approximately 100 milliwatts. | 2 | |
| Below-average Level of Power of Output | This level of power of output is slightly higher than a low level, but still below the average power of output of similar devices or systems. It may be suitable for some applications but not for others that require higher power of output. Hence, the measured power of output of the designed earphone was roughly 120 milliwatts. | 3 | |
| Moderate Level of Power of Output | This level of power of output is average or typical for similar devices or systems. It is sufficient for most applications, but may not be optimal for high-power applications. Thus, the measured power of output of the designed earphone was approximately 150 milliwatts. | 4 | |
| Above-average Level of Power of Output | At this level, the power of output of a device or system is higher than average, making it suitable for more demanding applications that require higher power of output. Hence, the measured power of output of the designed earphone was approximately 180 milliwatts. | 5 | |
| Strong Power of Output | This level of power of output refers to a situation where the power of output of a device or system is high, making it suitable for demanding applications that require a strong and consistent output. Thus, the measured power of output of the designed earphone was approximately 200 milliwatts. | 6 | |
| Extremely Strong Power of Output | This level of power of output is the highest possible level, where the power of output is exceptionally strong and well-suited for the most demanding applications that require a high level of power. Thus, the measured output of the designed earphone was greater than 250 milliwatts. | 7 | |
| Range of Frequency Response | Limited Range of Frequency Response | This refers to a situation where the range of frequency response of a device or system is restricted or limited, which may result in a narrow or suboptimal audio quality. As a result, the measured range of frequency response of the designed earphone was less than 610 Hz to 10 kHz. | 1 |
| Narrow Range of Frequency Response | At this level, the range of frequency response of a device or system is restricted but may still provide acceptable audio quality for some applications. Thus, the measured range of frequency response of the designed earphone was approximately 610 Hz to 10 kHz. | 2 | |
| Below-average Range of Frequency Response | This level of range of frequency response is slightly lower than average and may not provide optimal audio quality for some applications. Thus, the measured range of frequency response of the designed earphone was narrower than the typical range (310 Hz to 12 kHz). | 3 | |
| Moderate Range of Frequency Response | This level of range of frequency response is average or typical for similar devices or systems. It is sufficient for most applications but may not be optimal for high-quality audio. As a result, the measured range of frequency response of the designed earphone was approximately the typical range. | 4 | |
| Above-average Range of Frequency Response | At this level, the range of frequency response of a device or system is higher than average, making it suitable for more demanding applications that require higher audio quality. Thus, the measured range of frequency response of the designed earphone was wider than the typical range. | 5 | |
| Wide Range of Frequency Response | This refers to a situation where the range of frequency response of a device or system is broad or wide, providing optimal audio quality for a range of applications. Therefore, the measured range of frequency response of the designed earphone was approximately 20 Hz to 20 kHz. | 6 | |
| Full Range of Frequency Response | At this level, the range of frequency response of a device or system covers the entire audible range of human hearing, providing the highest-quality audio performance. Thus, the measured range of frequency response of the designed earphone was greater than 20 Hz to 20 kHz. | 7 | |
| SNR | Extremely Low SNR | This level of SNR is extremely low, indicating a significant amount of noise in the audio signal that may interfere with the desired audio content. Therefore, the measured SNR of the designed earphone was less than 60 decibels. | 1 |
| Low SNR | At this level, the SNR is low, indicating the presence of some noise in the audio signal. Thus, the measured SNR of the designed earphone was approximately 60 decibels. | 2 | |
| Below-average SNR | This level of SNR is slightly lower than average and may affect the overall audio quality. As a result, the measured SNR of the designed earphone was approximately 80 decibels. | 3 | |
| Moderate SNR | This level of SNR is average or typical for similar devices or systems. It is sufficient for most applications, but may not be optimal for high-quality audio. Thus, the measured SNR of the designed earphone was approximately 10 decibels. | 4 | |
| Above-average SNR | At this level, the SNR is higher than average, indicating a lower level of noise in the audio signal. Therefore, the measured SNR of the designed earphone was approximately 120 decibels. | 5 | |
| Large SNR | This level of SNR is high, indicating a significant reduction in noise in the audio signal. Thus, the measured SNR of the designed earphone was approximately 160 decibels. | 6 | |
| Extremely Large SNR | This level of SNR is exceptionally high, indicating an extremely low level of noise in the audio signal. Therefore, the measured SNR of the designed earphone was greater than 200 decibels. | 7 | |
| The Impedance of the Speaker | Extremely High Impedance of the Speaker | This level of impedance of the speaker is exceptionally high, indicating a high resistance to the flow of electrical current through the speaker. As a result, the measured impedance of the speaker of the designed earphone was greater than 40 ohms. | 1 |
| High Impedance of the Speaker | At this level, the impedance of the speaker is high, indicating a relatively high resistance to the flow of electrical current through the speaker. As a result, the measured impedance of the speaker of the designed earphone was approximately 32 ohms. | 2 | |
| Above-average Impedance of the Speaker | This level of impedance of the speaker is slightly higher than average and may affect the overall audio quality. As a result, the measured impedance of the speaker of the designed earphone was approximately 24 ohms. | 3 | |
| Moderate Impedance of the Speaker | This level of impedance of the speaker is average or typical for similar devices or systems. It is sufficient for most applications, but may not be optimal for high-quality audio. As a result, the measured impedance of the speaker of the designed earphone was approximately 22 ohms. | 4 | |
| Below-average Impedance of the Speaker | This level of impedance of the speaker is slightly lower than average and may affect the overall audio quality. Thus, the measured impedance of the speaker of the designed earphone was approximately 18 ohms. | 5 | |
| Low Impedance of the Speaker | At this level, the impedance of the speaker is relatively low, indicating a lower resistance to the flow of electrical current through the speaker. As a result, the measured impedance of the speaker of the designed earphone was approximately 12 ohms. | 6 | |
| Extremely Low Impedance of the Speaker | This level of impedance of the speaker is exceptionally low, indicating a very low resistance to the flow of electrical current through the speaker. As a result, the measured impedance of the speaker of the designed earphone was less than 12 ohms. | 7 | |
| Headroom | No Effect on Headroom: | This level of headroom indicates that the device or system has no effect on the maximum level of audio output that can be achieved. For evaluative purposes, a feedback form was created, and human testers were engaged in the testing process. | 1 |
| Low Headroom: | At this level, the headroom of the device or system is relatively low, indicating a limited maximum level of audio output that can be achieved. The evaluative process involved the creation of a feedback form, and human testers were utilized to conduct the testing. | 2 | |
| Below-average Headroom | This level of headroom is slightly lower than average and may limit the maximum level of audio output that can be achieved. A feedback form was developed for the purpose of evaluation, and human testers were employed to participate in the testing process. | 3 | |
| Moderate Headroom | This level of headroom is average or typical for similar devices or systems, providing a sufficient maximum level of audio output for most applications. In order to evaluate the product, a feedback form was designed, and human testers were enlisted to carry out the testing. | 4 | |
| Above-average Headroom | At this level, the headroom of the device or system is higher than average, providing a greater maximum level of audio output that can be achieved. The testing process involved the use of a feedback form for evaluation, with human testers playing a crucial role in the process. | 5 | |
| Significant Headroom | This level of headroom is high and provides a significant maximum level of audio output that can be achieved. For the purpose of conducting the evaluation, a feedback form was specifically designed, and human testers were involved in the testing phase. | 6 | |
| Extremely Large Headroom | This level of headroom is exceptionally high and provides an extremely large maximum level of audio output that can be achieved. With the aim of evaluation in mind, a feedback form was created, and human testers were brought in to conduct the testing. | 7 |
| Rank | Sound Quality Indicator |
|---|---|
| 1 | Headroom |
| 2 | Speaker Impedance |
| 3 | SNR |
| 4 | THD |
| 5 | Range of Frequency Response |
| 6 | Power of Output |
| Design Parameter | THD | Power of Output | Range of Frequency Response | SNR | The impedance of the Speaker | Headroom |
|---|---|---|---|---|---|---|
| Type (Primary Unit) | 0.520 ** | 0.473 ** | 0.436 ** | 0.466 ** | 0.427 ** | 0.432 ** |
| Magnet Type (Primary Unit) | 0.475 ** | 0.457 ** | 0.397 ** | 0.389 ** | 0.419 ** | 0.431 ** |
| Voice Coils (Primary Unit) | 0.384 ** | 0.420 ** | 0.408 ** | 0.391 ** | 0.353 ** | 0.440 ** |
| Diaphragm (Primary Unit) | 0.510 ** | 0.511 ** | 0.458 ** | 0.444 ** | 0.430 ** | 0.512 ** |
| Type (Secondary Unit) | 0.453 ** | 0.487 ** | 0.447 ** | 0.477 ** | 0.442 ** | 0.465 ** |
| Magnet Type (Secondary Unit) | 0.453 ** | 0.511 ** | 0.445 ** | 0.522 ** | 0.441 ** | 0.492 ** |
| Voice Coils (Secondary Unit) | 0.506 ** | 0.545 ** | 0.479 ** | 0.500 ** | 0.493 ** | 0.512 ** |
| Diaphragm (Secondary Unit) | 0.508 ** | 0.542 ** | 0.476 ** | 0.496 ** | 0.460 ** | 0.505 ** |
| Testing Data | Training Data | ||||
| Parameters of the Design | Possible Options | N (Total = 168) | % (Total = 100%) | N (Total = 388) | % (Total = 100%) |
| Type (Primary Unit) | Dynamic Unit/Moving Coil | 58 | 34.52% | 196 | 50.52% |
| Balanced Armature Unit | 50 | 29.76% | 90 | 23.20% | |
| Planar Magnetic Unit | 60 | 35.71% | 102 | 26.29% | |
| Magnet Type (Primary Unit) | N35 Grade | 48 | 28.57% | 119 | 30.67% |
| N40 Grade | 41 | 24.40% | 114 | 29.38% | |
| N45 Grade | 45 | 26.79% | 85 | 21.91% | |
| N45 Grade | 34 | 20.24% | 70 | 18.04% | |
| Voice Coils (Primary Unit) | Copper Wire | 60 | 35.71% | 161 | 41.49% |
| Aluminum Wire with Copper Covered | 56 | 33.33% | 106 | 27.32% | |
| Silver Wire | 52 | 30.95% | 121 | 31.19% | |
| Diaphragm (Primary Unit) | Polyethylene Terephthalate | 50 | 29.76% | 141 | 36.34% |
| Polyethene Naphtholate | 43 | 25.60% | 98 | 25.26% | |
| Polyetheretherketone (PEEK) | 40 | 23.81% | 77 | 19.85% | |
| PEEK + Polyurethane | 35 | 20.83% | 72 | 18.56% | |
| Type (Secondary Unit) | No Secondary Unit Included | 36 | 21.43% | 86 | 22.16% |
| Dynamic Unit/Moving Coil | 48 | 28.57% | 83 | 21.39% | |
| Balanced Armature Unit | 48 | 28.57% | 100 | 25.77% | |
| Planar Magnetic Unit | 36 | 21.43% | 119 | 30.67% | |
| Magnet Type (Secondary Unit) | No Secondary Unit Included | 36 | 21.43% | 86 | 22.16% |
| N35 Grade | 34 | 20.24% | 80 | 20.62% | |
| N40 Grade | 35 | 20.83% | 74 | 19.07% | |
| N45 Grade | 30 | 17.86% | 78 | 20.10% | |
| N45 Grade | 33 | 19.64% | 70 | 18.04% | |
| Voice Coils (Secondary Unit) | No Secondary Unit Included | 36 | 21.43% | 86 | 22.16% |
| Copper Wire | 45 | 26.79% | 127 | 32.73% | |
| Aluminum Wire with Copper Covered | 41 | 24.40% | 71 | 18.30% | |
| Silver Wire | 46 | 27.38% | 104 | 26.80% | |
| Diaphragm (Secondary Unit) | No Secondary Unit Included | 36 | 21.43% | 86 | 22.16% |
| Polyethylene Terephthalate | 38 | 22.62% | 83 | 21.39% | |
| Polyethene Naphtholate | 48 | 28.57% | 75 | 19.33% | |
| Polyetheretherketone (PEEK) | 39 | 23.21% | 75 | 19.33% | |
| PEEK + Polyurethane | 31 | 18.45% | 69 | 17.78% | |
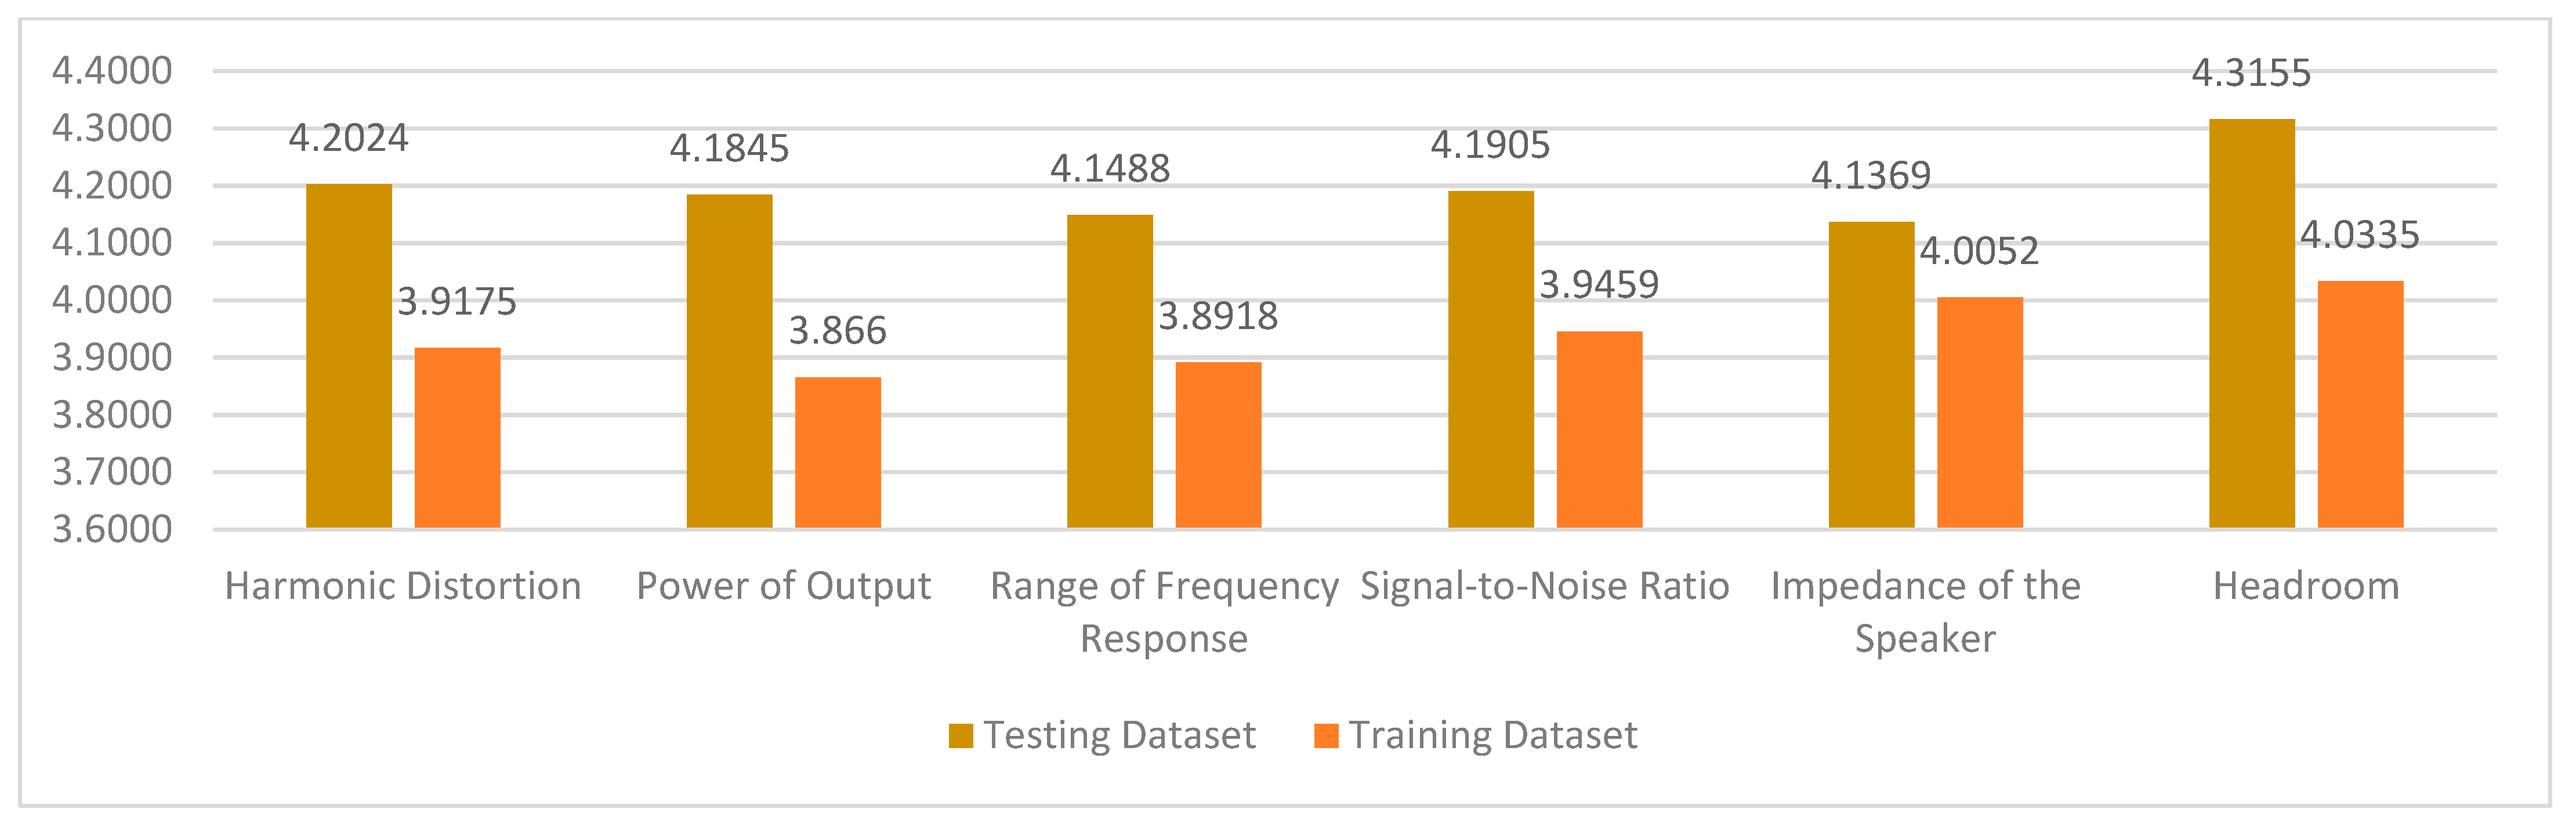
| Sound Quality Indicator | Average Score (Testing Data) | Average Score (Training Data) |
| THD | 4.2024 | 3.9175 |
| Power of Output | 4.1845 | 3.8660 |
| Range of Frequency Response | 4.1488 | 3.8918 |
| SNR | 4.1905 | 3.9459 |
| Impedance of the Speaker | 4.1369 | 4.0052 |
| Headroom | 4.3155 | 4.0335 |
| Rank | Sound Quality Indicator (Testing Dataset) | Sound Quality Indicator (Training Dataset) |
|---|---|---|
| 1 | Headroom | Headroom |
| 2 | THD | Speaker Impedance |
| 3 | SNR | SNR |
| 4 | Power of Output | THD |
| 5 | Range of Frequency Response | Range of Frequency Response |
| 6 | Speaker Impedance | Power of Output |
| Design Parameter | THD | Power of Output | Range of Frequency Response | SNR | Impedance of the Speaker | Headroom |
|---|---|---|---|---|---|---|
| Type of the Primary Driver | 0.338 ** | 0.392 ** | 0.514 ** | 0.480 ** | 0.439 ** | 0.266 ** |
| Magnet of the Primary Driver | 0.448 ** | 0.464 ** | 0.229 ** | 0.203 ** | 0.192* | 0.349 ** |
| Voice Coils of the Primary Driver | 0.179 * | 0.155 * | 0.148 | 0.300 ** | 0.145 | 0.120 |
| The Diaphragm of the Primary Driver | 0.452 ** | 0.398 ** | 0.599 ** | 0.215 ** | 0.206 ** | 0.491 ** |
| Type of the Secondary Driver | 0.475 ** | 0.488 ** | 0.324 ** | 0.579 ** | 0.495 ** | 0.522 ** |
| Magnet of the Secondary Driver | 0.352 ** | 0.424 ** | 0.266 ** | 0.498 ** | 0.493 ** | 0.495 ** |
| Voice Coils of the Secondary Driver | 0.625 ** | 0.631 ** | 0.592 ** | 0.692 ** | 0.714 ** | 0.597 ** |
| Diaphragm of the Secondary Driver | 0.619 ** | 0.608 ** | 0.238 ** | 0.582 ** | 0.761 ** | 0.700 ** |
| Design Parameter | THD | Power of Output | Range of Frequency Response | SNR | Impedance of the Speaker | Headroom |
|---|---|---|---|---|---|---|
| Type of the Primary Driver | 0.676 | 0.420 | 0.425 | 0.733 | 0.436 | 0.261 |
| Magnet of the Primary Driver | 0.367 | 0.294 | 0.228 | 0.000 | 0.337 | 0.246 |
| Voice Coils of the Primary Driver | 0.000 | 0.000 | 0.351 | 0.000 | 0.000 | 0.366 |
| Diaphragm of the Primary Driver | 0.412 | 0.375 | 0.325 | 0.000 | 0.282 | 0.393 |
| Type of the Secondary Driver | 0.000 | 0.000 | 0.000 | 0.000 | 0.000 | 0.000 |
| Magnet of the Secondary Driver | 0.000 | 0.000 | 0.000 | 0.585 | 0.000 | 0.000 |
| Voice Coils of the Secondary Driver | 0.000 | 0.336 | 0.000 | 0.000 | 0.539 | 0.279 |
| Diaphragm of the Secondary Driver | 0.355 | 0.323 | 0.351 | 0.000 | 0.000 | 0.250 |
| Bias | 0.314 | 0.515 | 0.578 | 0.539 | 0.043 | 0.565 |
| Design Parameter | THD | Power of Output | Range of Frequency Response | SNR | Impedance of the Speaker | Headroom |
|---|---|---|---|---|---|---|
| Type of the Primary Driver | −0.073 | 0.968 | 0.186 | 0.187 | 0.183 | 0.199 |
| Magnet of the Primary Driver | 0.375 | −0.773 | 0.180 | 0.181 | 0.177 | 0.193 |
| Voice Coils of the Primary Driver | −0.690 | 0.267 | 0.180 | 0.180 | 0.176 | 0.192 |
| Diaphragm of the Primary Driver | −0.009 | −0.238 | 0.205 | 0.206 | 0.201 | 0.219 |
| Type of the Secondary Driver | 0.537 | 0.473 | 0.235 | 0.236 | 0.231 | 0.251 |
| Magnet of the Secondary Driver | 0.529 | 0.302 | 0.243 | 0.244 | 0.238 | 0.260 |
| Voice Coils of the Secondary Driver | 0.556 | 0.497 | 0.240 | 0.240 | 0.235 | 0.256 |
| Diaphragm of the Secondary Driver | 0.577 | 0.435 | 0.234 | 0.235 | 0.230 | 0.250 |
| Bias | 3.920 | 3.870 | 3.890 | 3.950 | 4.010 | 4.030 |
| Root-Mean-Square Error | THD | Power of Output | Range of Frequency Response | SNR | Impedance of the Speaker | Headroom |
|---|---|---|---|---|---|---|
| Regression Analysis | 1.577 | 1.574 | 1.459 | 1.872 | 1.748 | 1.507 |
| Principal Component Analysis | 2.738 | 2.610 | 2.843 | 2.802 | 2.863 | 2.738 |
Disclaimer/Publisher’s Note: The statements, opinions and data contained in all publications are solely those of the individual author(s) and contributor(s) and not of MDPI and/or the editor(s). MDPI and/or the editor(s) disclaim responsibility for any injury to people or property resulting from any ideas, methods, instructions or products referred to in the content. |
© 2023 by the authors. Licensee MDPI, Basel, Switzerland. This article is an open access article distributed under the terms and conditions of the Creative Commons Attribution (CC BY) license (https://creativecommons.org/licenses/by/4.0/).
Share and Cite
Lui, L.K.H.; Lee, C.K.M. Modelling of Earphone Design Using Principal Component Analysis. Appl. Sci. 2023, 13, 9912. https://doi.org/10.3390/app13179912
Lui LKH, Lee CKM. Modelling of Earphone Design Using Principal Component Analysis. Applied Sciences. 2023; 13(17):9912. https://doi.org/10.3390/app13179912
Chicago/Turabian StyleLui, Lucas Kwai Hong, and C. K. M. Lee. 2023. "Modelling of Earphone Design Using Principal Component Analysis" Applied Sciences 13, no. 17: 9912. https://doi.org/10.3390/app13179912
APA StyleLui, L. K. H., & Lee, C. K. M. (2023). Modelling of Earphone Design Using Principal Component Analysis. Applied Sciences, 13(17), 9912. https://doi.org/10.3390/app13179912