Article

Microseism Detection Method in Coal Mine Based on Spatiotemporal Characteristics and Support Vector Regression Algorithm

1
School of Safety Science and Engineering, Anhui University of Science & Technology, Huainan 232001, China
2
China Coal Technology and Engineering Group Shenyang Research Institute, Fushun 113122, China
3
State Key Laboratory of Coal Mine Safety Technology, Fushun 113122, China
4
School of Civil Engineering, Henan Polytechnic University, Jiaozuo 454003, China
*
Author to whom correspondence should be addressed.
Appl. Sci. 2023, 13(17), 9917; https://doi.org/10.3390/app13179917
Submission received: 14 July 2023 / Revised: 23 August 2023 / Accepted: 27 August 2023 / Published: 1 September 2023
(This article belongs to the Special Issue Geotechnical Engineering and Seismic Engineering)

Abstract

:
In view of the inconsistency of guided wave energy in distributed acoustic sensing coal mine maps and the difficulty in distinguishing the vibration levels of coal mines, which leads to the poor sensitivity and accuracy of microseism detection, a coal mine microseism detection method based on time–space characteristics and a support vector regression algorithm is proposed to ensure the safety of coal mine operations. The spatiotemporal sliding window was used to collect the coal mine data in real-time, and the continuous attribute discretization algorithm based on entropy was used to discretize the coal mine data, then the data were mapped to different state spaces to build a Markov chain; by calculating the state transition probability matrix and the cross-state probability transition matrix, respectively, the temporal and spatial characteristics of the coal mine microseisms at the target node were extracted. The extracted spatiotemporal characteristics of the coal mine microseisms were used as the input to the particle-swarm-optimization-improved support vector regression model, and the regression solution results of the coal mine microseism detection signals were output. The error penalty factor and kernel function parameters were improved, and the particle swarm optimization algorithm was introduced to optimize the detection results of microseisms in coal mines. The experimental results showed that this method can accurately and detect in real-time the microseisms in coal mines in the mining area, can effectively control the rate of missing detections in the detection process, and can ensure the stability of the overall detection operation. When the inertia weight was set at 0.9 and the number of particles was 45, this method had the highest sensitivity and the best-detection accuracy for microseisms in coal mines.

1. Introduction

Mine microseism detection monitors the microseismic phenomena in the mine and mining area through vibration sensors online in real-time, detects the energy size of the seismic source, combines the change characteristics of the microseismic wave and microseismic source [1], monitors the geological movement inside the mine, including earthquakes, surface settlement, fracture activities, etc., and understands the coal seam’s existence to identify the fragile strata and brittle coal seams. Through timely monitoring and analysis of microseismic data, potential geological disaster risks can be detected in advance, and ultimately, real-time monitoring of rock explosion hazards can be realized to provide early warning and protection for the safety of miners. Coal mine microseism detection requires synchronized sensor data acquisition because of the large number of acquisition points (tens to hundreds) and the complex geological structure of the underground space. The data acquisition points are arranged in the complex underground environment, and the acquisition frequency varies from tens of Hertz to thousands of Hertz due to the limitations of the field environment [2]. Because the data acquisition frequency is greatly limited by the field environment, the sensitivity of the sensors cannot meet the actual dynamic detection requirements of the microseism detection in coal mines, and the data acquisition method often fails to achieve the desired detection effect in terms of real-time detection and accuracy. Therefore, it is necessary to find an effective microvibration detection method for coal mines underground.
In terms of microseism detection in coal mines, Liu, Y. and Huff, O. et al. proposed a method to automatically classify microseismic events in coal mines using convolutional neural networks. The convolutional neural networks were trained to identify guided wave energy in distributed acoustic sensing coal mine maps, because microseismic events originating in or near low-speed reservoirs (such as Eagle Ford) would produce significant guided wave energy. The field events with guided waves are classified as guiding energy that occurs inside or near, and microseisms in coal mines are detected according to the characteristic guided waves [3]. Liu, L. et al. developed an event detection method based on a deep convolutional neural network (CNN). The labels of 4000 synthetic microseismic events and random noise records were created to realize microseism detection [4]. Nguyen, H. et al. studied the vibration prediction method of Vietnam’s New Biot Open Pit Coal Mine based on artificial neural networks. This method combined nine artificial neural networks (ANNs) to jointly realize the prediction of coal mine vibration and verified through experiments that the root-mean-squared error (RMSE), determination coefficient (R2), and average absolute error (MAE) of vibration prediction are good [5]; however, the above three methods do not determine the number and location of mine data during the process of coal mine microseism detection and can only determine whether vibration has occurred. They cannot obtain high-precision coal mine microseism detection results and do not extract the spatial features of coal mine microseismic signals. Therefore, the sensitivity of coal mine microseism detection is relatively low.
In terms of spatiotemporal feature extraction, the Markov chain is widely used to extract spatiotemporal change feature data due to its memory property [6] and calculate the state transition matrix and cross-state transition matrix to extract the spatiotemporal features of sensor data streams, and it is widely used in various fields due to the simplicity of its algorithm [7]. The support vector regression algorithm has gradually become widely used after neural networks [8]. It shows unique advantages in solving problems such as small samples and nonlinearity and high-dimensional pattern recognition and is suitable for dealing with the nonlinear relationship between coal spontaneous combustion temperature and gas products [9]. Therefore, in response to the problems of low detection accuracy and sensitivity in the existing coal-mine-microseismic-detection methods mentioned above, this article combines the advantages of the spatiotemporal feature of Markov chain extraction and the support vector regression algorithm to detect coal mine microseismic phenomena, effectively completing accurate detection of coal mine microseismic phenomena and ensuring the accuracy and real-time performance of the coal-mine-microseismic-detection results.

2. Detection Method of Microseisms in Coal Mines

2.1. Extraction of Temporal and Spatial Characteristics of Coal Mine Microseisms Based on Markov Chain

The spatiotemporal-feature-extraction methods are mainly divided into temporal feature extraction and spatial feature extraction [10]. The spatiotemporal-feature-extraction methods used in this paper are as follows: real-time acquisition of coal mine data based on a spatiotemporal sliding window, discretization of coal mine data based on the continuous attribute discretization algorithm of entropy, mapping the processing results to the corresponding state space [11], and building the form of the Markov chain, then calculating the state transition probability matrix, extracting the temporal characteristics of the target node coal mine microseisms, calculating the cross-state probability transition matrix, and extracting the spatial characteristics of the target node coal mine microseisms, and finally, completing the real-time extraction of the temporal and spatial characteristics of microearthquakes in coal mines [12].

2.1.1. Coal Mine Data Acquisition Based on Spatiotemporal Sliding Window

The spatiotemporal sliding window consists of the nearest W real-time coal mine data of the target node, and the neighbor node is obtained through the spatiotemporal sliding window model. The established time–space sliding window for real-time coal mine data acquisition is shown in Figure 1.
As shown in Figure 1, the sliding size of the acquisition space–time is n × W and rows represent different nodes, where V 1 represents the target node and V 2 , , V n represents a collection of neighbor nodes within the target node range; the columns represent the detected values of the sensor nodes at different times, and u i 1 , u i 2 , , u i W indicates the detection sequence of the corresponding node S i within the nearest W moment. When new data are generated, the spatiotemporal sliding window will slide forward one position as a whole, delete the data at the end of the original window, and add new data, so as to update the spatiotemporal sliding window and realize coal mine data acquisition.

2.1.2. Continuous Attribute Discretization Processing of Coal Mine Data

Since the Markov chain can only model random variables with discrete states, it is necessary to discretize the real-time coal mine data in the spatiotemporal sliding window [13] before building the sensor data Markov chain to map the data to different state spaces. This paper proposes a continuous attribute discretization algorithm based on entropy to discretize the coal mine data. The specific method is as follows.
With the n coal mine dataset with continuous attributes M for any continuous attribute of the coal mine data, the maximum number of intervals is the number of samples k , that is an interval has at least one sample value. To discretize the continuous attribute of the coal mine data, divide the value range of the continuous attribute of the coal mine data into several intervals and convert the continuous sample value into less than several k discrete values. Therefore, the key to discretization algorithm is to reasonably determine the number and location of coal mine data to divide the points.
For discrete random variables A , the entropy is defined as follows:
H A = a A p a log 2 p a
In the above formula, p a is the probability function of the discrete value of coal mine a .
Assume interval k ’s minimum value can reach 1, that is all values are combined into an interval. The following formula can be obtained:
C k = k max F k H A k 1 F k max
Among them, C k is the number of intervals’ balance threshold, k max is the maximum number of intervals, and F A is a concave function. The number of intervals k can be consolidated to effectively reduce the entropy F k , but ultimately, it needs to reach a minimum entropy value and the optimal number of interval k ’s balance; F k max is the entropy value at the maximum interval number. When C k > C k 1 , stop interval consolidation. At this point, k is the optimal interval number. On this basis, this paper applies the entropy-based discretization method to the Hadoop platform. Through the self-merging of continuous attribute values, the merging point with the smallest entropy difference before and after merging is found as the best merging point; then, use Equation (2) as the stop condition of the algorithm. The specific algorithm can be simply described as follows:
Input: Coal mine dataset with multiple continuous attributes M .
Exporting: Coal datasets M ’s consolidated state set on each attribute of the.
Step:
Discretization processing for coal mine dataset M with multiple continuous attributes:
(1)
Calculate initial state entropy F k max ;
(2)
Make M ’s attribute A perform and ascending arrangement, and then, select two adjacent intervals from the ordered sequence to merge;
(3)
Calculate the entropy value after merging every two adjacent intervals one by one F k 1 ; connect it with F k max to make a difference; select the merge interval with the smallest entropy difference as the best merge interval;
(4)
Calculate Formula (2) to compare the size of C k and C k 1 ; if C k < C k 1 , the merged continuous attributes will be A , and repeat Steps (2) and (3); otherwise, the algorithm stops, and all discrete point sets are output. Complete the discretization of the real-time coal mine data in the spatiotemporal sliding window.

2.1.3. Extraction of Time Characteristics of Microseismic Signal of Target Node Coal Mine

The sensor data at the adjacent time have a time correlation, meeting the requirements of the Markov chain in t ’s state of the moment being the same as t 1 . Therefore, this paper constructed the target node state sequence after state mapping into the form of the Markov chain and extracted the time characteristics of the coal mine microseisms at the target node by calculating the state transition probability matrix. The calculation method of the state transition probability matrix is as follows.
Let the first-order Markov chain model established by the target node state sequence be T = T 1 , T 2 , , T t and the state space be S = a , b , c , d , e , f , g , h , i , and for all s 1 , s 2 , , s t S , as well as t 1 , 2 , , , all meet:
P T t = s t | T 0 = s 0 , T 1 = s 1 , , T t 1 = s t 1 = P T t = s t | T t 1 = s t 1
Order s i represents model T at the moment of t 1 ’s state; p i j represents model T at the moment of t ’s state, the transition probability of s j ; the calculation formula of p i j is as follows:
p i j = P s j | s i = P s 0 s 1 s i s j P s 0 s 1 s i = P s j , s i P s i p i j = N s 0 s 1 s i s j N s 0 s 1 s i = N s i , s j N s i
where N indicates the total number of times the status occurs.
The state transition probability of the target node state sequence in state space S = a , b , c , d , e , f , g , h , i . The size of the inner component is a 9 × 9 state transition probability matrix of P :
P = p a a   p a b     p a h   p a i p b a   p b b     p b h   p b i                                           p i a   p i b         p i h   p i i
where p i j 0 and s i , s j S p i j = 1 .

2.1.4. Spatial Feature Extraction of Microseismic Signal of Target Node Coal Mine

The state sequence of the target node and the state sequence of the neighbor node after the state mapping are respectively constructed into Markov chain models, and the probabilities of the target node’s various state values transferring to the neighbor node at the next time under the condition of the current various state values are the cross-state transition probabilities. The spatial dependence of the target node and the neighbor node is captured by calculating the cross-state transition probability matrix, extracting the spatial characteristics of the coal mine microseisms at the target node.
Set A as the target node, B as node A ’s neighbor node; the A , B nodes’ Markov chain model established by the node’s state sequence is T A = T n A , n T ; T B = T n B , n T , the state space is S A , S B . Order s i A is model T A ’s state at t 1 ’s moment; s j B is model T B ’s state at t ’s moment; then, p i j A B is when s i A ’s state transition occurs; s j B ’s probability of occurrence is called the cross-state transition probability; the calculation formula of p i j A B is as follows:
p i j A B = P s j B | s i A = P s 0 A s 1 A s i A s j B P s 0 A s 1 A s i A = P s j B , s i A P s i A p i j A B = N s 0 A s 1 A s i A s j B N s 0 A s 1 A s i A = N s i A , s j B N s i A
where N indicates the total number of times the status occurs.
Due to the fact that the state space of both the target node state sequence and adjacent node state sequence is S = a , b , c , d , e , f , g , h , i , the size of the cross state transition probability matrix P i j A B of the target node state sequence and adjacent node state sequence is also 9 × 9 . The size of the cross state transition probability matrix P A B is also 9 × 9 . Matrix P A B is:
P A B = p a a A B   p a b A B     p a h A B   p a i A B p b a A B   p b b A B     p b h A B   p b i A B                                           p i a A B   p i b A B         p i h A B   p i i A B
where p i j A B 0 and s i A S A , s j B S B P i j A B = 1 .

2.2. Microseism Detection Method in Coal Mine

2.2.1. Regression Solution of Microseism Detection Signal in Coal Mine

Support vector machine (SVM) is a machine learning method based on the Vapnik–Chervonenkis (VC) dimension theory of statistical learning theory and the structural risk principle [14] first proposed by the research group led by Vapnik in 1995, which can be used for pattern classification and nonlinear regression [15]. The SVM method is used to “raise the dimension” of the spatiotemporal feature sample points of the coal mine microseisms obtained above, that is to map the nonlinear spatiotemporal feature data of coal mine microseisms in this space to a linearly separable high-dimensional space, so as to solve the high-dimensional nonlinear problem in the sample space [8].
The support vector machine method is applied to regression problems, which is called support vector regression (SVR). The temporal and spatial characteristics of coal mine microseisms were extracted in the previous article. In order to detect coal mine microseisms, it is necessary to combine the coal mine microseisms’ characteristics with the support vector machine method, so as to realize the detection of coal mine microseisms. The specific method is to set the n ’s training set of the time–space characteristics of microseisms in coal mines X = x 1 , x 2 , , x n , and an output vector with coal mine microseism detection results Y = y 1 , y 2 , , y n ; the input vector x through nonlinear mapping ϕ P s j | s i maps to a high-dimensional feature space, and then, construct an optimized linear regression function in this feature space:
f x = w ϕ P s j | s i + C k b
where f x is used to obtain the regression function of microseism detection in coal mines; w is the weight vector; b is an offset item.
Taking the above time–space characteristics of coal mine microseisms as constraints, ignoring the error of the data points relative to the nonlinear-feature-space-fitting curves, and introducing a relaxation variable, i.e., error tolerance λ i and λ i , then the constrained optimization problem of Equation (8) is concretely expressed as:
min   imize w , b , λ i , λ i 1 2 w 2 + D i = 1 n λ i + λ i subject   to y i w ϕ x i b ε + λ i w ϕ x i + b y i ε + λ i , i = 1 , 2 , , n λ i 0 , λ i 0
where 1 2 w 2 is a rule item; D is the penalty factor; ε is the precision parameter.
The constraint optimization problem of the coal mine microseism in Equation (9) is transformed into a dual-problem by introducing a Lagrange function, and the solution of Equation (8) is obtained by solving the dual-problem, which is the solution of the coal mine microseism detection results:
f x = i = 1 n min   imize w , b , λ i , λ i   f x a i a i K x , x i + b
where a i , a i is the Lagrange multiplier, a i , a i 0 , D , and K x , x i is a kernel function.
Since the radial basis function is applicable regardless of the sample size and dimension and has a wide convergence domain, there is only one parameter to be optimized. g ’s algorithm is simple and easy to calculate, so the radial basis kernel function is selected for calculation. For the SVR of the RBF kernel function, penalty factor D and nuclear parameters g are the main parameter that affects the performance of SVR. The accuracy and reliability of the SVR prediction results depend on D , g ’s best choice [16]. Therefore, in order to improve the precision of microseism detection in coal mines, this paper used PSO to punish the SVR D , and the nuclear parameters g conduct the optimization selection to find the optimal balance parameter pair D , g .

2.2.2. Optimal Microseism Detection Results of Coal Mine

The factors affecting the optimization ability of the SVR model include the error penalty factor D and kernel function parameters g . In order to find the optimal parameter combination conveniently and reliably D , g , the particle swarm optimization (PSO) algorithm is introduced for optimization.
When the PSO algorithm starts to run, it needs to set a group of random particles to be in the feasible solution space. During program operation, particles will obtain corresponding fitness values according to the fitness function during each iteration, and whether particles are within the scope of optimization solution will be determined [17]. Each iteration will find the particle closest to the optimal solution in this iteration, and the other particles will follow the direction of motion of the particle to search one by one until all particles are near the optimal solution. The particle is updated according to two extreme values in the iteration process: one is its own extreme value, which indicates the cognitive level of the particle itself to find the best position; the other is the global extremum, which represents the ability of all particles to find the optimal solution at the current position. At the same time, the small data optimization characteristics of the PSO algorithm can also solve complex optimization problems. At the beginning of the iteration, the optimization performance of the particle swarm optimization algorithm is better than that of other evolutionary algorithms, but with the increase of the number of iterations, its ability will also decline. Therefore, this paper used the improved particle swarm optimization algorithm based on passive aggregation to optimize the parameter combination of the SVR model D , g and find the optimal solution through the PSO algorithm iteration.
In the process of the parameter optimization of the SVR model using the PSO algorithm, the optimal SVR parameter combination can be found in the speed search model [18]. Initialize a group of particles in the 3D solution space, which are combined by parameters D , g ’s composition, including serial number i ’s particle position:
u i = u i 1 u i 2 u i 3 T
Its speed is:
v i = v i 1 v i 2 v i 3 T
The individual extreme value at the current moment is recorded as E i b e s t , and the global extreme value is recorded as E g b e s t . During each iteration, the particle adjusts its direction and speed according to the global extreme value and its own extreme value, moving from the previous state to the next state. Because the traditional PSO algorithm easily falls into the local optimum and is not conducive to the global search, this paper proposes an improved particle swarm optimization algorithm based on passive aggregation to iterate and obtain the optimal value of the parameters [19]. In the process of optimization, the passive attraction term is introduced according to the passive aggregation algorithm, so that particles not only need to consider their own optimal position and the global optimal position, but also consider the interference of the attraction term to prevent falling into the local optimum. Obtain the best parameter combination of the SVR model, so as to obtain the best detection results of coal mine microseisms.
The iteration formula of the particles is:
v i k + 1 = ω v i k + c 1 r 1 E i b e s t k u i k + c 2 r 2 E g b e s t k u i k + c 3 r 3 R i k u i k u i k + 1 = u i k + β v i k + 1
where R i k is the attraction term that disturbs the particle position u i k in the k iteration. The attraction term causing interference can select a particle randomly from the particle swarm; u i k , u i k + 1 , v i k , and v i k + 1 are the position and velocity of the particle in the k and k + 1 position iterations, respectively; r 1 , r 2 , and r 3 are random numbers between [ 0 , 1 ] ; c 1 and c 2 are the weight factor of displacement and positive constants, which determine the length of the particle motion, and they generally take a value of 1.5; c 3 is the weight factor of the passive attraction term, which determines the speed of the particle motion, and it generally takes a value of 1; β is the iteration coefficient; ω is the inertia weight factor; a larger ω is beneficial to avoid local optimization, while a smaller ω is beneficial to search the locked area, and the calculation formula is:
ω = ω min + N max N ω max ω N max
where ω min and ω max are, respectively, the minimum and maximum values of the inertia weight factor; N max is the total number of group iterations; N is the number of iterations of the current particle; the value range of the inertia weight ω is from 0.3~0.9.
The optimized SVR parameter combination D , g ’s value varies greatly, so one needs to multiply the corresponding coefficient before the particle speed. To quantitatively reflect the performance of support vector regression, the fitness function used in this paper is the root-mean-squared error (RMSE), whose formula is:
RMSE = ε 1 / I ω i = 1 I RMSE g v i k + 1 - RMSE p u i k + 1 y i y i 2
where y i and y i are, respectively, i ’s actual measured values and the model-predicted values of the training samples.
This paper designed an improved PSO algorithm for the SVR model parameters D , g , and its optimization steps are as follows;
(1)
Sett c 1 and c 2 , the maximum particle speed v max , the number of particles I , and the maximum iterations N max , and randomly select the position vector of particles u i and velocity vector v i .
(2)
Check whether the particles in section i are in the solution space; if their current positions u i k exceeds the range of the solution space, it will be reset to the position of the previous time u i k 1 .
(3)
From the root-mean-squared error RMSE , calculate the fitness value of the current particle RMSE p and the global fitness values RMSE g .
(4)
Find the optimal self-state variable according to the fitness value of each particle p i b e s t k and global state variables p g b e s t k . By comparison of p i b e s t k ’s fitness and the objective function, if the objective function is better, update it with the current position p i b e s t k . If the fitness value of the objective function is not only better than p i b e s t k , but is also better than p g b e s t k , the current position is used u i k to update p i b e s t k .
(5)
Update random particle vector R i at each step of the iteration process; a passively attractive individual of the particles should be randomly selected from the population R i .
(6)
Calculate the velocity vector and position vector coordinates of the particles and update all vector coordinate values of each particle.
(7)
Check whether the iteration termination conditions are met. If not, repeat Steps (2) to (6), and run the PSO algorithm several times until the global optimal solution is obtained. If the parameter combination of the output optimal SVR model is satisfied, the SVR with the optimal parameter combination is used to complete the precise detection of coal mine microseisms.
The process of the PSO optimization parameters is shown in Figure 2.
As can be seen from Figure 2, the method in this paper optimizes the parameter combinations of the SVR model based on the improved particle swarm algorithm with passive aggregation and runs the PSO algorithm several times to find the global optimal solution. When the number of iterations satisfies the termination condition, the optimal solution is output. In the process of the parameter optimization of the SVR model using the PSO algorithm, the optimal SVR parameter combination can be found in the velocity search model. When N N max , the optimal combination of parameters is output, that is the optimization of the mine microseism detection results is realized, and the accurate detection of coal mine microseisms is completed.

3. Experimental Analysis

Take the fully mechanized caving face of a coal mine of a group as the on-site test base. The strike length of the working face is 2365 m, and the dip length is 695 m. Inclined longwall mining and “U” negative pressure ventilation were adopted. There are nine coal mine operation points distributed in the working face with an average coal thickness of 13.64 m, a mechanized mining of 4.3 m, an average coal caving height of 6.98 m, and an average spacing between points of 164 m.
At 1:33 p.m. on 8 January 2023, the group conducted a microseismic simulation accident experiment in the 296–549 m section of the lower roadway of the mine. The LS-DYNA nonlinear dynamics finite element program with the LS-PrePost 6.0 processing software and the D3PLOT visualization and analysis tool were mainly utilized in the simulation experiments. According to the original coal mine microseism detection system of the group and the method in this paper, the microseismic energy detected in six time periods before and after the accident simulation experiment was detected, and the detection performance of the method in this paper for coal mine microseisms was tested by comparative analysis. The specific experimental results are shown in Table 1.
As can be seen from Table 1, compared with the microseismic energy before and after the actual accident, the energy detected by the original microseismic monitoring system before the accident was not much different from the actual energy. However, when the accident occurred, the original system did not detect the microseismic energy at the time of the accident in a timely and accurate manner, but detected a higher microseismic energy one minute after the accident. This is inconsistent with the actual microseismic energy value, indicating that the original detection system is not accurate enough and has a certain degree of hysteresis in the detection process of coal mine microseisms; however, the method in this paper had little difference between the six microseismic energy values measured before and after the accident and the actual microseismic energy values and accurately detected the abnormal situation of microseismic energy increase when the accident occurred, which shows that the method in this paper can accurately detect in real-time the microseismic situation in coal mines in the mining area.
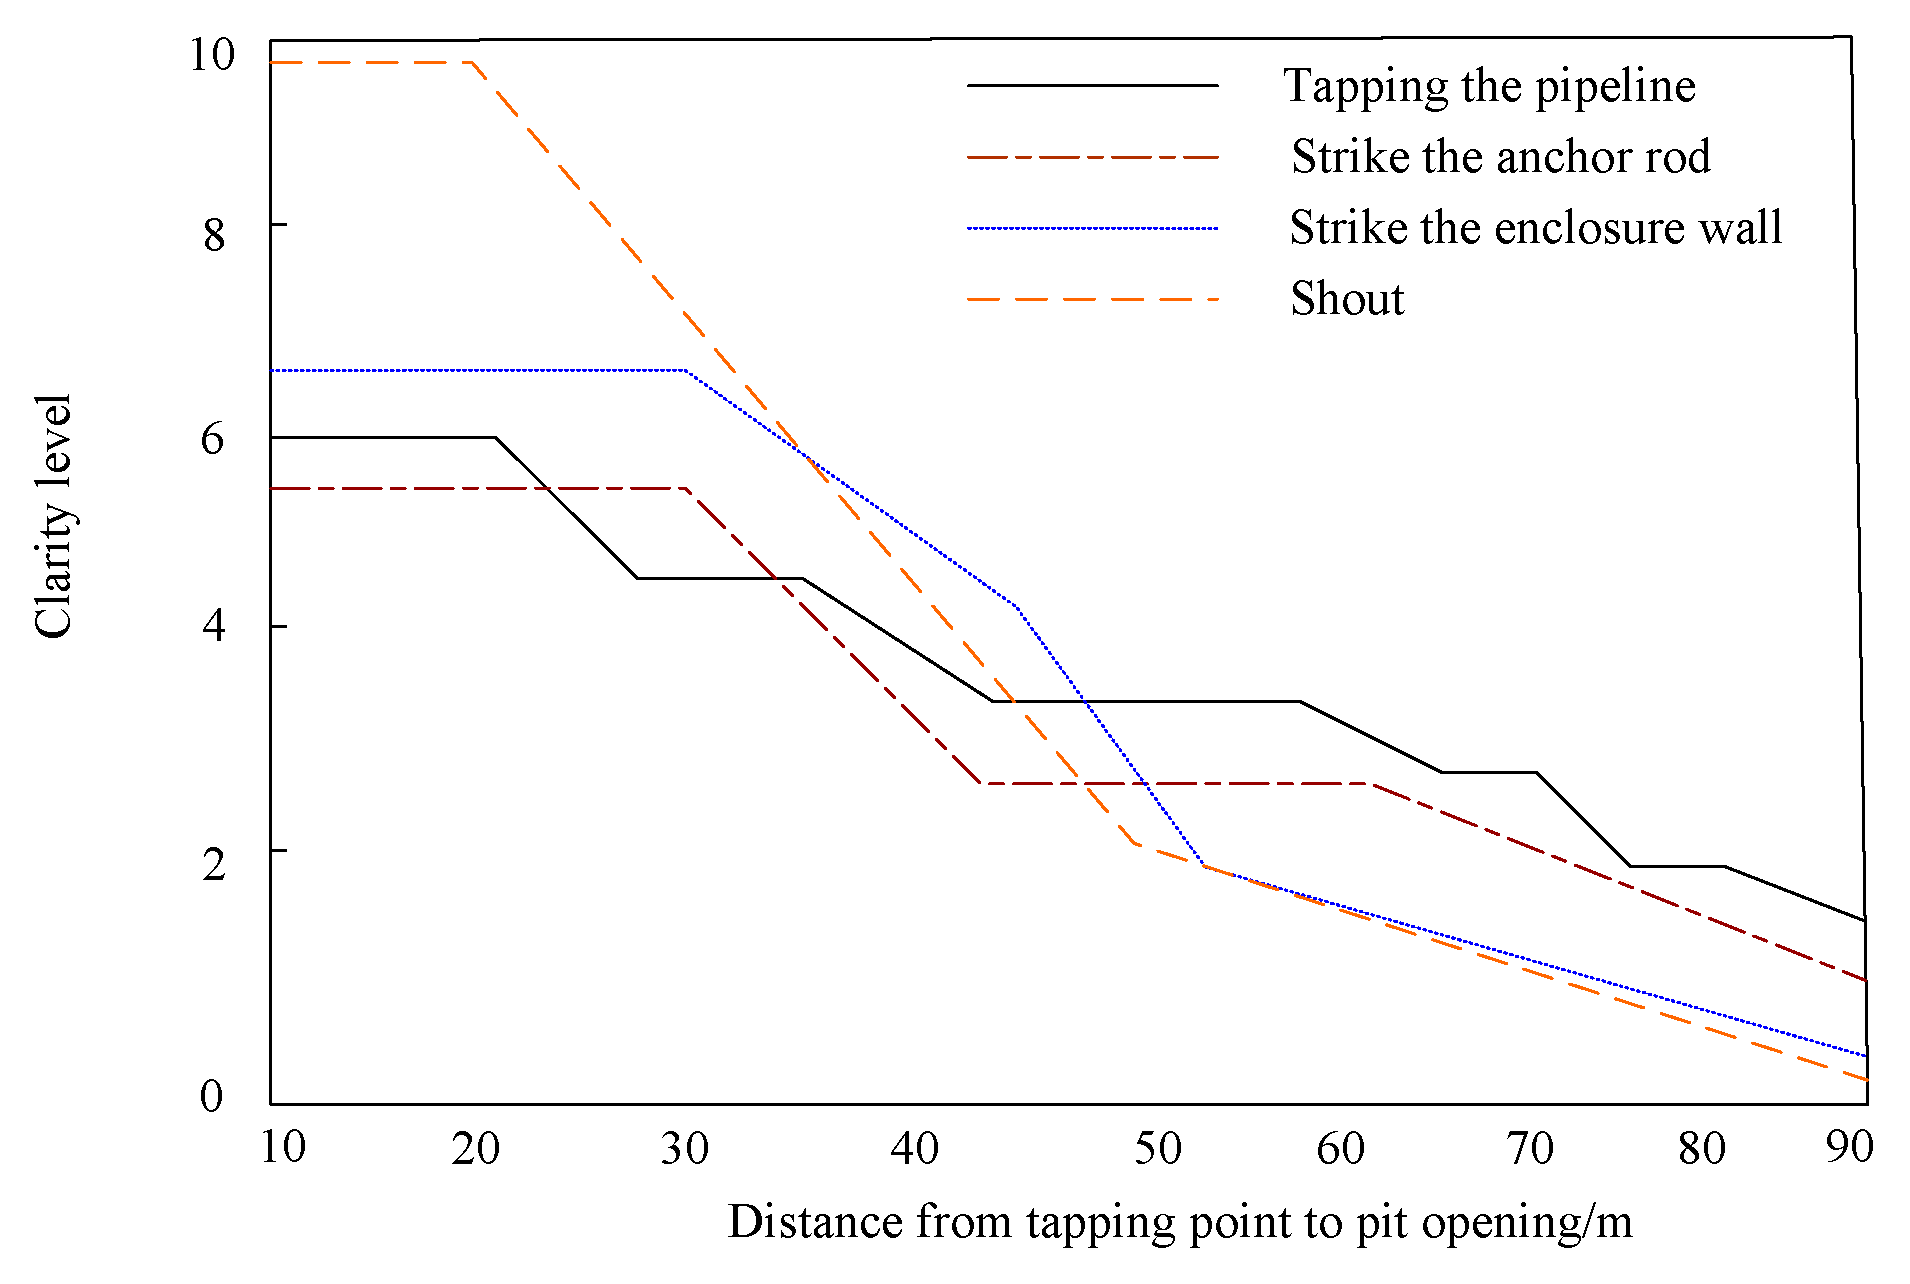
The method in this paper was used to test the clarity of microseism reception in different forms that lead to microseisms in coal mines. This experiment was divided into 10 levels. The larger the number is, the higher the level is and the clearer the received microseisms in the coal mines are. Four forms are designed to test the microseism level in coal mines, namely knocking on pipes, knocking on bolts, knocking on walls, and shouting. The specific experimental results are shown in Figure 3.
As can be seen from Figure 3, when the distance from the pit mouth is within 20 m, the clarity level of the coal mine microseisms received by calling is the highest, but with the increase of distance, the clarity level of coal mine microseisms drops sharply, and when the distance from the pit mouth is 90 m, the clarity level is almost 0; compared with the way of knocking on the wall and the way of knocking on the pipe and the anchor bolt, the clarity level is relatively higher when the distance is closer to the pit mouth, but the clarity level gradually weakens with the increase of distance and is lower than the clarity level of knocking on the pipe and the anchor bolt; comprehensively, compared with the other three forms, the rapping on the pipeline has a better overall clarity level and attenuation degree, so the method in this paper has the best detection effect on coal mine microseisms by rapping on the pipeline.
The experiment took 9 coal mine operation points in the working face of the mining area of the group as the experimental object and conducted five pipe taps on the 9 operation points to simulate the microseism situation. Using the missed detection rate of the microseismic samples and the misjudgment rate generated during detection as reference standards, the calculation formula for this indicator is:
= τ ι × 100 %
Φ = ι Φ ι × 100 %
where represents the missed detection rate of the sample, τ represents the total amount of missed samples, τ represents the total amount of samples, Φ represents the misjudgment rate, and ι Φ represents the total amount of misjudged samples.
Calculate the missed detection rate and misjudgment rate of the sample based on the above formula. Set the missed detection rate not to exceed 6% and the misjudgment rate not to exceed 5% as the normal detection state; otherwise, it will be judged as a fault state. Test the stability of the group’s original coal mine microseism detection system and the method in this paper when detecting coal mine microseisms. The specific experimental results are shown in Figure 4.
As can be seen from Figure 4a, compared with the standard value, the leakage rate of the original detection method of the group when detecting the nine coal mine operation points exceeded the standard value; at the same time, it can be seen from Figure 4b that, when the original detection method detected Operation Points 2, 3, 5, and 7, the detection error rate exceeds the standard value. Combining the missed detection rate and misjudgment rate of the original detection method of the group in the detection of the 9 operation points in the experiment, it was found that the system was in a fault state when the original method of the group detected 3 operation points and 7 operation points, indicating that the overall operation of the method is unstable; in the 9 coal mine operation points detected by the method, no long-term stability test was carried out to assess the performance of the method in continuous operation, and the number of samples involved in the experiment may appear to be unable to fully represent the overall situation. There is insufficient research on whether the effect of this paper’s method on leakage detection rate control is relatively good or universally applicable, and there is a certain degree of uncertainty in the experimental results. However, the leakage rate of this paper’s method was lower than the standard value when detecting the nine coal mine operating points, and it can control the leakage rate below 3%, which indicates that this paper’s method can effectively control the leakage rate when detecting the microseismicity of coal mines and ensure the stability of the overall detection operation.
The experiment was conducted with nine coal mine workings in the group, and a knocking simulation was performed on each of the workings. Under different inertia weights, the method detected the amplitude produced by knocking. Combining the simulated knocking amplitudes with the inertial mass coefficients, the sensitivity of this paper’s method in coal mine microseism detection can be calculated as follows:
= ξ ϖ
where represents the detection sensitivity and ξ the amplitude.
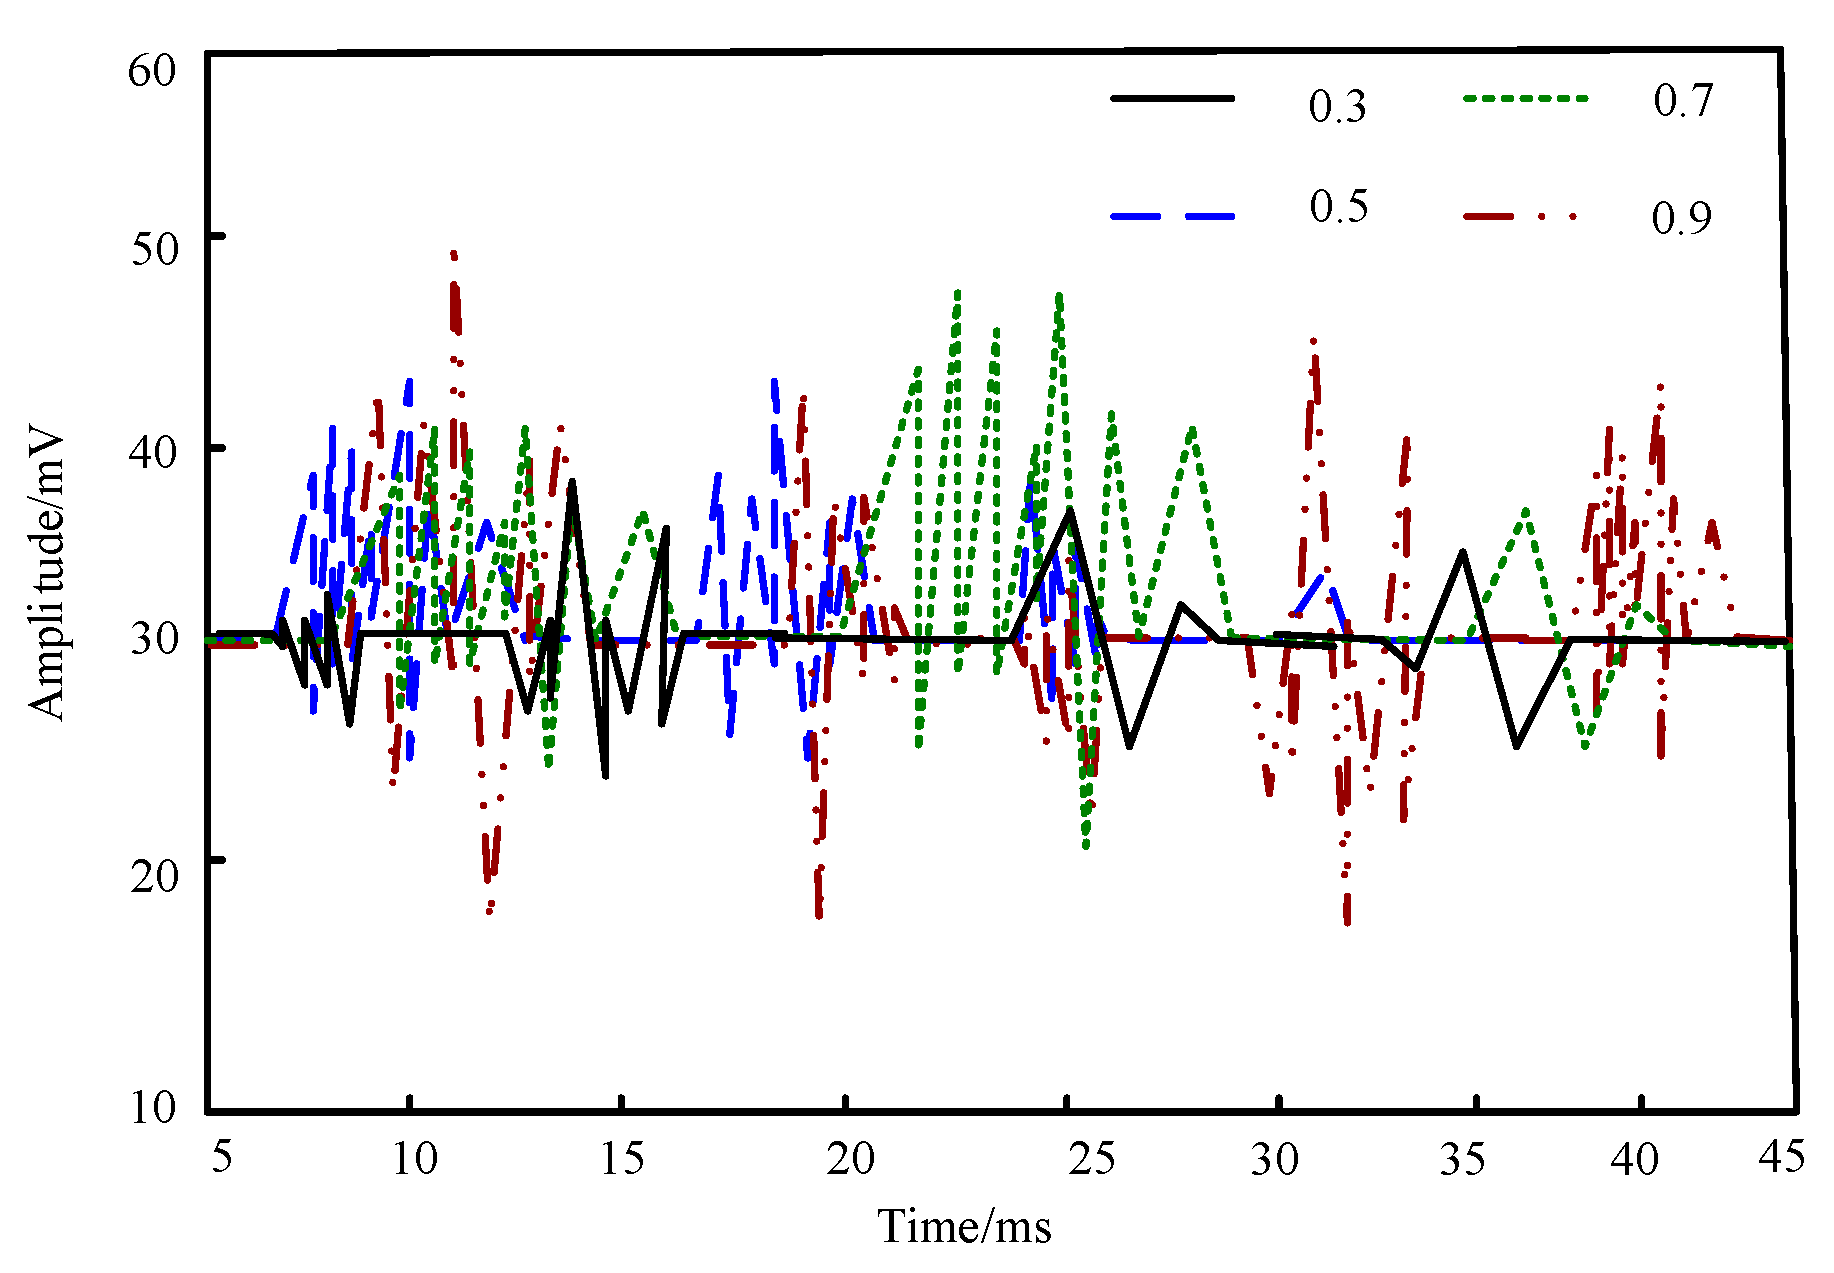
It is well known that the denser the received amplitude ξ is, the larger the amplitude fluctuation is and the more sensitive the reception is. The inertia weights ω were set to 0.3, 0.5, 0.7, and 0.9, respectively, and the specific experimental data are shown in Figure 5.
It can be seen from Figure 5 that the wave spectrum presented by this method is different when the inertia weight is set differently. From the comparison of the amplitude fluctuation degree, when the inertia weight was set at 0.7 and 0.9, the amplitude fluctuation was larger; from the aspect of the amplitude fluctuation frequency, when the inertia weight was set at 0.5, 0.7, and 0.9, the amplitude fluctuation frequency was higher, but when the inertia weight was 0.5, the amplitude frequency gradually decreased with the increase of time. When the inertia weights were set to 0.9, the amplitude fluctuation frequency was the highest, and the amplitude reached a maximum value of 50 mV, which was combined with Equation (18) to calculate such that, when the inertia weights of the method were set to 0.9, the detection sensitivity of the method reached a maximum of 55.6 mV.
Usually, the number of particles in the PSO algorithm affects the parameter optimization of the SVR model. In this experiment, when testing the number of particles set by this method, the average fitness of the population was closest to the optimal fitness, and the number of iterations was the least, i.e., the parameter optimization effect was the best. It is known that the optimal fitness is 10, the number of particles is set to 15, 30, 45, and 60, the acceleration factor is 2, the position range is restricted to [ 0 ,   60 ] , and the self-learning factor is 2. The specific experimental results are shown in Figure 6.
From Figure 6, it can be seen that, when the number of particles is set to 15, the difference between the average fitness and the optimal fitness is the largest; when the number of particles is set to 30, the optimal average fitness obtained is closest to the optimal fitness, but the optimal solution can only be found when the number of iterations reaches 70; when the number of particles is set to 60, the optimal average fitness can only be obtained through 30 iterations, but the difference between the obtained optimal average fitness and the optimal fitness is still significant; when the particle count is set to 45, the number of iterations to obtain the best average fitness value is less than the number of iterations when the particle count is set to 30, and the difference between the best average fitness value and the best fitness value is less than the value when the particle count is set to 60. From this, it can be seen that, when the number of particles is 15, 30, or 60, the algorithm deviates from the optimal solution, has poor convergence, and the fitting effect is not good. On the basis of clarifying the results of the average fitness and the optimal fitness and further combining the content of Figure 6 with the actual parameters of the algorithm described above, the algorithm parameter value when the particle number is 45 is substituted into Formula (13). Through the relationship between the average fitness and the optimal fitness and mean-squared error, the detection accuracy of this method in coal mine microseisms is inverted, and the final calculated detection accuracy result is 0.973 or 97.3%. Overall, when using this method to detect coal mine microseisms, when the particle number is set to 45, the optimal combination parameters of the SVR model can be accurately and quickly obtained, and it has high detection accuracy.

4. Conclusions

In this paper, a coal mine microseismic feature detection method was constructed by combining the time–space feature extraction method and the support vector regression algorithm. The particle swarm optimization algorithm was innovatively used to improve the accuracy of the support vector regression algorithm, set the number of particles targeted, analyze the amplitude fluctuation, obtain the guided wave energy in the distributed acoustic sensing coal mine map, and accurately distinguish the vibration level of the coal mines, and the detection sensitivity and accuracy of the method were improved. Since the proposed algorithm still has room for improvement in the training time, one can utilize big-data-processing platforms to analyze microseismic data, provide visualization results and important parameters, and help optimize and adjust mining plans. In the future, we will consider parallelizing algorithms based on the Hadoop big data platform to better utilize the computing resources, optimize the computing processes and task allocation, improve the algorithm training speed and comprehensive performance, and help optimize and adjust mining plans.

Author Contributions

Methodology, C.M.; writing—original draft, H.G.; writing—review & editing, H.S. All authors have read and agreed to the published version of the manuscript.

Funding

This work was financially supported by National Key R&D Program of China (No. 2021YFC31008), and Liaoning Province Doctoral Research Launch Fund (No. 2022-BS-365).

Institutional Review Board Statement

Not applicable.

Informed Consent Statement

Not applicable.

Conflicts of Interest

The authors declare no conflict of interest.

References

  1. Lund, B.; Schmidt, P.; Shomali, Z.H.; Roth, M. The modern swedish national seismic network: Two decades of intraplate microseismic observation. Seism. Res. Lett. 2021, 92, 1747–1758. [Google Scholar] [CrossRef]
  2. Li, X.; Chen, S.; Wang, E.; Li, Z. Rockburst mechanism in coal rock with structural surface and the microseismic (ms) and electromagnetic radiation (emr) response. Eng. Fail. Anal. 2021, 124, 105396. [Google Scholar] [CrossRef]
  3. Liu, Y.; Huff, O.; Luo, B.; Jin, G.; Simmons, J. Convolutional neural network-based classification of microseismic events originating in a stimulated reservoir from distributed acoustic sensing data. Geophys. Prospect. 2022, 70, 904–920. [Google Scholar] [CrossRef]
  4. Liu, L.; Song, W.; Zeng, C.; Yang, X. Microseismic event detection and classification based on convolutional neural network. J. Appl. Geophys. 2021, 192, 104380. [Google Scholar] [CrossRef]
  5. Nguyen, H.; Bui, X.N.; Hieu, T.Q.; Long, N.Q.; Vu, N.P. Developing an advanced soft computational model for estimating blast-induced ground vibration in nui beo open-pit coal mine (vietnam) using artificial neural network. Inz. Miner. 2020, 2, 57–72. [Google Scholar] [CrossRef]
  6. Ozkan, H.; Temelli, R.; Gurbuz, O.; Koksal, O.K.; Ipekoren, A.K.; Canbal, F.; Karahan, B.D.; Kuran, M. Multimedia traffic classification with mixture of markov components. Ad Hoc Netw. 2021, 121, 102608. [Google Scholar] [CrossRef]
  7. Narwal, P.; Kumar, D.; Singh, S.N.; Tewari, P. Stochastic intrusion detection game-based arrangement using controlled markov chain for prevention of dos and ddos attacks in cloud. J. Inf. Technol. Res. 2021, 14, 45–57. [Google Scholar] [CrossRef]
  8. Mohamed, Z.E.; Saleh, H.H. Potential of machine learning based support vector regression for solar radiation prediction. Comput. J. 2021, 66, 399–415. [Google Scholar] [CrossRef]
  9. Soleimani, N.; Trinchero, R. Compressed complex-valued least squares support vector machine regression for modeling of the frequency-domain responses of electromagnetic structures. Electronics 2022, 11, 551. [Google Scholar] [CrossRef]
  10. Chen, C. An analysis of mandarin emotional tendency recognition based on expression spatiotemporal feature recognition. Int. J. Biom. 2021, 13, 211–228. [Google Scholar] [CrossRef]
  11. Li, T.; Xu, H.; Liu, Z.; Dong, Z.; Liu, Q.; Li, J.; Fan, S.; Sun, X. A spatiotemporal multi-feature extraction framework for opinion mining. Neurocomputing 2022, 490, 337–346. [Google Scholar] [CrossRef]
  12. Shah, Z.; Dunn, A.G. Event detection on twitter by mapping unexpected changes in streaming data into a spatiotemporal lattice. IEEE Trans. Big Data 2022, 8, 508–522. [Google Scholar] [CrossRef]
  13. Dai, F.; Prymak, A.; Shadrin, A.; Temlyakov, V.; Tikhonov, S. Entropy numbers and marcinkiewicz-type discretization. J. Funct. Anal. 2021, 281, 109090. [Google Scholar] [CrossRef]
  14. Zhang, W.; Wu, Z. Optimal hybrid framework for carbon price forecasting using time series analysis and least squares support vector machine. J. Forecast. 2021, 41, 615–632. [Google Scholar] [CrossRef]
  15. Bhat, H.F.; Wani, M.A. Novel pssm-based approaches for gene identification using support vector machine. J. Inf. Technol. Res. 2021, 14, 152–173. [Google Scholar] [CrossRef]
  16. Wen, L.; Li, Y.; Zhang, H.; Liu, Y.; Zhou, H. Predicting the crest settlement of concrete face rockfill dams by combining threshold regression and support vector machine. Int. J. Geomech. 2022, 22, 04022074. [Google Scholar] [CrossRef]
  17. Bingul, Z.; Karahan, O. Real-time trajectory tracking control of stewart platform using fractional order fuzzy pid controller optimized by particle swarm algorithm. Ind. Robot. 2022, 49, 708–725. [Google Scholar] [CrossRef]
  18. Zhang, Y.; Zhang, C. Surface Quality and Parameter Optimization of AeroMet100 Ultra High Strength Steel Milling. Weapon Mater. Sci. Eng. 2020, 43, 5–10. [Google Scholar]
  19. Li, Z.; Feng, Y.; Lin, Z.; Xu, H. Optimization of SVM model for facial color recognition based on improved PSO algorithm. Comput. Simul. 2022, 39, 241–247. [Google Scholar]
Figure 1. Spatiotemporal sliding window of coal mine data.
Applsci 13 09917 g001
Figure 2. PSO optimization detection process.
Applsci 13 09917 g002
Figure 3. Different methods of receiving coal mine microseismic levels.
Applsci 13 09917 g003
Figure 4. Misdetection rate and misjudgment rate of microseism detection in coal mines. (a) Misdetection in coal mine microseism detection. (b) Misdetection rate in coal mine microseism detection.
Applsci 13 09917 g004
Figure 5. Spectrogram of impact experiment.
Applsci 13 09917 g005
Figure 6. Iterative curve of optimal fitness and average fitness.
Applsci 13 09917 g006
Table 1. Microseismic data before and after accident impact.
Serial NumberDate TimeThe Original System of the Group Detects Microseismic Energy (J)The Method Used in This Article to Detect Microseismic Energy (J)Actual Energy (J)Notes
12023.1.8T1:30:152.20 × 1022.32 × 1022.35 × 101Coal mine microseismic impact event
22023.1.8T1:31:163.82 × 1033.98 × 1044.00 × 103
32023.1.8T1:32:352.53 × 1022.64 × 1012.67 × 102
42023.1.8T1:33:264.56 × 1057.34 × 1047.37 × 105
52023.1.8T1:34:546.46 × 1065.23 × 1015.46 × 103
62023.1.8T1:35:124.23 × 1034.45 × 1034.47 × 106
Disclaimer/Publisher’s Note: The statements, opinions and data contained in all publications are solely those of the individual author(s) and contributor(s) and not of MDPI and/or the editor(s). MDPI and/or the editor(s) disclaim responsibility for any injury to people or property resulting from any ideas, methods, instructions or products referred to in the content.