Review

Assessing Glycosphingolipid Profiles in Human Health and Disease Using Non-Imaging MALDI Mass Spectrometry

1
Faculty of Medicine, Victor Babes University of Medicine and Pharmacy Timisoara, Eftimie Murgu Sq. No. 2, 300041 Timisoara, Romania
2
Biochemistry Discipline, Biochemistry and Pharmacology Department, Victor Babes University of Medicine and Pharmacy Timisoara, Eftimie Murgu Sq. No. 2, 300041 Timisoara, Romania
3
Department of Technical and Natural Sciences, Faculty of Food Engineering, Tourism and Environmental Protection, “Aurel Vlaicu” University, 310330 Arad, Romania
4
Department of Pharmaceutical Sciences, Faculty of Pharmacy, “Vasile Goldiș” Western University, 310414 Arad, Romania
5
National Institute of Research & Development for Electrochemistry and Condensed Matter, 300569 Timisoara, Romania
6
Physiology Discipline, Functional Sciences Department, Victor Babes University of Medicine and Pharmacy Timisoara, Eftimie Murgu Sq. No. 2, 300041 Timisoara, Romania
7
Center of Immuno-Physiology and Biotechnologies (CIFBIOTEH), Victor Babes University of Medicine and Pharmacy Timisoara, Eftimie Murgu Sq. No. 2, 300041 Timisoara, Romania
*
Author to whom correspondence should be addressed.
Appl. Sci. 2023, 13(17), 9922; https://doi.org/10.3390/app13179922
Submission received: 31 July 2023 / Revised: 26 August 2023 / Accepted: 29 August 2023 / Published: 1 September 2023

Abstract

:
Glycosphingolipids (GSLs) are a glycolipid subtype which plays vital roles in numerous biological processes, cell–cell interactions, as well as oncogenesis and ontogenesis. They are ubiquitous molecules found mostly in cell membranes. Abnormal expression of GSLs as well as altered molecular structure have been linked with progression of cancer and metastasis and are involved in the pathophysiology of neurodegenerative, autoimmune, and infectious diseases as well as inherited enzyme defects—glycosphingolipidoses. Matrix-assisted laser desorption ionization mass spectrometry (MALDI MS) plays a leading role in analyzing and characterizing different GSLs, and thus can help to distinguish altered GSL patterns. This review offers insights into the benefits and limitations when using MALDI MS in this field of lipidomic research, with an emphasis on which are the optimal matrices in analyzing GSLs from different tissues (normal and pathological) as well as highlighting GSLs’ particular profiles in various cell cultures, and normal and pathological human tissues obtained by MALDI non-imaging MS (non-IMS). These findings can have implications in further understanding the role of altered GSL expression in various pathological conditions and could be a target for future therapies.

1. Introduction

Glycosphingolipids (GSLs) represent essential lipid components embedded within the cell plasma membrane of mammalian tissues as well as that of invertebrates, plants, bacteria, and fungi. They constitute a glycolipid subtype which contains the amino alcohol (long-chain base or sphingoid base) sphingosine or its derivatives. GSLs can also be considered sphingolipids with an attached carbohydrate. Cell–cell interactions and cell adhesion make good use of the orientation of the hydrophilic oligosaccharide core, to the cell membrane exterior, while the hydrophobic moiety, the ceramide, positioned within the plasma membrane lipid bilayer, is made up of the sphingoid base replaced by a fatty acid at the amino group. The primary hydroxyl group is bound to the carbohydrate moiety [1,2,3,4,5].
GSLs are not distributed homogeneously within the plasma membrane, clustered together with cholesterol, sphingomyelin, and selected proteins (e.g., glycosylphosphatidylinositol (GPI)-anchored proteins, cell signaling transmembrane proteins such as the receptor tyrosine kinases (RTKs), endothelin receptors, Src family kinases, caveolin, flotillin, low molecular weight and heterotrimeric G proteins (Gα subunits), mitogen-activated protein (MAP)-kinase, protein-kinase C (PKC), Grb2, Shc-adaptor protein, p85 regulatory subunit of PI 3-kinase) [6,7,8,9,10,11,12] in lipid rafts, minute short-lived self-associating membrane molecule microdomains. Glycosyl epitopes in microdomains interact with various receptors and modulate lipid-raft-associated signaling events through molecular assemblies called glycosynapses, with GSLs acting as hydrogen bond donors and acceptors [13,14].
Thus, GSLs modulate biological functions by their interaction with the complementary molecules on other cell membranes (trans recognition) in order to communicate with nearby cells, or within the same cell membrane (cis recognition) with other components (proteins) of the membrane [4,15,16].
Each component of a GSL is involved in mediating various biological processes and physiological functions. While the ceramide functions as an anchor of the glycan headgroup and modulates its antigenic and assembling properties [17,18], the carbohydrate moiety acts as a receptor (for bacteria and viruses), an antigen (in several autoimmune diseases), is involved in protein interactions, receptor regulation, cell recognition, differentiation and adhesion, cell signaling, apoptosis, and formation of the myelin sheath [19,20,21,22]. Hence, GSLs participate in embryogenesis [19,21], brain development, synaptogenesis [23,24,25,26,27,28,29], antigenicity and immune response [30,31,32,33,34], kidney function [25,29], and hemostasis/thrombosis [29].
A wide range of literature data to date have revealed that changes in both moieties of GSL molecules can impact their normal biological functions and will result in abnormal GSL expression which is in close relation with numerous pathological conditions such as central nervous system-related/neurodegenerative diseases [35,36,37,38,39,40,41,42,43,44,45,46,47,48,49,50], cancer [41,42,43,44,45,46,47,48,49,50,51,52,53,54,55,56,57,58], infectious diseases [29,59], autoimmune diseases [60], GSL storage diseases [61,62], and diabetes mellitus [29].
Over time, the GSLs physiological roles have been studied using various biophysical, genetic, cell biology, and biochemical methods. However, the GSLs involvement in the etiopathogenesis of these diseases is not extensively known and, therefore, this represents a field with much promise for the future.
Mass spectrometry (MS) has had a great impact in the structural elucidation and quantitative profiling of GSLs within the recent past. Based on innovative MS-approaches coupled with chromatographic separation [63,64,65], intact GSLs can be investigated to provide at the same time the carbohydrate core sequence and the ceramide moiety composition. A first analytical challenge in investigating GSLs is represented by their structural complexity, which results in highly variable physicochemical properties. In addition, the quality of the laborious GSL extraction/purification procedures from biological matrices greatly influences their ionization (to remove the interference of other lipids, proteins, and nucleic acids). Another obstacle is the lack of commercially available standards and the reduced availability and quantity of normal and pathological tissue sample, making it difficult to achieve a quantitative, comprehensive, and large-scale profiling of GSLs in various tissues/organisms under normal or pathological conditions.
Among the soft ionization methods for mass spectrometric GLS analysis, matrix-assisted laser desorption ionization (MALDI) offers significant advantages, such as the simplicity and speed of the analysis; an adequate molecular mass lipids range, which is high enough that background matrix signal interferences are minimal; and the tolerance of higher quantities of impurities in comparison to other MS-based methods, reducing the necessity for sample purification, and offering high reproducibility [66]. Moreover, choosing the right matrix plays a pivotal analysis role, as a potential risk is represented by the post-source decay of GSLs, which is associated with noticeable decarboxylation and desialylation reactions, especially for sialic acid-containing GSLs [67,68].
Thus, the present review highlights representative literature results related to GSL profiles in normal and pathological conditions using MALDI non-imaging MS (non-IMS) approaches, together with their advantages and limitations.

2. Structural Characteristics, Classification, and Nomenclature of GSLs

Because of the existing variations in structure in both the ceramide and carbohydrate parts, GSLs are characterized by great complexity and diversity. The GSL glycan core expresses its specific species, while GSLs with different ceramide structures but the same glycan are considered different lipoforms (lipid forms) of the same species of GSL [69,70]. A single lipoform, homogeneous regarding the fatty acid, sphingoid base, and glycan, is considered equivalent to what is sometimes stated as a “molecular species” in GSL literature.
Every species of GSL can present a multitude of lipoforms, varied in the ceramide structure, such as the fatty acid chain length (C14 to C30 or greater, although the fatty acids most common in mammalian GSL ceramides are C18:0, C16:0, and C20:0), unsaturation degree, branching pattern, and hydroxylation possibility for both the fatty acid and the sphingoid base.
Removal from the ceramide moiety of the fatty acid residue, most commonly under physiological conditions using acid ceramidases, results in the formation of lyso-GSLs, which can be connected to various human diseases [71].
The basic chemical structure for the sphingoid base is represented by sphinganine or dihydrosphingosine, denoted as d18:0 (d stands for ‘di’ (two) hydroxyl groups at positions 1 and 3, 18 represents the number of carbon atoms, and 0 the C-C double bond number). In mammals, the most commonly encountered sphingoid base is, however, sphingosine (d18:1), possessing a double bond between C-4 and C-5, in addition to the structure of sphinganine. Phytosphingosine (t18:0) possesses an additional hydroxyl on C-4 while lacking the double bond.
In animals, ceramides which contain sphinganine and phytosphingosine are less abundant, while those which present phytosphingosine are found very widely in the GSLs of plants and fungi [1,72,73,74,75,76,77].
Other sphingoid bases containing a different number of C atoms, d20:0, d20:1, d16:0, d16:1, are also present in eukaryotes [65,78,79] and additional double bonds of carbon occur regularly at different positions in the hydrocarbon chain, generating a variety of sphingetrienes and sphingedienes. Several modifications of sphingosine, such as creating hydroxyl or oxo groups at different positions in the carbon backbone by the oxidation of carbons, or the addition of methylene or methyl groups to form rings or branches, are usually found within the tree of life’s low species [70].
Even though ceramide variations result in a substantial variety of GSL structures, most of the important structural and even functional classifications are owing to the structure of the carbohydrate core. The carbohydrate part can contain different types and numbers of monosaccharide residues, different linkages connecting them, or can be modified with various functional groups.
In vertebrates, the first monosaccharide attached to ceramide can be glucose (Glc-Cer) or galactose (Gal-Cer), but relatively reduced numbers of Gal-Cer-derived GSLs are found because, usually, extending the Gal-Cer glycan is constrained. The result is that the majority of mammalian GSLs are generated from Glc-Cer, while in invertebrates Gal-Cer derivatives are found.
GSLs have been divided into two classes on the basis of their glycans’ physicochemical properties: acidic GSLs and neutral (nonionic) GSLs. Acidic GSLs are mainly made up of two groups: the sialosyl-GSLs (which contain one or more than one sialic acid residue) or gangliosides and the sulfo-GSLs (which contain sulfate monoesters) or sulfatides [7]. In humans, only two forms of sialic acid usually exist, namely, N-glycolylneuraminic (Neu5Gc) and N-acetylneuraminic (Neu5Ac), the former only being present in trace amounts, originating either from diet [80,81], or produced by some malignant cells [82,83,84,85,86,87,88,89,90,91,92,93,94,95,96].
An unusual and rare form of sialic acid, deaminoneuraminic (KDN), and its glycoconjugates are only abundant in pathogenic bacteria and lower vertebrates; nevertheless, KDN was identified in some human tumors and in different animal organs, its presence being enhanced in hypoxic conditions [97,98,99].
GSLs are further classified according to the number, sequence, configuration, and linkages between the constituent monosaccharides as ganglio-, isoganglio-, globo-, isoglobo-, lacto-, neolacto-, lactoganglio-, muco-, gala-, neogala-, mollu-, arthro-, schisto-, and spirometo-series [100]. GSLs are divided into three key groups in vertebrates, containing the lacto-/neolacto-series, the globo-/isoglobo-series, and the ganglio-/isoganglio-series, and are expressed in tissue-specific patterns (Table 1). This diversity probably reveals important differences in the functions of GSLs. Conventionally, all sialylated GSLs are called “gangliosides” if they are derived not just from the ganglio-series, but also from the lacto- and globo-series of neutral GSLs [101,102]. In invertebrates, the GSLs found are in the mollu- and arthro-series (Table 1).
In addition to the high structural variety of GSLs as a result of the existent variations in their glycan and lipid portions, chemical modifications such as O-acetylation, fucosylation, lactonization [64,103,104], and the uncommon O-ketalation [105] may also occur in the structure of glycans.
In 1997, the IUPAC-IUB Joint Commission on Biochemical Nomenclature proposed a nomenclature for GSL based on a set of core structures which are pre-defined (characterizing the linkages between the monosaccharide components and the composition of the glycan) for serving as a base name [106] and includes all modifications within the glycan headgroup (Table 2).
An example is the name III2-α-Fuc-Gb3Cer (d18:1/18:0) for the GSL having the composition Fucα1-2Galα1-4Galβ1-4Glcβ1–1′Cer. In this example, the carbohydrate core structure Galα1-4Galβ1-4Glcβ1–1′ is denoted Gb3 (the base name). Since the GSL contains a monosaccharide extending beyond this core structure, it is used as prefix to this name, which contains (1) a Roman numeral indicating the monosaccharide which is modified, counting the monosaccharide which is closest to the ceramide moiety as “I” (in this case Fuc is attached to Gal at position III); (2) a superscript on the Roman numeral indicating which hydroxyl on that monosaccharide is modified (2 in the above example); (3) the configuration of the linkage (α); and (4) the abbreviated name of the attached monosaccharide unit (Fuc). While this terminology resolves confusion within the chemical literature, particularly when addressing numerous GSL isomers, it proves overly intricate for everyday application and lacks a framework for naming the lipid component.
The established approach for GSL naming, initially introduced by Svennerholm and still prevalent today [107,108], relies on their series designations along with the type, number, bonding arrangement, and position of sugar units within the glycan structure (Table 2). As an illustration, gangliosides are commonly abbreviated using a combination of two letters and a numeral, for instance, GM1, GD1, GT1, GQ. Here, G signifies the ganglio-series; the second letter (M, D, T, Q, P) indicates the count of sialic acid units (single, double, triple, quadruple, pentuple) found in the glycans; and the numeral (1, 2, 3, 4) corresponds to their elution sequence in thin-layer chromatography (TLC) (Rf values: GM4 > GM3 > GM2 > GM1), relative to the starting point. The latter property depends on the composition and length of the glycan, and the neutral core oligosaccharides were shown to move farther in TLC as the number increased. The indexes such as a, b, c show the molecular synthesis pathway, with the sialic acids binding position being different for all three pathways: e.g., in GM1b, the residue of sialic acid is linked to a Gal residue on the oligosaccharide chain end, while in the case of GM1a, the inner Gal residue is bound to the sialic acid.
Due to the varying degrees of molecular structural insight provided by diverse MS techniques, the Lipid MAPS consortium proposed an extensive classification system in 2005. They also created a comprehensive structural database encompassing biologically significant lipids, GSLs included. This database features entries for each GSL species, presenting both the systematic nomenclature and the commonly used name. It also incorporates information about the identifiable sphingoid base and N-linked fatty acids for each GSL species. A shorthand notation based on Liebisch et al. [109] is used for annotating MS-data-derived lipid structures at three levels: species level, molecular species level, and full structure level. When considering the ganglioside GM3 (d18:1/24:0), it is named according to this shorthand notation:
(1) NeuAcHex2Cer, 42:1;O2, at the species level (when the number of hydroxyl groups within the sphingoid base is uncertain, the total count of N-linked fatty acyl and sphingoid bases should be identified as the total carbon number; double bonds total; ceramide moiety oxygen atoms number; unidentified monosaccharide); (2) NeuAcHex2Cer, 18:1;O2/24:0, at the molecular species level (if the fatty acid and long-chain base structure are both known, with the exception of the double bond or stereochemistry and position); (3) NeuAc-Gal-Glc-Cer, 18:1(4E);3OH/24:0 (GM3), at the full structure level (if both stereochemistry or double bond and position and are identified). This widely acknowledged representation applies exclusively to the oligosaccharide headgroups comprising a maximum of two monosaccharide units; it does not encompass the more intricate glycosphingolipids (GSLs).
Taking into account all these observations, the advantages and limitations of the presented GSL nomenclatures, their combination would be appropriate to annotate structures of complex GSL structures resulting from MS data.

3. MALDI Non-Imaging MS Analysis of GSLs

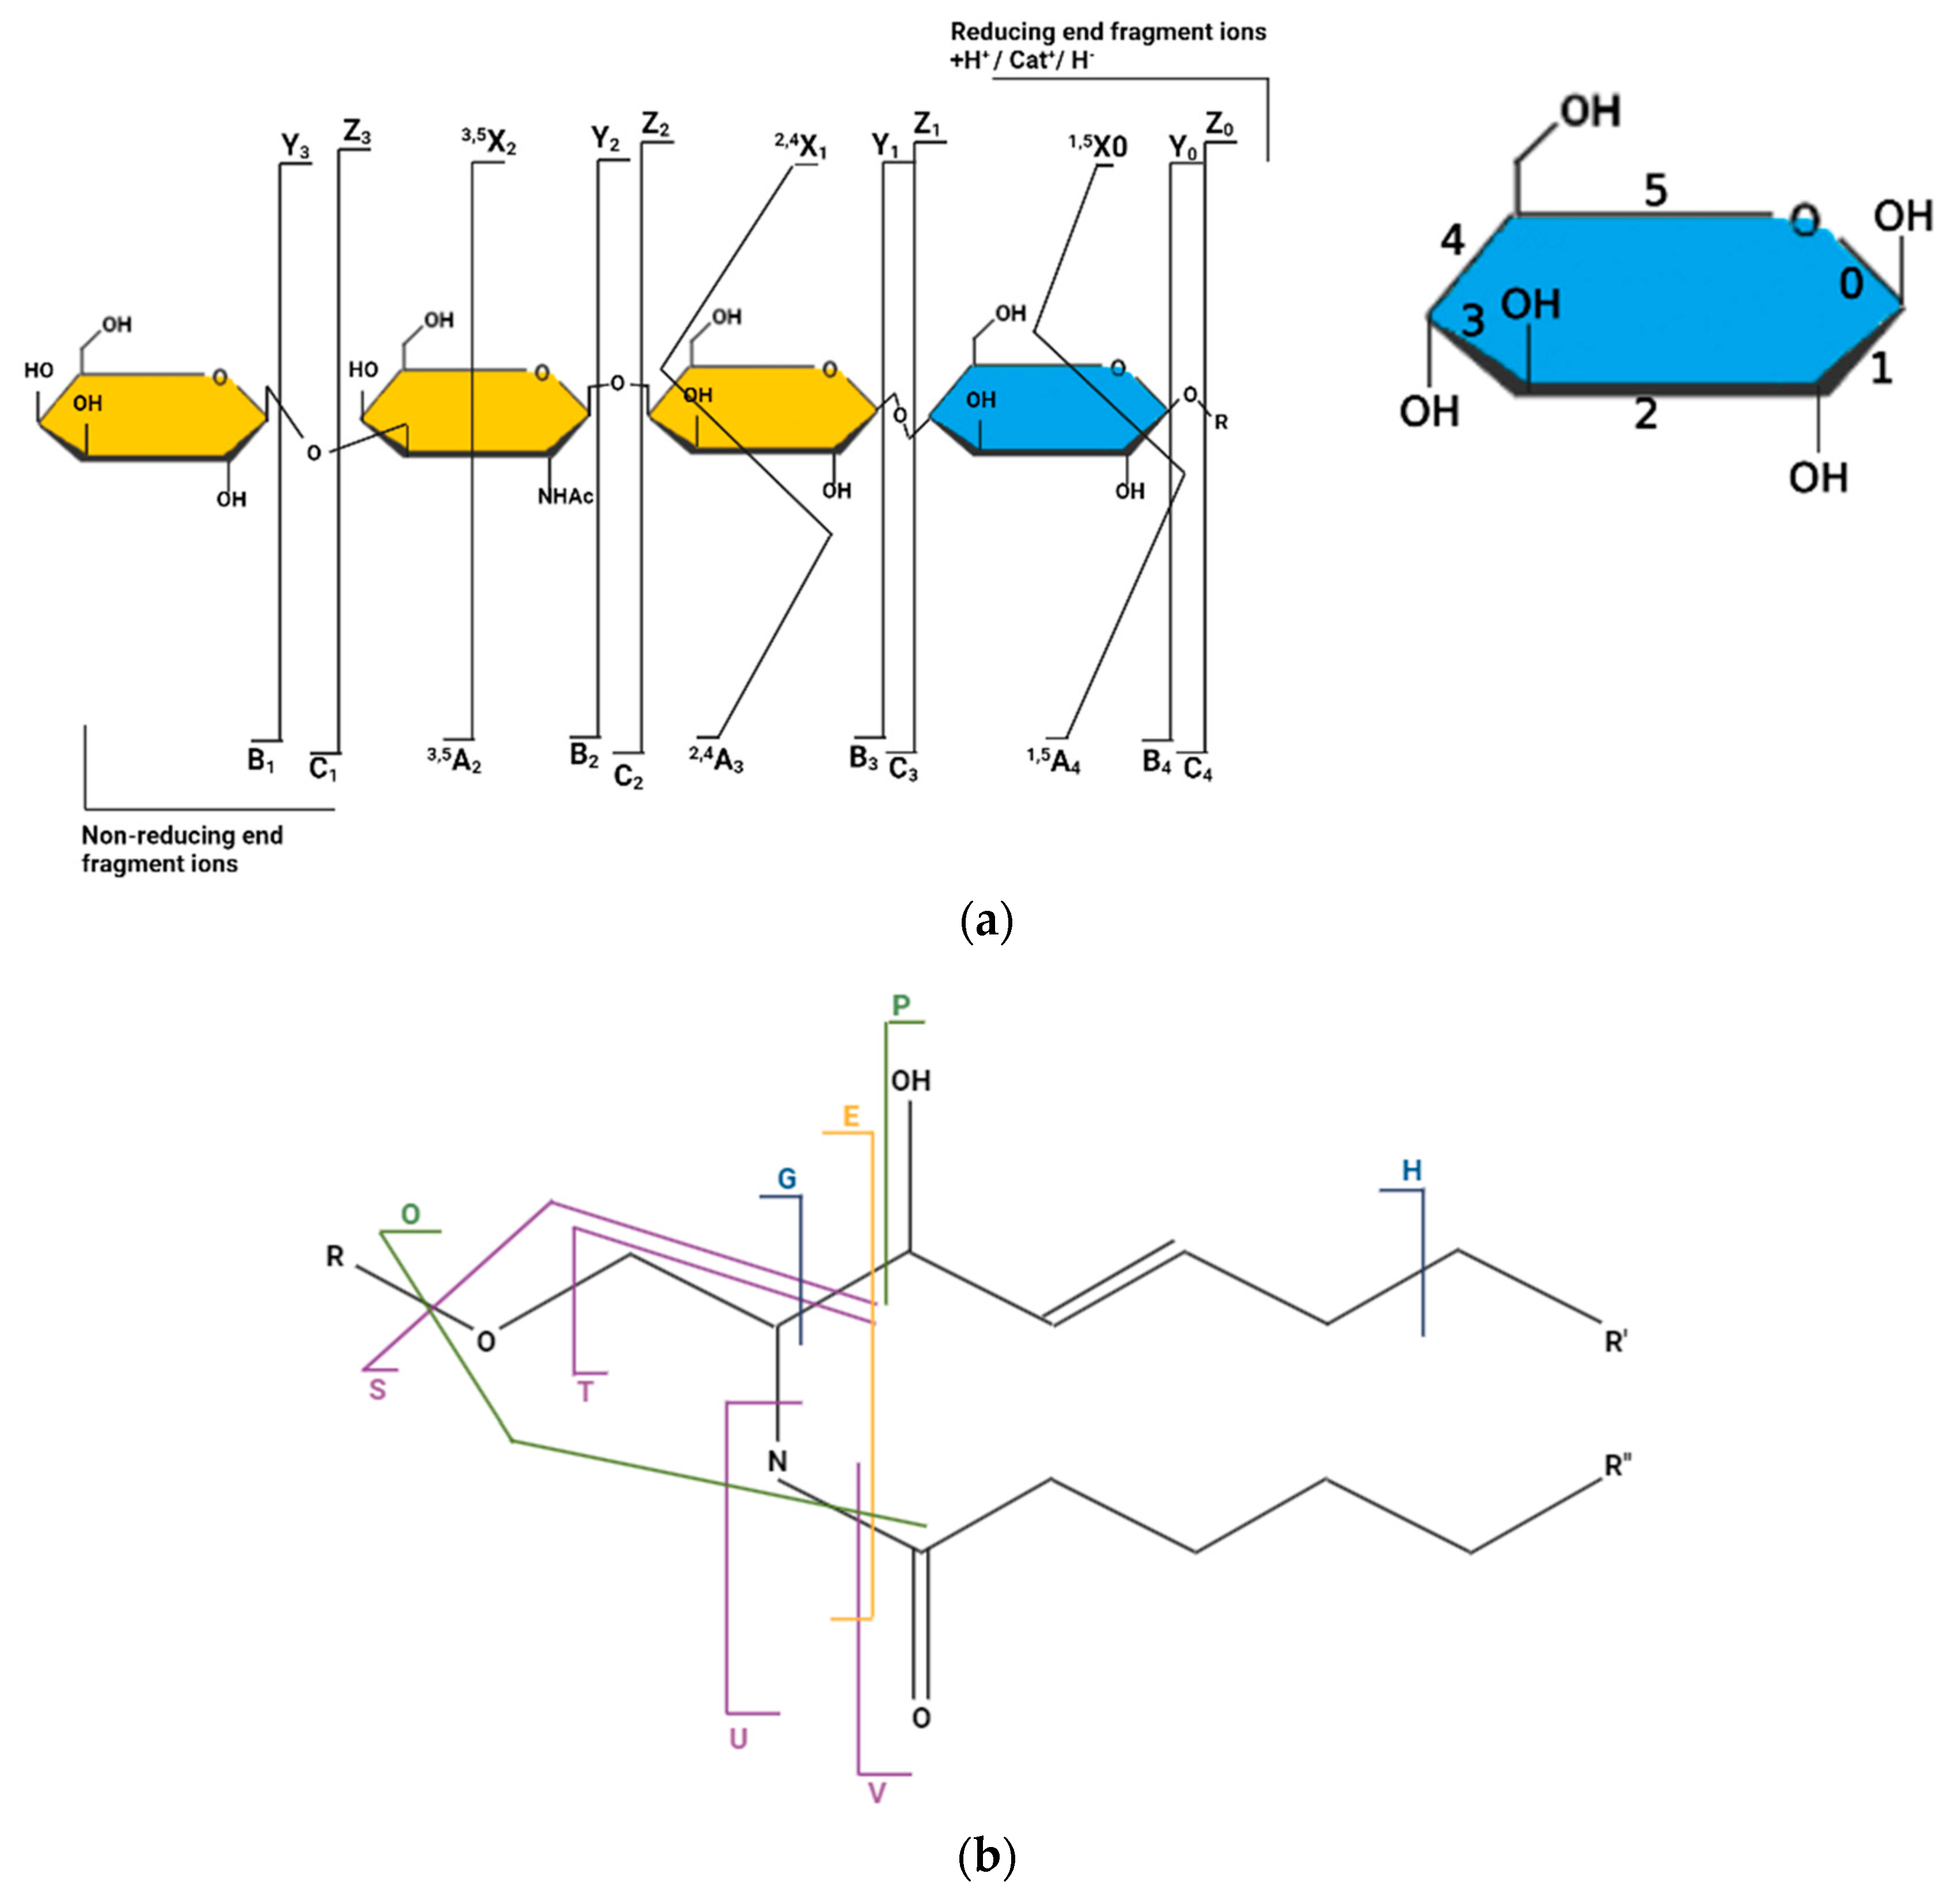
3.1. Fragmentation Map of GSLs

Fragmentation can occur at many levels in the GSL molecule, and, because of the complexity and the diversity of the products formed, Domon and Costello proposed a nomenclature [110]: the labels Ai, Bi, and Ci are employed to indicate segments containing a sugar unit at the terminal (non-reducing) end, while Xj, Yj, and Zj denote ions that still retain the aglycone (or the reducing sugar unit). Subscripts convey the position relative to the ends, similar to the peptide nomenclature, and superscripts signify cleavages within the carbohydrate rings. When the charge is preserved on the carbohydrate segment, the fragments are denoted as Ai, Bi, and Ci. Here, ‘i’ signifies the sequential number of the glycosidic bond cleaved, starting from the non-reducing end. Conversely, ions encompassing the aglycone (or the reducing sugar unit in the context of oligosaccharides) are identified as Xj, Yj, and Zj. In this scenario, ‘j’ indicates the number of the interglycosidic bond counted from the aglycone (starting from the reducing end of carbohydrates). The glycosidic bond connected to the aglycone is labeled as 0 (Figure 1a).
For the designation of the ions obtained after fragmentation of the ceramide moiety occurs some established nomenclatures are used [111,112,113], the most complete being the one introduced by Ann and Adams [111]. According to this nomenclature, sphingoid-base-containing ions are designated as O and P, N-acyl-chain-containing ones are designated as S, T, U, and V, the ones that result from the fragmentation of the sphingoid base are designated as G and H, and after fragmentation of both the sphingoid base and the N-acyl chain, the E ion results (Figure 1b).

3.2. The Influence of Matrices Used in MALDI Non-Imaging MS Analysis of GSLs

MALDI is a soft ionization technique that involves a laser striking crystals containing a small amount of analyte dispersed in a large amount of a matrix of small molecules in a substantial quantity of a small molecules matrix in order to obtain analyte molecules in the gas phase without fragmenting or decomposing them.
In mass spectrometry (MS), the matrix plays several pivotal roles. It serves to both dilute and ionize the sample, as well as to absorb the laser energy. Additionally, the matrix helps prevent the aggregation of analyte molecules and the formation of clusters [114,115]. Both the sample and matrix are vaporized from the target’s surface, triggering a chemical reaction. In the positive ion mode, this reaction leads to the attachment of a proton or alkali metal atom to the sample molecules, whereas in the negative ion mode, [M − H] ionic species are typically generated.
The matrices are organic compounds with low molecular weights, exhibiting low vapor pressure and volatility. They often possess an acidic nature, facilitating the excitation of photons and subsequent ionization of the analyte. Although a few basic matrices are available, the majority are acidic. The matrices also possess robust energy absorption capabilities within the UV and IR spectra. As a result, they can harness energy from the laser source, becoming excited and releasing photons for the ionization process. In recent decades, there have been many matrices used in the MS process (Figure 2), each having their advantages and drawbacks (Table 3).
  • DHB (2,5-dihydroxybenzoic acid)
Glycoproteins, glycans, and frequently peptides are usually analyzed in this matrix, soluble in both organic solvents and water. DHB’s most important disadvantage is the formation of big crystal needles which modify the spot-to-spot sample geometry on a preparation. When summing up spectra from various sample preparation spots, the result is a significantly lowered resolution. Preparations of DHB will make up a crystalline ring on the steel plates.
Krutchinsky et al. [116] studied a phenomenon called “chemical noise background” in MALDI MS. Sample impurities, desorption and ionization of the sample, and matrix impurities have been linked with this “chemical noise”. The sensitivity of the mass spectrometer is constrained primarily by background ions present in the mass spectrum rather than its inherent sensitivity. Background ion signals can be discerned at virtually every m/z value. A detailed analysis of these distinct background peaks at higher resolutions reveals the existence of numerous diverse ion species at each m/z value. Impurities can be removed to a certain degree by using highly purified reagents, as well as by analyzing purified MALDI substrates obtained by using different analytical separation methods. Krutchinsky et al. [130] used a polycarbonate compact disc as the MALDI target and found that using this type of target produced the lowest background “chemical noise” out of all their samples tested (approximately 20). Even though there are ways to decrease the background noise arising from impurities, elimination of this “noise” completely is very difficult. However, compared to electrospray ionization (ESI), MALDI ionization has a better tolerance to impurities, because the desorption process helps free the analyte ions from the undesirable impurities in a similar way as it frees them from the matrix. Zarei et al. [117,127] analyzed mouse brain gangliosides using MALDI-TOF using multiple matrices. Various solvents such as ethanol/water (1:1, v/v), acetonitrile/water (7:3, v/v), and ethanol/water/acetone (5:4:1, v/v) were used as solvents for different matrices DHB, ATT/DAC, and 2,4,6-trihydroxyacetophenone/DAC and these mixtures were examined initially using direct MALDI MS in positive ion mode. Efficient ionization of neutral GSL species was the target of this MS approach. The DHB matrix was found to provide a higher signal-to-noise ratio (S/N) compared with other matrices such as CHCA, even though a significant loss of sialic acid was observed. This occurred more in trisialo-GSLs compared to mono- or disialo-GSLs. Afterwards, DHB was dissolved in the aforementioned solvents and subjected to nano-high-performance liquid chromatography MALDI MS (nanoHPLC/MALDI MS). Taking into consideration the crystallization efficiency without the need for any recrystallization attempts and the abundant yield coverage of major and minor neutral GSL species from the samples analyzed within spots, the DHB matrix dissolved in a mixture of acetonitrile/water (7:3, v/v) was best suited.
One major drawback of MALDI MS is the formation of fragmentation ions [117,118,119,120]. However, Penn S. et al. [121] found that DHB was a suitable matrix to limit fragmentation on a mixture of ganglioside standards when they compared MALDI with ESI in their study on Fourier transform mass spectrometry (FT-MS). Both positive and negative ion modes were employed, leading to fragmentation in both cases. Negative ion mode exhibited superior performance for GSL analysis. When using DHB as a matrix, MALDI spectra in negative ion mode outperformed those in positive ion mode. The lower performance in positive ion mode can be attributed to the heightened susceptibility of sialic acid to charge-induced fragmentation. Sugiyama et al. [123] analyzed different GSLs from different tissues (ganglioside GM1—isolated from GM1 gangliosidosis brain, GM2—from a Tay–Sachs brain, GM3 and GD3—from human brain tumor tissue) in both positive and negative ion modes and found that using DHB minimizes sialic acid, fucose, and carbon dioxide loss. More fragmentation was observed in positive ion mode, prompting methyl esterification (methyl esterification neutralization of all sialic acids carboxylic groups) of the gangliosides at the carboxyl groups of the sialic acids to reduce the loss of sialic acid [123]. Mank M. et al. [124] used MALDI MS on the GM1 brain ganglioside and found that the addition of butylamine diminished the intensity of fragment ions during the analysis of labile monosialylated oligosaccharides and bovine ganglioside GM1. Negative ion mode was not extensively investigated, as preliminary tests involving DHB and butylamine indicated that signal intensities were approximately 3 to 15 times lower in negative ion mode compared to positive ion mode.
Gangliosides in positive ion mode form alkali metal adducts ([M + K]+ and [M + Na]+) [10,125,131,132]. Bode et al. [118] used MALDI-TOF MS on GSLs obtained from bovine and human milk and obtained a [M + Na]+ adduct of a 36 C atom ceramide-residue of GM3 ganglioside. The mass distribution designated to GM3 was in the range 1176 to 1326 Da, while the molecular masses of GD3 ranged between 1523 and 1624 Da. These mass peaks can be caused by MALDI-induced formation adduct ions, ganglioside-alkali ions such as [M + Na]+ and [M + K]+. There are 28 Da intervals within the peak cluster which can be associated to chain length variations in the sphingoid base or fatty acid with CH2 groups of even number. Double sodium adduct ions were also found, which shifted the mass by + 22 Da compared to the [M + Na]+ ions. Other peaks were identified in the range between 912 and 997 Da with the same 28 Da intervals as above. The mass shift of 291 Da is attributed to the loss of a labile sialic acid [118]. Sodium and potassium ion adducts, especially for GD1, and GM3 gangliosides corresponding to the sodium-coordinated species such as [M − H + 2Na]+, [M + Na]+, and [M + Na]+ − CO2, were observed by Colsch B et al. [125] in a study on brain GSLs from adult wild-type C57BL/6 mice; NeuAc-dissociated ions and NeuAc-Hex-dissociated ions were also observed in a study by Kamimiya H. et al. using MALDI-TOF MS on GM3 standard GSL isolated from bovine brain and GM1a GSL isolated in their laboratory [132]. They also managed to reduce background noise by coupling high-performance thin-layer chromatography (HPTLC) with MALDI MS after washing the dried sample from a glass tube with non-polar organic compounds such as 1,2-dycholoroethane. This was performed to counter impurities from contaminants co-extracted with the samples, such as synthetic polymers, starch, and calcium sulfate, which are used as binders. The inclusion of spermine with DHB facilitated enhanced crystal formation and seemed to reduce the formation of alkali adducts, enabling sample analysis without the need for desalting, as observed by Meshref Y et al. [133] in a study on bovine brain GSLs using MALDI MS. In the negative ion mode, deprotonated ions are formed, for example, three separate types of molecular ions were observed, [M − H], [M − 2H+ + Na], and [M − H] − H2O. The smallest amount of fragmentation was produced in the negative ion mode (even though considerable fragmentation may occur in both negative and positive ion modes); some fragmentation was deemed acceptable because the fragmentation degree is usually consistent under identical conditions of ionization and can be accounted for within the analysis, as observed by Lee H et al. [122] in their study on human and bovine milk GSLs using Fourier transform ion cyclotron resonance mass spectrometry (FTICR-MS). Taketomi T et al. [128] used MALDI MS on brain gangliosides obtained from different species (GM1, GM2, GM3 from human brain, rat brain GM1 and GD1a, porcine brain GM1) and observed that negative ion mode is preferred (both when using DHB as well as CHCA as a matrix) because it suppresses salt formation and the production of alkali metal adducts.
Moreover, DHB was shown to be the matrix of choice in various studies analyzing GSLs profiles in a multitude of diseases. Alterations in the expression levels of GSLs provide potential serum biomarkers in disorders of the central nervous system and can also contribute to the pathogenesis of neurodegenerative diseases [134]. Thus, Gizaw et al. [134] showed that GM1, GM2, and GM3 seemed to be altered in the brain and serum samples of Alzheimer’s disease patients, while Holst et al. [135] and Du et al. [136] observed aberrant glycosylation of GSLs in cancer of the colorectum and in hepatocarcinoma, respectively (a distinct upregulation of GM1 and GM2 in hepatocarcinoma; more detailed information is provided in Section 3.5 and Section 3.6).
Additionally, Fujiwaki et al. [137] showed the occurrence of peaks suggesting GM1 gangliosides (m/z 1517 and 1545) in negative ion mode and asialo GM1 gangliosides (m/z 1277 and 1305) in positive ion mode in all sample tissues (liver, spleen, cerebellum, cerebrum) of a GM1 gangliosidosis patient, when analyzed using MALDI-TOF-MS.
  • DHA (2,6-dihydroxyacetophenone)
Jackson et al. [138] described the use of the DHA matrix in addition to DHB for direct MALDI-TOF MS lipid analysis of the rat cerebellum. GM1, GD1, and GT1 gangliosides assigned mass peaks were identified in the cerebellar cortex. Additionally, mass peaks linked to GM1 were identified in the cerebellar peduncle. Distinguishing between GD1a and GD1b was challenging due to their structural isomerism (differing only in the position of a single sialic acid) [138].
Employing DHA as a matrix resulted in mass spectra where ganglioside molecular ions became the predominant peaks, accompanied by reduced fragment peaks [139]. A combination of DHA, ammonium sulfate, and heptafluorobutyric acid (HFBA) effectively curtailed salt adduct formation, enhancing signal detection due to the presence of ammonium sulfate. Simultaneously, HFBA bolstered DHA stability within a vacuum [125].
When using the negative linear ion mode, employing the DHA matrix enhanced the identification of ganglioside species in adult wild-type C57BL/6 mice. This included O-acetylated GT1 forms, and a broader range of sialylated gangliosides, notably GD1 and GQ1 and their acetylated variants. These improvements were accompanied by a decrease in the S/N and an increase in resolution [125].
  • CHCA (α-cyano-4-hydroxycinnamic acid)
This matrix is usually used for lower-mass-range peptides, and it is well soluble in organic solvents and insoluble in water. The analyte molecules receive a lot of internal energy during desorption and ionization, which labels this as a “hard” matrix. A considerable amount of ion fragmentation appears in the drift tube (post-source decay). As the analyte molecules become bigger, the probability of fragmentation increases until fragmentation of almost all of the analyte ions occurs. Consequently, CHCA is the choice matrix for the analysis of post-source decay (PSD). The main advantage of CHCA is the ability of this matrix to form small homogeneous crystals. Geometric inhomogeneity is related directly to decreased resolution in the MALDI analysis, therefore, CHCA usage commonly produces good resolution. As CHCA is not water soluble, the samples can be washed on the target.
Fragmentation occurs as well as in the case of DHB in positive ion mode. Typical acidic GSLs (GM1, GM2, GD2, GD1a, GD1b, and GT1a) were characterized by E. Ito et al. with an AP-MALDI-QIT-TOF MS with MSn switching using CHCA as the matrix. They analyzed multiple gangliosides from different tissues: GM1 was derived from bovine brain, while GM2 was sourced from the brain of a patient with Tay–Sachs disease. GD2, GD1a, and GD1b were obtained from bovine brain, and GT1a from a human brain. Both positive and negative ion modes were employed, yielding data that proved valuable for the structural analysis of the compounds. MS1, MS2, and MS3 experiments were conducted in the positive ion mode. The mass spectra revealed sodium adduct molecular ions of GM1 containing Cer (d18:1/18:0) and (d20:1/18:0) at m/z 1568 and 1596, respectively. Ions resulting from the removal of NeuAc from the sodium adduct molecular ions were observed at m/z 1277 and 1305 in the MS spectrum. In MS2 spectra, ions at m/z 1115 and 912 were attributed to the elimination of Hex and HexNAc, while ions at m/z 1143 and 940 were linked to the same eliminations. As ceramide cleavage was produced during MS2, it became impossible to perform structural characterization of the ceramide moieties of GM1 by selecting m/z 912 and 940 as the precursor ions [140].
For characterization of GM2, CHCA seemed a suitable matrix as well as for Fuc-GM1, as no fragmentation of fucose was observed [124], although DHB was superior to CHCA, minimizing carbon dioxide and sialic acid loss from GSLs. Ample fragmentation is produced with the absence of both the intact disialoganglioside and the major mono-sialoganglioside fragments [121]. The CHCA matrix proved inadequate, resulting in a low S/N and significant sialic acid decay. Consequently, trisialogangliosides (GT1) were entirely undetectable as molecular ions [117]. The spectra displayed extensive sialic acid loss, manifesting as broad, unresolved peaks. The obtained fragment ions were broad and poorly defined; however, some structural insight could still be derived. Discrimination between GD1a (with sialic acids on different sugars) and GD1b (with sialic acids linked together) was achieved based on the relative abundance of ions resulting from the elimination of one or two sialic acid residues. Notably, GD1b exhibited a more pronounced loss of two sialic acids [114].
Methyl esterification reduces fragmentation, as seen in the observations of Andrew K. Powell in a study conducted on GD1a (two sialic acid (Neu-5-Ac) residues a2-3-linked to Gal). When derivatized as the methyl ester, however, an abundant molecular ion was produced and weak fragmentation was observed, obtaining structural information on the oligosaccharide chain. In the positive ion mode, this does not cause complete stabilization, as abundant fragment ions are present still [141].
Details regarding the carbohydrate sequences of asialoganglioside structures were acquired through AP-MALDI-QIT-TOF MS, utilizing MSn switching every 1.9 s per cycle in the negative ion mode. MS2 spectra of monosialoganglioside ions were generated for various gangliosides: GM1 at m/z 1544 and 1572, GM2 at m/z 1382 and 1410, GD2 at m/z 1382 and 1410, and GT1a at m/z 1544 and 1572. MS3 spectra of gangliosides, using ceramide ions as precursors, revealed distinctive types of ions (P, S, T, U, V, and R) associated with ceramide fragmentation, except for GD2. Despite the absence of the S-ion at m/z 324, ceramide structures of GD2 were still effectively characterized [125,140]. The analysis of various lysogangliosides in the negative ion mode proved superior to the positive ion mode, primarily due to the suppression of alkali metal adduct formation and salt complexation. This also highlighted the superiority of CHCA as a matrix compared to DHB [128].
CHCA was employed as a matrix in several studies with the aim of structural characterization of GSLs related to different diseases based on MALDI MS, [137,142]. Peaks corresponding to GM1 gangliosides (m/z 1517 and 1545) and asialo GM1 gangliosides (m/z 1277 and 1305) were detected in tissue samples from a patient with GM1 gangliosidosis [137]. Conversely, patients with other conditions exhibited a normal composition of long-chain bases in GM1 [142]. The sphingoid base of GM1 in Spielmeyer–Vogt type juvenile amaurotic idiocy seemed abnormal—a patient with Gaucher disease had a long-chain base composition in GM1 similar to the composition observed in the patient with Spielmeyer–Vogt idiocy [142].
  • 5-methoxysalicylic acid (MSA)
Lee et al. [129] analyzed brain ganglioside GD1a extracted from porcine brain. They achieved high-quality ganglioside profiles in the positive ion mode while minimizing the loss of sialic acid residues. While DHB enabled the detection of intact GD1a ions, significant loss of sialic acid residues was observed, and the spectrum was predominantly composed of asialoganglioside ions resulting from the removal of two sialic acid residues. In contrast, differences in sialic acid loss between MSA and DHB in the negative ion mode were not as pronounced as in the positive ion mode. Unfocused post-source decay (PSD) fragment ions of GD1a were present in the range of m/z 1500–1600 in the positive ion mode, but these PSD fragment ions were effectively mitigated by reducing the relative concentration of gangliosides to MSA [129].
In another study, Park et al. [143] employed alkali earth metal additives in order to differentiate ganglioside isomers through tandem MS. Their analysis focused on gangliosides GD1a and GD1b extracted from bovine brains. While GD1a and GD1b could not be discerned in the first-order mass spectra in the positive ion mode, they generated metastable fragment ions with notably distinct characteristics. However, MALDI-TOF/TOF mass spectra facilitated the detection of specific fragment ions for both GD1a and GD1b isomers. Utilizing alkali earth metal salts instead of alkali metal salts in the ganglioside sample mixture improved the reliability of isomer differentiation and the intensity of diagnostic ions in positive ion mode of MALDI MS/MS [143].
  • ATT (6-azo-2-thiothymine)
Zarei et al. [117] conducted a systematic MS sialylation analysis on a mixture of mouse brain gangliosides, utilizing ATT/DAC (6-azo-2-thiothymine/diammonium citrate) as a matrix. They employed both axial time-of-flight (a-TOF) and orthogonal-TOF (o-TOF) instruments in the positive ion mode. The use of an ATT/DAC matrix resulted in improved crystal formation, leading to a superior S/N ratio. Additionally, in another work by Zarei et al. [127], the addition of lithium citrate as a co-matrix for ATT during their LC/MALDI MS analysis of GSLs extracted from human erythrocytes yielded a favorable S/N ratio. This approach enhanced crystal formation in the LC eluent and demonstrated high ionizability of the substrates.
When adopting negative ion mode MALDI o-TOF analysis with the ATT/DAC matrix, significant changes in the relative intensities of GM1, GD1, and GT1 species were observed, accompanied by a general increase in S/N for all ionic species. Remarkably higher intensities were seen in GD1 and GT1 ion species, with minimal loss of sialic acid residues [117].
In a separate study, Peter B. O’Connor et al. [120] achieved reduced metastable fragmentation of gangliosides by temporarily increasing the pressure within an MALDI-Fourier transform mass spectrometry (FTMS) source to a range of 1–10 mbar during ionization. This approach decreased fragmentation by shifting the dominant peaks from the asialo fragment at m/z 1305 to the unfragmented molecular ion at m/z 1596, particularly when ions were desorbed at high pressure. Similar effects were observed for GD1a, GT1b, GQ1b, GP1b, and GP1c samples derived from human brain tissue. These samples showed decreased metastable fragmentation under high pressure conditions, with increasing the number of sialic acid residues making the molecule more fragile and prone to fragmentation [120].
However, even with the application of methyl esterification, some degree of sialic acid loss persists, albeit to a significantly lesser extent. Notably, the GT1b, GD1a, and GD1b fractions do not undergo dehydration or carbon dioxide loss, resulting in heightened sensitivity for the detection of intact molecular species [117].
  • THAP (trihydroxyacetophenone)
Ruh H. et al. [126] investigated the changes in complex neutral GSLs, including globotetraosylceramide (Gb4Cer), within a rat model of autosomal dominant polycystic kidney disease (ADPKD). They introduced PrimaDrop as an improved and broadly applicable sample preparation method for automated MALDI MS analysis of lipid extracts. This technique facilitated uniform co-crystallization, allowing relative quantification through indirect TLC−MALDI-TOF-MS.
During MALDI-TOF-MS analysis of dried droplet lipid analyte preparations, the formation of rings of large crystal aggregates around the edges of spots was observed across all matrices utilized in the study (ATT, DHB, and THAP). While both DHB and ATT yielded satisfactory spectra quality, the co-crystals formed between the analyte and matrix displayed an uneven distribution, leading to unsuccessful automated data acquisition attempts. This issue persisted despite other attempted crystallization methods, including fast evaporation, two-layer crystallization, and sandwich crystallization. To address this challenge, they devised the PrimaDrop method: a lipid sample is initially deposited onto a grounded steel target and allowed to dry, followed by the application of a concentrated matrix solution (in a rapid-evaporating solvent such as a chloroform/methanol mixture (7/3, v/v)) directly onto the previously dried lipid droplets. This approach resulted in a nearly uniform crystal distribution of the matrix, neutral kidney lipid extract, Gb4Cer standard, and silica-extracted GSLs using ATT, DHB, and THAP matrices.
The THAP and DHB matrices produced Gb4Cer spectra of excellent quality. Nevertheless, employing the ATT matrix and introducing sodium chloride into the sample proved to be the most optimal approach for effectively characterizing the Gb4Cer content in the kidneys of the ADPKD rat model [126].
As chemical noise develops when background ions are formed, various matrices were employed to identify the optimal variant in terms of the signal acquisition and with the minimal background noise. Zarei et al. [117] discovered that the highest signal intensity and S/N ratio for the expected mono-, di-, and trisialylated ion species of mouse brain gangliosides were achieved when employing THAP/DAC and ATT/DAC matrices.
DHB and ATT matrices notably and effectively mitigated sialic acid loss. CHCA necessitated maximal laser attenuation (minimal fluence) to achieve partially sialylated ganglioside peaks. In the positive ion mode, all peaks manifested as ions substituted with Na+ or K+, whereas in the negative ion mode spectra, only [M − H] ions were observed [131].

3.3. Instrumentation in MALDI Non-Imaging MS Analysis of GSLs

Matrix-assisted laser desorption and ionization mass spectrometry (MALDI MS) uses an ultraviolet absorbing matrix (in most cases) in order to rapidly and accurately determine different chemical compounds [144].
The matrix serves to absorb the laser’s emitted energy, averting the aggregation of analyte molecules and thwarting the formation of cluster ions [145]. Principally, when the laser beam interacts with the sample, the matrix absorbs the laser energy, forming co-crystals with the analyte. The matrix exists in a considerably greater excess compared to the analyte (often up to a 100,000-fold surplus). The vaporized matrix transports analyte molecules into the vapor phase. As the gas cloud expands, ions such as H+ and Na+ are exchanged between the matrix and analyte, resulting in charged analyte molecules. This process generates both cations and anions [146]. The key distinction between ions found in conventional electron impact (EI) spectra, known as ‘molecular (radical) ions’, and the ‘quasimolecular ions’ generated by MALDI MS lies in their mass. Molecular ions stem from the analyte by losing one electron, leading to a mass that perfectly corresponds to the analyte’s mass. Conversely, quasimolecular ions arise from the addition of a cation to the analyte, causing the mass of the analyte molecule to be lower than that of the quasimolecular ions [144].
These ions are accelerated within a potent electric field, reaching magnitudes up to approximately 20,000 V, before passing through a charged grid. The separation of masses occurs when ions traverse a field-free space in drift mode. Higher-mass ions take longer to reach the detector compared to lower-mass ions [147].
TOF detectors are widely embraced due to their nearly limitless mass range, rendering them particularly suitable for analyzing large molecules, as is often the case in MALDI MS. Furthermore, the pulsed ion generation inherent to MALDI aligns well with the characteristics of the TOF detector [115].
Due to its capacity to handle high masses and the pulsed nature of MALDI, this technique harmonizes well with a TOF analyzer. Increased laser power introduces an additional broadening of peaks due to the heightened energy dispersion of the desorbed ions.
Linear TOF instruments usually have low resolution, and isotope peaks, photochemical-, and alkali metal adducts are frequently not resolved. At high laser powers, additional peak broadening to the high mass side for ions having the same m/z but different velocities is observed.
To achieve optimal mass accuracy and resolution with a TOF instrument, it is imperative to maintain the laser power at the lowest feasible level, ideally just above the point where the ions first emerge [114].
The resolution of a TOF instrument can be optimized by using delayed ion extraction to extract the sample ions and a reflectron to minimize the spread of kinetic energy of ions with the same m/z. The coupling of a second TOF instrument to perform tandem MS analysis is sometimes necessary for the investigation of specific components in complex mixtures, in which case the first TOF mass analyzer performs the selection of the precursor ions, which are further subjected to fragmentation in a collision cell, while the second TOF mass analyzer is used to analyze the obtained fragment ions [148].
For MALDI, some of the most noteworthy advantages are that MALDI analysis is very simple, very fast—taking less than one minute to investigate one sample—and that MALDI can tolerate higher amounts of impurities, which minimizes the need for sample purification [144]. There are also disadvantages, especially concerning the sample preparation: in MALDI-TOF MS a solid sample is used, and the homogeneity of co-crystals created between the matrix and analyte is never entirely attained, resulting in inherent irregularities. As a consequence, the signal intensities attainable, marked by fluctuations occurring from one laser shot to another, hinge on the precise point where the laser interacts with the sample/matrix crystal. This challenge is somewhat alleviated by averaging a greater number of laser shots across various positions. Nevertheless, the quantitative assessment of MALDI spectra remains a somewhat challenging endeavor [144].
Gangliosides are GSLs possessing one or more attached molecules of sialic acid. Different methods of MALDI MS have been used to characterize these GLSs. On the traditional MALDI-TOF MS, an axial time-of-flight (a-TOF) or orthogonal-TOF (o-TOF) instrument can be employed. Typically, analogous patterns were observed in negative and positive ion modes for both native and methyl-esterified gangliosides using a-TOF and o-TOF analyzers. However, o-TOF exhibited a higher signal intensity and a more favorable S/N ratio for all species, along with enhanced detection accuracy and sensitivity [117].
When employing MALDI MS for the analysis of GSLs, whether in positive or negative ionization mode, fragmentation is a common occurrence [117,118,119,120,121]. Notably, UV-MALDI led to substantial sialic acid loss, prompting Michiko Tajiri et al. [119] to adopt IR-MALDI at a wavelength of 5.9 µm. This approach generated deprotonated ions [M − H] and facilitated the more sensitive analysis of negatively charged biomolecules such as intact gangliosides, surpassing the capabilities of UV-MALDI. Another strategy to mitigate fragmentation is the methyl esterification of GSLs, which involves neutralizing all of the carboxylic groups on the sialic acids. Methyl esterification enhances ganglioside stability and simplifies spectra interpretation, leading to more reliable data assignment, particularly within complex biological ganglioside mixtures. The application of o-TOF as an analyzer significantly boosts the stability of sialic acid residues on ganglioside precursors [117].
Penn et al. [121] compared ESI/FTMS with MALDI/FTMS. Negative ion mode gave better results in both procedures. MALDI/FTMS showed slightly more fragmentation. This was caused by differences in internal energy of the ionization process. Fragmentation can also be caused by trapping voltages and quadrupole offset which cause differences in translational energy. Positive ion MALDI/FTMS gave a good signal, but unknown compound identification would be difficult mainly because of multiple metal coordination. Fragmentation in MALDI can be manipulated by using alkali metal doping as well as manipulation of the laser intensity.
When using MALDI FTMS, high resolution and accurate mass determination are achievable with this approach, along with the added capability to conduct tandem MS for investigating the structural characteristics of different molecules [131]. Nevertheless, fragmentation can still manifest in this context, although this can be diminished by subjecting the system to pulsed high pressure within the 1–10 mbar range during desorption. In the absence of collisional cooling, the base peak in the spectrum tends to be the asialo fragment, a product of sialic acid loss through fragmentation. However, within the 1–10 mbar range, the base peak transitions to the unfragmented sodiated molecular ion [120].
The task of characterizing ganglioside structures can be particularly challenging, especially when dealing with complex gangliosides harboring numerous sialic acid residues. Methods have been developed to enhance this aspect. TOF/TOF-MS analysis can distinguish between α2,3- and α2,8-linked sialic acids, evidenced by distinct fragmentation patterns observed in the TOF/TOF-MS spectra of GD1a and GD1b [149]. In the context of MALDI quadrupole ion trap time-of-flight (QIT-TOF) MS, which enables MSn analysis and sensitive detection through multiple reaction monitoring (MRM), further characterization might necessitate MS, MS2, and/or MS3 analyses. However, when introducing a substantial surplus of molecules beyond gangliosides into an MS ion trap, they may interfere with ganglioside detection due to ionization suppression. MRM’s capability to select and analyze ions, coupled with the detection of product ions derived from selected precursor molecules, effectively eliminates excessive non-ganglioside molecules from the analytical system. This confers an advantage for analyzing small content molecules [150].
Negative ion mode MSn analysis provides valuable insights into molecular weights through MS1, oligosaccharide sequences deduced from ions resulting from successive oligosaccharide moiety elimination from deprotonated ions by MS2, and ceramide structure details from ions arising from fatty acids and sphingosine through MS3 [140]. Moreover, the MALDI-QIT system smoothly conducts sequential MS2 and MS3 analyses, offering precise structural elucidation of GSLs. While heterogeneity in ceramide and sugar moieties can yield intricate MS spectra, MS/MS effectively surmounts this challenge [151].
An essential aspect of this procedure is the utilization of a matrix solution composed of DHB dissolved in acetonitrile/water (1:1 v/v), yielding MS/MS spectra of satisfactory quality for highly sensitive structural analysis. Some GSLs, such as GD3 species, often present challenges in observation when employing MALDI-TOF due to the TOF analyzer’s suboptimal resolution. However, this limitation was surmounted by conducting structural elucidation through MS/MS, employing both collision-induced dissociation (CID) and infrared multiphoton dissociation (IRMPD) [122].
Another strategy for enhancing the structural characterization of GSLs involves integrating MALDI MS methods with distinct separation techniques. For instance, Ruh et al. [126] found Gb4Cer detection in kidney extracts was unfeasible without TLC separation. The TLC-MALDI-QIT-TOF MS system offers advantages such as generating simpler spectra with monosodiated ions, as well as circumventing mass accuracy and resolution issues that could arise from the uneven silica gel plate surface [151]. In the realm of FTMS analysis, which involves long detection times (seconds), a notable drawback is the elevated levels of analyte metastable fragmentation. A devised approach involves directly coupling TLC with vibrational cooling MALDI-FTMS, amalgamating the straightforward sample handling of TLC with high-resolution FT and accurate mass determination. This amalgamation also opens doors to tandem MS for detailed structural investigations [131]. High-performance thin-layer chromatography (HPTLC) can be employed in tandem with MALDI MS, offering the advantage of detecting signals sharing similar Rf values, such as GM1b and GD3 [152].
Several strategies are available to enhance the resolution beyond that which linear TOF instruments can provide. Firstly, incorporating a reflectron involving a reflecting electric field, which is arranged such that ions with higher energy penetrate deeper into the field, compensating for their increased velocity through a longer path. This approach aims to enhance resolution [114].
Secondly, employing a magnetic sector instrument equipped with an array detector captures signals from the pulsed ion source. Ions with different values of m/z can be collected across numerous laser shots and subsequently read out into a data system. Resolutions within the range of 1000–3000 have been achieved using this approach. Notably, a downside of sector instruments lies in their restricted upper mass limit imposed by the magnet, often limited to a few thousand Da [114].

3.4. MALDI Non-Imaging MS Analysis of GSLs in the Healthy State

With regards to data from healthy human tissues/fluids, GSLs (in particular, gangliosides from milk and brain tissues) can be grouped into three major areas of interest (see Appendix A, Table A1). First of all, there are studies regarding milk GSLs, the data being of great importance, as breastfeeding supplies the newborn with all the necessities in the first month of life, however, the role and importance played by the gangliosides are not fully understood at the moment. Next, we will approach the studies with regard to gangliosides extracted from the healthy human brain (in the next subsection there is a discussion regarding the pathological human brain, with an aberrant distribution of gangliosides), and finally, GSLs extracted from blood components (erythrocytes, leukocytes, platelets).

3.4.1. GSLs in Human Milk

Milk is a fluid produced by the human body in order to supply the newborn with all the necessities within the first years of life, however, the importance of the gangliosides in its structure is not fully understood at the moment [153]. Gangliosides in milk are found entirely in the membrane of the milk fat globule, playing different roles, including modulation of membrane protein function, host–pathogen interactions, and cell-to-cell recognition [122].
Due to their structure (the oligosaccharide headgroup interacts with cells’ external environment, while the ceramide moiety anchors within the membrane), gangliosides are considered bioactive components. Aside from its nutritional role, it is known that milk plays a vital role in forming the immunity, metabolism, and modulating the newborn’s microflora [122].
The role played by gangliosides found in human milk is still under research, and by determining their structures, as well as comparing this information with samples from other mammalians, new steps are being made in this research.
Lee et al. [122] described a rapid method to characterize milk gangliosides using MALDI FTICR MS with a laser pulse at 355 nm, using a standard DHB matrix, in both the negative mode and the positive mode. The ions of interest were further analyzed by tandem MS, using collision-induced dissociation (CID) and infrared multiphoton dissociation (IRMPD).
By analyzing bovine milk GM3 and GD3 standards first, the general pattern of fragmentation was identified, with the observation that IRMPD produced less ion fragmentation than CID, and less fragmentation was obtained using negative mode. Using the same experimental conditions, human and bovine milk gangliosides were prepared and analyzed, identifying GM3 (NeuAc-2Hex-Cer) from m/z 1152 to 1278 and GD3 (2NeuAc-2Hex-Cer) from m/z 1471 to 1577. Ten GM3 and six GD3 variants were abundantly present ions in human milk [2], suggesting that a high complexity of ganglioside structures can be found in human milk. Seven variants of GM3, and six of GD3, as well as other gangliosides, with the assigned structure 1NeuAc + 2HexNac + 4Hex and variations in the ceramide subspecies were found in bovine milk. Only human milk gangliosides have been found to have the ceramide carbons even-numbered (d34:1, d36:1, d38:1, d40:1, and d42:1).
Similar results were obtained by Bode et al. [109] using MALDI-TOF-MS performed on a Voyager-DE-STR system, using a 337 nm laser wavelength, also on a DHB matrix, in positive ion mode, when comparing human and bovine milk.
A high sodium content was found in the human milk gangliosides, with the detection of double sodium adduct ions on three separate GM3 variations. Bode et al. [109] found that the main fatty acid forms of GM3 in human milk were 22:0, 18:0, 16:0, and 24:0, and in GD3 they were 18:0, 16:0, 19:0, and 22:0. Another study [154] emphasized that long-chain FAs are found in higher abundance in human milk when compared to bovine milk, and higher concentrations of cerebrosides than LacCer also.
Regarding the bovine milk, Bode et al. [118] mention that the attribution of mass distributions was from 1176 to 1326 Da for GM3 and from 1523 to 1624 Da for GD3 in bovine milk, and both GM3 and GD3 have mainly 23:0, 22:0, and 24:0 as fatty acids, with an emphasis on the high content of 23:0 fatty acid content from bovine milk, compared with its minor representation in human milk [118].
Both studies compared bovine and human milk obtaining somewhat similar results, with abundant GM3 and GD3 species and higher complexity of their ceramide composition being found in human milk, and GD3 being present in a smaller proportion than in bovine milk, but the biological significance of this pattern is still to be elucidated.
Although GSLs are considered bioactive factors in human milk [155], the composition of human milk is complex and few data are available to date regarding GSL composition, and GSLs’ role in human milk, the question ”Why are GSLs present in milk, and what are their roles?” is still to be solved by ongoing and future studies.

3.4.2. GSLs from Human Brain Tissues

In the human brain, gangliosides have a multidimensional and complex function, and research is ongoing for further understanding of their specific roles in neural function and disease.
They are abundant in the myelin sheath that surrounds the neurons, taking part in functions such as neuronal signaling (modulating the activity of neurotransmitters), synapse formation, cell to cell interaction, and of course, formation of the myelin sheath [156].
In regards to nervous system disorders, gangliosides have been found to play a part in the development of Parkinson’s disease, Alzheimer’s disease, multiple sclerosis, as well as some types of cancer [123,134,135,157,158,159,160,161,162]. Due to the limited accessibility to samples of normal human brain tissue, there has been a notable dearth of research endeavors addressing this particular concern.
Human brain tissue samples (cerebellar, cerebrum and cortex, and gray matter from the occipital lobe) [163,164] are used alongside ganglioside standards to develop a technique for detecting molecular ion species without losing the labile sialic acid residues, using MALDI FT MS with ATT as a matrix by O’Connor et al. [120].
Following the crude lipid extraction from the human brain sample, two successful silica gel column migrations were performed for obtaining a ganglioside-enriched fraction. The second ganglioside-enriched fraction was subjected to alkaline hydrolysis, dialysis, and underwent HPTLC (bromophenol blue was used as color indicator), thus obtaining the purified ganglioside fraction that was subsequently subjected to acetylation (formamide/pyridine/acetic anhydride), dilution, and dialysation, applied to a Sephadex G25 chromatography column and a final silica gel column, from which the second eluate contained the highly purified ganglioside [164]. The research results indicate that with an increasing count of residues of sialic acid, the ion species exhibit heightened vulnerability, rendering them susceptible to fragmentation through the loss of carboxyl groups and sialic acid, resulting in the formation of formic acid. However, under collisional cooling conditions, the unfragmented sodiated molecule remains dominant as the highest intensity peak [120].
During the study, non-covalent matrix adduction was observed, forming ATT matrix clusters. The S/N ratio was higher in the human brain tissue sample compared to the ganglioside standards. Compared to the ganglioside standard, the human brain GSL mixture (GP1b,1c and GQ1b) expressed, under high pressure, diminished metastable fragmentation in a significant manner. Both GQ1b (at m/z 2512.12 M 3 Na H and GP1b,1c (at m/z 2798.13 M 4 Na H were obtained in negative ion mode, proving that coupling TLC separations with MALDI-FTMS permits the analysis of gangliosides without fragmentation, providing high accuracy and resolution [120].
DE (delayed ion extraction) MALDI-TOF MS (Voyager Elite XL Biospectrometry Workstation (PerSeptive Biosystems, Framingham, MA, USA) with nitrogen laser pulsed at 337 nm wavelength) was used by Sugiyama et al. [162] for identifying several gangliosides from normal (GD1a, GD1b, GD2, GalNAc-GD1a) and pathological brain tissues (detailed in the next subsection). Both ion modes, negative and positive, were employed. Using both A-CHCA and 2.5 DHB as matrices, and both ion modes (negative and positive) for establishing a suitable protocol, the authors used a method of microwave-mediated saponification for the gangliosides for preparing their lysogangliosides in order to determine the ceramide composition [123,128].
The method is used for easier determination of sphingoid base GSL composition. Comparing the obtained spectra with the calculated values of monoisotopic molecular ions, the obtained results were promising.
For GD1a and GalNAc-GD1a, methyl esterification with methyl iodide was necessary to minimize sialic acid loss and obtain good MS spectra, whereas for the “b” series gangliosides (GD1b, GD2), there was no need for methyl esterification, as they are evidenced in the mass spectra as dehydrated molecule-related ions M H H 2 O at m/z 1817.97 and m/z 1846.00, suggesting a lactone ring formed in the disialic acid moiety, between the hydroxy group and the carboxyl group. Using this method, the authors were able to differentiate between the same-molecular-weight GD1a and GD1. GD1a exhibited methyl esterification of its sialic acid residues to prevent their loss during the positive ion mode analysis. This modification was indicated by high peaks at m/z 1887.95 and m/z 1915.98 corresponding to [M + Na]+ monoisotopic masses for the dimethyl ester of GD1a. In contrast, GD1b lacked such methyl esterification, resulting in well represented peaks at m/z 1858.68 and m/z 1886.79 corresponding to [M + Na − 2H] monoisotopic masses. Consequently, the differential modification of sialic acid residues in GD1a and GD1b led to distinct mass spectra and discernible peaks, thereby enabling their differentiation.
A remarkable observation was that various series of gangliosides have individually characteristic molecule-related ions peaks (for “a” series M + Na 2 H + and for “b” series M H H 2 O ) .
In a study by Gizaw et al. [159], normal and pathological (Alzheimer’s disease) human brain tissues (collected from the parietal, temporal, frontal, and occipital cortices), and blood serum are used to compare glycans using MALDI-TOF and, afterward, MALDI-TOF/TOF mass spectrometry on a Bruker Daltonics apparatus (Bruker Daltonics, Bremen, Germany), using DHB as a matrix.
A novel method of glycoblotting was proposed by the authors, which enables a process of efficient glycan enrichment that purifies and labels GSL-released glycans. Total lipids were extracted from the brain tissue samples through CHCl3/MeOH/H2O. The upper phase was subsequently dried at room temperature, suspended in CHCl3/MeOH, sonicated, and subjected to ozonolysis and alkaline degradation to break down the GSLs, followed by glycoblotting using BlotGlyco beads for glycan enrichment. Methyl esterification and BOA labeling were performed to further modify the glycans. This method allows for effective analysis of the labeled glycans using MALDI-TOF-MS [134].
It was found that the intact oligosaccharides release of glycan, independently of GSLs’ structures, was obtained indiscriminately by the ozone-based protocol proposed. The study found abundant gangliosides in both diseased and normal samples. The mass spectrum revealed the highest intensity peak of the ganglioside GM1, followed by GM2, GD1a/GD1b-lactone and GT1a/GT1b-lactone. It should be mentioned that the GD1b-lactone ganglioside is not an artifact, but rather an authentic product of brain metabolism which is human brain specific [134].
Taki T. [158] introduces a novel approach known as TLC-Blot-MALDI-TOF MS, where the separation of lipids on a TLC plate is followed by marking them with a soft pencil after being treated with the primuline reagent to enhance their visibility under UV light. The plate is subsequently immersed in a blotting solvent for 10 s, and immediately placed onto a PVDF membrane (glass fiber filter/Teflon membrane/PVDF membrane/HPTLC plate), which is then pressed in a thermal blotter for 30 s at a temperature of 130 °C. The lipids are transferred to the opposite side of the membrane, facing away from the TLC plate.
Distinct bands corresponding to GM1, GD1a, GD1b, and GT1b lipids were clearly visible on the TLC plate when analyzing lipids extracted from brain samples of individuals with Alzheimer’s disease, Parkinson’s disease, and from normal human brain control samples. Utilizing an AXIMA-QIT (quadrupole ion trap)-TOF MS (Shimatzu, Japan), employing a nitrogen laser emitting at 337 nm and 2, 5 DHB as a matrix, and operating in the negative ion mode, mass spectra of normal human brain tissue were obtained (specifically gray matter from the hippocampus), with m/z 1544 (d18:1) and m/z 1572 (d20:1) for GM1, m/z 1544 (d18:1), m/z 1572 (d20:1), m/z 1857 (d18:1), and m/z 1885 (d20:1) for GD1a, m/z 1544 (d18:1), m/z 1572 (d20:1), m/z 1857 (d18:1), and m/z 1885 (d20:1) for GD1b, and m/z 1544 (d18:1), m/z 1572 (d20:1), m/z 1835 (d18:1), m/z 1885 (d20:1), and m/z 2198 (d20:1) for GT1b.
While simple gangliosides (e.g., GM3) prevail in peripheral tissues [165], more than 90% of the adult human brain ganglioside content is shown to be represented by the few complex gangliosides (GM1, GD1a, GD1b, and GT1b), followed by very low amounts of GQ1, GM3, and GM2 [166,167].
The age-related decrease in ganglioside content with similar modifications in phospholipid and cholesterol levels [168,169] could be associated with tissue atrophy, cell death, or the change in brain cytoarchitecture (e.g., loss of synapses, increased number of neuroglia, etc.).
A specific alteration of the brain ganglioside profile occurs with aging in healthy humans, with a shift from complex to simple gangliosides: a relative decrease in GD1a and GM1 and a relative increase in GD1b, GM3, and GD3. This shift in the ganglioside pattern might reveal metabolic and/or cellular modifications [169,170].
While the abundance of GM, GD, and GT species identified in normal adult brain tissues in the above-presented studies underlines their critical roles in maintaining brain health [154], the lesser-explored GQ and GP species are a peculiar finding and need further investigation in order to provide insights on the complex functions of gangliosides in the human brain. Nonetheless, the scarcity of normal human brain tissue samples hinders extensive exploration in this domain. In the presented protocols, each method for sample preparation was proposed for keeping GSLs as intact as possible, with sialic acid loss being an issue to be addressed by improved sample preparation procedures.

3.4.3. GSLs Extracted from Human Blood Cells

GSLs play vital roles in signal transduction, cell-to-cell communication, and the membrane structure in blood cell components, having several important functions essential for the proper functioning of the immune system, blood homeostasis, the process of blood clotting, and hemostasis [32].
Three major GSL species were identified in erythrocytes: lactosylceramide (LacCer), globotriaosylceramide (Gb3Cer), and globotetraosyiloceramide (Gb4Cer), each with C16 and C24 fatty acid chains. [127]. In red blood cells, GSLs act as blood group antigens (globo-family GSLs proceed from the addition of an α1 → 4Gal to LacCer to form globotriaosylceramide (Gb3, Pk), which will then serve as a substrate for the formation of the globoside (Gb4, P antigen) by attaching a terminal β1 → 3GalNAc to Gb3), but also have been shown to play a role in the migration and adhesion of blood cells [171].
Zarei et al. [127] carried out an analysis of GSLs extracted from human erythrocytes. Anion-exchange chromatography was used to isolate neutral GSLs, which were then purified by silica gel gradient chromatography. Afterward, the GSLs were peracetylated and separated on Florisil, eluted with dichloroethane/acetone, saponified, and desalted, the obtained mixture of neutral GSLs was adjusted to a concentration of 1 µg/µL. A nano-HPLC/MALDI MS coupling was achieved (Ultimate nanoLC system with Famos autosampler and nanoscale TSK-GEL Amide-80 column; MALDI-TOF Reflex III, Bruker Daltonics, with nitrogen laser pulsed at 337 nm and DHB as matrix), while for MALDI spotting, a Proteineer FC robot from Bruker Daltonics (Bruker Daltonics, Bremen, Germany) was used and the best reproducible matrix deposition with efficient crystallization was a DHB matrix dissolved in acetonitrile/water (7:3, v/v). Depending on the ionization requirements of the analytes, both negative and positive ion modes were operated on the instrument.
Three major GSL species were identified: lactosylceramide (LacCer), globotriaosylceramide (Gb3Cer), and globotetraosyiloceramide (Gb4Cer), each with fatty acid chains C16 and C24. According to the elution times, LacCer was identified at m/z 884.79 (d18:1 C16:0) and 996.78 (d18:1/C24:0) at 38 min and at m/z 884.67 (d18:1/C16:0) at 43 min; Gb3Cer was only identified at m/z 1158.71 (d18:1/C24:0) and Gb4Cer, the dominant GSL according to the intensities, was identified at m/z 1249.83 (d18:1/C16:0), 1333.86 (d18:1/C22:0), 1359.89 (d18:1/C24:1), and 1361.88 (d18:1/C24:0).
In order to suppress the formation of cation adducts of different kinds (H+, K+, Na+), the authors proposed adding lithium salts for convenient analysis. After a trial-and-error process, the ATT matrix with lithium citrate as a co-matrix was chosen as the most suitable combination. In the mass spectra, the GSL species were exclusively identified in their lithiated forms, at elution times of 41 min and 43 min, respectively, for Gb3Cer at m/z 1140.68 Gb 3 18 : 1 / 24 : 1 + Li + , m/z 1142.71 Gb 3 18 : 1 / 24 : 0 + Li + and for Gb4 at m/z 1233.65 Gb 4 18 : 1 / 16 : 0 + Li + , m/z 1317.76 Gb 4 18 : 1 / 22 : 0 + Li + , m/z 1343.83 Gb 4 18 : 1 / 24 : 1 + Li + , and at m/z 1345.82 Gb 4 18 : 1 / 24 : 0 + Li + . The protocol is suggested for further analysis, as it is simple and minimizes sample loss by crystallization procedures.
In red blood cells, GSLs act as blood group antigens (globo-family GSLs are obtained from the addition of an α1 → 4Gal to LacCer to form globotriaosylceramide (Gb3, Pk), which will then serve as a substrate for the formation of the globoside (Gb4, P antigen) by attaching a terminal β1 → 3GalNAc to Gb3), but also have been shown to play a role in the migration and adhesion of blood cells [171]. The oligoglycosylceramides of erythrocytes—known as blood-type determinants—have attracted special interest, as they are important for cellular interactions and are essential factors in deciding the suitability of blood and other tissues for transplantation. Moreover, Gb3 was shown to bind specifically to the verotoxins of Escherichia coli and to Shiga-like verotoxins, and it is an important factor in the progress of disease by enabling access into cells. Gb3 has been involved with other GSLs in host–cell interactions with the HIV virus, where it appears to have a protective role, while Gb4 helps the entry of the parvovirus B19 into cells. B19 parvovirus causes erythema infectiosum and leads to congenital anemia and hydrops fetalis subsequent to in utero infection. It is also linked to transient aplastic crisis in patients with hemolytic anemia and with cases of pure erythrocyte aplasia and chronic anemia in immunocompromised individuals. Gb3 levels and levels of particular gangliosides, are increased in some cancers, and are connected with an increase in multidrug resistance of the tumor [172,173].
Regarding human platelets, Taketomi et al. [162] proposed an analysis performed with DE MALDI-TOF MS, using a Voyager Elite XL (PerSeptive Biosystem, Framingham, MA, USA), equipped with a nitrogen laser (337 nm) and using 2, 5 DHB as a matrix. Using the preparation of GSLs through the method of saponification [162,163] described earlier, the mass spectrum revealed molecular species of sphingomyelin, GlcCer (glucosylceramide), LacCer, Gb3Cer, Gb4Cer, and GM2, with sphingomyelin being the major sphingolipid detected [162]. Another study [174] revealed that LacCer and GM3 are the major GSLs of human platelets, while GD3 was synthesized upon platelet activation and selectively stimulated human platelet adhesion, spreading, and aggregation [175].
In addition, GalCer [176], sulfatides [177], GlcCer [178], GM1 [179], Gb3 [180], and sialyl-galactosylgloboside [181] have also been found in human platelets.
In platelets, GSLs are involved in the aggregation of platelets, adhesion to the injured blood vessels, signal transduction, and thrombus formation [174,182].
This method permits the detection of multiple GSLs from a unique sample, with quick steps for sample preparation, offering perspectives on the future use of MS in GSL profiling from human blood samples. A small quantity of platelets (approximately 50 mg) is employed, which is particularly advantageous when dealing with limited sample volumes. While using chloroform:methanol (2:1, v/v) as the extraction solvent mixture ensures efficient extraction of lipid components, the stepwise extraction process enables the selective removal of specific lipid classes, such as cholesterol, simple lipids, and glycerophospholipids, thereby enhancing the specificity of the analysis. Moreover, the saponification step involving 0.5 N NaOH in methanol at 50 °C for 1 h facilitates the breakdown of complex lipids, allowing for the individual identification of molecular species. Subsequently, the separation of the upper and lower phases, followed by centrifugation, aids in the removal of salts, ensuring a cleaner sample for analysis. MALDI-TOF MS is employed for the precise identification/characterization of various sphingolipids and GSLs. It enables the comprehensive confirmation of major sphingolipids, including sphingomyelin, and the definitive identification of multiple minor GSLs.
Miller-Podraza et al. [159,183] investigated how avian and human influenza viruses bind to gangliosides obtained from diverse human tissues and cells, with a particular focus on leukocytes. MALDI-TOF MS was performed on a TofSpec-E (Micromass, Manchester, UK) using ATT as a matrix, to elucidate the structural characteristics of gangliosides and identify the specific ganglioside species responsible for virus binding.
Gangliosides were isolated from various types of human tissues (leukocytes, erythrocytes, small intestine, stomach, meconium, colon, pancreas), but leukocytes showed the best binding capacity of gangliosides in the assay conditions and were further analyzed. Human white blood cell mixtures were obtained from healthy donors’ venous blood. The buffy coats, comprising of polymorphonuclear leukocytes, were isolated by lysing erythrocytes using a 0.8% NH4Cl solution. After 400× g centrifugation, fractions containing 70% to 85% polymorphonuclear leukocytes were selected for further experiments.
To facilitate the analysis, the gangliosides underwent mild periodate oxidation. They were incubated with NaIO4 (1–2 mM) in acetate buffer (pH 5.5) on ice for a duration of 40 min, followed by the cessation of the reaction through the addition of an excess amount of Na2SO3. The resultant mixture underwent freeze-drying, leading to a concentration increase of approximately five-fold. Next, the sample was subjected to reduction using an excess of NaBH4 at room temperature over the course of an overnight period. Subsequent to this, the sample was subjected to dialysis using distilled water, and the final step involved freeze-drying.
For specific binding assays, TLC overlay techniques were employed. Different overlays were conducted (influenza virus overlay, antibody overlay, and lectin overlay)
The human influenza virus exhibited a highly selective binding profile, primarily targeting extended glycolipids found in human leukocytes. Notably, it displayed negligible binding affinity to shorter ganglioside species, including the commonly abundant GSL species with 6-linked NeuAc. Weak binding interactions were also observed with species which are slow-moving derived from various human tissues such as the small intestine and pancreas.
In contrast, the avian influenza virus displayed broader binding capabilities, interacting with various gangliosides across all tested tissues. It showed an affinity for species which are NeuAcα3Gal-terminated, as evidenced by its binding to NeuAcα3-paragloboside (S-3-PG) and GD1a and GT1b gangliosides [183].
The isolated gangliosides, particularly those derived from leukocytes, were subjected to MALDI-TOF MS analysis.
The MALDI-TOF mass spectra revealed the presence of complex gangliosides with 8–11 monosaccharides per mol of Cer, as follows: m/z 2394.0 (NeuAc1Fuc1Hex5HexNAc3Cer—d18:1/C16:0), m/z 2248.7 (NeuAc1Hex5HexNAc3Cer—d18:1/C16:0), m/z 2504.4 (NeuAc1Fuc1Hex5HexNAc3Cer d18:1/C24:1), m/z 2173.7 (NeuAc2Hex4HexNAc2Cer d18:1/C16:0 and/or NeuAc1Fuc2Hex4HexNAc2Cer d18:1/C16:1), m/z 2649.3 (NeuAc2Hex5HexNAc3Cer d18:1/C24:1 and/or NeuAc1Fuc2Hex5HexNAc3Cer d18:1/C24:1 and/or NeuAc1Fuc2Hex5HexNAc3Cer d18:1/C24:2), and at m/z 2030.4 (NeuAc1Fuc1Hex4HexNAc2Cer d18:1/C16:0). The most abundant molecular ions corresponded to gangliosides such as NeuAc1Fuc1Hex5HexNAc3Cer and NeuAc1Hex5HexNAc3Cer.
The authors discovered that the human influenza virus selectively binds to complex fractions found in human leukocytes. Sialyl Lewis X and VIM-2-active saccharides were ruled out as binding sequences. The binding was dependent on the intact glycerol sialic acid tail and involved minor NeuAcα6-containing species. Overlapping binding with anti-sialyl Lewis x antibodies but not with less complex gangliosides was also noted.
Although the use of MALDI MS in the profiling of GSLs of leukocytes is poorly represented, the results of its utilization shed light on the interaction between GSLs and various (e.g., virus binding) pathogens, contributing to our understanding of host–pathogen interactions, with GSLs being highlighted as receptors in specific carbohydrate–protein interactions. GSLs have been identified as functional E-selectin receptors on human neutrophils. Low to moderate E-selectin tethering activity was noticed in fractions of monofucosylated and difucosylated GSLs with three to four LacNAc repeats, the most potent fractions being those with five to six LacNAc repeats and two to three Fuc residues. Interaction with E-selectin on endothelial cells mediates leukocyte extravasation when and where needed by their tethering and rolling, stopping, flattening, and squeezing into the surrounding tissue [184].
Nevertheless, signaling cascades downstream of E-selectin–GSL binding have yet to be clarified.
Non-MS analyses showed that the GSL components of the different subclasses of leukocytes are mostly represented by GlcCer, GalCer, LacCer, GM3, GM1, complex type (a-, b-, o- type), and in addition in lymphocytes by GD3, 7-O-GD3, and 9-O-GD3, along with Gb3 and Gb4. GSLs from the lacto- and neolacto-series are represented by Lc3 and nLc4 in lymphocytes and macrophages, and nLc6, S(3)nLc4, S(6)nLc4, and S(3)nLc6 appear in neutrophils and monocytes also. Eosinophils contain only GM1, and in basophils GSLs have not been reported [32]. GSL expression was shown to be modified during immune cell development and differentiation, maturation, and activation. Immune cell GSLs impact membrane organization and are essential for the enrolment of immune-related proteins to specific membrane microdomains, being involved in various molecular signaling, and trans-interactions in cellular cross-talk, and thus, modulating the immune cell functions [32].

3.5. MALDI Non-Imaging MS Analysis of GSLs in Pathology

Given the fact that GSLs take part in different aspects of cell biology (cell proliferation, cell-to-cell signaling, apoptosis, etc.), they are, therefore, implicated in several diseases in humans, including metabolic diseases, neurological diseases, and cancer [185]. While they have a high diversity regarding their structure, it is still a tremendously difficult task to identify the structure, functions, and distribution of GSLs in specific tissues. For this purpose, research is ongoing, and MS has proved to be an essential instrument for determining the structures of GSLs and their levels in biological samples. In terms of our focus on MALDI non-imaging MS, we will next address the findings regarding pathological human tissues (see Appendix A, Table A2). Most studies focus on neural tissue samples (human brain with various diseases), and of prime interest are gangliosides that are involved in the pathologies, but there are also a few findings in cancer research regarding aberrant levels and distribution or accumulation of GSLs.

3.5.1. GSLs in Storage Diseases

Storage diseases represent a family of inherited metabolic disorders, which are defined by the abnormal accumulation of certain substances (lipids, carbohydrates, or proteins) within cells and tissues of the body, leading to various symptoms and organ dysfunction. Regarding GSLs, there are quite a few studies that look into deciphering the mechanisms of such diseases, with the purpose of either finding new and easy ways to diagnose a disease, or finding the pathway of a possible treatment.
All GSL lysosomal storage diseases are multimorbidity diseases and the majority have a neurodegenerative clinical evolution, emphasizing the biological significance of GSLs in the brain.
Taketomi et al. [142] focused only on GM1, and how the aging process affects the long-chain base composition of GM1. Various samples of GM1 were used, specifically brain tissue samples from patients with GM1 gangliosidosis, sudanophilic leukodystrophy, infantile type GM1 gangliosidosis, Spielmeyer–Vogt type amaurotic idiocy, schizophrenia, Gaucher disease, Schilder’s disease, nuclear jaundice, and brain edema. Once again, DE MALDI MS was used, under the same conditions as mentioned before [123]. The findings are that the proportion of d18:1 decreases, d18 remains fairly constant, whereas the proportions of d20:1 and d20 increase with age. The sphingoid base composition in the GM1 adult-type gangliosidosis appeared fairly normal, similar to a normal adult human brain. Furthermore, abnormal results were determined in the samples of infantile type GM1 gangliosidosis and two samples from Spielmeyer–Vogt type amaurotic idiocy, with the latter found to be a similar long-chain base composition with the GM1 as the sample from a Gaucher disease brain tissue sample. It was theorized that the abnormal GM1 long-chain base composition in the brain tissues of early age patients may be influenced by the accumulation of GM1, whereas in the Spielmeyer–Vogt type amaurotic idiocy it may reflect an abnormal metabolism of the long-chain bases of GM1.
1.
GM1 Gangliosidosis
GM1 gangliosidosis represents a subtype of storage diseases, a class of hereditary metabolic disorders characterized by the irregular buildup of GM1 ganglioside, a specific type of GSLs. This accumulation leads to a range of symptoms and organ dysfunction as normal cellular processes are disrupted.
Sugiyama et al. [123] used a DE MALDI-TOF MS (Voyager Elite XL Biospectrometry Workstation with nitrogen laser pulsed at 337 nm wavelength) for identifying several gangliosides from pathological brain tissues (GM1 in brain tissue of GM1 gangliosidosis). Using both 2.5 DHB and α-CHCA as matrices for establishing a suitable protocol, the authors use a method of microwave-mediated saponification for the gangliosides, for preparing lysogangliosides, in order to determine the ceramide composition. Both ion modes, negative and positive, were employed. Comparing the spectra obtained with the calculated values of monoisotopic molecular ions, the results were promising, with GM1 found at m/z 1544.86 and 1572.88 (monoisotopic masses M H having (d18:1/C18:0), and (d20:1/C18:0), respectively). No loss of sialic acid was observed.
Determination of GM1 ganglioside from the cerebellum and cerebrum tissues from a patient suffering from GM1 gangliosidosis was also achieved through DE-MALDI-TOF MS (Voyager Elite XL, PerSeptive Biosystems, Framingham, MA) 337 nm laser wavelength and 2,5 DHB matrix) by Fujiwaki et al. [31]. Accumulation of GM1 and asialo GM1 was found in the samples at m/z 1517—GM1 (d18:1/C16) M H , 1545—GM1 (d18:1/C18) M H , 1277—asialo GM1 (18:1/C18) M + Na + , and 1305—asialo GM1 (d20:1/C18) M + Na + [30]. In this study, the sphingolipid fraction was prepared by homogenizing the tissue sample in chloroform/methanol (2:1). The crude lipids were obtained through ultrasonication and filtration. Folch’s partitioning with chloroform/methanol/water was utilized and the lower phase underwent mild alkali treatment to decompose glycosphingolipids, followed by acidification and extraction with hexane to obtain fatty acids and cholesterol in the upper phase and crude alkali-stable sphingolipids in the lower phase.
Sugiyama et al. [123] approached several storage disorders, with tissue samples from the liver and spleen of different autopsied patients using CHCA and DHB matrices on a DE-MALDI-TOF MS (Voyager Elite XL, Framingham, USA), in both positive and negative ion mode. The preparation of samples was made using Folch’s partitioning as previously described. Using splenic tissue as a sample from a patient with GM1 gangliosidosis, the mass spectra obtained using MALDI-TOF MS revealed peaks at m/z 1517 and 1545, which are consistent with the accumulation of GM1 in the tissue sample (GM1 (d18:1C16) M H and GM1 (d18:1C18) M H , respectively).
Collectively, these investigations underscore the critical role played by the accumulation of GM1 ganglioside in driving the pathogenesis of GM1 gangliosidosis. The perturbed buildup of GM1 ganglioside disrupts normal cellular processes, leading to the symptomatic manifestation and functional impairment observed in affected individuals. Applying techniques such as MALDI MS empowers researchers to scrutinize and quantify GM1 ganglioside levels in tissues, thereby unraveling the intricate molecular foundations of GM1 gangliosidosis and related storage disorders.
2.
Tay–Sachs disease
Tay–Sachs disease is primarily characterized by the accumulation of GM2 ganglioside in the cells, particularly nerve cells, due to a deficiency in the enzyme hexosaminidase A (Hex-A). This deficiency leads to the inability to break down GM2 ganglioside, resulting in its accumulation within lysosomes, the cell’s waste disposal organelles. As a result, the affected cells become engorged with these lipid molecules, leading to cellular dysfunction and eventually causing the symptoms associated with Tay–Sachs disease [186].
A sample of brain tissue obtained from an individual diagnosed with Tay–Sachs disease was employed for determining GM2 levels by Sugiyama et al. [151]. GM2 was found at m/z 1382.8 and 1410.8 (monoisotopic masses M H d18:1-C18:0 and d20:1-C18:0, respectively), with no sialic acid loss (both 2.5 DHB and α-CHCA were used as matrices, with good results).
Ito et al. [140] used a brain tissue sample from a Tay–Sachs diseased patient with an emphasis on the long-chain base of GM2 using a QIT (quadrupole ion trap)-TOF MS (Shimadzu, Japan), together with an AP (atmospheric pressure)–MALDI source (Mass Technologies, MD); nitrogen laser at 337 nm wavelength and Ar gas pulsed for ion cooling and CID. CHCA was used as the matrix. A comprehensive protocol is described by the authors [123]. For identifying the long-chain base composition of GM2, the authors used MS, MS2, and MS3 of m/z 1382 and 1410 M H , as identified in the sample. The precursor ion was selected at m/z 1382, and then the MS2 spectra was performed, the ceramide ion at m/z 564 ( M H NeuAc HexNAc Hex _ Hex ) was set aside for further analysis through MS3, obtaining peaks at m/z 324 (S), 308 (T), 282 (U), 263 (R), and 237 (P), which represents the ceramide with a C18:0 fatty acid and d18:1 sphingosine. Similarly, following a comparable approach, the precursor ion with m/z 1410 was chosen, and m/z 592 was selected from the MS2 spectra to undergo additional fragmentation. This resulted in significant peaks observed at m/z 324 (S), 308 (T), 291 (R), 282 (U), and 265 (P/V), representing the ceramide structure with d20:1 sphingosine and C18:0 fatty acid [125,140].
This investigation underscores the utility of AP-MALDI as a straightforward technique for accurate identification of ganglioside ceramide moieties without subjecting the samples to vacuum conditions that might impact their structural integrity. However, it is important to note that this method is suitable solely for purified samples.
3.
Spielmeyer–Vogt type amaurotic idiocy (Niemann–Pick disease type C)
Niemann–Pick disease type C (NPC) represents a recessive autosomal lipid storage disorder that encompasses a diverse range of clinical manifestations. At the cellular level, this condition is marked by the buildup of unesterified cholesterol and glycolipids within the lysosomal/late endosomal system [187].
Taketomi et al. [142] discovered that the anomalous composition of long-chain bases in GM1 within brain tissues from a patient diagnosed with Spielmeyer–Vogt type amaurotic idiocy could potentially signify an altered metabolism of GM1’s long-chain bases. Their examination of GM1 samples obtained from brain tissues of individuals across various diseases and age groups demonstrated a significant rise in the portion of d20:1 (icosasphingosine) and d20 (icosasphin-ganine) relative to the total sphingosine bases until adolescence or adulthood. Beyond this point, this proportion remained relatively stable, slightly surpassing 50%. This ratio was notably higher compared to what was observed previously in GM1 samples from adult mammalian brains (such as monkey, dog, bear, pig, and rabbit). Interestingly, the LCB composition of GM1 in two samples of Spielmeyer–Vogt type amaurotic idiocy exhibited abnormal values, despite the absence of GM1 accumulation in the brain tissue, suggesting intricate interactions between GSL metabolism and disease progression. Specifically, the LCB composition showed d18:1 at 57.8% and 54.9%, d18 at 3.1% and 2.5%, d20:1 at 37.3% and 40.3%, and d20 at 1.8% and 2.3%, respectively. The deviation in the LCB composition of GM1 suggests an altered metabolism of the long-chain bases, which can have far-reaching implications for cellular function and signaling processes.
With regard to the liver tissue sample from a patient with Spielmeyer–Vogt type amaurotic idiocy, Fujiwaki et al. [137] found no significant changes in the mass spectrum, compared to the control sample.
4.
Sudanophilic leukodistrophy
Leukodystrophies are genetic disorders affecting the central nervous system and peripheral nerves, characterized by the degeneration of myelin sheaths. The term “leukodystrophy” means deterioration of the white matter within the brain. The underlying defect in these disorders is directly linked to the maintenance and synthesis of myelin membranes. The majority of leukodystrophies manifest during childhood or adolescence, are currently incurable, and exhibit a progressive trajectory that ultimately leads to premature mortality [188].
A tissue specimen obtained from a patient diagnosed with sudanophilic leukodystrophy underwent MALDI-TOF MS analysis to determine the GM1 composition. The GM1 was isolated intact following the same procedures and sample preparation technique previously outlined by Taketomi et al. [162]. Molecular ions were identified at m/z 1545.42 for GM1 (d18:1/C18:0) [M − H] and m/z 1573.46 for GM1 (d20:0/C18:0). Additionally, GM1 (d18:0/C18:0) and (d20:0/C18:0) were also detected by evaluating the differences between calculated theoretical values and the identified values of three isotopically resolved peaks for each GM1 compound (m/z 1546.3, 1547.32, and 1548.28 for GM1 m/z 1545.32; and m/z 1574.35, 1575.4, and 1576.39 for GM1 m/z 1573.37) [162]. As a result, the composition of the long-chain base of GM1 was determined as follows: d18:1 (44.2%), d18:0 (2.3%), d20:1 (49.9%), and d20:0 (3.6%). The data revealed a typical spectrum for GM1-isolated species with a normal proportion of the sphingoid bases composition, according to a normal evolution [142], highlighting the diversity of sphingosine structures within GM1 gangliosides. This information is biologically significant because gangliosides, including GM1, are not only structural components of cell membranes but also crucial modulators of cell signaling pathways.
5.
Gaucher disease
Gaucher disease is the most widespread lysosomal storage disease found worldwide, resulting from the absence of lysosomal enzyme glucocerebrosidase (GBA, acid beta-glucosidase). The enzyme functions on the substrate glucocerebroside (constituent of cell membranes). Under normal conditions within the lysosome, the protein saposin C facilitates the presentation of glucocerebroside to GBA, thereby activating the enzyme. This particular enzyme plays a crucial role in breaking down glucosylceramide through hydrolysis into glucose and ceramide. When this enzyme is deficient, it results in an accumulation of glucosylceramide and other glycolipids within the lysosomes of macrophages. This accumulation primarily occurs in various organs such as the liver, spleen, brain, bone marrow, osteoclasts, and occasionally in the skin, lungs, conjunctivae, kidneys, and heart [189].
In the context of Gaucher disease, GSLs play a crucial role in shedding light on the underlying molecular changes associated with this disorder.
Fujiwaki et al. [137,161], using A-CHCA and DHB matrices on a DE-MALDI-TOF MS (Voyager Elite XL, PerSeptive Biosystem, Framingham, MA, USA) in positive ion mode, with the analyte prepared using Folch’s partitioning, investigated the liver of a patient suffering from Gaucher disease, and showed that monohexosylcermide levels were elevated compared with the control samples, revealed by the peaks at m/z 722—monohexosylceramide (d18:1/C16), as M + Na + , m/z 738—monohexosylceramide (d18/C17), as M + Na + , and m/z 750—monohexosylceramide (d18:1/C18), as M + Na + . The accumulation of monohexosylceramide was also revealed by the monohexosylceramide/sphyngomielin ratio, which was elevated. Taketomi et al. [135] identified alterations in the long-chain base composition within the tissue sample afflicted with Gaucher disease to be similar in composition with the tissue sample from the Niemann–Pick type C disease. This indicates that while these diseases may manifest differently, they share commonalities in the aberrations of sphingolipid metabolism.
6.
Farber disease
Farber disease (also known as Farber lipogranulomatosis) is a hereditary lysosomal storage disorder inherited in an autosomal recessive manner. It arises from a deficiency in acid ceramidase, an enzyme critical for cellular processes, resulting in distinct clinical manifestations. The clinical phenotypes associated with Farber disease vary, with children experiencing severe neurological issues often succumbing in infancy, while individuals with milder neurological involvement facing progressive joint deformation, contractures, subcutaneous nodules, periarticular granulomas, hoarse voice, and eventually respiratory insufficiency. The outcome of the disease is respiratory failure and eventual death in the third or fourth decade of life for those without severe neurological symptoms [190].
Derived from liver tissue samples of an individual with Farber disease (Voyager Elite XL (PerSeptive Biosystem, Framingham, MA, USA) DE-MALDI-TOF MS, 2.5 DHB and CHCA matrices, positive ion mode), ceramides with different fatty acid carbon numbers were identified, which were not detectable in the control samples: ceramide (d18:1/C20), as M + Na + at m/z 616, ceramide (d18:1/C21), as M + Na + at m/z 630 and ceramide (d18:1/C22), as M + Na + at m/z 644. The elevated accumulation of ceramide was further indicated by the notably high ratios of ceramide/sphingomyelin and ceramide/monohexosylceramide [137]. Fujiwaki T. et al. [137] noted the presence of abnormal ceramide accumulation and altered lipid ratios in human tissue samples from individuals with Farber disease, highlighting the crucial role of GSLs, particularly ceramides, in cellular health and function. The disruption of these lipids can contribute to the pathogenesis of the disorder and may be associated with clinical symptoms.
7.
Fabry disease
Fabry disease is an X-linked inherited lysosomal storage disorder caused by a deficiency of the enzyme α-galactosidase A, which leads to the accumulation of Gb3 in various tissues, including nerves, dorsal root ganglia, the walls of capillary vessels, renal glomerular and tubular epithelial cells, as well as cardiomyocytes. Clinically, it is characterized by chronic pain, gastrointestinal disturbances, acroparesthesia, distinctive skin lesions, progressive renal dysfunction, cardiomyopathy, and strokes [191]. Taketomi et al. [162] performed an extraction of GSLs using the method of saponification described earlier, for the purpose of examining multiple sphingolipids originating from a single sample (DE-MALDI-TOF MS, Voyager Elite XL (PerSeptive Biosystem, Framingham, MA, USA), 2,5 DHB matrix, positive ion mode). Employing the necrotic femoral head tissue from an individual affected by Fabry disease and a control subject, the mass spectra indicated an accumulation of Gb3Cer, with the highest intensity of the peaks at m/z 1130.99—Gb3Cer (d18:1/C22:0), as M + Na + , m/z 1156.98—Gb3Cer (d18:1/C24:1), as M + Na + and m/z 1159.01—Gb3Cer (d18:1/C24:0), among sphingomyelin (at m/z 703, 725, 758, 788, 810, 824, 836, 838, and 846) and GlcCer (at m/z 778, 834), which were of lower intensities. These peaks highlighted the specific molecular signatures of the disease.
The scope of the study is to prove that using MS it is possible to determine multiple GSLs from a single sample, with a quick method of sample preparation.

3.5.2. GSLs in Cancer

Cancer often displays distinctive GSL antigens that can function as adhesion molecules. These antigens interact with carbohydrate-binding proteins or corresponding carbohydrates on target cells, leading to diverse signaling events. This capability has the potential to initiate the metastatic process within cancer. Recent investigations have pinpointed specific GSL antigens that exhibit high expression in particular human cancer types. These antigens act as adhesion molecules, potentially fostering the spread of tumor cells.
GSLs, particularly gangliosides and their degradation products, are believed to regulate cell growth by modulating essential molecules involved in signal transduction. Furthermore, GSLs play pivotal roles in upholding plasma membrane stability, governing various cellular processes such as adhesion, proliferation, apoptosis, and recognition. It is essential to recognize that various cells and tissues showcase differing GSL expression patterns. Structural modifications in GSL glycan components have also been observed during the progression of numerous human cancer forms [42,192,193,194,195,196,197].
Deviant expression of distinct GSLs and associated enzymes strongly correlates with tumor inception and the transformation into malignancy across numerous human cancer types [198,199,200,201,202,203,204]. However, the precise connections between the expression of diverse GSL species and the development of distinct cancer varieties remain incompletely understood. Furthermore, the molecular mechanisms through which GSLs influence cancer formation and advancement necessitate further clarification.
Recent years have witnessed notable strides in utilizing GSLs as focal points for cancer immunotherapy and diagnostic approaches, considering the intricate and multifaceted contributions of GSLs to cancer evolution [85,205,206,207]. The continuous evolution in glycobiology, including advancements in MS technology and the emergence of novel concepts and techniques, presents a promising avenue for deepening our comprehension of how GSLs influence the advancement of cancer. These strides create prospects for pioneering clinical utilities, delving into the untapped realm of cancer therapies built upon the abnormal expression of GSLs.
Additional investigation is essential to comprehensively unravel the intricate connections between GSL expression and the progression of cancer. Likewise, there is a need to elucidate the underlying molecular mechanisms, which in turn will lay the groundwork for the development of more potent strategies for combating cancer.
1.
Colon tumors
Holst et al. [135] performed a study to determine glycosylation profiles of colorectal tumors in comparison to normal colorectal tissue, using MALDI-TOF (/TOF) MS. In order to increase the power of the study, paired samples were used containing normal and cancerous tissues from the same patient. Briefly, normal and cancerous tissue samples of 13 patients were used for isolating glycolipids (methanol/chloroform/water extraction); afterwards the GSLs from the upper phase were purified by reversed-phase solid-phase extraction (using C18-RP cartridges) and GSL-glycan release was performed using rEGCase II. The glycans were labeled using AA (2-aminobenzoic acid) for facilitating detection in negative mode of neutral and negatively charged glycans, and after further purification by HILIC-SPE (hydrophilic interaction liquid chromatography solid-phase extraction), were applied to a stainless steel MALDI plate with DHB as a matrix. After statistical data processing, the authors discovered several significant changes. A general decrease in globo-series GSLs (Hex5HexNAc2NeuAc2dHex1-AA at m/z 2082.70, as M     H ) and acetylation (Ac1Hex5HexNAc2NeuAc2dHex1-AA at m/z 2036.72, as M     H ). Interestingly, the globo-series GSLs were obtained by treating the GSLs with rEGCase II. The glycan Hex4HexNac3NeuAc1dHex1-AA (at m/z 1832.63, as M H ), which is statistically a potent discriminator, was found to be diminished in tumor tissue relative to healthy tissues. A decrease in sulfated species and disialyl glycans was also noted. While several gangliosides were identified in the tumor tissue (including GM1, GD2, GD1, as well as mono- and disialylated gangliosides comprising up to eight monosaccharides, alongside their fucosylated variants), only GD3 was considered a strong discriminator after data processing. The GSL glycan Hex6HexNAc4NeuAc1dHex3-AA at m/z 2651.89, as M H , was increased in tumor tissue, and a general increase in fucosylation was noted in the diseased tissues. At m/z 1833.70, as M H , the fucosylated species Hex4HexNAc3dHex3-AA was considered a strong discriminator. Overall, the main changes were found to be the increase in fucosylated species (observation in accordance with previous studies on alterations in cancer glycosylation [208], along with the decrease in sulfated, acetylated (which may enhance cell migration by decreased cell contact inhibition [209]), globo-type and disialyl groups of GSLs, some GSLs even resampled sialyl Lewis X and sialyl Lewis A antigens.
While the disialyl Lewis A epitope has been identified as a minor component in colon adenocarcinoma [68], the study of Holst et al. [135] reports the loss of disialylation, probably due to a reduced activity of sialyltransferase ST6GalNAcVI [70] resulting in the accumulation of sialyl Lewis X- and sialyl Lewis A-type glycans, which increases cell adhesion to the vascular endothelium through E-selectin and is associated with metastasis, recurrence, and reduced survival in patients suffering from colorectal cancer [210,211,212,213,214].
Whereas some studies reported increased expression of Gb3 metastatic colorectal tumors in the vascular surrounding of the tumors as having probably a pro-angiogenic role and being associated with increased invasiveness of the tumors [48]. The MS profiling data of Holst et al. [135] did not detect Gb3, but did detect it using MS/MS. Remarkably, globo-series GSL-glycans were decreased in the tumor sample, an observation which was reported to date only by Hakomori et al. [215] for Gb4, Gb5, and longer neutral GSLs.
2.
Brain tumors
There are a few studies on human brain tumor tissue samples. Sugiyama et al. [123] used a DE MALDI-TOF MS (Voyager Elite XL Biospectrometry, PerSeptive Biosystems, Framingham, MA, USA) Workstation with nitrogen laser pulsed at 337 nm wavelength, and 2,5 DHB as a matrix, in negative ion mode) for identifying several gangliosides from human brain tumor tissue samples. The analysis of the MS spectra revealed the existence of GM3 at m/z 1179.65, 1151.61, 1235.74, 1261.74, and 1263.74 (identified as M H ) with the ceramide composition (d18:1/C18:0), (d18:1/C16:0), (d18:1/C22:0), (d18:1/C24:1), and (d18:1/C24:0). GD3 had a high-amplitude peak at m/z 1452.85 (identified as M H H 2 O   ) and the ceramide composition (d18:1/C18:0), as well as five minor peaks for m/z 1424.8, 1480.88, 1508.9, 1534.92, and 1536.95 (identified as M H H 2 O ) and the ceramide composition (d:18:1/C16:0), (d18:1/C20:0), (d18:1/C22:0), (d18:1/C24:1), and (d18:1/C24:0), as well as two minor peaks at m/z 1492.85 (identified as M H H 2 O COO ) and Cer (d18:1/C24:0), and m/z 1470.88, identified as M H , with Cer (d18:1/C18:0). The 2.5 DHB matrix was used with good results. Some degree of sialic acid loss was observed in the case of GM3. To mitigate sialic acid loss from GM3, the ganglioside was methyl esterified using methyl iodide [123].
Taketomi et al. [163] investigated GM3 from a human brain tumor tissue sample and prepared a lyso-derivative. MS analysis was performed using DE-MALDI-TOF MS (Voyager Elite XL, Biospectrometry, PerSeptive Biosystems, Framingham, MA, USA), 2,5 DHB matrix, using positive ion mode), and the major ion peaks at m/z 871.78 and m/z 899/79 were identified as lysoGM3 (d18:1), M 1 H CH 3 CO , and lysoGM3 (d20:1) M 2 H CH 3 CO . The GM3 long-chain base composition was calculated as follows: d18:1 (77.4%), d18:0 (1.9%), d20:1 (20.5%), and d20:0 (0.2%).
Serb et al. [216] analyzed a brain tumor sample (secondary brain tumor, originating in a non-small-cell lung carcinoma (NSCLC)) using MALDI—TOF MS, using a Bruker ultrafleXtreme apparatus and 2.5 DHB as a matrix, in negative ion mode.
To separate the raw mixture of acidic GSLs from the brain tumor tissue, sequential extraction and purification procedures were performed [216]. TLC was used for separation control. The solvent was eliminated using nitrogen entrainment, and the resulting raw GSL mixture was dried in a desiccator with the aid of P2O5. A methanolic solution was used to dilute the native GSL mixture, to be further analyzed using MS.
The GSL composition was characterized by the presence of glucocerebrosides and galactocerebrosides (at m/z 714.123, m/z 730.094, m/z 744.093, m/z 766.078, m/z 792.620, m/z 806.184, m/z 864.709, m/z 953.470), LacCer (at m/z 864.709, m/z 886.630, m/z 914.250, and m/z 974.073), and other hexosylCer (at m/z 1631.857—which were attributed to type I A antigen or/and type II A antigen). Additionally, asialylated gangliosides (GA2-type found at m/z 1007.031, m/z 1077.730, and m/z 1108.151) and sulfatides (found at m/z 766.078 and m/z 974.073) were detected. Neutral GSLs belonging to the lacto-, neolacto-, globo-, and isoglobo-series were identified at m/z 1591.939 and m/z 1631.857. The gangliosides present included GM4, GM3, GM2, and GM1 (monosialylated), GD1, GD2, and GD3 (disialylated), and GT3 (trisialylated) structures, of which GD2 and GD3 are linked to metastasis. Unusual KDN and Neu5Gc acids were observed to be present in GSL species KDN-GM1 (t16:1/12:0) and GalNAc β 1–4 (NeuGc α 2–3) Gal β 1–4 Glc β-Cer (d18:1/20:0), respectively. These structures have been detected as [M − H] ions in the MS1 spectrum at m/z 1407.710 and m/z 1426.274, respectively. Additionally, KDN was identified in another GSL species, namely, KDN α 2–3 Gal β 1–4 (Fuc α 1–3) GlcNAc β 1–3 Gal β 1–4 Glc β-Cer (d18:1/26:1), observed at m/z 1759.163. The GSL species detected at m/z 2286.826 as a minor peak has been identified as carbohydrate ligands of selectins, specifically sLea-x and sLea-Lex, with the following structure: Hex(4)-HexNAc(2)-Fuc(2)-NeuAc-Cer 42:1; O2. These specific antigens are usually not present in noncancerous tissue. In addition to the monosialyl Lewis antigens, another GSL exhibiting properties of a tumor-associated antigen, disialyl Lea, was identified at m/z 2092.106.
To investigate the structure of the unusual GSL species carrying the KDN residue, the precursor ion [M − H+] at m/z 1407.710, was further subjected to tandem MS in “LIFT” mode and the obtained fragmentation ions have fully documented the presence of the KDN-GM species with Cer (t16:1/12:0): the ion observed at m/z 1363.722 is a consequence of the decarboxylation of KDN, which is linked to the inner Gal residue; the presence of the potassiated KDN residue is confirmed by the ion at m/z 249.061, referred to as B1β. Additionally, the ions at m/z 1227.648 and m/z 1245.659, labeled as Z3α and Y3α, respectively, correspond to the KDN-GM1 (t16:1/12:0) species after the elimination of the external Gal residue. Although the theoretical possibility of attaching the KDN residue to GalNAc rather than the inner Gal exists in GSLs belonging to the globo-series, specifically disialyl-Gb5 type ((SA)Gal-(SA)GalNAc-Gal-Gal-GlcCer), the probability of the existence of such a structure appears highly unlikely. This holds true even in cases where a potential single cleavage of the terminal sialic acid residue occurs, either on its own or accompanied by the cleavage of the outer Gal molecule. This is attributed to the longer oligosaccharide chain characteristic of the globo-series, with the typical Di-Gal core linked to GlcCer, resulting in higher m/z ratios for the fragments compared to those observed in the acquired MS/MS spectrum [216].
The complete understanding of the molecular mechanisms involving KDN in tumor development and progression remains a subject of ongoing exploration. Further research is warranted to gain deeper insights into the role of abnormal GSL structures and the modified GSL profile in various types of cancers. As of the current date, KDN structures have only been identified in select human tissues, notably in ovarian adenocarcinomas, where increased KDN expression was observed and positively correlated with the malignancy level [97,99]. Similarly, prostate cancers exhibited elevated levels of free KDN-containing complex-type N-glycans [217], while throat cancers with no lymphatic metastasis and moderate differentiation displayed heightened free KDN levels relative to free Neu5Ac and Neu5GC [217,218], Furthermore, in lung carcinomas and derived cell lines, the presence of oligo/poly(α 2,8-KDN) indicated its potential as an oncodevelopmental marker [97]. Consequently, the GSL profile of brain metastasis originating from NSCLC-type tumors displayed: distinct acidic gangliosides such as GD2 and GD3, which have been previously linked to the development of metastasis [198,219,220], GSLs containing unusual KDN and NeuGc, acids, which are rarely present in humans but evidenced in some human tumors (KDN levels were shown to be increased under hypoxic conditions in mammalian tumor cells, and this probably favors the hypoxia-resistance property in tumors [221]), the occurrence of Neu5Gc sialoconjugates (which is thought to be attributed to the incorporation of Neu5Gc in the plasma membrane as a result of the exposure to foods containing Neu5Gc, generating anti-Neu5Gc antibodies and xenosialitis, with possible important implications in tumor initiation and progression [222]), the altered carbohydrate ligands of selectin sialyl Lewis A and X (probably correlated with an upregulation of fucosyltransferases FUT3 and FUT6)which play a major role in the selectin-mediated adhesion of tumor cells to vascular endothelium, the initial step of hematogenous metastasis [88,223,224,225], alongside enhanced expression of cerebrosides. Additional research is required to achieve a comprehensive understanding of how GSLs contribute to maintaining the pro-cancer phenotype and the underlying mechanisms at play. Although the study is somewhat limited due to the small sample size, the preliminary results obtained highlight the intricate nature of GSL modifications in cancer and can be continued on larger groups of samples and samples of different metastasis origins to elucidate the function of GSLs in malignant transformation and their involvement in the formation of brain metastases.

3.5.3. GSLs in Neurodegenerative Diseases

The roles of GSLs in neurodegenerative diseases are complex and multifaceted. GSLs are prevalent within the nervous system and play integral roles in numerous processes including neuronal development, synaptic function, and myelination [159]. The supposition was that GSLs may contribute to the formation of protein aggregates, which represent the hallmark of neurodegenerative disease. In pathologies such as Alzheimer’s disease (AD), GSLs have been shown to interact with beta amyloid (a protein that forms the characteristic plaques in brain tissue of patients with AD) [157]. GSLs may also be complicit in neuroinflammation, a commonly present feature of neurodegenerative diseases. They are also involved in the loss of neuronal function and cell apoptosis that occurs in neurodegenerative diseases [226].
Additional research is necessary to comprehensively grasp the involvement of GSLs in these conditions.
Focusing on AD, with a technique mentioned previously (TLC- Blot- MALDI-TOF MS on a AXIMA-QIT-TOF MS, with nitrogen laser pulsed at 337 nm and 2.5 DHB as a matrix, in negative ion mode), Taki T. [158] analyzed samples from human brain tissues with a control, Parkinson’s disease (PD), and AD as points of interest, using gray matter from the hippocampus areas. The author found that GM1 was the main peak in each sample (at m/z 1572 and m/z 1544), but while m/z 1572 (d20:1) was predominant in the control and PD samples, the situation was reversed in the AD sample, with m/z 1544 (d18:1) being the most predominant peak. The trend of elevated levels of molecular species containing sphingosine d18:1 in the samples from AD was also noted in the mass spectra of GD1a (m/z 1885 (d20:1), m/z 1857 (d18:1)), GD1b (m/z 1855 (d20:1), m/z 1857(d18:1)), and GT1b (m/z 2198 (d20:1), m/z 2170 (d18:1)), compared to the control samples and the PD samples, where d20:1 was of higher intensity. The authors note that AD should be viewed as a metabolic disease of ganglioside molecules [158].
The increase in molecular species containing sphingosine, d18:1, was found in other studies also [227,228,229].
The total levels of gangliosides were specifically low in the frontal cortex of the AD samples, with GM1 having significantly low levels in the brain tissue samples. While the MS successfully identified GM3, GA1, GM2, GM1, GD1a/GD1b-lactone, GD1a, and GT1a/GT1b-lactone, only with the ganglioside GM1 did the authors find significant differences, while GD1a/GD1-lactone also appeared to be present in smaller amounts. It should be mentioned that GD1b-lactone is not an artifact, but an authentic product of brain metabolism. The levels of b-series gangliosides, GD1b and GT1b in the gray matter of the hippocampi of patients with AD were found to be depressed.
However, the total serum levels of gangliosides appeared to be normal compared to the control group, with elevated levels observed in AD patients for GM3 and GM2.
Accumulating evidence, both in vivo and in vitro, indicates that the binding of Aβ to gangliosides in membranes, especially monosialoganglioside GM1, plays an important role in the aggregation of Aβ [230,231,232,233,234,235,236].
It has been reported that Aβ (1–40) and Aβ (1–42) bind to the sugar moiety of GM1 (the sialic acid group is essential for this interaction) and forms a string-like GM1 cluster induced by endosomal dysfunction or alterations in lipid metabolism (e.g., increase in cholesterol related to apoE4 allele). This results in the formation of an α-helix-rich structure which will be further converted to preamyloid β-sheet-rich nontoxic oligomers (containing 15 Aβ molecules). An additional increase in the Aβ density leads to the formation of toxic “amyloid tape” fibrils containing parallel and antiparallel β-sheet structures, which will activate apoptosis via intricate signaling cascades [237,238].
Based on these findings, relevant therapeutic approaches have been developed, e.g., the inhibition of GM1-mediated Aβ aggregation with small compounds [239], prevention of apoptosis, and the administration of GM1 in order to sequester Aβ and to protect neurons from Aβ-induced adverse effects [240,241,242].
Moreover, the accumulation of Aβ amyloid in the brain and circulation may influences the pattern of glycosylation and glycan expression regulation, as detailed by Gizaw et al. [134]. These are consequences of increased levels of receptors for the advanced glycation end products (RAGE) at the blood–brain barriers as well as increased levels of low-density lipoprotein-receptor-related protein-1 (LRP1) at the blood–brain barrier together with reduced peripheral binding of Aβ by the soluble form of LRP1 [243]. Aberrant or failure of Aβ glycosylation can lead to an elevation in serum of AD patients of N-glycans with proximal fucose, bisecting-GlcNAc, tri- and tetra-antennary types, GM3, GM2, etc.
While no detailed data regarding the MS analysis of molecular ions are given, the novel technique of glycome analysis using glycoblotting presented above shows great promise, with samples such as serum, or even CSF that can be obtained from living patients, opening new horizons towards the diagnosis or therapeutic targets of patients with AD.
Comparatively with AD, PD and Huntington diseases are characterized by a systemic deficiency of GM1 in brain and all peripheral tissues and GM1 replacement could be a promising therapy in these neurodegenerative disorders [244].

3.6. MALDI Non-Imaging MS Analysis of GSLs in Various Cell Cultures

Cell cultures are widely used in research. Cell lines are easily accessible and can be obtained from cell banks or commercial suppliers, being readily available for use, providing a homogeneous population of cells with the same genetic and phenotypic characteristics. Given the fact that cell lines are clonal populations, they can be propagated and maintained under controlled conditions, providing consistent and reproducible results for experiments. Another reason for using cell lines or cell cultures is of an ethical nature, providing an alternative for human tissue samples, which require numerous approvals for use in research. The research of GSLs using MALDI MS has been made in the field of cell cultures and cell lines, mostly in various areas of cancer research (see Appendix A, Table A3).

3.6.1. GSLs in Breast Cancer Cell Lines

Breast cancer is a type of cancer that originates in the breast tissue, typically in the ducts or lobules. It represents the most frequent form of cancer among women internationally, and although it can also affect men, it is a rare finding among men [245]. Currently, intense research is taking place to find means of prevention, diagnosis, and treatment for breast cancer, and the discovery of the molecular pathways involved in its development is a crucial step in this direction. GSLs, with the previously mentioned properties, have been shown to contribute to immune evasion (GSLs are thought to suppress immune responses and promote tumor immune escape) [32,246,247,248,249] and to tumor progression (tumor growth and tumor metastasis) and may interfere with drug resistance (chemoresistance) of certain tumor types. The particular expression of certain GSLs has been shown to be associated with breast cancer diagnosis and with its prognosis [83,248,249,250,251,252,253,254,255,256,257,258,259,260,261,262,263,264]. The use of MALDI MS is crucial for identifying a specific GSL profile for each type and subtype of cancer, and a tremendous amount of further work is needed for the correct and detailed identification of GSLs, in the hope of finding new options for diagnosing and treating this disease.
Cavdarli et al. [265] performed an analysis of GSLs expressed by neuroectoderm-derived cell lines, to determine the pattern of O-acetylated native ganglioside species, considering that previous studies [50,260,266,267,268] have shown that in neuroectodermal-derived cancer cells, ganglioside GD2 and GD3 overexpression participates in tumor aggressiveness. Whereas there exists limited knowledge regarding O-acetylation mechanisms, in cancer research, gangliosides (specifically GD3 and GD2) are believed to be tumor-associated carbohydrate antigens (TACA), and the O-acetylated form of GD2 (O-Ac-GD2) has been found to be exclusively related to cancer cells and tissues. For this research, the authors used commercially available cell lines for breast cancer: Hs587T, SUM159PT, MDA-MB-231, and MCF7, and breast cancer cell lines overexpressing GD3 synthase. The cell lines were cultured, and for an MS analysis they were extracted and purified with methods designed to preserve the O-acetylation of the GSLs. The separated acidic GSL fraction was analyzed on an MALDI-QIT_TOF (Shimadzu AXIMA Resonance) MS, using THAP as a matrix solution, containing 0.1 M hydrated di-ammonium hydrogen citrate mixture (2/1; v/v), in negative ion mode.
The mass spectra for the Hs587T cell line showed the presence of GM3 (at m/z 1263.8, d18:1, C24:0), GM2 (at m/z 1354.8 d18:1, C16:0; m/z 1438.9, d18:1, C22:0, and m/z 1466.9, d18:1, C24:0), GM1 (at m/z 1516.8, d18:1, C16:0; m/z 1629.0, d18:1, C24:0), OAc-GM1 (at m/z 1671, d18:1, C24:0), OAc-GD2 (at m/z 1670, d18:1, C16:0 M 2 H 2 O H ), and traces of GD2, OAc-GD3, and OAc-GT3. For the MDA-MB-231 cell line (GD3S+ clone #4), the results showed a similar pattern of gangliosides, but for the O-acetylated species, a cell-dependent pattern was observed, with OAc-GD3 (at m/z 1438.8, with Cer (d18:1/14:0)), OAc-GD2 (at m/z 1782 with Cer (d18:1/24:0)) and OAc-GT3 (at m/z 1852.0, with Cer (d18:1/24:0)), identified as the main O-acetylated ganglioside species as dehydrated negative ions.
After performing MALDI MS on all the cultured cell lines, it was found that all the cell lines express GM1, GM2, GM3, and GD2. GD3, GT3, and GT2 were expressed only in the MDA-MB-231 GD3S+ clones, with GD3 synthase overexpression being associated with a dramatic change in ganglioside composition towards b- and c-series gangliosides [204].
For the O-acetylated ganglioside species, OAc-GD2 was found in the Hs587T and SUM159PT cell lines, OAc-GD3 in Hs 587T, SUM159PT and MDA-MB-231 GD3S+ clone cell lines and OAc-GT3 and OAc-GT2 were expressed in the MDA-MB-231 GD3 synthase overexpressing clones. It was found that the highest amount of O-acetylated gangliosides corresponded to overexpressing GD3 synthase clones, in a cell-dependent manner (by integrating the intensity of individual signals detected on MALDI-QIT-TOF): 50% in MDA-MB-231 GD3S+ clone#11, 22% in MCF-7 GD3S+, and 18% in MDA-MB-231 GD3S+ clone#4. Furthermore, it was found that overall, OAc-GD3 was the most expressed ganglioside species, followed by OAc-GD2 and OAc-GT3.
Cavdarli et al. [267] emphasized the importance of ganglioside diversity and the presence of O-acetylated gangliosides in breast cancer, and also the importance of considering O-acetylated gangliosides as a possible target for developing new specific therapies for the disease. While the findings show promise, additional studies are required to unravel the intricate pattern of ganglioside expression in breast cancer.
Using a TOF/TOF 5800 MALDI System (Sciex, Vaughan, Canada), and DHB as a matrix for MALDI MS, in positive ion mode, Liang et al. [257] determined if several breast cancer cell line subtypes (MDA-MB-231, MDA-MB-468, and MCF7) with or without GD3-synthase expression exhibited distinct profiles for GD2 or GD3 expression. The GSLs were extracted by successive sonication steps in solvents (chloroform/methanol, isopropanol/hexane/water) and Folch’s partitioning, with the upper phases collected, combined, evaporated, and solubilized in water and applied to a Sep-Pak C18 cartridge, then analyzed via HPTLC. For MALDI profiling, the extracted GSLs were permethylated and dissolved in acetonitrile solution, then applied to the 2,5 DHB matrix. In the MDA-MB-231 cell line, the major GSLs were GM1, GM2, and GM3 (a-series gangliosides), while b-series gangliosides (GD1, GD3) and globo-series GSLs (Gb4, MSGb4 (monosialoGb5), DSGb5 (disialoGb5)) were detected at low levels. In parallel, GSLs from RFP (red fluorescent protein) mock-transfected cells and GD3-synthase-overexpressing cells were also analyzed, with MALDI MS confirming that GD3S overexpression resulted in the upregulation of GD2 (9.8% in the wild-type MDA-MB-231 cell line, 14.7% in RFP cells, and 60.2% in the GD3S+ cell line) and GD3 (7.7% in wild-type MDA-MB-231 cell line, 6.8% in RFP cells, and 25.8% in GD3S+ cell lines) and downregulation of GM3, GM2, GM1, GD1, and Gb4/(n)Lc4.
For the MDA-MB-468 cell line, following the same protocol, it was found that the main GSLs expressed were GM1 and GD3, with low levels of GM3, GT3, GD1, and Fucosyl-Lc4 detected. While targeting the GD3S+ cell lines again, there was no significant difference in GD2 determination, and only GD3 was found to be upregulated (from 77.4% in the wild-type MDA-MB-468 cell line, and 70.2% in the RFP control line, to 87.2% in the GD3S+ cell line), and also an increase in GT3 and GD1 ganglioside levels.
In MCF7 cells, GM2 was the only highly expressed GSL in the wild-type population of cells, and Gb4, Gb5, globo-H (neutral GSLs) and GM3, MSGb5, and DSGb5 (sialylated GSLs) were also detected. For the GD3S+ variant of these cells, an upregulation of GD2 was observed (from 0.9% in wild-type cells MCF7 and 1.1% in RFP control cells, to 57.3% in GD3S+ cells), and only a minor increase in GD3 (from 0.7% in wild-type MCF7 cells and 0.8% in RFP control cells, to 3.7% in GD3S+ cells). Furthermore, an increase in GD1 was noted, along with various globo- and lacto-series GSLs: Gb4/(n)Lc4, Gb5, globo-H, MSGb5, DSGb5.
The results obtained by Liang et al. [257] confirm that GSL expression in cell lines expressed in breast cancer is cell-type dependent, with a complex and intricate pattern for each cell line studied. Examining GD3-synthase-overexpressing cells, it was noted that GD2/GD3 GSLs constitutes a vital element that maintains the stem cell phenotype of breast cancer cells and amplifies the migration, adhesion, and clonogenic potential of malignant cells, thus being an important target for a possible therapy.
Using a 4800 Proteomics Analyzer (Applied Biosystems, Foster City, CA, USA) in positive reflectron mode, and with 2.5 DHB as a matrix, Dewald et al. [269] determined the GSL composition of three breast cancer cell lines: Hs578T, MCF-7, and MDA-MB-231. Prior to MS analysis, after multiple steps of extraction and purification [44], the separated GSLs were permethylated by incubating them for 2 h in a suspension that contained sodium hydroxide, dimethyl sulfoxide, and methyl iodide, extracted in methanol, and then washed with water. After the reagents evaporated, the samples were diluted in chloroform and applied to a 2.5 DHB matrix.
For the MCF-7 cell line, the main ganglioside expressed was GM1a, confirmed by MS/MS (at m/z 1933.2, with Cer (d18:1/24:0) and at m/z 1821.1 with Cer (d18:1/16:0), followed by GM2 (at m/z 1729.1 with Cer (d18:1/24:0) and m/z 1617.0 with Cer (d18:1/16:0)), and GM3 (at m/z 1484.0 with Cer (d18:1/C24:0) and m/z 1371.9 with Cer (d18:1/16:0)). In addition, there were two peaks at m/z 2182.3 with Cer (d18:1/16:0) and m/z 2294.4 with Cer (d18:1/24:0), identified as GD1a and GD1b mixtures (in a proportion of 90% GD1a and 10% GD1b). Globo-series Gb4 was also identified at m/z 1572.0 (d18:1/C24:0) and at m/z 1459.9, having Cer (d18:1/16:0).
The HS578T cell line expressed GM2 as the main ganglioside, according to the ion abundance observed in the mass spectra (at m/z 1729.1 with Cer (d18:1/24:0) and m/z 1617.0 with Cer (d18:1/16:0)), followed by GM1b (at m/z 1933.2 with Cer (d18:1/24:0))—confirmed by MS/MS fragmentation. GM3 was also identified at m/z 1371.9, having Cer (d18:1/C16:0) and m/z 1484.0 with Cer (d18:1/24:0) but in lower abundance, and GD2 was identified at m/z 2090.3 and Cer (d18:1/24:0). A low amount of GA2 was detected at m/z 1367.9, having Cer (d18:1/24:0) and m/z 1255.8 with Cer (d18:1/16:0), and Gb4 was present in a trace amount, almost absent.
The MDA-MB-231 cell line expressed a large variety of GSLs, the main ganglioside detected being GM1b, confirmed by MS/MS fragmentation (at m/z 1933.3 with Cer (d18:1/24:0) and at m/z 1821.1, Cer (d18:1/16:0)), followed by GM3, (at m/z 1484.0, Cer (d18:1/24:0) and m/z 1371.9 Cer (d18:1/16:0)), and GM2 (at m/z 1729.1, Cer (d18:1/24:0)). A mixture of GD1a (40%) and GD1c (60%) was determined from the peaks corresponding to m/z 2182.3, Cer (d18:1/16:0) and m/z 2294.4, Cer (d18:1/16:0). Globo-series GSLs were also detected at m/z 1460.0 (Gb4, and Cer (d18:1/16:0)), m/z 1572.1 (Gb4, and Cer (d18:1/24:0)), m/z 1326.9 (Gb3, and Cer (d18:1/24:0)), and m/z 1214.8 (Gb3, and Cer (d18:1/16:0)), as well as LacCer at m/z 1010.75 and m/z 1122.88.
The studies performed with MALDI MS on breast cancer cell cultures indicate that there is a large variety of GSLs expressed by the cell lines, but also the fact that the GSLs expressed are highly specific to a certain type of cell.
All investigated wild-type breast cancer cell lines expressed a-series gangliosides GM1, GM2, and GM3 (except for SUM159PT, MCF-7, and MDA-MB-468), while b-series gangliosides were limited to Hs587T, SUM159PT, and MDA-MB-231 in low amounts (GD2) and to MDA-MB-468 (GD3), and c-series gangliosides were absent. O-acetylated gangliosides (OAc-GD3 and OAc-GD2) were present only in Hs587T and SUM159PT cell lines. Overexpression of GD3 synthase showed to increase the expression of b-series gangliosides (GD2 in MCF-7 GD3S+ and in MDA-MB-231 GD3S+, while GD3 in MDA-MB-231 GD3S+, MDA-MB-468 GD3S+ and MCF-7 GD3S+), of c-series gangliosides (GT2 and GT3 in MDA-MB-231 GD3S+ and MDA-MB-468 GD3S+), and of O-acetylated gangliosides (OAc-GD3, OAc-GD2, OAc-GT3, and OAc-GT2 in MDA-MB-231 GD3S+, together with OAc-GD2 and OAc-GT3 in MCF-7 GD3S+).
B-series gangliosides GD3 and GD2 have been described as tumor-associated carbohydrate antigens (TACA) in neuroectoderm-derived tumors, as well as in breast cancer [270]. GD3 synthase is considered the rate-limiting enzyme of GD2 biosynthesis in breast cancer stem cells that have undergone epithelial-to-mesenchymal transition, where GD2 is considered responsible for cancer cell stemness and metastatic properties [255,271] and, thus, GD3 synthase could be the target for many cancer therapeutic approaches.
O-Ac modification of the sialic acid residues is one of the most common alterations of gangliosides and can result in modifications of pathophysiological properties yielded by the non-O-Ac-modified gangliosides: e.g., the change of GD3 to O-Ac-GD3 transfers GD3 from the mitochondria to the cell membrane, thus suppressing the apoptotic effect of GD3 in tumor cells [254,272,273,274].
As O-Ac alteration of GD2 and GD3 species confers pro-growth properties on tumor cells in which they are expressed [254,260,267,272,275], targeting these acetylated forms seems to be a better therapeutic option comparatively to their non-O-acetylated forms, especially since O-Ac GD 2 was found to be expressed only in tumor tissue [270].
The studies highlighted that GSL expression is cell-type dependent, resulting in intricate patterns unique to each line. Their findings underscored the role of GD2/GD3 GSLs, of GD3 expression, as well as of gangliosides O-Ac alterations in sustaining the stem cell phenotype of breast cancer cells, influencing migration, adhesion, and clonogenic growth—qualities that present potential therapeutic targets.
Further studies are needed to confirm the specificity and to isolate a specific GSL that can represent a possible target treatment for one of the many breast cancer subtypes.

3.6.2. GSLs in Melanoma and Neuroblastoma Cell Lines

Neuroblastoma and melanoma are two types of cancers arising from the neural crest cells, which give rise to the peripheral nervous system and melanocytes. Several studies have shown that the expression and composition of GSLs are altered in neuroblastoma and melanoma cells and that these changes may contribute to the development and progression of these cancers [163,276].
GSLs are naturally present in neural tissues, and the identification of a specific pattern of GSLs composition associated with a malignant or aberrant evolution of these tissues can be a provoking challenge. MALDI MS is one of the tools used to elucidate the exact composition of such GSLs with good accuracy.
Cavdarli et al. [265] performed MALDI MS on an MALDI-QIT-TOF (Shimadzu AXIMA Resonance) mass spectrometer, using THAP as a matrix solution, in negative ion mode.
The focus of the study was on detecting native O-acetylated ganglioside species (their proportion calculated by the authors by integrating the intensity of individual signals on the mass spectra, was 10% in the LAN1 cell line, and 12% in the SKMel28 cell line), with the GSL profiles in both cell lines being complex and varied. In melanoma (SKMel28), various GSL species were identified, such as GM3, GM2, GM1, GD3, and GD2, but of important significance, native O-acetylated GD3 (OAc-GD3) was found. This is intriguing as O-acetylated gangliosides are often associated with malignancy, suggesting a potential role in the aggressive behavior of melanoma cells. The SKMel28 cell line exhibited a prevalence of GM3 and GD3 species.
For the neuroblastoma cell line, LAN1, GM3, GM2, GM1, GD3, GD2, and LacNAcGM1 were identified. Interestingly, O-acetylated GD2 (OAc-GD2) was detected, indicating its potential involvement in neuroblastoma development. The specific GSL expression pattern differed from that of melanoma, emphasizing the cell-type-dependent nature of GSL expression in cancer.
While these findings are promising and suggest the potential significance of O-acetylated gangliosides as tumor-specific antigens, further research is essential to validate their specificity across a broader range of tumor types.

3.6.3. GSLs in Hepatic Cancer Cell Lines

Directing attention toward the examination of GSL-glycans, a study investigated samples extracted from hepatic cancer cell lines (HCC) MHCC97L, MHCC97H, and HCCLM3, along with a normal human liver cell line, HL-7702. Du et al. [121] used lectin microarrays (not detailed) and supplementary data from MS analysis using a Bruker Daltonics ultrafleXtreme MALDI-TOF/TOF (Bruker Daltonics, Bremen, Germany) and 2.5 DHB as the matrix, in positive ion mode. The GSLs from the cultured cells were extracted using chloroform/methanol in three stages, and then NaClO was added for oxidative release of the GSL-glycans. Afterward, the GSLs were purified using Sep-Pak C18 cartridges and subjected to MS performed in positive ion mode.
The analysis of the mass spectra revealed the presence of specific glycan structures in different cell lines (Table 4).
The presence of fucosylation as a modification of glycans present in the samples was determined by MALDI-TOF/TOF performed on different precursor ions.
Thus, by comparing the glycans from hepatocarcinoma cell lines with a normal liver cell line, Du et al. found significantly different signals which indicate upregulations of corresponding glycopatterns such as α1 − 2 fucosylation and α2 − 3 sialylation of GSLs in HCC compared to normal controls [129]. The significant abundance of GSLs with α1 − 2 fucosylation in all HCC indicates that the metastasis ability of HCC cells rises with this modification, which is in accordance with many reports which showed that glycan fucosylation is one of the numerous biological phenomena during tumor development, having a tumor-promoting effect in ovarian, prostate, breast, bladder, and epidermoid tumors and being a target in cancer diagnosis and therapy [277,278,279,280,281,282].
In contrast, other data showed a tumor suppressive effect of α1- 2 fucosylation in hepatocellular carcinoma [283,284].
Moreover, the MS data of Du et al. [129] showed during the development of HCC an upregulation of GM1- and GM2-type gangliosides containing Siaα2 − 3Gal, and of globo-series GSLs also, which were previously reported for breast cancer [197,285].
The particular expression of GSL-glycans in all cell lines and in different categories of HCC suggests their potential roles in cancer development, metastasis, and as possible diagnostic or therapeutic targets. While MS analysis revealed the presence of multiple glycan structures common to all cell lines, suggesting fundamental roles in cellular processes; specific glycan structures were exclusively found in the hepatocarcinoma cell lines (MHCC97L, MHCC97H, and HCCLM3), indicating a potential link between these unique glycan structures and the malignancy of hepatic cancer cells, and these glycan structures could potentially serve as biomarkers for cancer diagnosis or therapeutic targets. Furthermore, specific glycan structures were identified only in high metastatic potential cell lines (MHCC97H and HCCLM3), suggesting a potential connection between these unique glycans and the aggressive behavior of these cells, suggesting that GSLs and their glycan modifications could be associated with the metastatic potential of hepatic cancer cells.
However, further studies are essential to validate these findings and uncover the precise mechanisms underlying the roles of specific GSLs and glycan modifications in hepatic cancer biology.

3.6.4. GSLs in Other Cell Lines

In the study of PD, Lobasso et al. [286], profiling of lipids from human skin fibroblasts was performed, comparing samples from patients with PD (with parkin protein present in the skin fibroblasts) with normal control samples. The analysis was performed on a Bruker Microflex LRF mass spectrometer (Bruker Daltonics, Bremen, Germany), and MALDI-TOF/TOF Ultraflex Extreme mass spectrometer, with 9-AA (aminoacridine hemihydrate) used as a matrix, in both ion modes, positive and negative. Lipids extracted from the cell culture lines were dried under nitrogen gas and dissolved in chloroform for sample preparation, then underwent further analysis using TLC on silica gel plates and finally, the lipid band was extracted from the silica plates via chloroform/methanol, diluted with propanol/acetonitrile, mixed with the 9-AA matrix, and then analyzed via MS.
GSLs in the range of GM3 (m/z 1151.7 d18:1/C16:0; m/z 1235.8 d18:1/C22:0; and m/z 1263.8 d18:1/C24:0) and GM2 (m/z 1354.8 d18:1/C16:0; m/z 1438.9 d18:1/C22:0; and m/z 1466.91 d18:1/C24:0) were identified in the parkin-mutant fibroblasts in negative ion mode, but were absent or present in undetectable amounts in the control samples, with significantly higher peaks in the patient samples for the gangliosides GM2 (C24:0) and GM3 (24:0). The results were replicated using intact fibroblasts (from a different patient) compared with commercial NHDF fibroblasts, with m/z 1466.9 (GM2, d18:1/C24:0) and m/z 1263.8 (GM3, d18:1/C24:0) being higher in patient samples, with an additional peak at m/z 1152.7 (GM3, d18:1/C16:0) found to be higher in patient samples.
Specifically, the higher amounts of GM2 and GM3 in the parkin-mutant fibroblasts of PD patients compared to the control samples might be associated with the pathogenesis of PD, and these GSL markers could potentially aid in the early diagnosis of PD. Moreover, this study reveals a new approach based on MALDI-TOF MS for studying PD using skin fibroblast samples as an alternative to brain tissue samples, offering a more accessible and convenient method of diagnosis. However, it is worth noting that the method has so far been applied only to cultured cell samples, and further research is needed to validate these findings in native tissue samples and to better understand the underlying mechanisms linking altered GSL profiles to PD development.
In a study performed on Jurkat cells, Bond et al. [287], researched if mammalian cells are capable of synthesizing novel ganglioside products. For this purpose, metabolic oligosaccharide engineering was applied by inducing chemical modifications in various monosaccharides (including sialylation). Briefly, Jurkat cells were cultured with a diarizine-containing N-acetylmannosamine analog (AC4ManNDAz), with AC4GlcNDAz (as a control line, these cells are not expected to display SiaDAz), and with Ac4ManNAc (to determine if exogenous addition of a normal metabolite in the sialic acid biosynthesis pathway affects ganglioside production). After extraction and purification, gangliosides were analyzed using HPTLC, and afterward using MALDI-TOF-MS on a Bruker Microflex instrument with THAP used as matrix, in negative ion mode.
The obtained results showed that untreated Jurkat cells express several ganglioside species, with the naturally occurring form of sialic acid: monosialylated GM3, GM2, and GM1 species, having various ceramide configurations.
The cell line culture that was treated with Ac4ManNDAz revealed that alongside the naturally occurring ganglioside species, several gangliosides containing SiaDAz were also present (SiaDAz-containing gangliosides that have lost N2, in some cases), thus confirming the novel production of gangliosides. The novel species were identified as follows: GM2—SiaDAz (at m/z 1425.6 and m/z 1530.0), GM2-SiaDAz—N2 (at m/z 1397.5 and m/z 1507.9), GM1-SiaDAz (at m/z 1580.0 and m/z 1698.4), GD1a—NeuAc/SiaDAz at m/z 1879.8 and at m/z 1902.7, GD1a-SiaDAz/SiaDAz (at m/z 1948.1, m/z 1971.0 and m/z 1991.1), and GD1a-SiaDAz/SiaDAz at m/z 2059.3.
This research holds several biological significances: (1) the diversity of ganglioside structures—the study demonstrates that Jurkat cells can synthesize gangliosides with modified structures, while continuing to produce their natural gangliosides, expanding the diversity of ganglioside species that can be present on cell surfaces, having implications for cell signaling, immune response regulation, and other cellular processes; (2) cell-to-cell interactions—gangliosides are involved in cell–cell interactions, particularly in immune responses, and the ability of Jurkat cells to generate novel ganglioside products suggests that cells could modulate their interactions with other cells in response to specific environmental signals or during immune responses; (3) metabolic engineering tools—the study showcases the utility of metabolic oligosaccharide engineering as a tool for probing the glycosylation pathways of cells. This approach enables researchers to investigate the roles of specific glycan structures in cellular functions; and (4) characterizing ganglioside-mediated interactions—by generating novel gangliosides, researchers can explore how these modified structures might influence cell adhesion, signaling, and immune responses. This information could have implications for understanding diseases where altered ganglioside expression or structure is implicated.
Liang et al. [288] employed MALDI MS profiling (on an ABI 4700 Proteomics Analyzer, Foster City, CA, USA, using 2,5 DHB as a matrix) and MS/MS sequencing (low- and high-energy CID MALDI MS/MS performed on a Q/TOF Ultima MALDI with ACHC as a matrix, as well as the 4700 Proteomics Analyzer with 2.5 DHB as a matrix, in positive ion mode), to investigate the profiles of GSLs in human embryonic stem cells (hESCs) and differentiated cells derived from embryoid bodies (EBs). The cells were subjected to Folch’s partitioning, obtaining total crude GSL extracts, which were further permethylated (to neutralize the carboxylic groups on sialic acids through methyl esterification, thereby enabling the characterization of neutral and negatively charged sialylated species). MALDI MS and MS/MS analysis were performed without further purification of the samples. The results revealed distinct GSL species present in these cell types.
Undifferentiated human embryonic stem cells (hESCs) exhibit distinct glycosphingolipids (GSLs) associated with the globo-series. Notably, Gb5Cer (also known as SSEA-3), sialyl Gb5Cer (SSEA-4), and fucosyl Gb5Cer (Globo H, which carries a terminal Fuc-Gal—“H antigen”) serve as prominent markers. These GSLs are linked to epitopes relevant to pluripotency and the undifferentiated state of hESCs. In contrast, differentiated EB cells suppress globo-series GSLs and predominantly display ganglio-series GSLs, the most prominent being GM3 and GD3, with the latter being highly expressed specifically in EB cells.
Other ganglio-series GSLs, including GM2 (at m/z 1617.1), GM1a/GM1b (at m/z 1933.3), and GT1a/GT1b/GT1c (at m/z 2654.7), were also detected in lower abundance in EB cells. The ceramide moieties of ganglio-series GSLs in EB cells exhibited greater heterogeneity compared to those in hESCs, with variations in fatty acyl chain lengths. Their composition included mainly C16:0 and C18:0 fatty acids (FAs), with the exception that larger sialylated GSLs exhibited extended FA chains reaching up to C24:0/C24:1.
Further analysis identified isomers of GM1a/GM1b and GD1a/GD1b in EB cells, indicating the presence of structural variants within the ganglio-series GSLs. The FA contents of these GSLs varied, with different species exhibiting distinct compositions. This variability in FA chains contributed to the overall heterogeneity of the ganglio-series of GSLs in EB cells.
The presence of specific GSL species reflects the dynamic GSL composition changes during hESC differentiation.
The GSL profiles observed in hESCs and their differentiated counterparts carry substantial biological significance: (1) cell identity and pluripotency—GSLs, such as Gb5Cer and sialyl Gb5Cer, specifically expressed in undifferentiated hESCs indicate their pluripotent identity and play a role in sustaining the undifferentiated state; (2) cell differentiation—the shift from globo-series GSLs in hESCs to ganglio-series GSLs in differentiated cells suggests a connection between GSL composition and cellular differentiation. GSL profile alterations may contribute to specialized function acquisition; (3) epitope markers—the presence of SSEA-3 and SSEA-4 epitopes on specific GSLs underlines their utility as markers for tracing pluripotency and differentiation stages of hESCs; (4) structural variants—the identification of isomers and structural variants of GM1a/GM1b and GD1a/GD1b in EB cells accentuates the variability within ganglio-series GSLs, potentially holding functional significance; and (5) consistency across hESC lines—similar GSL expression patterns across various hESC lines (HES5 and H9) and their persistence after differentiation suggest that the observed GSL profiles represent general hESC characteristics.
Thus, this study underscores the pivotal role of GSLs in orchestrating pluripotency, differentiation, and cellular identity in hESCs. The transition from globo-series to ganglio-series GSLs during differentiation emphasizes the dynamic nature of GSL expression and its potential involvement in developmental processes. Variations in GSL structures and fatty acid chain lengths amplify the complexities of GSL-mediated functions in hESC biology and differentiation.
In conclusion, MALDI is a powerful analytical technique that plays a crucial role in the analysis of cell cultures, particularly in the field of cancer research and molecular biology. MALDI offers high sensitivity and mass resolution, allowing for the accurate measurement of molecular masses and the detection of subtle variations in GSL composition. This capability is essential for distinguishing between different GSL species and modifications, which are often critical in understanding their functional roles in cancer biology. The use of cell cultures and cell lines in research offers several advantages, including easy accessibility, clonality, and reproducibility. Cell lines provide a homogeneous population of cells with consistent genetic and phenotypic characteristics, making them suitable for studying GSL expression patterns. Furthermore, using cell lines as an alternative to human tissue samples overcomes ethical constraints and simplifies the experimental process.

Author Contributions

Conceptualization, C.R.N., A.F.S., M.G. and E.S.; methodology, A.F.S., M.G., N.D. and E.S.; software, C.R.N., R.O., M.-C.P., N.D. and E.S.; validation, A.F.S., M.G. and E.S.; formal analysis, C.R.N., A.F.S., M.G., R.O. and E.S.; investigation, C.R.N., A.F.S., M.G., R.O. and E.S.; resources, C.R.N., R.O. and A.F.S.; data curation, C.R.N., R.O., M.-C.P., N.D. and A.F.S.; writing—original draft preparation, C.R.N., R.O., A.F.S., E.S. and M.G.; writing—review and editing, C.R.N., R.O., A.F.S., E.S. and M.G.; visualization, A.F.S., E.S. and M.G.; supervision, A.F.S., E.S. and M.G.; project administration, A.F.S., C.R.N., R.O. and M.G. All authors have read and agreed to the published version of the manuscript.

Funding

This research received no external funding.

Institutional Review Board Statement

Not applicable.

Informed Consent Statement

Not applicable.

Data Availability Statement

Not applicable.

Conflicts of Interest

The authors declare no conflict of interest.

Abbreviations

ADAlzheimer’s disease
APCIAtmospheric pressure chemical ionization
CECapillary electrophoresis
CerCeramide
CIChemical ionization
CIDCollision-induced dissociation
EIElectron impact ionization
ESIElectrospray ionization
ETDElectron transfer dissociation
FTICR-MSFourier transform ion cyclotron resonance mass spectrometry
FucFucose
FUTFucosyl transferase
GalGalactose
GalCerGalactosiylceramide
GCGas chromatography
GalNAcN-acetyl galactosamine
GalTGalactosyl transferase
GlcGlucose
GlcCerGlucosylceramide
GlcNAcN-acetyl-glucosamine
GSLsGlycosphingolipids
HexHexose
HPLCHigh-performance liquid chromatography
ITIon trap
KDNDeaminoneuraminic acid
LacCerLactosylceramide
LCLiquid chromatography
ManManose
MALDIMatrix-assisted laser desorption ionization
MSMass spectrometry
MS/MSTandem mass spectrometry
MSnMultistage fragmentation mass spectrometry
Neu5AcAcetyl-neuraminic acid
Neu5GcN-glicolyl-neuraminic acid
O-AcO-acetyl
PParkinson’s disease
QITQuadrupole ion trap
QTOF MSQuadrupole time-of-flight mass spectrometry
SASialic acid
sLeASialyl LewisA
sLeXSialyl LewisX
STSialyl transferase
S/NCSignal-to-noise ratio
TLCThin-layer chromatography
TOF MSTime-of-flight mass spectrometry

Appendix A

Table A1. Summary of GSL analysis from healthy human tissues/fluids.
Sample (Organ, Tissue, Fluid)TypeInstrumentation/Operation ModeMatricesGSLsCommentsReference
MilkHuman milk;
bovine milk
IonSpec Pro MALDI FTICR MS (IonSpec, Irvine, CA, USA) equipped with a 7.0 T superconducting magnet. A pulsed Nd: YAG laser (355 nm) was used as the external MALDI source.
Tandem MS analysis was achieved via CID and IRMPD.
Both positive and negative ion modes.
DHBGM3
GD3
The study presents a rapid means to characterize and analyze milk GSLs, using MALDI FTCIR MS coupled with CID and IRMPD MS/MS. It compares the distribution of abundances of GSLs in human and bovine milk samples.[122]
MilkHuman milk;
bovine milk (GM3 and GD3 standards)
Voyager-DE-STR system (PerSeptive Biosystems) MALDI-TOF MS equipped with a nitrogen laser emitting at 337 nm.
Positive linear ion mode, with delayed extraction.
DHBGM3
GD3
The aim of the study is to compare the difference between human and bovine milk gangliosides, the latter being used to produce milk formula. The amount of long-chain fatty acids was higher in bovine milk and tricosanoic acid dominated in bovine milk gangliosides, compared to human milk.[118]
Human brainNormal human brain tissue samples alongside ganglioside standardsMALDI-FTMS
(IonSpec, Irvine, CA, USA) with a Cryomagnetics (OakRidge, TN, USA) 7 Tesla active-shielded superconducting electromagnet.
Both positive and negative ion modes.
ATTGM1, GD1a, GT1b, GQ1b, GP1b1cThis study demonstrates that transiently elevating pressure in an MALDI-FTMS source into the 1–10 mbar range during ionization decreases the metastable fragmentation of gangliosides. This allows the detection of the molecular ion species without loss of the highly liable sialic acid residues.[120]
Human brainNormal vs. diseased brain tissue samples (AD), CSF, and serumMALDI-TOF MS and on a Bruker
Daltonics mass spectrometer equipped with a reflector; additional fragmentation analysis was conducted using MALDI-TOF/TOF analysis (Bruker
Daltonics, Bremen, Germany).
DHBGM1, GM2, GM3, GD1-a, GD1b-lactoneThe study demonstrates that using glycoblotting-based glycome analysis can be used for human brain tissue post mortem. The Aβ glycosylation (which can become aberrant or absent in tissues from AD brain) leads to elevation of the N-glycans with proximal fucose, bisecting-GlcNAc, tri- and tetra-antennary types, and small gangliosides GM1 and GM2—in serum. There were found smaller amounts of GD1a/GD1b-lactone in AD brain tissues and a significantly lesser amount of gangliosides in the frontal cortex sample, compared to the control sample.[134]
Human brainHuman brain and hippocampus tissue samples from patients with AD, Parkinson’s disease, and control samples.TLC-Blot-MALDI-TOF MS system (QSTAR XL, Applied Biosystems/MDS Sciex, Foster City, CA, USA).
AXIMA-QIT-TOF mass spectrometer (Shimadzu, Kyoto, Japan) in negative ion mode. Ionization was performed with a 337 nm pulsed N2 laser.
Precursor and fragment ions obtained using CID using Ar were ejected from the ion trap and analyzed by a reflectron TOF detector.
DHBGM1, GD1a, GD1b, GT1bThe study uses a new approach by using the lipids transferred from a TLC plate to a PVDF membrane and direct mass spectrometric analysis. The authors found that GD1b and GT1b levels were lower in AD, compared with PD or control patients. Furthermore, there was a significant reduction in d:20:1/C18:0 ceramide-containing gangliosides in AD samples.[158]
Human brainNormal human brain tissue vs. several diseased human brain tissuesDE MALDI-TOF MS on a Voyager Elite XL, (PerSeptive Biosystem, Framingham, MA, USA), pulsed with a 337 nm nitrogen laser.
Both positive and negative ion modes (reflector mode).
CHCA
DHB
GD1a, GD1b, GD2, GalNAc-GD1aThe study aims to determine if using DE MALDI-TOF MS is suitable for determining individual molecular species of gangliosides in the GM and GD series from various human brain tissue samples, as well as some animal tissue samples (caprine erythrocytes, porcine spinal cord, and brain) by comparing the spectra results with known masses of gangliosides.[123]
Human bloodHuman leukocytesMALDI-TOF MS on a TofSpec-E (Micromass, Manchester, UK).
Negative ion mode (reflector mode).
ATT The study tested binding of human and avian influenza viruses to gangliosides isolated from different human tissues/fluids (only leukocytes are detailed).[183]
Human bloodHuman plateletsDE MALDI-TOF MS on a Voyager Elite XL, (PerSeptive Biosystem, Framingham, MA, USA) pulsed with a 337 nm nitrogen laser.
Both positive and negative ion modes (reflector mode).
CHCA
DHB
sphingomyelin, glucosylceramide, lactosylceramide, globotrialosylceramide, globotetraosylceramide, and GM2The article refers to methods of extracting and analyzing sphingolipids from a single sample. The sample preparation steps are described in detail.[162]
Human bloodHuman erythrocytesMALDI-TOF MS on a Bruker Daltonik (Bruker Daltonics, Bremen, Germany), with pulsed nitrogen laser at 337 nm wavelength, coupled with a nanoHPLC.
Both positive and negative ion modes (reflector mode).
DHB
ATT/DAC
2,4,6trihydroxyacetophenone/DAC
LacCer
Gb3Cer
Gb4Cer
This study establishes a protocol for screening neutral GSL mixtures (GSLs from human erythrocytes and monosialogangliosides from murine MDAY-D2 cell line) by coupling nanoHPLC/MALDI MS.[127]
Table A2. Summary of GSL analysis from pathological human tissues.
Sample (Organ, Tissue, Fluid)TypeInstrumentation/Operation ModeMatricesGSLsCommentsReference
Human brainSudanophilic leukodystrophy disease;
Spielmeyer–Vogt type of juvenile amaurotic idiocy;
GM1 gangliosidosis;
Gaucher disease;
nuclear jaundice;
Schilder’s disease;
schizophrenia;
brain edema.
DE MALDI-TOF MS
(Voyager Elite XL Biospectrometry Workstation, PerSeptive Biosystem; Framingham, MA, USA, reflector mode) nitrogen laser at 337 nm wavelength was used for ionization. Spectra were acquired in negative ion mode.
αCHCA
DHB
GM1This comprehensive study uses mass spectrometry to determine the long-chain base composition of glycosphingolipids, including gangliosides. The main focus is the changes that occur with age in the long-chain base of GM1. For this purpose, brain tissue samples from patients with various diseases were studied, alongside brain tissue samples from Eker rats, with and without renal carcinoma.[142]
Human brainNormal vs. diseased brain tissue samples (AD), CSF, and serum.MALDI-TOF MS on a Bruker
Daltonics mass spectrometer equipped with a reflector; additional fragmentation analysis was conducted using MALDI-TOF/TOF analysis (Bruker
Daltonics, Bremen, Germany).
DHBGM1, GM2, GM3, GD1-a, GD1b-lactone.The study demonstrates that using glycoblotting-based glycome analysis can be used for human brain tissue post mortem. The Aβ glycosylation (which can become aberrant or absent in tissues from AD brain) leads to elevation of the N-glycans with proximal fucose, bisecting-GlcNAc, tri- and tetra-antennary types, and small gangliosides GM1 and GM2—in serum. There were found smaller amounts of GD1a/GD1b-lactone in AD brain tissues, and also a significantly lesser amount of gangliosides in the frontal cortex sample, compared to the control sample.[134]
Human brainHuman brain and hippocampus tissue samples from patients with AD, Parkinson’s disease, and control samples.TLC-Blot-MALDI-TOF MS system (QSTAR XL, Applied Biosystems/MDS Sciex, Foster City, CA, USA)
AXIMA-QIT-TOF mass spectrometer (Shimadzu, Kyoto, Japan) in negative ion mode. Ionization was performed with a 337 nm pulsed N2 laser.
Precursor and fragment ions obtained using CID using Ar were ejected from the ion trap and analyzed by a reflectron TOF detector.
DHBGM1, GD1a, GD1b, GT1b.The study uses a new approach by using the lipids transferred from a TLC plate to a PVDF membrane and direct mass spectrometric analysis. The authors found that GD1b and GT1b levels were lower in AD, compared with PD or control patients. Furthermore, there was a significant reduction in d:20:1/C18:0 ceramide-containing gangliosides in AD samples.[158]
Human brainGM1 gangliosidosis brain.
Brain tissue sample from Tay–Sachs disease.
Brain tumor tissue.
GD1b, GD2, GD2a and GalNAc-GD1a extracted from human brain.
DE MALDI-TOF MS on a Voyager Elite XL, PerSeptive Biosystem, pulsed with a 337 nm nitrogen laser (reflector mode). Spectra were acquired in both positive and negative ion modes.CHCA
DHB
GM1, GM2, GM3, GD3, GD2, GD1a, GD1b, GalNAc-GD1a, mixture of various gangliosides.The study aims to determine if using DE MALDI-TOF MS is suitable for determining individual molecular species of gangliosides in the GM and GD series, from various human brain tissue samples, as well as some animal tissue samples (caprine erythrocytes, porcine spinal cord, and brain) by comparing the spectra results with known masses of gangliosides.[123]
Human brain;
Human liver;
Human spleen
Cerebrum, cerebellum, and liver from GM1 gangliosidosis patient.
Liver from Farber disease patient.
Liver and spleen from Gaucher disease type 2 patient.
Liver from Niemann–Pick disease type C; liver from Potter syndrome patient.
DE MALDI-TOF MS on a Voyager Elite XL, (PerSeptive Biosystem, Framingham, MA, USA) reflector mode), pulsed with a 337 nm nitrogen laser. Spectra were acquired in both positive negative ion modes.CHCA
DHB
GM1,
ceramide,
sphingomyelin,
monohexosylceramides.
The study demonstrates that DE MALDI-TOF MS can allow rapid screening for sphingolipidosis, with minimal tissue. The main focus of the study is sphingolipids (sphingomyelin, monohexosylceramide, and ceramide), but ganglioside GM1 is also studied.[137]
Human brainHuman brain tumor tissue, brain tissue from a patient with sudanophilic leukodystrophy.DE MALDI-TOF MS on a Voyager Elite XL (PerSeptive Biosystem, Framingham, MA, USA) reflector mode, pulsed with a 337 nm nitrogen laser. Spectra were acquired in both positive and negative ion modes.CHCA
DHB
GM1, GM3.The article refers to methods of extracting and analyzing sphingolipids from a single sample. The sample preparation steps are described in detail. For gala-series glycosphingoplipids, monkey brain tissue is used, for globo-series glycosphingolipids, porcine erythrocytes are used, and for gangliosides, the before-mentioned human brain tissues.
Lyso compound of GM3 was isolated from the human brain tumor tissue, with ion peaks at m/z 871.78 (lysoGM3 d18:1) and 899.79 (lysoGM3 d20:1). Intact GM1 from a patient with sudanophilic leukodystrophy was analyzed directly, with GM1 identified at m/z 1545.42 (d18:1C18:0) and m/z 1573.46 (d20:1C18:0).
[162]
Human brainHuman brain tissue from a patient with Tay–Sachs disease.QIT-TOF-MS
(Shimadzu, Kyoto, Japan), equipped with an AP-MALDI
(Mass Technologies, Burtonsville, MD, USA)
Nitrogen laser pulsed at 337 nm.
Spectra were acquired in negative ion mode.
CHCAGM2This article presents protocols for mass spectrometry used in analyzing gangliosides. Regarding MALDI MS, the gangliosides used were GM2 from a patient with Tay–Sachs disease, as well as GM1, GD2, GD1a, GD1b, and GT1b purified from bovine brain.[150]
Human brainHuman brain tissue from Tay–Sachs disease (GM2), purified ganglioside from human brain (GT1a), alongside gangliosides from animal tissues.QIT-TOF-MS
(Shimadzu, Kyoto, Japan), equipped with an AP-MALDI
(Mass Technologies, Burtonsville, MD, USA)
Nitrogen laser pulsed at 337 nm.
Spectra were acquired in negative ion mode.
CHCAGM1,
GM2,
GD2,
GD1a,
GD1b,
GT1a.
The study presents the advantages of AP-MALDI in characterizing the structures of gangliosides.[140]
Human brainSecondary brain tumor tissue (metastasis), originating from a non-small-cell lung carcinoma.Bruker ultrafleXtreme MALDI-TOF, (Bruker Daltonics, Bremen, Germany). nitrogen laser pulsed at 355 nm wavelength spectra were acquired in negative ion mode.2,5 DHBGluco- and galacto-cerebrosides, lactosylceramides, hexosylceramides, lacto-, neolacto-, globo, and isoglobo-GSLs, GA2,
GM4, GM3, GM2, GM1, GD1, GD2, GD3, GT3.
The study investigates the glycolipid profile of a brain metastasis sample (with NSCLC-type origin) using MALDI-TOF. The sample presented mainly GD2 and GD3 and some unusual de-amino-neuraminic acid and N-Glycolyl-neuraminic acid.[216]
Human colonHuman colon tissue with diagnosed colorectal cancer from 13 patients.MALDI-TOF MS ultrafleXtreme (Bruker Daltonics, Bremen, Germany). Spectra were acquired in the negative ion reflector mode.DHB(iso)globo GSLs,
(neo)lacto GSLs,
GM1,
GD2,
GD1,
GD3.
The study uses MALDI-TOF (/TOF) MS for identifying labeled AA glycans, enzymatically released from GSLs to reveal significant differences between normal human colon tissue and colorectal cancer tissue. The main changes found are increased fucosylation, decreased acetylation, decreased sulfation, and reduced expression of globo-type glycans, as well as disialyl gangliosides.[135]
Table A3. Summary of GSL analysis from cell cultures.
Sample (Organ, Tissue, Fluid)TypeInstrumentation/Operation ModeMatricesGSLsCommentsReference
Cell line cultureNormal human liver cell line (HL-7702)
hepatic cancer cell lines
(MHCC97L,
MHCC97H,
HCCLM3)
ultrafleXtreme MALDI-TOF/TOF MS (Bruker Daltonics, Bremen, Germany). Spectra were acquired in positive ion and reflectron mode, and the intense ions from the mass spectra were subsequently selected and subjected to MS/MS.2,5 DHBGSL-glycansBy using lectin microarrays to analyze GSL glycans, there is no need to separate certain GSLs by traditional methods such as HPLC due to the nature of high-throughput omics-level screening of lectin microarrays. Up- and/or downregulations of corresponding glycopatterns such as α1 − 2 fucosylation and α2 − 3 sialylation, and changes of certain glycostructures were observed.[136]
hESC (human embryonic stem cells)Two undifferentiated hESC lines,
16-d differentiated embryoid body (EB) outgrowth cells
ABI 4700 MALDI-TOF/TOF
Proteomics Analyzer (Applied Biosystems) for MS,
CID MALDI MS/MS was performed on a Q/TOF Ultima MALDI (Waters Micromass, Manchester, UK).
Both operated in reflectron positive ion mode.
2,5 DHB
A-CHCA
Globo-series GSLs,
lacto-series GSLs,
ganglio-series GSLs.
The study aims to provide insight into the stage-specific transition and mechanism for alterations of GSL core structures during hESC differentiation.[288]
Cell line culturesBreast cancer cells (Hs 578T, MDA-MB-231, MCF-7, SUM159PT);
melanoma cell line (SK-MEL-28);
neuroblastoma cell line (LAN-1)
MALDI-QIT-TOF Shimadzu AXIMA Resonance MS (Manchester, UK).
Spectra were acquired in negative ion mode.
THAPGanglio-series GSLs (GM1, GM2, GM3, GD2, GD3, GT2, GT30), and O-acetylated gangliosides (O-Ac-GM1, O-Ac-GD3, O-Ac-GD2, O-Ac-GT2, O-Ac-GT3).The aim of the study is to use structural approaches in order to comprehend ganglioside diversity in melanoma, neuroblastoma, and breast cancer cells, focusing on O-acetylated species, that are usually lost under alkaline conditions and require specific analytical procedures.[265]
Cell line culturesJurkat cells
(line of human T lymphocytes)
MALDI-TOF-MS
(Bruker microflex, Bruker Daltonics, Bremen, Germany).
Negative ion mode.
THAPGM3, GM2, GM1, GD1a.This study demonstrates that the use of metabolic oligosaccharide engineering enables a mammalian cell line to produce photoactivatable gangliosides. The results show promise for using photoreaction to capture and characterize ganglioside-mediated interactions.[287]
Breast cancer cell linesMCF7
MDA-MB231
MDA-MB468
HMLE-Twist-ER
MALDI-TOF/TOF 5800 system (Sciex; Vaughan, Canada). Spectra were acquired in positive ion mode.2,5 DHBGD2,
GD3.
This study demonstrates that GD3s alone can sustain CSC (cancer stem cells) properties and also promote malignant cancer properties. [257]
Breast cancer cell linesMCF-t,
MDA-MB-231,
Hs578T
4800 MALDI-TOF/TOF Proteomics Analyzer (Applied Biosystems). MS, operated in the positive reflectron mode.2,5 DHBLacCer
Ganglio-series: GM1a, GM1b, GM1a/b, GM3, GM2, GD1 (GD1a, GD1b, GD1c), GD3, GT3,
lacto-series: GL7
globo-series GSLs (Gb3, Gb4),
GA2.
This study analyzes the effect of TNF on ganglioside biosynthesis and expression in breast cancer cells from different molecular subtypes. [269]
Cell cultureParkin-mutant human skin primary fibroblasts vs. normal control fibroblasts (NHDF)Bruker Microflex LRF MS and Bruker Daltonics Ultraflex Extreme MALDI-TOF/TOF (Bruker Daltonics, Bremen, Germany) for MS/MS analyses.
Spectra were acquired in positive or negative reflector mode.
9-AAGM3, GM2.This study demonstrates that the proportions of phospholipids and glycosphingolipids are altered in the lipid profiles of Parkin-mutant fibroblasts.[286]

References

  1. Schnaar, R.L.; Sandhoff, R.; Tiemeyer, M.; Kinoshita, T. Glycosphingolipids. In Essentials of Glycobiology, 4th ed.; Varki, A., Cummings, R.D., Esko, J.D., Eds.; Cold Spring Harbor Laboratory Press: New York, NY, USA, 2022; Chapter 11. [Google Scholar]
  2. Hakomori, S.I. Structure and Function of Sphingoglycolipids in Transmembrane Signalling and Cell-Cell Interactions. Biochem. Soc. Trans. 1993, 21, 583–595. [Google Scholar] [CrossRef] [PubMed]
  3. Hakomori, S.I.; Igarashi, Y. Functional Role of Glycosphingolipids in Cell Recognition and Signaling. J. Biochem. 1995, 118, 1091–1103. [Google Scholar] [CrossRef] [PubMed]
  4. Kojima, N.; Hakomori, S.I. Cell Adhesion, Spreading, and Motility of G(M3)-Expressing Cells Based on Glycolipid-Glycolipid Interaction. J. Biol. Chem. 1991, 266, 17552–17558. [Google Scholar] [CrossRef]
  5. Hakomori, S. Structure and Function of Glycosphingolipids and Sphingolipids: Recollections and Future Trends. Biochim. Biophys. Acta-Gen. Subj. 2008, 1780, 325–346. [Google Scholar] [CrossRef]
  6. Smart, E.J.; Graf, G.A.; Mcniven, M.A.; Sessa, W.C.; Engelman, J.A.; Scherer, P.E.; Okamoto, T.; Lisanti, M.P. Caveolins, Liquid-Ordered Domains, and Signal Transduction overview: Caveolae and caveola-related domains are liquid-ordered microdomains. Mol. Cell. Biol. 1999, 19, 7289–7304. [Google Scholar] [CrossRef] [PubMed]
  7. Brown, D.A.; Rose, J.K. Sorting of GPI-Anchored Proteins to Glycolipid-Enriched Membrane Subdomains during Transport to the Apical Cell Surface. Cell 1992, 68, 533–544. [Google Scholar] [CrossRef]
  8. Liu, P.; Ying, Y.; Ko, Y.G.; Anderson, R.G.W. Localization of Platelet-Derived Growth Factor-Stimulated Phosphorylation Cascade to Caveolae. J. Biol. Chem. 1996, 271, 10299–10303. [Google Scholar] [CrossRef]
  9. Mineo, C.; James, G.L.; Smart, E.J.; Anderson, R.G.W. Localization of Epidermal Growth Factor-Stimulated Ras/Raf-1 Interaction to Caveolae Membrane. J. Biol. Chem. 1996, 271, 11930–11935. [Google Scholar] [CrossRef]
  10. Chun, M.; Liyanage, U.K.; Lisanti, M.P.; Lodish, H.F. Signal Transduction of a G Protein-Coupled Receptor in Caveolae: Colocalization of Endothelin and Its Receptor with Caveolin. Proc. Natl. Acad. Sci. USA 1994, 91, 11728–11732. [Google Scholar] [CrossRef] [PubMed]
  11. Gorodinsky, A.; Harris, D.A. Glycolipid-Anchored Proteins in Neuroblastoma Cells Form Detergent- Resistant Complexes without Caveolin. J. Cell Biol. 1995, 129, 619–627. [Google Scholar] [CrossRef]
  12. Bickel, P.E.; Scherer, P.E.; Schnitzer, J.E.; Oh, P.; Lisanti, M.P.; Lodish, H.F. Flotillin and Epidermal Surface Antigen Define a New Family of Caveolae- Associated Integral Membrane Proteins. J. Biol. Chem. 1997, 272, 13793–13802. [Google Scholar] [CrossRef]
  13. Hakomori, S.I. The Glycosynapse. Proc. Natl. Acad. Sci. USA 2002, 99, 225–232. [Google Scholar] [CrossRef]
  14. Hakomori, S. Glycosynapses: Microdomains Controlling Carbohydrate-Dependent Cell Adhesion and Signaling. An. Acad. Bras. Cienc. 2004, 76, 553–572. [Google Scholar] [CrossRef]
  15. Handa, K.; Hakomori, S.I. Carbohydrate to Carbohydrate Interaction in Development Process and Cancer Progression. Glycoconj. J. 2012, 29, 627–637. [Google Scholar] [CrossRef] [PubMed]
  16. Santacroce, P.V.; Basu, A. Probing Specificity in Carbohydrate-Carbohydrate Interactions with Micelles and Langmuir Monolayers. Angew. Chemie-Int. Ed. 2003, 42, 95–98. [Google Scholar] [CrossRef]
  17. Garcia-Ruiz, C.; Morales, A.; Fernández-Checa, J.C. Glycosphingolipids and Cell Death: One Aim, Many Ways. Apoptosis 2015, 20, 607–620. [Google Scholar] [CrossRef] [PubMed]
  18. Iwabuchi, K.; Nakayama, H.; Oizumi, A.; Suga, Y.; Ogawa, H.; Takamori, K. Role of Ceramide from Glycosphingolipids and Its Metabolites in Immunological and Inflammatory Responses in Humans. Mediat. Inflamm. 2015, 2015, 120748. [Google Scholar] [CrossRef] [PubMed]
  19. Lingwood, C.A. Glycosphingolipid Functions. Cold Spring Harb. Perspect. Biol. 2011, 3, a004788. [Google Scholar] [CrossRef]
  20. Ravindran, M.S.; Tanner, L.B.; Wenk, M.R. Sialic Acid Linkage in Glycosphingolipids Is a Molecular Correlate for Trafficking and Delivery of Extracellular Cargo. Traffic 2013, 14, 1182–1191. [Google Scholar] [CrossRef]
  21. Hakomori, S. Traveling for the Glycosphingolipid Path. Glycoconj. J. 2000, 17, 627–647. [Google Scholar] [CrossRef]
  22. Frey, S.L.; Lee, K.Y.C. Number of Sialic Acid Residues in Ganglioside Headgroup Affects Interactions with Neighboring Lipids. Biophys. J. 2013, 105, 1421–1431. [Google Scholar] [CrossRef] [PubMed]
  23. Ohmi, Y.; Ohkawa, Y.; Yamauchi, Y.; Tajima, O.; Furukawa, K.; Furukawa, K. Essential Roles of Gangliosides in the Formation and Maintenance of Membrane Microdomains in Brain Tissues. Neurochem. Res. 2012, 37, 1185–1191. [Google Scholar] [CrossRef]
  24. Walkley, S.U.; Zervas, M.; Wiseman, S. Gangliosides as Modulators of Dendritogenesis in Normal and Storage Disease-Affected Pyramidal Neurons. Cereb. Cortex 2000, 10, 1028–1037. [Google Scholar] [CrossRef] [PubMed]
  25. Schachner, M.; Bartsch, U. Multiple Functions of the Myelin-Associated Glycoprotein MAG (Siglec-4a) in Formation and Maintenance of Myelin. Glia 2000, 29, 154–165. [Google Scholar] [CrossRef]
  26. Vyas, A.A.; Schnaar, R.L. Brain Gangliosides: Functional Ligands for Myelin Stability and the Control of Nerve Regeneration. Biochimie 2001, 83, 677–682. [Google Scholar] [CrossRef]
  27. Hilbush, B.S.; Levine, J.M. Modulation of a Ca2+ Signaling Pathway by G(M1) Ganglioside in PC12 Cells. J. Biol. Chem. 1992, 267, 24789–24795. [Google Scholar] [CrossRef] [PubMed]
  28. Kim, J.Y.H.; Goldenring, J.R.; DeLorenzo, R.J.; Yu, R.K. Gangliosides Inhibit Phospholipid-sensitive Ca2+-dependent Kinase Phosphorylation of Rat Myelin Basic Proteins. J. Neurosci. Res. 1986, 15, 159–166. [Google Scholar] [CrossRef]
  29. Takahashi, T.; Suzuki, T. Role of Sulfatide in Normal and Pathological Cells and Tissues. J. Lipid Res. 2012, 53, 1437–1450. [Google Scholar] [CrossRef]
  30. Porubsky, S.; Speak, A.O.; Salio, M.; Jennemann, R.; Bonrouhi, M.; Zafarulla, R.; Singh, Y.; Dyson, J.; Luckow, B.; Lehuen, A.; et al. Globosides but Not Isoglobosides Can Impact the Development of Invariant NKT Cells and Their Interaction with Dendritic Cells. J. Immunol. 2012, 189, 3007–3017. [Google Scholar] [CrossRef]
  31. Nakayama, H.; Nagafuku, M.; Suzuki, A.; Iwabuchi, K.; Inokuchi, J.I. The Regulatory Roles of Glycosphingolipid-Enriched Lipid Rafts in Immune Systems. FEBS Lett. 2018, 592, 3921–3942. [Google Scholar] [CrossRef]
  32. Zhang, T.; De Waard, A.A.; Wuhrer, M.; Spaapen, R.M. The Role of Glycosphingolipids in Immune Cell Functions. Front. Immunol. 2019, 10, 90. [Google Scholar] [CrossRef]
  33. Haslam, S.M.; Julien, S.; Burchell, J.M.; Monk, C.R.; Ceroni, A.; Garden, O.A.; Dell, A. Characterizing the Glycome of the Mammalian Immune System. Immunol. Cell Biol. 2008, 86, 564–573. [Google Scholar] [CrossRef] [PubMed]
  34. Nakayama, H.; Ogawa, H.; Takamori, K.; Iwabuchi, K. GSL-Enriched Membrane Microdomains in Innate Immune Responses. Arch. Immunol. Ther. Exp. 2013, 61, 217–228. [Google Scholar] [CrossRef] [PubMed]
  35. Yu, R.K.; Ariga, T. The role of glycosphingolipids in neurological disorders. Mechanisms of immune action. Ann. N. Y. Acad. Sci. 1998, 845, 285–306. [Google Scholar] [CrossRef]
  36. Dodge, J.C.; Treleaven, C.M.; Pacheco, J.; Cooper, S.; Bao, C.; Abraham, M.; Cromwell, M.; Sardi, S.P.; Chuang, W.L.; Sidman, R.L.; et al. Glycosphingolipids Are Modulators of Disease Pathogenesis in Amyotrophic Lateral Sclerosis. Proc. Natl. Acad. Sci. USA 2015, 112, 8100–8105. [Google Scholar] [CrossRef] [PubMed]
  37. Schnaar, R.L. Gangliosides of the Vertebrate Nervous System. J. Mol. Biol. 2016, 428, 3325–3336. [Google Scholar] [CrossRef]
  38. Han, X. Lipid Alterations in the Earliest Clinically Recognizable Stage of Alzheimers Disease: Implication of the Role of Lipids in the Pathogenesis of Alzheimers Disease. Curr. Alzheimer Res. 2005, 2, 65–77. [Google Scholar] [CrossRef]
  39. Wallom, K.L.; Fernández-Suárez, M.E.; Priestman, D.A.; Vruchte, D.; Huebecker, M.; Hallett, P.J.; Isacson, O.; Platt, F.M. Glycosphingolipid Metabolism and Its Role in Ageing and Parkinson’s Disease. Glycoconj. J. 2022, 39, 39–53. [Google Scholar] [CrossRef] [PubMed]
  40. Zöller, I.; Meixner, M.; Hartmann, D.; Büssow, H.; Meyer, R.; Gieselmann, V.; Eckhardt, M. Absence of 2-Hydroxylated Sphingolipids Is Compatible with Normal Neural Development but Causes Late-Onset Axon and Myelin Sheath Degeneration. J. Neurosci. 2008, 28, 9741–9754. [Google Scholar] [CrossRef]
  41. Sasaki, N.; Toyoda, M.; Ishiwata, T. Gangliosides as Signaling Regulators in Cancer. Int. J. Mol. Sci. 2021, 22, 5076. [Google Scholar] [CrossRef]
  42. Hakomori, S.I.; Zhang, Y. Glycosphingolipid Antigens and Cancer Therapy. Chem. Biol. 1997, 4, 97–104. [Google Scholar] [CrossRef]
  43. Park, D.D.; Xu, G.; Wong, M.; Phoomak, C.; Liu, M.; Haigh, N.E.; Wongkham, S.; Yang, P.; Maverakis, E.; Lebrilla, C.B. Membrane Glycomics Reveal Heterogeneity and Quantitative Distribution of Cell Surface Sialylation. Chem. Sci. 2018, 9, 6271–6285. [Google Scholar] [CrossRef]
  44. Bellis, S.L.; Reis, C.A.; Varki, A.; Kannagi, R.; Stanley, P. Glycosylation Changes in Cancer. In Essentials of Glycobiology, 4th ed.; Varki, A., Cummings, R.D., Esko, J.D., Eds.; Cold Spring Harbor Laboratory Press: New York, NY, USA, 2022; Chapter 47. [Google Scholar]
  45. Li, B.; Qin, Y.; Yu, X.; Xu, X.; Yu, W. Lipid Raft Involvement in Signal Transduction in Cancer Cell Survival, Cell Death and Metastasis. Cell Prolif. 2022, 55, e13167. [Google Scholar] [CrossRef] [PubMed]
  46. Mirkin, B.L.; Clark, S.H.; Zhang, C. Inhibition of Human Neuroblastoma Cell Proliferation and EGF Receptor Phosphorylation by Gangliosides GM1, GM3, GD1A and GT1B. Cell Prolif. 2002, 35, 105–115. [Google Scholar] [CrossRef] [PubMed]
  47. Furukawa, K.; Ohmi, Y.; Ohkawa, Y.; Bhuiyan, R.H.; Zhang, P.; Tajima, O.; Hashimoto, N.; Hamamura, K.; Furukawa, K. New Era of Research on Cancer-Associated Glycosphingolipids. Cancer Sci. 2019, 110, 1544–1551. [Google Scholar] [CrossRef]
  48. Kovbasnjuk, O.; Mourtazina, R.; Baibakov, B.; Wang, T.; Elowsky, C.; Choti, M.A.; Kane, A.; Donowitz, M. The Glycosphingolipid Globotriaosylceramide in the Metastatic Transformation of Colon Cancer. Proc. Natl. Acad. Sci. USA 2005, 102, 19087–19092. [Google Scholar] [CrossRef] [PubMed]
  49. Hamamura, K.; Furukawa, K.; Hayashi, T.; Hattori, T.; Nakano, J.; Nakashima, H.; Okuda, T.; Mizutani, H.; Hattori, H.; Ueda, M.; et al. Ganglioside GD3 Promotes Cell Growth and Invasion through P130Cas and Paxillin in Malignant Melanoma Cells. Proc. Natl. Acad. Sci. USA 2005, 102, 11041–11046. [Google Scholar] [CrossRef]
  50. Yoshida, S.; Fukumoto, S.; Kawaguchi, H.; Sato, S.; Ueda, R.; Furukawa, K. Ganglioside GD2 in Small Cell Lung Cancer Cell Lines: Enhancement of Cell Proliferation and Mediation of Apoptosis. Cancer Res. 2001, 61, 4244–4252. [Google Scholar]
  51. Wang, L.; Wang, Y.; Sato, T.; Yamagata, S.; Yamagata, T. Ganglioside GD1a Suppresses TNFα Expression via Pkn1 at the Transcriptional Level in Mouse Osteosarcoma-Derived FBJ Cells. Biochem. Biophys. Res. Commun. 2008, 371, 230–235. [Google Scholar] [CrossRef] [PubMed]
  52. Ohkawa, Y.; Miyazaki, S.; Miyata, M.; Hamamura, K.; Furukawa, K.; Furukawa, K. Essential Roles of Integrin-Mediated Signaling for the Enhancement of Malignant Properties of Melanomas Based on the Expression of GD3. Biochem. Biophys. Res. Commun. 2008, 373, 14–19. [Google Scholar] [CrossRef] [PubMed]
  53. Shibuya, H.; Hamamura, K.; Hotta, H.; Matsumoto, Y.; Nishida, Y.; Hattori, H.; Furukawa, K.; Ueda, M.; Furukawa, K. Enhancement of Malignant Properties of Human Osteosarcoma Cells with Disialyl Gangliosides GD2/GD3. Cancer Sci. 2012, 103, 1656–1664. [Google Scholar] [CrossRef]
  54. Hamamura, K.; Tsuji, M.; Hotta, H.; Ohkawa, Y.; Takahashi, M.; Shibuya, H.; Nakashima, H.; Yamauchi, Y.; Hashimoto, N.; Hattori, H.; et al. Functional Activation of Src Family Kinase Yes Protein Is Essential for the Enhanced Malignant Properties of Human Melanoma Cells Expressing Ganglioside GD3. J. Biol. Chem. 2011, 286, 18526–18537. [Google Scholar] [CrossRef] [PubMed]
  55. Hyuga, S.; Yamagata, S.; Tai, T.; Yamagata, T. Inhibition of Highly Metastatic FBJ-LL Cell Migration by Ganglioside GD1a Highly Expressed in Poorly Metastatic FBJ-S1 Cells. Biochem. Biophys. Res. Commun. 1997, 231, 340–343. [Google Scholar] [CrossRef]
  56. Cao, T.; Zhang, T.; Wang, L.; Zhang, L.; Adachi, T.; Sato, T.; Yamagata, S.; Yamagata, T. Ganglioside GD1a Suppression of NOS2 Expression via ERK1 Pathway in Mouse Osteosarcoma FBJ Cells. J. Cell. Biochem. 2010, 110, 1165–1174. [Google Scholar] [CrossRef]
  57. Furukawa, K.; Hamamura, K.; Ohkawa, Y.; Ohmi, Y.; Furukawa, K. Disialyl Gangliosides Enhance Tumor Phenotypes with Differential Modalities. Glycoconj. J. 2012, 29, 579–584. [Google Scholar] [CrossRef] [PubMed]
  58. Mitsuzuka, K.; Handa, K.; Satoh, M.; Arai, Y.; Hakomori, S. A Specific Microdomain (“glycosynapse 3”) Controls Phenotypic Conversion and Reversion of Bladder Cancer Cells through GM3-Mediated Interaction of A3β1 Integrin with CD9. J. Biol. Chem. 2005, 280, 35545–35553. [Google Scholar] [CrossRef] [PubMed]
  59. Lewis, A.L.; Szymanski, C.M.; Schnaar, R.L.; Aebi, M. Bacterial and Viral Infections. In Essentials of Glycobiology, 4th ed.; Varki, A., Cummings, R.D., Esko, J.D., Eds.; Cold Spring Harbor Laboratory Press: New York, NY, USA, 2022; Chapter 42. [Google Scholar]
  60. Sackstein, R.; Hoffmeister, K.M.; Stowell, S.R.; Kinoshita, T.; Varki, A.; Freeze, H.H. Glycans in Acquired Human Diseases. In Essentials of Glycobiology, 4th ed.; Varki, A., Cummings, R.D., Esko, J.D., Eds.; Cold Spring Harbor Laboratory Press: New York, NY, USA, 2022; Chapter 46. [Google Scholar]
  61. Freeze, H.H.; Steet, R.; Suzuki, T.; Kinoshita, T.; Schnaar, R.L. Genetic Disorders of Glycan Degradation. In Essentials of Glycobiology, 4th ed.; Varki, A., Cummings, R.D., Esko, J.D., Eds.; Cold Spring Harbor Laboratory Press: New York, NY, USA, 2022; Chapter 44. [Google Scholar]
  62. Breiden, B.; Sandhoff, K. Lysosomal Glycosphingolipid Storage Diseases. Annu. Rev. Biochem. 2019, 88, 461–485. [Google Scholar] [CrossRef]
  63. Rustam, Y.H.; Reid, G.E. Analytical Challenges and Recent Advances in Mass Spectrometry Based Lipidomics. Anal. Chem. 2018, 90, 374–397. [Google Scholar] [CrossRef]
  64. Farwanah, H.; Kolter, T. Lipidomics of Glycosphingolipids. Metabolites 2012, 2, 134–164. [Google Scholar] [CrossRef] [PubMed]
  65. Merrill, A.H.; Sullards, M.C.; Allegood, J.C.; Kelly, S.; Wang, E. Sphingolipidomics: High-Throughput, Structure-Specific, and Quantitative Analysis of Sphingolipids by Liquid Chromatography Tandem Mass Spectrometry. Methods 2005, 36, 207–224. [Google Scholar] [CrossRef] [PubMed]
  66. Fuchs, B.; Schiller, J. MALDI-TOF MS, Analysis of Lipids from Cells, Tissues and Body Fluids. In Lipids in Health and Disease. Subcellular Biochemistry; Quinn, P.J., Wang, X., Eds.; Springer: Berlin/Heidelberg, Germany, 2008; Chapter 21; p. 49. [Google Scholar]
  67. Barrientos, R.C.; Zhang, Q. Recent Advances in the Mass Spectrometric Analysis of Glycosphingolipidome—A Review. Anal. Chim. Acta 2020, 1132, 134–155. [Google Scholar] [CrossRef]
  68. Leopold, J.; Popkova, Y.; Engel, K.M.; Schiller, J. Recent Developments of Useful MALDI Matrices for the Mass Spectrometric Characterization of Lipids. Biomolecules 2018, 8, 173. [Google Scholar] [CrossRef] [PubMed]
  69. Levery, S.B. Studies of the Primary and Secondary Structure of Glycosphingolipids. Ph.D. Thesis, University of Washington, Seattle, WA, USA, 1993. [Google Scholar]
  70. Guo, Z. The Structural Diversity of Natural Glycosphingolipids (GSLs). J. Carbohydr. Chem. 2022, 41, 63–154. [Google Scholar] [CrossRef]
  71. Van Eijk, M.; Ferra, M.J.; Boot, R.G.; Aerts, J.M.F.G. Lyso-Glycosphingolipids: Presence and Consequences. Essays Biochem. 2020, 64, 565–578. [Google Scholar]
  72. Pruett, S.T.; Bushnev, A.; Hagedorn, K.; Adiga, M.; Haynes, C.A.; Sullards, M.C.; Liotta, D.C.; Merrill, A.H. Biodiversity of Sphingoid Bases (“sphingosines”) and Related Amino Alcohols. J. Lipid Res. 2008, 49, 1621–1639. [Google Scholar] [CrossRef]
  73. Fernandes, C.M.; Goldman, G.H.; Del Poeta, M. Biological Roles Played by Sphingolipids in Dimorphic and Filamentous Fungi. mBio 2018, 9, e00642-18. [Google Scholar] [CrossRef] [PubMed]
  74. Hannich, J.T.; Umebayashi, K.; Riezman, H. Distribution and Functions of Sterols and Sphingolipids. Cold Spring Harb. Perspect. Biol. 2011, 3, a004762. [Google Scholar] [CrossRef]
  75. Ishibashi, Y.; Kohyama-Koganeya, A.; Hirabayashi, Y. New Insights on Glucosylated Lipids: Metabolism and Functions. Biochim. Biophys. Acta-Mol. Cell Biol. Lipids 2013, 1831, 1475–1485. [Google Scholar] [CrossRef]
  76. Guimaratildes, L.L.; Toledo, M.S.; Ferreira, F.A.S.; Straus, A.H.; Takahashi, H.K. Structural Diversity and Biological Significance of Glycosphingolipids in Pathogenic and Opportunistic Fungi. Front. Cell. Infect. Microbiol. 2014, 4, 138. [Google Scholar]
  77. Gault, C.R.; Obeid, L.M.; Hannun, Y.A. An Overview of Sphingolipid Metabolism: From Synthesis to Breakdown. Adv. Exp. Med. Biol. 2010, 688, 1–23. [Google Scholar] [PubMed]
  78. Merrill, A.H. Sphingolipid and Glycosphingolipid Metabolic Pathways in the Era of Sphingolipidomics. Chem. Rev. 2011, 111, 6387–6422. [Google Scholar] [CrossRef] [PubMed]
  79. Han, X. Lipidomics for Studying Metabolism. Nat. Rev. Endocrinol. 2016, 12, 668–679. [Google Scholar] [CrossRef]
  80. de Haan, N.; Yang, S.; Cipollo, J.; Wuhrer, M. Glycomics Studies Using Sialic Acid Derivatization and Mass Spectrometry. Nat. Rev. Chem. 2020, 4, 229–242. [Google Scholar] [CrossRef]
  81. Schnaar, R.L.; Gerardy-Schahn, R.; Hildebrandt, H. Sialic Acids in the Brain: Gangliosides and Polysialic Acid in Nervous System Development, Stability, Disease, and Regeneration. Physiol. Rev. 2014, 94, 461–518. [Google Scholar] [CrossRef] [PubMed]
  82. Szlasa, W.; Zendran, I.; Zalesińska, A.; Tarek, M.; Kulbacka, J. Lipid Composition of the Cancer Cell Membrane. J. Bioenerg. Biomembr. 2020, 52, 321–342. [Google Scholar] [CrossRef]
  83. Krengel, U.; Bousquet, P.A. Molecular Recognition of Gangliosides and Their Potential for Cancer Immunotherapies. Front. Immunol. 2014, 5, 352. [Google Scholar] [CrossRef] [PubMed]
  84. Hayashi, N.; Chiba, H.; Kuronuma, K.; Go, S.; Hasegawa, Y.; Takahashi, M.; Gasa, S.; Watanabe, A.; Hasegawa, T.; Kuroki, Y.; et al. Detection of N-Glycolyated Gangliosides in Non-Small-Cell Lung Cancer Using GMR8 Monoclonal Antibody. Cancer Sci. 2013, 104, 43–47. [Google Scholar] [CrossRef] [PubMed]
  85. Blanco, R.; Domínguez, E.; Morales, O.; Blanco, D.; Martínez, D.; Rengifo, C.E.; Viada, C.; Cedeño, M.; Rengifo, E.; Carr, A. Prognostic Significance of N-Glycolyl GM3 Ganglioside Expression in Non-Small Cell Lung Carcinoma Patients: New Evidences. Patholog. Res. Int. 2015, 2015, 132326. [Google Scholar] [CrossRef] [PubMed]
  86. Blanco, R.; Rengifo, C.E.; Cedeño, M.; Frómeta, M.; Rengifo, E.; Carr, A. Immunoreactivity of the 14F7 Mab (Raised against N-Glycolyl GM3 Ganglioside) as a Positive Prognostic Factor in Non-Small-Cell Lung Cancer. Patholog. Res. Int. 2012, 2012, 235418. [Google Scholar] [CrossRef] [PubMed]
  87. van Cruijsen, H.; Ruiz, M.; van der Valk, P.; de Gruijl, T.D.; Giaccone, G. Tissue Micro Array Analysis of Ganglioside N-Glycolyl GM3 Expression and Signal Transducer and Activator of Transcription (STAT)-3 Activation in Relation to Dendritic Cell Infiltration and Microvessel Density in Non-Small Cell Lung Cancer. BMC Cancer 2009, 9, 180. [Google Scholar] [CrossRef]
  88. Oliva, J.P.; Valdés, Z.; Casacó, A.; Pimentel, G.; González, J.; Álvarez, I.; Osorio, M.; Velazco, M.; Figueroa, M.; Ortiz, R.; et al. Clinical Evidences of GM3 (NeuGc) Ganglioside Expression in Human Breast Cancer Using the 14F7 Monoclonal Antibody Labelled with 99mTc. Breast Cancer Res. Treat. 2006, 96, 115–121. [Google Scholar] [CrossRef] [PubMed]
  89. Zhong, Y.; Wu, Y.; Li, C.; Tang, J.; Wang, X.; Ren, G.; Carr, A.; Pérez, R.; Guo, W. N-Glycolyl GM3 Ganglioside Immunoexpression in Oral Mucosal Melanomas of Chinese. Oral Dis. 2012, 18, 741–747. [Google Scholar] [CrossRef] [PubMed]
  90. Blanco, R.; Quintana, Y.; Blanco, D.; Cedeño, M.; Rengifo, C.E.; Frómeta, M.; Ríos, M.; Rengifo, E.; Carr, A. Tissue Reactivity of the 14F7 Mab Raised against N-Glycolyl GM3 Ganglioside in Tumors of Neuroectodermal, Mesodermal, and Epithelial Origin. J. Biomarkers 2013, 2013, 602417. [Google Scholar] [CrossRef] [PubMed]
  91. Blanco, R.; Rengifo, E.; Cedeño, M.; Rengifo, C.E.; Alonso, D.F.; Carr, A. Immunoreactivity of the 14F7 Mab Raised against N-Glycolyl GM3 Ganglioside in Epithelial Malignant Tumors from Digestive System. ISRN Gastroenterol. 2011, 2011, 645641. [Google Scholar] [CrossRef]
  92. Blanco, R.; Cedeño, M.; Escobar, X.; Blanco, D.; Rengifo, C.E.; Frómeta, M.; Alvarez, R.I.; Rengifo, E.; Carr, A. Immunorecognition of the 14F7 Mab Raised against N-Glycolyl GM3 Ganglioside in Some Normal and Malignant Tissues from Genitourinary System. ISRN Pathol. 2011, 2011, 953803. [Google Scholar] [CrossRef]
  93. Blanco, R.; Blanco, D.; Quintana, Y.; Escobar, X.; Rengifo, C.E.; Osorio, M.; Gutiérrez, Z.; Lamadrid, J.; Cedeño, M.; Frómeta, M.; et al. Immunoreactivity of the 14F7 Mab Raised against N-Glycolyl GM3 Ganglioside in Primary Lymphoid Tumors and Lymph Node Metastasis. Patholog. Res. Int. 2013, 2013, 920972. [Google Scholar] [CrossRef]
  94. Scursoni, A.M.; Galluzzo, L.; Camarero, S.; Lopez, J.; Lubieniecki, F.; Sampor, C.; Segatori, V.I.; Gabri, M.R.; Alonso, D.F.; Chantada, G.; et al. Detection of N-Glycolyl GM3 Ganglioside in Neuroectodermal Tumors by Immunohistochemistry: An Attractive Vaccine Target for Aggressive Pediatric Cancer. Clin. Dev. Immunol. 2011, 2011, 245181. [Google Scholar] [CrossRef] [PubMed]
  95. Sampor, C.; Guthmann, M.D.; Scursoni, A.; Cacciavillano, W.; Torbidoni, A.; Galluzzo, L.; Camarero, S.; Lopez, J.; de Dávila, M.T.G.; Fainboim, L.; et al. Immune Response to Racotumomab in a Child with Relapsed Neuroblastoma. Front. Oncol. 2012, 2, 195. [Google Scholar] [CrossRef]
  96. Scursoni, A.M.; Galluzzo, L.; Camarero, S.; Pozzo, N.; Gabri, M.R.; De Acosta, C.M.; Vázquez, A.M.; Alonso, D.F.; De Davila, M.T.G. Detection and Characterization of N-Glycolyated Gangliosides in Wilms Tumor by Immunohistochemistry. Pediatr. Dev. Pathol. 2010, 13, 18–23. [Google Scholar] [CrossRef] [PubMed]
  97. Sites, J.B.C.A. Carcinoma Cells: CHEMICAL MAMMALS Identification of 2-Keto-3-Deoxy-D-Glycero-D-Galacto Nononic Acid Acid) Residues in Mammalian Tissues and Human Lung. Histochemistry 1996, 549, 2–6. [Google Scholar]
  98. Go, S.; Sato, C.; Yin, J.; Kannagi, R.; Kitajima, K. Hypoxia-Enhanced Expression of Free Deaminoneuraminic Acid in Human Cancer Cells. Biochem. Biophys. Res. Commun. 2007, 357, 537–542. [Google Scholar] [CrossRef] [PubMed]
  99. Inoue, S.; Lin, S.L.; Chang, T.; Wu, S.H.; Yao, C.W.; Chu, T.Y.; Troy, F.A.; Inoue, Y. Identification of Free Deaminated Sialic Acid (2-Keto-3-Deoxy-D-Glycero-D-Galacto-Nononic Acid) in Human Red Blood Cells and Its Elevated Expression in Fetal Cord Red Blood Cells and Ovarian Cancer Cells. J. Biol. Chem. 1998, 273, 27199–27204. [Google Scholar] [CrossRef]
  100. Yu, R.K.; Tsai, Y.T.; Ariga, T.; Yanagisawa, M. Structures, Biosynthesis, and Functions of Gangliosides-an Overview. J. Oleo Sci. 2011, 60, 537–544. [Google Scholar] [CrossRef]
  101. Hakomori, S. Structure, Organization, and Function of Glycosphingolipids in Membrane. Curr. Opin. Hematol. 2003, 10, 16–24. [Google Scholar] [CrossRef] [PubMed]
  102. Hakomori, S.; Ishizuka, I. Glycolipid: Animal. In Encyclopedia of Life Sciences; Nature Publishing Group: London, UK, 2001. [Google Scholar]
  103. Levery, S.B.; Nudelman, E.D.; Hakomori, S. Novel Modification of Glycosphingolipids by Long-Chain Cyclic Acetals: Isolation and Characterization of Plasmalocerebroside from Human Brain. Biochemistry 1992, 31, 5335–5340. [Google Scholar] [CrossRef]
  104. Kolter, T. Ganglioside Biochemistry. ISRN Biochem. 2012, 2012, 506160. [Google Scholar] [CrossRef] [PubMed]
  105. Mlinac, K.; Fabris, D.; Vukelić, Ž.; Rožman, M.; Heffer, M.; Bognar, S.K. Structural Analysis of Brain Ganglioside Acetylation Patterns in Mice with Altered Ganglioside Biosynthesis. Carbohydr. Res. 2013, 382, 1–8. [Google Scholar] [CrossRef] [PubMed]
  106. Chester, M.A. IUPAC-IUB Joint Commission on Biochemical Nomenclature (JCBN). Nomenclature of Glycolipids--Recommendations 1997. Eur. J. Biochem. 1998, 257, 293–298. [Google Scholar] [PubMed]
  107. Svennerholm, L. The Gangliosides. J. Lipid Res. 1964, 5, 145–155. [Google Scholar] [CrossRef] [PubMed]
  108. Svennerholm, L. Chromatographic Separation of Human Brain Gangliosides. J. Neurochem. 1963, 10, 613–623. [Google Scholar] [CrossRef]
  109. Liebisch, G.; Fahy, E.; Aoki, J.; Dennis, E.A.; Durand, T.; Ejsing, C.S.; Fedorova, M.; Feussner, I.; Griffiths, W.J.; Köfeler, H.; et al. Update on LIPID MAPS Classification, Nomenclature, and Shorthand Notation for MS-Derived Lipid Structures. J. Lipid Res. 2020, 61, 1539–1555. [Google Scholar] [CrossRef]
  110. Domon, B.; Costello, C.E. A Systematic Nomenclature for Carbohydrate Fragmentations in FAB-MS/MS Spectra of Glycoconjugates. Glycoconj. J. 1988, 5, 379–409. [Google Scholar] [CrossRef]
  111. Ann, Q.; Adams, J. Structure Determination of Ceramides and Neutral Glycosphingolipids by Collisional Activation of [M + Li]+ Ions. J. Am. Soc. Mass Spectrom. 1992, 3, 260–263. [Google Scholar] [CrossRef] [PubMed]
  112. Costello, C.E.; Vath, J.E. Tandem Mass Spectrometry of Glycolipids. Methods Enzymol. 1990, 193, 738–768. [Google Scholar]
  113. Hsu, F.F.; Turk, J. Structural Determination of Glycosphingolipids as Lithiated Adducts by Electrospray Ionization Mass Spectrometry Using Low-Energy Collisional-Activated Dissociation on a Triple Stage Quadrupole Instrument. J. Am. Soc. Mass Spectrom. 2001, 12, 61–79. [Google Scholar] [CrossRef] [PubMed]
  114. Harvey, D.J. Matrix-Assisted Laser Desorption/Ionisation Mass Spectrometry of Oligosaccharides and Glycoconjugates. J. Chromatogr. A 1996, 720, 429–446. [Google Scholar] [CrossRef]
  115. Hillenkamp, F.; Karas, M. The MALDI Process and Method. In MALDI MS: A Practical Guide to Instrumentation, Methods and Applications; John Wiley & Sons: Hoboken, NJ, USA, 2007. [Google Scholar]
  116. Krutchinsky, A.N.; Chait, B.T. On the Nature of the Chemical Noise in MALDI Mass Spectra. J. Am. Soc. Mass Spectrom. 2002, 13, 129–134. [Google Scholar] [CrossRef]
  117. Zarei, M.; Bindila, L.; Souady, J.; Dreisewerd, K.; Berkenkamp, S.; Müthing, J.; Peter-Katalinić, J. A Sialylation Study of Mouse Brain Gangliosides by MALDI A-TOF and o-TOF Mass Spectrometry. J. Mass Spectrom. 2008, 43, 716–725. [Google Scholar] [CrossRef]
  118. Bode, L.; Beermann, C.; Mank, M.; Kohn, G.; Boehm, G. Human and Bovine Milk Gangliosides Differ in Their Fatty Acid Composition. J. Nutr. 2004, 134, 3016–3020. [Google Scholar] [CrossRef] [PubMed]
  119. Tajiri, M.; Takeuchi, T.; Wada, Y. Distinct Features of Matrix-Assisted 6 Μm Infrared Laser Desorption/Ionization Mass Spectrometry in Biomolecular Analysis. Anal. Chem. 2009, 81, 6750–6755. [Google Scholar] [CrossRef]
  120. O’Connor, P.B.; Mirgorodskaya, E.; Costello, C.E. High Pressure Matrix-Assisted Laser Desorption/Ionization Fourier Transform Mass Spectrometry for Minimization of Ganglioside Fragmentation. J. Am. Soc. Mass Spectrom. 2002, 13, 402–407. [Google Scholar] [CrossRef] [PubMed]
  121. Penn, S.G.; Cancilla, M.T.; Green, M.K.; Lebrilla, C.B. Direct Comparison of Matrix-Assisted Laser Desorption/Ionisation and Electrospray Ionisation in the Analysis of Gangliosides by Fourier Transform Mass Spectrometry. Eur. J. Mass Spectrom. 1997, 3, 67–79. [Google Scholar] [CrossRef]
  122. Lee, H.; An, H.J.; Lerno, L.A.; German, J.B.; Lebrilla, C.B. Rapid Profiling of Bovine and Human Milk Gangliosides by Matrix-Assisted Laser Desorption/Ionization Fourier Transform Ion Cyclotron Resonance Mass Spectrometry. Int. J. Mass Spectrom. 2011, 305, 138–150. [Google Scholar] [CrossRef]
  123. Sugiyama, E.; Hara, A.; Uemura, K.I.; Taketomi, T. Application of Matrix-Assisted Laser Desorption Ionization Time-of-Flight: Mass Spectrometry with Delayed Ion Extraction to Ganglioside Analyses. Glycobiology 1997, 7, 719–724. [Google Scholar] [CrossRef] [PubMed]
  124. Mank, M.; Stahl, B.; Boehm, G. 2,5-Dihydroxybenzoic Acid Butylamine and Other Ionic Liquid Matrixes for Enhanced MALDI-MS Analysis of Biomolecules. Anal. Chem. 2004, 76, 2938–2950. [Google Scholar] [CrossRef] [PubMed]
  125. Colsch, B.; Woods, A.S. Localization and Imaging of Sialylated Glycosphingolipids in Brain Tissue Sections by MALDI Mass Spectrometry. Glycobiology 2010, 20, 661–667. [Google Scholar] [CrossRef]
  126. Ruh, H.; Sandhoff, R.; Meyer, B.; Gretz, N.; Hopf, C. Quantitative Characterization of Tissue Globotetraosylceramides in a Rat Model of Polycystic Kidney Disease by PrimaDrop Sample Preparation and Indirect High-Performance Thin Layer Chromatography-Matrix-Assisted Laser Desorption/Ionization-Time-of-Flight. Anal. Chem. 2013, 85, 6233–6240. [Google Scholar] [CrossRef]
  127. Zarei, M.; Kirsch, S.; Müthing, J.; Bindila, L.; Peter-Katalinić, J. Automated Normal Phase Nano High Performance Liquid Chromatography/Matrix Assisted Laser Desorption/Ionization Mass Spectrometry for Analysis of Neutral and Acidic Glycosphingolipids. Anal. Bioanal. Chem. 2008, 391, 289–297. [Google Scholar] [CrossRef]
  128. Taketomi, T.; Hara, A.; Uemura, K.I.; Kurahashi, H.; Sugiyama, E. Preparation of Various Lysogangliosides Including Lyso-Fucosyl GM1 and Delayed Extraction Matrix-Assisted Laser Desorption Ionization Time-of-Flight Mass Spectrometric Analysis. J. Biochem. 1997, 121, 264–269. [Google Scholar] [CrossRef] [PubMed]
  129. Lee, D.; Cha, S. 5-Methoxysalicylic Acid Matrix for Ganglioside Analysis with Matrix-Assisted Laser Desorption/Ionization Mass Spectrometry. J. Am. Soc. Mass Spectrom. 2015, 26, 522–525. [Google Scholar] [CrossRef] [PubMed]
  130. Krutchinsky, A.N.; Kalkum, M.; Chait, B.T. Automatic Identification of Proteins with a MALDI-Quadrupole Ion Trap Mass Spectrometer. Anal. Chem. 2001, 73, 5066–5077. [Google Scholar] [CrossRef]
  131. Ivleva, V.B.; Elkin, Y.N.; Budnik, B.A.; Moyer, S.C.; O’Connor, P.B.; Costello, C.E. Coupling Thin-Layer Chromatography with Vibrational Cooling Matrix-Assisted Laser Desorption/Ionization Fourier Transform Mass Spectrometry for the Analysis of Ganglioside Mixtures. Anal. Chem. 2004, 76, 1552–1560. [Google Scholar] [CrossRef]
  132. Kamimiya, H.; Suzuki, Y.; Mathew, A.; Kabayama, K.; Kojima, H.; Kushi, Y. Simple and Rapid Removal of the Interference in Gangliosides Extracted from HPTLC Spot on MALDI-TOF MS Analysis. Anal. Methods 2013, 5, 6617–6621. [Google Scholar]
  133. Mechref, Y.; Novotny, M.V. Matrix-Assisted Laser Desorption/Ionization Mass Spectrometry of Acidic Glycoconjugates Facilitated by the Use of Spermine as a Co-Matrix. J. Am. Soc. Mass Spectrom. 1998, 9, 1293–1302. [Google Scholar] [CrossRef] [PubMed]
  134. Gizaw, S.T.; Ohashi, T.; Tanaka, M.; Hinou, H.; Nishimura, S.I. Glycoblotting Method Allows for Rapid and Efficient Glycome Profiling of Human Alzheimer’s Disease Brain, Serum and Cerebrospinal Fluid towards Potential Biomarker Discovery. Biochim. Biophys. Acta-Gen. Subj. 2016, 1860, 1716–1727. [Google Scholar]
  135. Holst, S.; Stavenhagen, K.; Balog, C.I.A.; Koeleman, C.A.M.; McDonnell, L.M.; Mayboroda, O.A.; Verhoeven, A.; Mesker, W.E.; Tollenaar, R.A.E.M.; Deelder, A.M.; et al. Investigations on Aberrant Glycosylation of Glycosphingolipids in Colorectal Cancer Tissues Using Liquid Chromatography and Matrix-Assisted Laser Desorption Time-of- Flight Mass Spectrometry (MALDI-TOF-MS). Mol. Cell. Proteomics 2013, 12, 3081–3093. [Google Scholar] [CrossRef]
  136. Du, H.; Yu, H.; Ma, T.; Yang, F.; Jia, L.; Zhang, C.; Zhang, J.; Niu, L.; Yang, J.; Zhang, Z.; et al. Analysis of Glycosphingolipid Glycans by Lectin Microarrays. Anal. Chem. 2019, 91, 10663–10671. [Google Scholar] [CrossRef] [PubMed]
  137. Fujiwaki, T.; Yamaguchi, S.; Sukegawa, K.; Taketomi, T. Application of Delayed Extraction Matrix-Assisted Laser Desorption Ionization Time-of-Flight Mass Spectrometry for Analysis of Sphingolipids in Tissues from Sphingolipidosis Patients. J. Chromatogr. B Biomed. Sci. Appl. 1999, 731, 45–52. [Google Scholar] [CrossRef]
  138. Jackson, S.N.; Wang, H.Y.J.; Woods, A.S. Direct Profiling of Lipid Distribution in Brain Tissue Using MALDI-TOFMS. Anal. Chem. 2005, 77, 4523–4527. [Google Scholar] [CrossRef]
  139. Jackson, S.N.; Colsch, B.; Egan, T.; Lewis, E.K.; Schultz, J.A.; Woods, A.S. Gangliosides’ Analysis by MALDI-Ion Mobility MS. Analyst 2011, 136, 463–466. [Google Scholar] [CrossRef]
  140. Ito, E.; Tominaga, A.; Waki, H.; Miseki, K.; Tomioka, A.; Nakajima, K.; Kakehi, K.; Suzuki, M.; Taniguchi, N.; Suzuki, A. Structural Characterization of Monosialo-, Disialo- and Trisialo-Gangliosides by Negative Ion AP-MALDI-QIT-TOF Mass Spectrometry with MS n Switching. Neurochem. Res. 2012, 37, 1315–1324. [Google Scholar] [CrossRef] [PubMed]
  141. Powell, A.K.; Harvey, D.J. Stabilization of Sialic Acids in N-Linked Oligosaccharides and Gangliosides for Analysis by Positive Ion Matrix-Assisted Laser Desorption/Ionization Mass Spectrometry. Rapid Commun. Mass Spectrom. 1996, 10, 1027–1032. [Google Scholar] [CrossRef]
  142. Taketomi, T.; Hara, A.; Uemura, K.I.; Sugiyama, E. Matrix-Assisted Laser Desorption Ionization Time-of-Flight Mass Spectrometric Analysis of Glycosphingolipids Including Gangliosides. Acta Biochim. Pol. 1998, 45, 987–999. [Google Scholar] [CrossRef] [PubMed]
  143. Park, W.; Lee, D.; Cha, S. Differentiation of Ganglioside Isomers by MALDI Tandem Mass Spectrometry with Alkali Earth Metal Additives. Bull. Korean Chem. Soc. 2015, 36, 2272–2277. [Google Scholar] [CrossRef]
  144. Fuchs, B.; Schiller, J. MALDI-TOF MS Analysis of Lipids from Cells, Tissues and Body Fluids. Subcell. Biochem. 2008, 49, 541–565. [Google Scholar] [PubMed]
  145. Fuchs, B.; Müller, K.; Göritz, F.; Blottner, S.; Schiller, J. Characteristic Oxidation Products of Choline Plasmalogens Are Detectable in Cattle and Roe Deer Spermatozoa by MALDI-TOF Mass Spectrometry. Lipids 2007, 42, 991–998. [Google Scholar] [CrossRef] [PubMed]
  146. Fuchs, B.; Schiller, J.; Cross, M.A. Apoptosis-Associated Changes in the Glycerophospholipid Composition of Hematopoietic Progenitor Cells Monitored by 31P NMR Spectroscopy and MALDI-TOF Mass Spectrometry. Chem. Phys. Lipids 2007, 150, 229–238. [Google Scholar] [CrossRef]
  147. Fuchs, B.; Schiller, J.; Wagner, U.; Häntzschel, H.; Arnold, K. The Phosphatidylcholine/Lysophosphatidylcholine Ratio in Human Plasma Is an Indicator of the Severity of Rheumatoid Arthritis: Investigations by 31P NMR and MALDI-TOF MS. Clin. Biochem. 2005, 38, 925–933. [Google Scholar] [CrossRef]
  148. Li, D.; Yi, J.; Han, G.; Qiao, L. MALDI-TOF Mass Spectrometry in Clinical Analysis and Research. ACS Meas. Sci. Au 2022, 2, 385–404. [Google Scholar] [CrossRef]
  149. Hanamatsu, H.; Nishikaze, T.; Miura, N.; Piao, J.; Okada, K.; Sekiya, S.; Iwamoto, S.; Sakamoto, N.; Tanaka, K.; Furukawa, J.I. Sialic Acid Linkage Specific Derivatization of Glycosphingolipid Glycans by Ring-Opening Aminolysis of Lactones. Anal. Chem. 2018, 90, 13193–13199. [Google Scholar] [CrossRef]
  150. Suzuki, A.; Suzuki, M.; Ito, E.; Nitta, T.; Inokuchi, J. ichi Mass Spectrometry of Gangliosides. Methods Mol. Biol. 2018, 1804, 207–221. [Google Scholar]
  151. Nakamura, K.; Suzuki, Y.; Goto-Inoue, N.; Yoshida-Noro, C.; Suzuki, A. Structural Characterization of Neutral Glycosphingolipids by Thin-Layer Chromatography Coupled to Matrix-Assisted Laser Desorption/Ionization Quadrupole Ion Trap Time-of-Flight MS/MS. Anal. Chem. 2006, 78, 5736–5743. [Google Scholar] [CrossRef]
  152. Torretta, E.; Fania, C.; Vasso, M.; Gelfi, C. HPTLC-MALDI MS for (Glyco)Sphingolipid Multiplexing in Tissues and Blood: A Promising Strategy for Biomarker Discovery and Clinical Applications. Electrophoresis 2016, 37, 2036–2049. [Google Scholar] [CrossRef]
  153. QRueda, R.; Puente, R. New data on content and distribution of gangliosides in human milk. Biol. Chem. 1995, 376, 723–727. [Google Scholar]
  154. Ma, L.; Fong, B.Y.; MacGibbon, A.K.H.; Norris, G. Qualitative and Quantitative Study of Glycosphingolipids in Human Milk and Bovine Milk Using High Performance Liquid Chromatography–Data-Dependent Acquisition–Mass Spectrometry. Molecules 2020, 25, 4024. [Google Scholar] [CrossRef] [PubMed]
  155. Ballard, O.; Morrow, A.L. Human Milk Composition. Nutrients and Bioactive Factors. Pediatr. Clin. North Am. 2013, 60, 49–74. [Google Scholar] [CrossRef]
  156. Sipione, S.; Monyror, J. Gangliosides in the brain: Physiology, pathophysiology and therapeutic applications. Front. Neurosci. 2020, 14, 572965. [Google Scholar] [CrossRef]
  157. Ariga, T.; McDonald, M. Role of ganglioside metabolism in the pathogenesis of Alzheimer’s disease–A review. J. Lip. Res. 2008, 49, 1157–1175. [Google Scholar] [CrossRef]
  158. Taki, T. An approach to glycobiology from glycolipidomics: Ganglioside molecular scanning in the brains of patients with Alzheimer’s disease by TLC-Blot/Matrix assisted laser desorption/ionization-time of flight MS. Biol. Pharm. Bull. 2012, 35, 1642–1647. [Google Scholar] [CrossRef] [PubMed]
  159. Yu, R.; Tsai, Y.T. Functional roles of gangliosides in neurodevelopment: An overview of recent advances. Neurochem. Res. 2012, 37, 1230–1244. [Google Scholar] [CrossRef]
  160. Zaprianova, E.; Deleva, D. Serum ganglioside patterns in multiple sclerosis. Nuerochem. Res. 2001, 26, 95–100. [Google Scholar] [CrossRef] [PubMed]
  161. Hakomori, S. Tumor malignancy defined by aberrant glycosylation and sphingo(glyco)lipid metabolism. Cancer Res. 1996, 56, 5309–5318. [Google Scholar] [PubMed]
  162. Taketomi, T.; Sugiyama, E. Extraction and analysis of multiple sphingolipids from a single sample. Meth Enzym. 2000, 312, 80–101. [Google Scholar] [PubMed]
  163. Miller-Podraza, H.; Mansson, J.E. Pentasialogangliosides of human brain. Fed. Europ. Biochem. Soc. 1991, 288, 212–214. [Google Scholar] [CrossRef] [PubMed]
  164. Miller-Podraza, H.; Mansson, J.E. Isolation of complex gangliosides from human brain. Biochim. Biophys. Acta 1992, 1124, 45–51. [Google Scholar] [CrossRef] [PubMed]
  165. Prokazova, N.V.; Samovilova, N.N.; Gracheva, E.V.; Golovanova, N.K. Ganglioside GM3 and Its Biological Functions. Biochemistry 2009, 74, 235–249. [Google Scholar] [CrossRef] [PubMed]
  166. Ngamukote, S.; Yanagisawa, M.; Ariga, T.; Ando, S.; Yu, R.K. Developmental Changes of Glycosphingolipids and Expression of Glycogenes in Mouse Brains. J. Neurochem. 2007, 103, 2327–2341. [Google Scholar] [CrossRef] [PubMed]
  167. Tettamanti, G.; Bonali, F.; Marchesini, S.; Zambotti, V. A New Procedure for the Extraction, Purification and Fractionation of Brain Gangliosides. Biochim. Biophys. Acta (BBA)/Lipids Lipid Metab. 1973, 296, 160–170. [Google Scholar] [CrossRef]
  168. Kracun, I.; Rosner, H.; Drnovsek, V.; Heffer-Lauc, M.; Cosovic, C.; Lauc, G. Human Brain Gangliosides in Development, Aging and Disease. Int. J. Dev. Biol. 1991, 35, 289–295. [Google Scholar] [PubMed]
  169. Svennerholm, L.; Boström, K.; Jungbjer, B.; Olsson, L. Membrane Lipids of Adult Human Brain: Lipid Composition of Frontal and Temporal Lobe in Subjects of Age 20 to 100 Years. J. Neurochem. 1994, 63, 1802–1811. [Google Scholar] [CrossRef]
  170. Huebecker, M.; Moloney, E.B.; Van Der Spoel, A.C.; Priestman, D.A.; Isacson, O.; Hallett, P.J.; Platt, F.M. Reduced Sphingolipid Hydrolase Activities, Substrate Accumulation and Ganglioside Decline in Parkinson’s Disease. Mol. Neurodegener. 2019, 14, 40. [Google Scholar] [CrossRef]
  171. Cartron, J.P.; Colin, Y. Structural and functional diversity of blood group antigens. Transus. Clin. Biol. 2001, 8, 163–199. [Google Scholar] [CrossRef] [PubMed]
  172. Arab, S.; Russel, E.; Chapman, W.B.; Rosen, B.; Lingwood, C.A. Expression of the Verotoxin Receptor Glycolipid, Globotriaosylceramide, in Ovarian Hyperplasias. Oncol. Res. 1997, 9, 553–563. [Google Scholar] [PubMed]
  173. Tyler, A.; Johansson, A.; Karlsson, T.; Gudey, S.K.; Brännström, T.; Grankvist, K.; Behnam-Motlagh, P. Targeting Glucosylceramide Synthase Induction of Cell Surface Globotriaosylceramide (Gb3) in Acquired Cisplatin-Resistance of Lung Cancer and Malignant Pleural Mesothelioma Cells. Exp. Cell Res. 2015, 336, 23–32. [Google Scholar] [CrossRef]
  174. Ferroni, P.; Lenti, L.; Martini, F.; Ciatti, F.; Pontieri, G.M.; Gazzaniga, P.P. Ganglioside Content of Human Platelets-Differences in Resting and Activated Platelets. Thromb. Haemost. 1997, 77, 548–554. [Google Scholar] [CrossRef] [PubMed]
  175. Mazurov, A.V.; Prokazova, N.V.; Mikhailenko, I.A.; Mukjin, D.N.; Repin, V.S.; Bergelson, L.D. Stimulation of Platelet Adhesion and Activation by Ganglioside GD3 Adsorbed to Plastic. BBA-Mol. Cell Res. 1988, 968, 167–171. [Google Scholar] [CrossRef]
  176. Kyogashima, M.; Taketomi, T. Lipids from Human Platelets in Primary Thrombocythemia. Jpn. J. Exp. Med. 1986, 56, 113–118. [Google Scholar] [PubMed]
  177. Kushi, Y.; Arita, M.; Ishizuka, I.; Kasama, T.; Fredman, P.; Handa, S. Sulfatide Is Expressed in Both Erythrocytes and Platelets of Bovine Origin. Biochim. Biophys. Acta-Lipids Lipid Metab. 1996, 1304, 254–262. [Google Scholar] [CrossRef]
  178. Zdebska, E.; Soszyńska, B.; Dobrowolski, Z.; Kościelak, J. The Levels of Glycosphingolipids, Ceramides, Sialic Acid and Glycogen Are Changed in Plasma Membranes of Rat Platelets Harvested during Recovery from Immune-Mediated Thrombocytopenia. Acta Biochim. Pol. 1996, 43, 547–556. [Google Scholar] [CrossRef]
  179. Liu, L.; Zhang, K.; Tan, L.; Chen, Y.H.; Cao, Y.P. Alterations in Cholesterol and Ganglioside GM1 Content of Lipid Rafts in Platelets from Patients with Alzheimer Disease. Alzheimer Dis. Assoc. Disord. 2015, 29, 63–69. [Google Scholar] [CrossRef]
  180. Cooling, L.L.W.; Walker, K.E.; Gille, T.; Koerner, T.A.W. Shiga Toxin Binds Human Platelets via Globotriaosylceramide (P(K) Antigen) and a Novel Platelet Glycosphingolipid. Infect. Immun. 1998, 66, 4355–4366. [Google Scholar] [CrossRef]
  181. Cooling, L.L.W.; Zhang, D.S.; Koerner, T.A.W. Human Platelets Express Gangliosides with LKE Activity and ABH Blood Group Activity. Transfusion 2001, 41, 504–516. [Google Scholar] [CrossRef] [PubMed]
  182. Sasaki, N.; Toyoda, M. Vascular diseases and gangliosides. Int. J. Mol. Sci. 2019, 20, 6362. [Google Scholar] [CrossRef]
  183. Miller-Podraza, H.; Johanssons, L. A strain of human influenza A virus binds to extended but not short gangliosides as assayed by thin-layer chromatography overlay. Glycobiology 2000, 10, 975–982. [Google Scholar] [CrossRef]
  184. Nimrichter, L.; Burdick, M.M.; Aoki, K.; Laroy, W.; Fierro, M.A.; Hudson, S.A.; Von Seggern, C.E.; Cotter, R.J.; Bochner, B.S.; Tiemeyer, M.; et al. E-Selectin Receptors on Human Leukocytes. Blood 2008, 112, 3744–3752. [Google Scholar] [CrossRef] [PubMed]
  185. Hakomori, S. Glycosphingolipids in cellular interaction, differentiation, and oncogenesis. Ann. Rev. Biochem. 1981, 50, 733–764. [Google Scholar] [CrossRef]
  186. Filho, J.A.F.; Shapiro, B.E. Tay-Sachs Disease. Arch. Neurol. 2004, 61, 1466–1468. [Google Scholar] [CrossRef] [PubMed]
  187. Vanier, M.T. Niemann–Pick Disease Type C–Mini Review. Clin Genet 2003, 64, 269–281. [Google Scholar] [CrossRef] [PubMed]
  188. Kohlschütter, A.; Eichler, F. Childhood Leukodystrophies: A Clinical Perspective. Expert Rev. Neurother. 2011, 11, 1485–1496. [Google Scholar] [CrossRef]
  189. Nagral, A. Gaucher Disease. J. Clin. Exp. Hepatol. 2014, 4, 37–50. [Google Scholar] [CrossRef]
  190. Ehlert, K.; Frosch, M.; Fehse, N.; Zander, A.; Roth, J.; Vormoor, J. Farber Disease: Clinical Presentation, Pathogenesis and a New Approach to Treatment. Pediatr. Rheumatol. 2007, 5, 15. [Google Scholar] [CrossRef] [PubMed]
  191. Clarke, J.T.R. Narrative Review: Fabry Disease. Ann. Intern. Med. 2007, 146, 425–433. [Google Scholar] [CrossRef] [PubMed]
  192. Furukawa, K.; Hamamura, K.; Aixinjueluo, W.; Furukawa, K. Biosignals Modulated by Tumor-Associated Carbohydrate Antigens: Novel Targets for Cancer Therapy. Ann. N. Y. Acad. Sci. 2006, 1086, 185–198. [Google Scholar] [CrossRef]
  193. Groux-Degroote, S.; Guérardel, Y.; Delannoy, P. Gangliosides: Structures, Biosynthesis, Analysis, and Roles in Cancer. ChemBioChem 2017, 18, 1146–1154. [Google Scholar] [CrossRef] [PubMed]
  194. Zhang, S.; Cordon-Cardo, C.; Zhang, H.S.; Reuter, V.E.; Adluri, S.; Hamilton, W.B.; Lloyd, K.O.; Livingiston, P.O. Selection of Tumor Antigens as Targets for Immune Attack Using Immunohistochemistry: I. Focus on Gangliosides. Int. J. Cancer 1997, 73, 42–49. [Google Scholar] [CrossRef]
  195. Ho, M.Y.; Yu, A.L.; Yu, J. Glycosphingolipid Dynamics in Human Embryonic Stem Cell and Cancer: Their Characterization and Biomedical Implications. Glycoconj. J. 2017, 34, 765–777. [Google Scholar] [CrossRef] [PubMed]
  196. Yu, A.L.; Hung, J.T.; Ho, M.Y.; Yu, J. Alterations of Glycosphingolipids in Embryonic Stem Cell Differentiation and Development of Glycan-Targeting Cancer Immunotherapy. Stem Cells Dev. 2016, 25, 1532–1548. [Google Scholar] [CrossRef]
  197. Liang, Y.J.; Ding, Y.; Levery, S.B.; Lobaton, M.; Handa, K.; Hakomori, S.I. Differential Expression Profiles of Glycosphingolipids in Human Breast Cancer Stem Cells vs. Cancer Non-Stem Cells. Proc. Natl. Acad. Sci. USA 2013, 110, 4968–4973. [Google Scholar] [CrossRef]
  198. Nazha, B.; Inal, C.; Owonikoko, T.K. Disialoganglioside GD2 Expression in Solid Tumors and Role as a Target for Cancer Therapy. Front. Oncol. 2020, 10, 1000. [Google Scholar] [CrossRef] [PubMed]
  199. Liu, J.; Zheng, X.; Pang, X.; Li, L.; Wang, J.; Yang, C.; Du, G. Ganglioside GD3 Synthase (GD3S), a Novel Cancer Drug Target. Acta Pharm. Sin. B 2018, 8, 713–720. [Google Scholar] [CrossRef] [PubMed]
  200. Ramos, R.I.; Bustos, M.A.; Wu, J.; Jones, P.; Chang, S.C.; Kiyohara, E.; Tran, K.; Zhang, X.; Stern, S.L.; Izraely, S.; et al. Upregulation of Cell Surface GD3 Ganglioside Phenotype Is Associated with Human Melanoma Brain Metastasis. Mol. Oncol. 2020, 14, 1760–1778. [Google Scholar] [CrossRef]
  201. Chang, W.W.; Chien, H.L.; Lee, P.; Lin, J.; Hsu, C.W.; Hung, J.T.; Lin, J.J.; Yu, J.C.; Shao, L.E.; Yu, J.; et al. Expression of Globo H and SSEA3 in Breast Cancer Stem Cells and the Involvement of Fucosyl Transferases 1 and 2 in Globo H Synthesis. Proc. Natl. Acad. Sci. USA 2008, 105, 11667–11672. [Google Scholar] [CrossRef]
  202. Kuo, H.H.; Lin, R.J.; Hung, J.T.; Hsieh, C.B.; Hung, T.H.; Lo, F.Y.; Ho, M.Y.; Yeh, C.T.; Huang, Y.L.; Yu, J.; et al. High Expression FUT1 and B3GALT5 Is an Independent Predictor of Postoperative Recurrence and Survival in Hepatocellular Carcinoma. Sci. Rep. 2017, 7, 10750. [Google Scholar] [CrossRef] [PubMed]
  203. Steenackers, A.; Vanbeselaere, J.; Cazet, A.; Bobowski, M.; Rombouts, Y.; Colomb, F.; Le Bourhis, X.; Guérardel, Y.; Delannoy, P. Accumulation of Unusual Gangliosides G Q3 and G P3 in Breast Cancer Cells Expressing the G D3 Synthase. Molecules 2012, 17, 9559–9572. [Google Scholar] [CrossRef] [PubMed]
  204. Zhuo, D.; Li, X.; Guan, F. Biological Roles of Aberrantly Expressed Glycosphingolipids and Related Enzymes in Human Cancer Development and Progression. Front. Physiol. 2018, 9, 466. [Google Scholar] [CrossRef]
  205. Yu, J.; Hung, J.T.; Wang, S.H.; Cheng, J.Y.; Yu, A.L. Targeting Glycosphingolipids for Cancer Immunotherapy. FEBS Lett. 2020, 594, 3602–3618. [Google Scholar] [CrossRef] [PubMed]
  206. Zhang, S.; Zhang, H.S.; Reuter, V.E.; Slovin, S.F.; Scher, H.I.; Livingston, P.O. Expression of Potential Target Antigens for Immunotherapy on Primary and Metastatic Prostate Cancers. Clin. Cancer Res. 1998, 4, 295–302. [Google Scholar]
  207. Lou, Y.W.; Wang, P.Y.; Yeh, S.C.; Chuang, P.K.; Li, S.T.; Wu, C.Y.; Khoo, K.H.; Hsiao, M.; Hsu, T.L.; Wong, C.H. Stage-Specific Embryonic Antigen-4 as a Potential Therapeutic Target in Glioblastoma Multiforme and Other Cancers. Proc. Natl. Acad. Sci. USA 2014, 111, 2482–2487. [Google Scholar] [CrossRef]
  208. Korekane, H.; Tsuji, S.; Noura, S.; Ohue, M.; Sasaki, Y.; Imaoka, S.; Miyamoto, Y. Novel Fucogangliosides Found in Human Colon Adenocarcinoma Tissues by Means of Glycomic Analysis. Anal. Biochem. 2007, 364, 37–50. [Google Scholar] [CrossRef]
  209. Kohla, G.; Stockfleth, E.; Schauer, R. Gangliosides with O-Acetylated Sialic Acids in Tumors of Neuroectodermal Origin. Neurochem. Res. 2002, 27, 583–592. [Google Scholar] [CrossRef] [PubMed]
  210. Nakayama, T.; Watanabe, M.; Katsumata, T.; Teramoto, T.; Kitajima, M. Expression of Sialyl Lewisa as a New Prognostic Factor for Patients with Advanced Colorectal Carcinoma. Cancer 1995, 75, 2051–2056. [Google Scholar] [CrossRef] [PubMed]
  211. Kannagi, R. Molecular Mechanism for Cancer-Associated Induction of Sialyl Lewis X and Sialyl Lewis A Expression-The Warburg Effect Revisited. Glycoconj. J. 2003, 20, 353–364. [Google Scholar] [CrossRef]
  212. Nudelman, E.; Fukushi, Y.; Levery, S.B.; Higuchi, T.; Hakomori, S. Novel Fucolipids of Human Adenocarcinoma: Disialosyl Lea Antigen (III4FucIII6NeuAcIV3NeuAcLc4) of Human Colonic Adenocarcinoma and the Monoclonal Antibody (FH7) Defining This Structure. J. Biol. Chem. 1986, 261, 5487–5495. [Google Scholar] [CrossRef]
  213. Miyazaki, K.; Ohmori, K.; Izawa, M.; Koike, T.; Kumamoto, K.; Furukawa, K.; Ando, T.; Kiso, M.; Yamaji, T.; Hashimoto, Y.; et al. Loss of Disialyl Lewisa, the Ligand for Lymphocyte Inhibitory Receptor Sialic Acid-Binding Immunoglobulin-like Lectin-7 (Siglec-7) Associated with Increased Sialyl Lewisa Expression on Human Colon Cancers. Cancer Res. 2004, 64, 4498–4505. [Google Scholar] [CrossRef] [PubMed]
  214. Tsuchida, A.; Okajima, T.; Furukawa, K.; Ando, T.; Ishida, H.; Yoshida, A.; Nakamura, Y.; Kannagi, R.; Kiso, M.; Furukawa, K. Synthesis of Disialyl Lewis a (Lea) Structure in Colon Cancer Cell Lines by a Sialyltransferase, ST6GalNAc VI, Responsible for the Synthesis of α-Series Gangliosides. J. Biol. Chem. 2003, 278, 22787–22794. [Google Scholar] [CrossRef]
  215. Hakomori, S.I. Aberrant Glycosylation in Cancer Cell Membranes as Focused on Glycolipids: Overview and Perspectives. Cancer Res. 1985, 45, 2405–2414. [Google Scholar] [PubMed]
  216. Serb, A.F.; Novaconi, C. Preliminary analysis of the glycolipid profile in secondary brain tumors. Biomed Res. Int. 2022, 2022, 4293172. [Google Scholar] [CrossRef]
  217. Yabu, M.; Korekane, H. Occurrence of free deaminoneuraminic acid (KDN)-containing complex-type N-glycans in human prostate cancers. Glycobiology 2013, 23, 634–642. [Google Scholar] [CrossRef]
  218. Wang, F.; Xie, B. LC-MS/MS glycomic analyses of free and conjugated forms of the sialic acids, Neu5Ac, Neu5Gc and KDN in human throat cancers. Glycobiology 2015, 25, 1362–1374. [Google Scholar] [CrossRef]
  219. Hakomori, S. itiroh Functional Role of Glycosphingolipids in Tumor Progression. Tohoku J. Exp. Med. 1992, 168, 211–222. [Google Scholar] [CrossRef] [PubMed]
  220. Patwardhan, G.A.; Liu, Y.Y. Sphingolipids and Expression Regulation of Genes in Cancer. Prog. Lipid Res. 2011, 50, 104–114. [Google Scholar] [CrossRef]
  221. Yin, J.; Miyazaki, K.; Shaner, R.L.; Merrill, A.H.; Kannagi, R. Altered Sphingolipid Metabolism Induced by Tumor Hypoxia-New Vistas in Glycolipid Tumor Markers. FEBS Lett. 2010, 584, 1872–1878. [Google Scholar] [CrossRef] [PubMed]
  222. Ghosh, S. Sialic Acids and Sialoglycoconjugates in Cancer. In Sialic Acids and Sialoglycoconjugates in the Biology of Life, Health and Disease; Academic Press: Cambridge, MA, USA, 2020; pp. 211–245. [Google Scholar]
  223. Samraj, A.N.; Läubli, H.; Varki, N.; Varki, A. Involvement of a non-human sialic Acid in human cancer. Front. Oncol. 2014, 4, 33. [Google Scholar] [CrossRef] [PubMed]
  224. Reymond, N.; D’Água, B.B.; Ridley, A.J. Crossing the Endothelial Barrier during Metastasis. Nat. Rev. Cancer 2013, 13, 858–870. [Google Scholar] [CrossRef] [PubMed]
  225. Kannagi, R.; Izawa, M.; Koike, T.; Miyazaki, K.; Kimura, N. Carbohydrate-Mediated Cell Adhesion in Cancer Metastasis and Angiogenesis. Cancer Sci. 2004, 95, 377–384. [Google Scholar] [CrossRef] [PubMed]
  226. Belarbi, K.; Cuvelier, E. Glycosphingolipids and neuroinflammation in Parkinson’s disease. Mol. Neurodegen. 2020, 15, 59. [Google Scholar] [CrossRef]
  227. Savica, R.; Murray, M.E.; Persson, X.M.; Kantarci, K.; Parisi, J.E.; Dickson, D.W.; Petersen, R.C.; Ferman, T.J.; Boeve, B.F.; Mielke, M.M. Plasma Sphingolipid Changes with Autopsy-Confirmed Lewy Body or Alzheimer’s Pathology. Alzheimer’s Dement. Diagnosis Assess. Dis. Monit. 2016, 3, 43–50. [Google Scholar] [CrossRef] [PubMed]
  228. Han, X.; Rozen, S.; Boyle, S.H.; Hellegers, C.; Cheng, H.; Burke, J.R.; Welsh-Bohmer, K.A.; Doraiswamy, P.M.; Kaddurah-Daouk, R. Metabolomics in Early Alzheimer’s Disease: Identification of Altered Plasma Sphingolipidome Using Shotgun Lipidomics. PLoS ONE 2011, 6, e21643. [Google Scholar] [CrossRef]
  229. Kim, M.; Nevado-Holgado, A.; Whiley, L.; Snowden, S.G.; Soininen, H.; Kloszewska, I.; Mecocci, P.; Tsolaki, M.; Vellas, B.; Thambisetty, M.; et al. Association between Plasma Ceramides and Phosphatidylcholines and Hippocampal Brain Volume in Late Onset Alzheimer’s Disease. J. Alzheimer’s Dis. 2017, 60, 809–817. [Google Scholar] [CrossRef]
  230. Matsuzaki, K. How Do Membranes Initiate Alzheimers Disease? Formation of Toxic Amyloid Fibrils by the Amyloid β-Protein on Ganglioside Clusters. Acc. Chem. Res. 2014, 47, 2397–2404. [Google Scholar] [CrossRef]
  231. Ke, P.C.; Sani, M.A.; Ding, F.; Kakinen, A.; Javed, I.; Separovic, F.; Davis, T.P.; Mezzenga, R. Implications of Peptide Assemblies in Amyloid Diseases. Chem. Soc. Rev. 2017, 46, 6492–6531. [Google Scholar] [CrossRef]
  232. Kotler, S.A.; Walsh, P.; Brender, J.R.; Ramamoorthy, A. Differences between Amyloid-β Aggregation in Solution and on the Membrane: Insights into Elucidation of the Mechanistic Details of Alzheimer’s Disease. Chem. Soc. Rev. 2014, 43, 6692–6700. [Google Scholar] [CrossRef]
  233. Matsuzaki, K. Formation of Toxic Amyloid Fibrils by Amyloid β-Protein on Ganglioside Clusters. Int. J. Alzheimers. Dis. 2011, 2011, 956104. [Google Scholar] [CrossRef]
  234. Korshavn, K.J.; Satriano, C.; Lin, Y.; Zhang, R.; Dulchavsky, M.; Bhunia, A.; Ivanova, M.I.; Lee, Y.H.; La Rosa, C.; Lim, M.H.; et al. Reduced Lipid Bilayer Thickness Regulates the Aggregation and Cytotoxicity of Amyloid-β. J. Biol. Chem. 2017, 292, 4638–4650. [Google Scholar] [CrossRef] [PubMed]
  235. Matsuzaki, K.; Kato, K.; Yanagisawa, K. Aβ Polymerization through Interaction with Membrane Gangliosides. Biochim. Biophys. Acta-Mol. Cell Biol. Lipids 2010, 1801, 868–877. [Google Scholar] [CrossRef]
  236. Sahoo, B.R.; Genjo, T.; Cox, S.J.; Stoddard, A.K.; Anantharamaiah, G.M.; Fierke, C.; Ramamoorthy, A. Nanodisc-Forming Scaffold Protein Promoted Retardation of Amyloid-Beta Aggregation. J. Mol. Biol. 2018, 430, 4230–4244. [Google Scholar] [CrossRef]
  237. Matsuzaki, K. Aβ–Ganglioside Interactions in the Pathogenesis of Alzheimer’s Disease. Biochim. Biophys. Acta-Biomembr. 2020, 1862, 183233. [Google Scholar] [CrossRef]
  238. Kumar, M.; Ivanova, M.I.; Ramamoorthy, A. Non-Micellar Ganglioside GM1 Induces an Instantaneous Conformational Change in Aβ42 Leading to the Modulation of the Peptide Amyloid-Fibril Pathway. Biophys. Chem. 2023, 301, 107091. [Google Scholar] [CrossRef] [PubMed]
  239. Matsuzaki, K.; Noguch, T.; Wakabayashi, M.; Ikeda, K.; Okada, T.; Ohashi, Y.; Hoshino, M.; Naiki, H. Inhibitors of Amyloid β-Protein Aggregation Mediated by GM1-Containing Raft-like Membranes. Biochim. Biophys. Acta-Biomembr. 2007, 1768, 122–130. [Google Scholar] [CrossRef]
  240. Kreutz, F.; Scherer, E.B.; Ferreira, A.G.K.; Petry, F.D.S.; Pereira, C.L.; Santana, F.; De Souza Wyse, A.T.; Salbego, C.G.; Trindade, V.M.T. Alterations on Na+,K+-ATPase and Acetylcholinesterase Activities Induced by Amyloid-β Peptide in Rat Brain and GM1 Ganglioside Neuroprotective Action. Neurochem. Res. 2013, 38, 2342–2350. [Google Scholar] [CrossRef] [PubMed]
  241. Yang, R.; Wang, Q.; Min, L.; Sui, R.; Li, J.; Liu, X. Monosialoanglioside Improves Memory Deficits and Relieves Oxidative Stress in the Hippocampus of Rat Model of Alzheimer’s Disease. Neurol. Sci. 2013, 34, 1447–1451. [Google Scholar] [CrossRef]
  242. Huang, M.; Hu, M.; Song, Q.; Song, H.; Huang, J.; Gu, X.; Wang, X.; Chen, J.; Kang, T.; Feng, X.; et al. GM1-Modified Lipoprotein-like Nanoparticle: Multifunctional Nanoplatform for the Combination Therapy of Alzheimer’s Disease. ACS Nano 2015, 9, 10801–10816. [Google Scholar] [CrossRef]
  243. Farrall, A.J.; Wardlaw, J.M. Blood-Brain Barrier: Ageing and Microvascular Disease-Systematic Review and Meta-Analysis. Neurobiol. Aging 2009, 30, 337–352. [Google Scholar] [CrossRef]
  244. Ledeen, R.; Chowdhury, S. Gangliosides in Neurodegenerative Diseases. In Advances in Neurobiology; Springer International Publishing: Berlin/Heidelberg, Germany, 2023; Volume 29, pp. 391–418. [Google Scholar]
  245. Akram, M.; Iqbal, M. Awareness and current knowledge of breast cancer. Biol. Res. 2017, 50, 33. [Google Scholar] [CrossRef] [PubMed]
  246. Giussani, P.; Prinetti, A.; Tringali, C. The Role of Sphingolipids in Cancer Immunotherapy. Int. J. Mol. Sci. 2021, 22, 6492. [Google Scholar] [CrossRef]
  247. Marquina, G.; Waki, H.; Fernandez, L.E.; Kon, K.; Carr, A.; Valiente, O.; Perez, R.; Ando, S. Gangliosides Expressed in Human Breast Cancer. Cancer Res. 1996, 56, 5165–5171. [Google Scholar] [PubMed]
  248. Ruckhäberle, E.; Karn, T.; Rody, A.; Hanker, L.; Gätje, R.; Metzler, D.; Holtrich, U.; Kaufmann, M. Gene Expression of Ceramide Kinase, Galactosyl Ceramide Synthase and Ganglioside GD3 Synthase Is Associated with Prognosis in Breast Cancer. J. Cancer Res. Clin. Oncol. 2009, 135, 1005–1013. [Google Scholar] [CrossRef]
  249. Battula, V.L.; Shi, Y.; Evans, K.W.; Wang, R.Y.; Spaeth, E.L.; Jacamo, R.O.; Guerra, R.; Sahin, A.A.; Marini, F.C.; Hortobagyi, G.; et al. Ganglioside GD2 Identifies Breast Cancer Stem Cells and Promotes Tumorigenesis. J. Clin. Investig. 2012, 122, 2066–2078. [Google Scholar] [CrossRef] [PubMed]
  250. Liang, Y.J. Glycosphingolipids in Human Embryonic Stem Cells and Breast Cancer Stem Cells, and Potential Cancer Therapy Strategies Based on Their Structures and Functions. Glycoconj. J. 2022, 39, 177–195. [Google Scholar] [CrossRef]
  251. Shao, C.; Anand, V.; Andreeff, M.; Battula, V.L. Ganglioside GD2: A Novel Therapeutic Target in Triple-Negative Breast Cancer. Ann. N. Y. Acad. Sci. 2022, 1508, 35–53. [Google Scholar] [CrossRef]
  252. Cheng, J.Y.; Hung, J.T.; Lin, J.; Lo, F.Y.; Huang, J.R.; Chiou, S.P.; Wang, Y.H.; Lin, R.J.; Wu, J.C.; Yu, J.; et al. O-Acetyl-GD2 as a Therapeutic Target for Breast Cancer Stem Cells. Front. Immunol. 2022, 12, 791551. [Google Scholar] [CrossRef]
  253. Ly, S.; Anand, V.; El-Dana, F.; Nguyen, K.; Cai, Y.; Cai, S.; Piwnica-Worms, H.; Tripathy, D.; Sahin, A.A.; Andreeff, M.; et al. Anti-GD2 Antibody Dinutuximab Inhibits Triple-Negative Breast Tumor Growth by Targeting GD2+ Breast Cancer Stem-like Cells. J. Immunother. Cancer 2021, 9, e001197. [Google Scholar] [CrossRef]
  254. Seitz, C.M.; Schroeder, S.; Knopf, P.; Krahl, A.C.; Hau, J.; Schleicher, S.; Martella, M.; Quintanilla-Martinez, L.; Kneilling, M.; Pichler, B.; et al. GD2-Targeted Chimeric Antigen Receptor T Cells Prevent Metastasis Formation by Elimination of Breast Cancer Stem-like Cells. Oncoimmunology 2020, 9, 1683345. [Google Scholar] [CrossRef] [PubMed]
  255. Li, Q.; Sun, M.; Yu, M.; Fu, Q.; Jiang, H.; Yu, G.; Li, G. Gangliosides Profiling in Serum of Breast Cancer Patient: GM3 as a Potential Diagnostic Biomarker. Glycoconj. J. 2019, 36, 419–428. [Google Scholar] [CrossRef] [PubMed]
  256. Cavdarli, S.; Dewald, J.H.; Yamakawa, N.; Guérardel, Y.; Terme, M.; Le Doussal, J.M.; Delannoy, P.; Groux-Degroote, S. Identification of 9-O-Acetyl-N-Acetylneuraminic Acid (Neu5,9Ac 2) as Main O-Acetylated Sialic Acid Species of GD2 in Breast Cancer Cells. Glycoconj. J. 2019, 36, 79–90. [Google Scholar] [CrossRef] [PubMed]
  257. Valdes-Zayas, A.; Gonzalez, Z.; Mulens, V.; Vega, A.M.; Perez, K.; Lorenzo-Luaces, P.; Rubio, M.C.; Estevez, A.; Curbelo, I.; Fernandez, L.E.; et al. Immunologic Response Elicited in Breast Cancer Patients Receiving a NeuGcGM3-Based Vaccine as Adjuvant Therapy. J. Immunother. 2017, 40, 289–301. [Google Scholar] [CrossRef] [PubMed]
  258. Orsi, G.; Barbolini, M.; Ficarra, G.; Tazzioli, G.; Manni, P.; Petrachi, T.; Mastrolia, I.; Orvieto, E.; Spano, C.; Prapa, M.; et al. GD2 Expression in Breast Cancer. Oncotarget 2017, 8, 31592–31600. [Google Scholar] [CrossRef]
  259. Sarkar, T.R.; Battula, V.L.; Werden, S.J.; Vijay, G.V.; Ramirez-Peña, E.Q.; Taube, J.H.; Chang, J.T.; Miura, N.; Porter, W.; Sphyris, N.; et al. GD3 Synthase Regulates Epithelial-Mesenchymal Transition and Metastasis in Breast Cancer. Oncogene 2015, 34, 2958–2967. [Google Scholar] [CrossRef] [PubMed]
  260. Liang, Y.J.; Wang, C.Y.; Wang, I.A.; Chen, Y.W.; Li, L.T.; Lin, C.Y.; Ho, M.Y.; Chou, T.L.; Wang, Y.H.; Chiou, S.P.; et al. Interaction of Glycosphingolipids GD3 and GD2 with Growth Factor Receptors Maintains Breast Cancer Stem Cell Phenotype. Oncotarget 2017, 8, 47454–47473. [Google Scholar] [CrossRef]
  261. Ha, S.H.; Lee, J.M.; Kwon, K.M.; Kwak, C.H.; Abekura, F.; Park, J.Y.; Cho, S.H.; Lee, K.; Chang, Y.C.; Lee, Y.C.; et al. Exogenous and Endogeneous Disialosyl Ganglioside GD1b Induces Apoptosis of MCF-7 Human Breast Cancer Cells. Int. J. Mol. Sci. 2016, 17, 652. [Google Scholar] [CrossRef]
  262. Cheung, S.K.C.; Chuang, P.K.; Huang, H.W.; Hwang-Verslues, W.W.; Cho, C.H.H.; Yang, W.; Shen, C.N.; Hsiao, M.; Hsu, T.L.; Chang, C.F.; et al. Stage-Specific Embryonic Antigen-3 (SSEA-3) and Β3GalT5 Are Cancer Specific and Significant Markers for Breast Cancer Stem Cells. Proc. Natl. Acad. Sci. USA 2016, 113, 960–965. [Google Scholar] [CrossRef] [PubMed]
  263. Vandermeersch, S.; Vanbeselaere, J.; Delannoy, C.P.; Drolez, A.; Mysiorek, C.; Guérardel, Y.; Delannoy, P.; Julien, S. Accumulation of GD1α Ganglioside in MDA-MB-231 Breast Cancer Cells Expressing ST6GalNAc V. Molecules 2015, 20, 6913–6924. [Google Scholar] [CrossRef]
  264. Cheng, J.Y.; Wang, S.H.; Lin, J.; Tsai, Y.C.; Yu, J.; Wu, J.C.; Hung, J.T.; Lin, J.J.; Wu, Y.Y.; Yeh, K.T.; et al. Globo-H Ceramide Shed from Cancer Cells Triggers Translin-Associated Factor X-Dependent Angiogenesis. Cancer Res. 2014, 74, 6856–6866. [Google Scholar] [CrossRef] [PubMed]
  265. Cavdarli, S.; Yamakawa, N. Profiling of O-acetylated gangliosides expressed in neurectoderm derived cells. Int. J. Mol. Sci. 2020, 21, 370. [Google Scholar] [CrossRef] [PubMed]
  266. Cazet, A.; Bobowski, M. The ganglioside GD2 induces the constitutive activation of c-Met in MDA-MB-231 breast cancer cells expressing GD3 synthase. Glycobiology 2012, 22, 806–816. [Google Scholar] [CrossRef]
  267. Alvarez-Rueda, N.; Desselle, A. A monoclonal antibody to O-acetyl-GD2 ganglioside and not to GD2 shows potent anti-tumor activity without peripheral nervous system cross-reactivity. PLoS ONE 2011, 6, e25220. [Google Scholar] [CrossRef]
  268. Cochonneau, D.; Terme, M. Cell cycle arrest and apoptosis induced by O-acetyl-GD2-specific monoclonal antibody 8B6 inhibits tumor growth in vitro and in vivo. Cancer Lett. 2013, 333, 194–204. [Google Scholar] [CrossRef] [PubMed]
  269. Dewald, J.; Cavdarli, S. TNF differentially regulates ganglioside biosynthesis and expression in breast cancer cell lines. PLoS ONE 2018, 13, e0196369. [Google Scholar] [CrossRef] [PubMed]
  270. Bobowski, M.; Cazet, A.; Steenackers, A.; Delannoy, P. Role of complex gangliosides in cancer progression. Carbohydr. Chem. 2012, 37, 1–20. [Google Scholar]
  271. Kniep, B.; Kniep, E.; Özkucur, N.; Barz, S.; Bachmann, M.; Malisan, F.; Testi, R.; Rieber, E.P. 9-O-Acetyl GD3 Protects Tumor Cells from Apoptosis. Int. J. Cancer 2006, 119, 67–73. [Google Scholar] [CrossRef] [PubMed]
  272. Malisan, F.; Franchi, L.; Tomassini, B.; Ventura, N.; Condò, I.; Rippo, M.R.; Rufini, A.; Liberati, L.; Nachtigall, C.; Kniep, B.; et al. Acetylation Suppresses the Proapoptotic Activity of GD3 Ganglioside. J. Exp. Med. 2002, 196, 1535–1541. [Google Scholar] [CrossRef] [PubMed]
  273. Kristal, B.S.; Brown, A.M. Apoptogenic Ganglioside GD3 Directly Induces the Mitochondrial Permeability Transition. J. Biol. Chem. 1999, 274, 23169–23175. [Google Scholar] [CrossRef]
  274. Sa, G.; Das, T.; Moon, C.; Hilston, C.M.; Rayman, P.A.; Rini, B.I.; Tannenbaum, C.S.; Finke, J.H. GD3 an Overexpressed Tumor-Derived Ganglioside, Mediatesthe Apoptosis of Activated but Not Resting T Cells. Cancer Res. 2009, 69, 3095–3104. [Google Scholar] [CrossRef] [PubMed]
  275. Terme, M.; Dorvillius, M.; Cochonneau, D.; Chaumette, T.; Xiao, W.; Diccianni, M.B.; Barbet, J.; Yu, A.L.; Paris, F.; Sorkin, L.S.; et al. Chimeric Antibody c.8B6 to O-Acetyl-GD2 Mediates the Same Efficient Anti-Neuroblastoma Effects as Therapeutic Ch14.18 Antibody to GD2 without Antibody Induced Allodynia. PLoS ONE 2014, 9, e87210. [Google Scholar] [CrossRef] [PubMed]
  276. Johnsen, J.I.; Dyberg, C. Neuroblastoma–A neural crest derived embryonal malignancy. Front. Mol. Neurosci. 2019, 12, 9. [Google Scholar] [CrossRef] [PubMed]
  277. Mehta, A.; Herrera, H.; Block, T. Glycosylation and Liver Cancer. In Advances in Cancer Research; Elsevier: Amsterdam, The Netherlands, 2015; Volume 126, pp. 257–279. [Google Scholar]
  278. Zhu, J.; Wang, Y.; Yu, Y.; Wang, Z.; Zhu, T.; Xu, X.; Liu, H.; Hawke, D.; Zhou, D.; Li, Y. Aberrant Fucosylation of Glycosphingolipids in Human Hepatocellular Carcinoma Tissues. Liver Int. 2014, 34, 147–160. [Google Scholar] [CrossRef]
  279. Feng, X.; Zhao, L.; Gao, S.; Song, X.; Dong, W.; Zhao, Y.; Zhou, H.; Cheng, L.; Miao, X.; Jia, L. Increased Fucosylation Has a Pivotal Role in Multidrug Resistance of Breast Cancer Cells through MiR-224-3p Targeting FUT4. Gene 2016, 578, 232–241. [Google Scholar] [CrossRef] [PubMed]
  280. Tan, K.P.; Ho, M.Y.; Cho, H.C.; Yu, J.; Hung, J.T.; Yu, A.L.T. Fucosylation of LAMP-1 and LAMP-2 by FUT1 Correlates with Lysosomal Positioning and Autophagic Flux of Breast Cancer Cells. Cell Death Dis. 2016, 7, e2347. [Google Scholar] [CrossRef]
  281. Lu, Y.C.; Chen, C.N.; Chu, C.Y.; Lu, J.H.; Wang, B.J.; Chen, C.H.; Huang, M.C.; Lin, T.H.; Pan, C.C.; Chen, S.S.A.; et al. Calreticulin Activates Β1 Integrin via Fucosylation by Fucosyltransferase 1 in J82 Human Bladder Cancer Cells. Biochem. J. 2014, 460, 69–78. [Google Scholar] [CrossRef]
  282. Palumberi, D.; Aldi, S.; Ermini, L.; Ziche, M.; Finetti, F.; Donnini, S.; Rosati, F. RNA-Mediated Gene Silencing of FUT1 and FUT2 Influences Expression and Activities of Bovine and Human Fucosylated Nucleolin and Inhibits Cell Adhesion and Proliferation. J. Cell. Biochem. 2010, 111, 229–238. [Google Scholar] [CrossRef]
  283. Mathieu, S.; Prorok, M.; Benoliel, A.M.; Uch, R.; Langlet, C.; Bongrand, P.; Gerolami, R.; El-Battari, A. Transgene Expression of α(1,2)-Fucosyltransferase-I (FUT1) in Tumor Cells Selectively Inhibits Sialyl-Lewis x Expression and Binding to E-Selectin without Affecting Synthesis of Sialyl-Lewis a or Binding to P-Selectin. Am. J. Pathol. 2004, 164, 371–383. [Google Scholar] [CrossRef] [PubMed]
  284. Hutchinson, W.L.; Du, M.-Q.; Johnson, P.J.; Williams, R. Fucosyltransferases: Differential Plasma and Tissue Alterations in Hepatocellular Carcinoma and Cirrhosis. Hepatology 1991, 13, 683–688. [Google Scholar] [CrossRef] [PubMed]
  285. Zhu, T.; Xu, L.; Xu, X.; Wang, Z.; Zhu, J.; Xie, Q.; Zhang, B.; Wang, Y.; Ju, L.; He, Y.; et al. Analysis of Breast Cancer-Associated Glycosphingolipids Using Electrospray Ionization-Linear Ion Trap Quadrupole Mass Spectrometry. Carbohydr. Res. 2015, 402, 189–199. [Google Scholar] [CrossRef] [PubMed]
  286. Lobasso, S.; Tanzarella, P. Lipid profiling of parkin-mutant skin fibroblasts. J. Cell. Physiol. 2017, 12, 3540–3551. [Google Scholar] [CrossRef] [PubMed]
  287. Bond, M.R.; Whitman, C.M. Matabolically incorporated photocrosslinking sialic acid covalently captures a ganglioside-protein complex. Mol. BioSyst. 2010, 6, 1796–1799. [Google Scholar] [CrossRef] [PubMed]
  288. Liang, Y.J.; Kuo, H.H. Switching of the core structures of glycosphingolipids from globo- and lacto- to ganglio-series upon human embryonic stem cell differentiation. Proc. Natl. Acad. Sci. USA 2010, 107, 22564–22569. [Google Scholar] [CrossRef] [PubMed]
Figure 1. Nomenclature of fragmentation of GSL ions in MS/MS spectra. (a) Fragmentation scheme of the GSL oligosaccharide chain: designation of the ions obtained from fragmentation of the ether bonds between the monosaccharides (Y, Z, B, C), and ions obtained from breaking the inner bonds of the saccharide ring (ring fragmentation, A, X) [110]. (b) Designation of ceramide moiety fragment ions according to the nomenclature of Ann and Adams [111]. S, T, U, and V ions, marked in purple, contain the N−acyl chain; O and P ions containing the sphingoid base are marked in green; G and H ions, which result from the fragmentation of the sphingoid base, are marked in blue; and the E ion, which results after fragmentation of both the N−acyl chain and the sphingoid base, is yellow.
Applsci 13 09922 g001
Figure 2. Common matrices used for MALDI non-imaging GSL analysis: DHB—2,5-dihydroxybenzoic acid, DHA—2,6-dihydroxyacetophenone, CHCA—α—cyano-4-hydroxycinamic acid, MSA—5-methoxysalicylic acid, ATT—6-azo-2-thiothymine, THAP—trihydroxyacetophenone.
Applsci 13 09922 g002
Table 1. GSL classification according to the core carbohydrate structure.
GSL Series (Symbol)Core Carbohydrate StructureTissue Specific Distribution
Ganglio (Gg)Galß1-3GalNAcß1-4Galß1-4Glcß1-1′CerIn the brain (vertebrates)
Isoganglio (iGg)Galß1-3GalNAcß1-3Galß1-4Glcß1-1′Cer
Lacto (Lc)Galß1-3GlcNAcß1-3Galß1-4Glcß1-1′CerIn secretory organs (vertebrates)
Neolacto (nLc)Galß1-4GlcNAcß1-3Galß1-4Glcß1-1′CerIn certain hematopoietic cells, including leukocytes (vertebrates)
Globo (Gb)GalNAcβ1-3Galα1-4Galß1-4Glcß1-1′CerIn erythrocytes (vertebrates)
Isoglobo (iGb)GalNAcβ1-3Galα1-3Galβ1-4Glcß1-1′CerIn vertebrates
Mollu (Mu)GlcNAcβ1-2Manα1-3Manβ1-4Glcß1-1′CerIn invertebrates
Arthro (At)GalNAcβ1-4GlcNAcβ1-3Manβ1-4Glcß1-1′CerIn invertebrates
Table 2. The Svennerholm system of GSL nomenclature and the IUPAC-IUB Joint Commission nomenclature.
Svennerholm NomenclatureIUPAC-IUB Nomenclature
LacCerGalb4Glcb1Cer
GA2, Gg3CerGalNAcb4Galb4Glcb1Cer
GA, Gg4CerGalb3GalNAcb4Galb4Glcb1Cer
nLc4CerGalb4GlcNAcb3Galb4Glcb1Cer
Lc4CerGalb3GlcNAcb3Galb4Glcb1Cer
GM4I3-a-Neu5Ac-GalCer
GM4I3-a-Neu5Ac-GlcCer
GM3II3-a-Neu5Ac-LacCer
GM3II3-a-Neu5Gc-LacCer
GD3II3-a-(Neu5Ac)2-LacCer
GD3II3-a-(Neu5Gc)2-LacCer
GD3II3-a-(Neu5Ac, Neu5Gc)2-LacCer
GT3II3-a-(Neu5Ac)3-LacCer
GM2II3-a-Neu5Ac-Gg3Cer
GD2II3-a-(Neu5Ac)2-Gg3Cer
GM1aII3-a-Neu5Ac-Gg4Cer
GM1bIV3-a-Neu5Ac-Gg4Cer
GalNAc-GM1bIV3-a-Neu5Ac-Gg5Cer
LM1IV3-a-Neu5Ac-Lc4Cer
LM1IV3-a-Neu5Gc-Lc4Cer
GD1aIV3-a-Neu5Ac,II3-a-Neu5Ac-Gg4Cer
GD1bII3-a-(Neu5Ac)2-Gg4Cer
LD1IV3-a-(Neu5Ac)2-Lc4Cer
GT1aIV3-a-(Neu5Ac)2,II3-a-Neu5Ac-Gg4Cer
GT1bIV3-a-Neu5Ac,II3-a-(Neu5Ac)2-Gg4Cer
GT1cII3-a-(Neu5Ac)3-Gg4Cer
GQ1bIV3-a-(Neu5Ac)2,II3-a-(Neu5Ac)2-Gg4Cer
GQ1cIV3-a-Neu5Ac,II3-a-(Neu5Ac)3-Gg4Cer
GP1bIV3-a-(Neu5Ac)3,II3-a-(Neu5Ac)2-Gg4Cer
GP1cIV3-a-(Neu5Ac)2,II3-a-(Neu5Ac)3-Gg4Cer
Table 3. Advantages and drawbacks of main matrices used for MALDI non-imaging MS.
MatrixAdvantageReferenceDisadvantageReference
DHBHigher signal-to-noise ratio (S/N)[116]Resolution is considerably low[117,118,119,120]
Decreased fragmentation in negative ion mode compared to positive ion mode[121,122]Altered sample geometry[117,118,119,120]
Minimizes loss of sialic acid[123]Increased fragmentation the higher the molecular mass is [117,118,119,120]
Minimizes loss of CO2[121]
Addition of butylamine reduces fragmentation[124]
DHAIncrease in resolution[125]Decrease in the signal-to-noise (S/N) ratio[125]
Negative ion mode improved detection of O-acetylated GT1 forms[125]
THAPHigh-quality Gb4Cer spectra[126]Low-quality spectra[126]
ATTEnhanced crystal formation by adding lithium citarte[127]Inhomogeneous distribution of crystals[126]
Superior S/N ratio (in positive ion mode)[117]
Significantly reduced fragmentation at high pressure[120]
CHCAFormation of homogeneous crystals[117]Considerable fragmentation[117]
Differentiation of GD1a compared to GD1b[115]Trisialogangliosides undetectable as molecular ions[117]
Lysogangliosides are analyzed better[128]
MSAHigh-quality ganglioside profiles (in positive ion mode)[129]
Minimal loss of sialic acid (in positive ion mode)[129]
Detects the isomer specific fragment ions for both GD1a and GD1b[129]
Table 4. The expression of specific glycan structures in hepatic cancer cell lines.
Cell LinesGlycan Structures
All cell lines[Galβ1 − 3Galα1 − 4Galβ1 − 4Glc],
[GalNAcβ1 − 4(NeuAcα2 − 3)Galβ1 − 4Glc],
[Galβ1 − 3GlcNAcβ1 − 3Galβ1 − 4Glc],
[Galβ1 − 3(Fucα1 − 4)GlcNAcβ1 − 3Galβ1 − 4Glc and/or Fucα1 − 2Galβ1 − 3GlcNAcβ1 − 3Galβ1 − 4Glc], [Galβ1 − 3GalNAcβ1 − 4(NeuAcα2 − 3)Galβ1 − 4Glc],
[Fucα1 − 2Galβ1 − 3GalNAcβ1 − 3Galα1 − 4Galβ1 − 4Glc]
Normal liver cell line HL-7702[Galβ1 − 3GlcNAcβ1 − 3Galβ1 − 3(Fucα1 − 4)GlcNAcβ1 − 3Galβ1 − 4Glc]
Hepatocarcinoma cell lines[NeuGcα2 − 8NeuAcα2 − 3Galβ1 − 4Glc],
[GalNAcα1 − 3(Fucα1 − 2)Galβ1 − 3GlcNAcβ1 − 3Galβ1 − 4Glc],
[Galβ1 − 3GlcNAcβ1 − 3Galβ1 − 3GlcNAcβ1 − 3Galβ1 − 4Glc], [Galβ1 − 3GlcNAcβ1 − 3Galβ1 − 3GlcNAcβ1 − 3Galβ1 − 4Glc], [Galα1 − 3(Fucα1 − 2)-Galβ1 − 4(Fucα1 − 3)GlcNAcβ1 − 3Galβ1 − 4Glc],
[GalNAcα1 − 3(Fucα1 − 2)Galβ1 − 4(Fucα1 − 3)GlcNAcβ1 − 3Galβ1 − 4Glc],
[NeuAcα2 − 3SulfGalβ1 − 4(Fucα1 − 3)GlcNAcβ1 − 3Galβ1 − 4Glc], [Fucα1 − 2Galβ1 − 4-(Fucα1 − 3)GlcNAcβ1 − 3Galβ1 − 4(Fucα1 − 3)GlcNAcβ1 − 3Galβ1 − 4Glc], and
[Galα1 − 3(Fucα1 − 2)Galβ1 − 4(Fucα1 − 3)GlcNAcβ1 − 3Galβ1 − 4(Fucα1 − 3)GlcNAcβ1 − 3Galβ1 − 4Glc]
High metastatic potential cell lines MHCC97H and HCCLM3[GalNAcα1 − 3(Fucα1 − 2)Galβ1 − 3GlcNAcβ1 − 3Galβ1 − 4Glc],
[Galβ1 − 3GlcNAcβ1 − 3Galβ1 − 3GlcNAcβ1 − 3Galβ1 − 4Glc],
[Galα1 − 3- (Fucα1 − 2)Galβ1 − 4(Fucα1 − 3)GlcNAcβ1 − 3Galβ1 − 4Glc],
[GalNAcα1 − 3(Fucα1 − 2)Galβ1 − 4(Fucα1 − 3)- GlcNAcβ1 − 3Galβ1 − 4Glc],
[NeuAcα2 − 3SulfGalβ1 − 4(Fucα1 − 3)GlcNAcβ1 − 3Galβ1 − 4Glc], [Fucα1 − 2Galβ1 − 4(Fucα1 − 3)GlcNAcβ1 − 3Galβ1 − 4- (Fucα1 − 3)GlcNAcβ1 − 3Galβ1 − 4Glc],
[Galα1 − 3(Fucα1 − 2)Galβ1 − 4(Fucα1 − 3)GlcNAcβ1 − 3Galβ1 − 4(Fucα1 − 3)GlcNAcβ1 − 3Galβ1 − 4Glc]
High metastatic potential cell line HCCLM3[GalNAcα1 − 3(Fucα1 − 2)Galβ1 − 3GlcNAcβ1 − 3Galβ1 − 4Glc],
[Galβ1 − 3GlcNAcβ1 − 3Galβ1 − 3GlcNAcβ1 − 3Galβ1 − 4Glc],
[Galα1 − 3(Fucα1 − 2)- Galβ1 − 4(Fucα1 − 3)GlcNAcβ1 − 3Galβ1 − 4Glc],
[GalNAcα1 − 3(Fucα1 − 2)Galβ1 − 4(Fucα1 − 3)GlcNAcβ1 − 3Galβ1 − 4Glc],
[NeuAcα2 − 3SulfGalβ1 − 4-(Fucα1 − 3)GlcNAcβ1 − 3Galβ1 − 4Glc]
Hepatocarcinoma cell line with low metastatic potential MHCC97L[Galβ1 − 3GlcNAcβ1 − 3Galβ1 − 3GlcNAcβ1 − 3Galβ1 − 4Glc]
Disclaimer/Publisher’s Note: The statements, opinions and data contained in all publications are solely those of the individual author(s) and contributor(s) and not of MDPI and/or the editor(s). MDPI and/or the editor(s) disclaim responsibility for any injury to people or property resulting from any ideas, methods, instructions or products referred to in the content.

