Prediction of Cotton Yarn Quality Based on Attention-GRU
Abstract
:1. Introduction
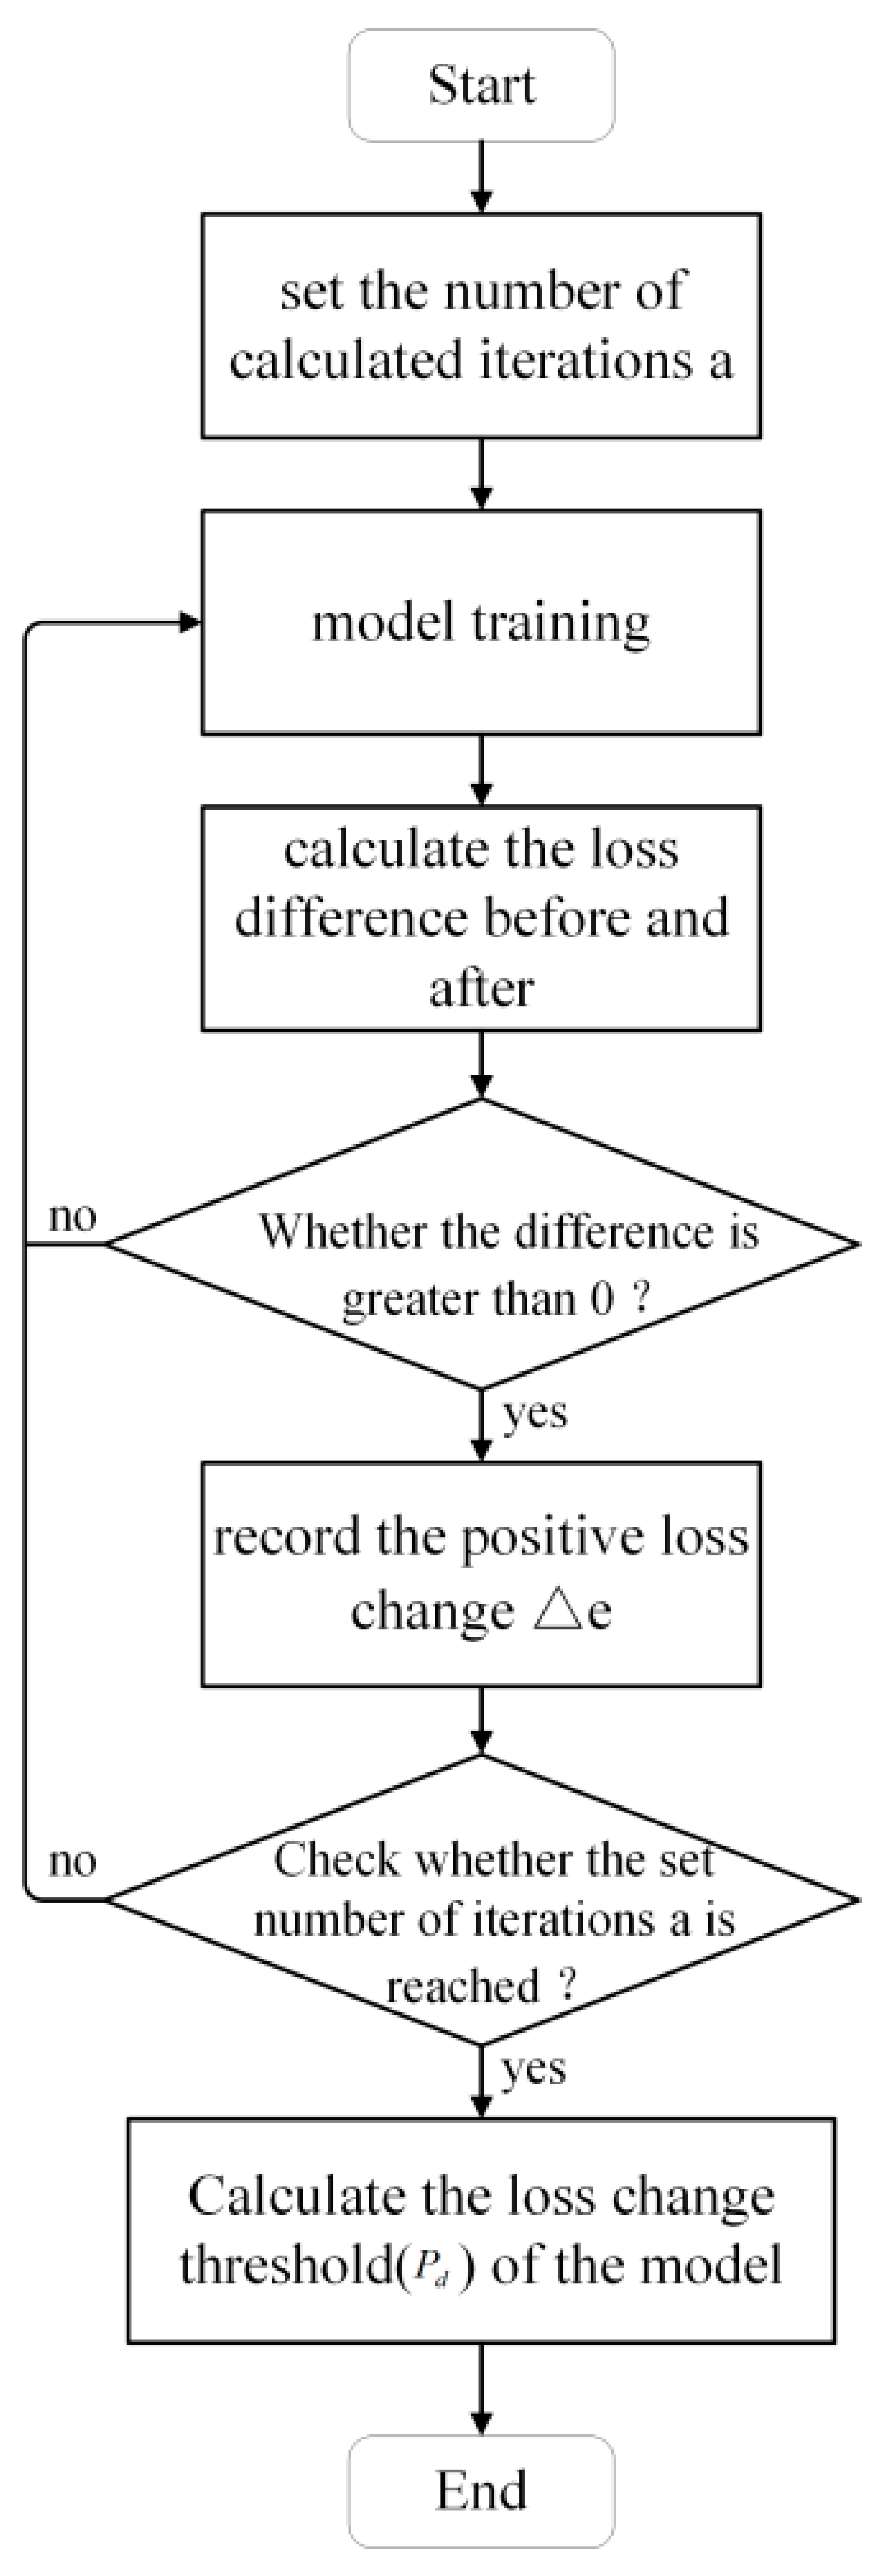
- A cotton yarn quality prediction model based on attention-GRU was devised. This model incorporates an attention mechanism that directs the model’s focus towards the most significant input features influencing yarn quality. Additionally, a dynamic adaptation of the loss change threshold has been introduced to determine the optimal number of iterations for different datasets. This approach not only enhances the precision of model predictions but also boosts prediction efficiency.
- A research dataset was constructed incorporating raw cotton performance indicators and data from the regular carding process. By organizing raw cotton performance indicators and processing information from the spinning workshop, a driving dataset was established for the model, aligning it more closely with practical scenarios in cotton yarn spinning.
- Through performance comparisons with BP, LSTM, and GRU prediction models, the practical utility of the cotton yarn prediction model developed in this study was validated. This offers valuable insights for researchers in the field of yarn production quality prediction and serves as a reference for their endeavors.
2. Cotton Yarn Quality Prediction Model
2.1. The GRU Neural Network
2.2. The Attention Mechanism
2.3. Attention-GRU Prediction Model
3. Case Analysis
3.1. Dataset Preparation
- The speed of the carding roller and the tin roller in the carding machine is one of the key factors influencing the carding quality [27].
- Increasing the speed effectively enhances the carding rate and area, thereby reducing cotton knots and impurities. However, higher speeds intensify the increase in short fiber content where for every 1% increase in short fiber content below 16 mm in cotton yarn, there is a corresponding decrease in yarn strength by 1–2% [28].
- The blending process in the drawing frame elongates and evens out cotton fibers. The spinning speed of the drawing frame can impact the uniformity of fiber blending, thus influencing yarn strength [29].
- There exists a parabolic relationship between the coefficients of the coarse and fine yarn processes and cotton yarn tensile strength [30,31]. As the twist coefficient increases, the intermolecular cohesion of cotton fibers strengthens. However, the introduction of additional twist reduces axial forces, leading to uneven fiber breakage. Furthermore, spindle speed in both processes is a critical factor affecting yarn strength.
3.2. Parameter Configuration
3.3. Model Testing and Comparison
4. Conclusions
Author Contributions
Funding
Institutional Review Board Statement
Informed Consent Statement
Data Availability Statement
Conflicts of Interest
References
- Yang, S.; Gordon, S. Accurate prediction of cotton ring-spun yarn quality from high-volume instrument and mill processing data. Text. Res. J. 2017, 87, 1025–1039. [Google Scholar] [CrossRef]
- Cirio, G.; Lopez-Moreno, J.; Miraut, D. Yarn-level simulation of woven cloth. ACM Trans. Graph. 2014, 33, 1–11. [Google Scholar] [CrossRef]
- Zhou, Q.; Wei, T.; Qiu, Y.; Tang, F.; Gan, X. Prediction and optimization of chemical fiber spinning tension based on grey system theory. Text. Res. J. 2019, 89, 3067–3079. [Google Scholar] [CrossRef]
- Ding, Y.; Gao, L.L.; Lu, W.K. Sensitivity Optimization of Surface Acoustic Wave Yarn Tension Sensor Based on Elastic Beam Theory. Sensors 2022, 22, 9368. [Google Scholar] [CrossRef]
- Ogulata, S.N.; Sahin, C.; Ogulata, R.T.; Balci, O. The Prediction of Elongation and Recovery of Woven Bi-Stretch Fabric Using Artificial Neural Network and Linear Regression Models. Fibres Text. East. Eur. 2006, 14, 46–49. [Google Scholar]
- Balci, O.; Oulata, S.N.; Ahin, C.; Oulata, R.T. An artificial neural network approach to prediction of the colorimetric values of the stripped cotton fabrics. Fibers Polym. 2008, 9, 604–614. [Google Scholar] [CrossRef]
- Gharehaghaji, A.A.; Shanbeh, M.; Palhang, M. Analysis of Two Modeling Methodologies for Predicting the Tensile Properties of Cotton-covered Nylon Core Yarns. Text. Res. J. 2007, 77, 565–571. [Google Scholar] [CrossRef]
- Yang, X.B.; Hao, F.M. Apply time sequence model to predict and control spinning tension. Basic Sci. J. Text Univ. 2002, 15, 232–235. [Google Scholar]
- Lv, Z.J.; Yang, J.G.; Xiang, Q. GA Based Parameters Optimization on Prediction Method of Yarn Quality. J. Donghua Univ. (Nat. Sci.) 2012, 38, 519–523. [Google Scholar]
- Yan, X.B.; Sheng, C.H.; Zhang, Y.X. Reserch on Yarn Quality Prediction Technology Based on XJ120 Test Data. Adv. Text. Technol. 2017, 25, 27–30. [Google Scholar]
- Cha, L.G.; Xie, C.Q. Prediction of cotton yarn quality based on four-layer BP neural network. J. Text. Res. 2019, 40, 52–56+61. [Google Scholar]
- Li, X.F.; Qasim, S.Q.; Chong, W.Y. Influence of GA-BP Artificial Neural Network Based on PCA Dimension Reduction in Yarn Tenacity Prediction. Adv. Mater. Res. 2014, 1048, 358–366. [Google Scholar] [CrossRef]
- Ma, C.T.; Shao, J.F. Prediction Model Based on Improved BP Neural Network with Fireworks Algorithm and Its Application. Control Eng. China 2020, 27, 1324–1331. [Google Scholar]
- Elrys, S.M.M.E.; El-Habiby, F.F.; Eldeeb, A.S.; El-Hossiny, A.M.; Elkhalek, R.A. Influence of core yarn structure and yarn count on yarn elastic properties. Text. Res. J. 2022, 92, 3534–3544. [Google Scholar] [CrossRef]
- Yan, J.W.; Zhu, W.; Shi, J.; Morikawa, H. Effect of silk yarn parameters on the liquid transport considering yarn interlacing. Text. Res. J. 2022, 92, 3808–3815. [Google Scholar] [CrossRef]
- Hu, Z.L. Prediction model of rotor yarn quality based on CNN-LSTM. J. Sens. 2022, 2022. [Google Scholar] [CrossRef]
- Jorgo, M. Influence of Polymer Concentration and Nozzle Material on Centrifugal Fiber Spinning. Polymers 2020, 12, 575. [Google Scholar]
- Qiao, X.; Shunqi, M.; Xiao, Y.; Islam, M.M.; Zhen, C.; Shaojun, W. Analysis of the magnetic field and electromagnetic force of a non-striking weft insertion system for super broad-width looms, based on an electromagnetic launcher. Text. Res. J. 2019, 89, 4620–4631. [Google Scholar] [CrossRef]
- Lu, B. Design of knitted garment design model based on mathematical image theory. J. Sens. 2022, 2022. [Google Scholar] [CrossRef]
- Akgun, M.; Eren, R.; Suvari, F. Effect of different yarn combinations on auxetic properties of plied yarns. Autex Res. J. 2021, 23, 77–88. [Google Scholar] [CrossRef]
- Peng, W.; Wang, Y.; Yin, S.Q. Short-term Load Forecasting Model Based on Attention-LSTM in Electricity Market. Power Syst. Technol. 2019, 43, 1745–1751. [Google Scholar]
- Lal, K.; Ammar, A.; Afaq, K.M.; Chang, S.T. Deep Sentiment Analysis Using CNN-LSTM Architecture of English and Roman Urdu Text Shared in Social Media. Appl. Sci. 2022, 12, 2694. [Google Scholar]
- Cho, K.; Bart, M.; Caglar, G.; Fethi, B.; Holger, S.; Yoshua, B. Learning Phrase Representations using RNN Encoder-Decoder for Statistical Machine Translation. Comput. Sci. 2014, 10, 1724–1734. [Google Scholar]
- Dzmitry, B.; Kyunghyun, C.; Yoshua, B. Neural Machine Translation by Jointly Learning to Align and Translate. arXiv 2014, arXiv:1409.0473. [Google Scholar]
- Lu, Q.S. New Media Public Relations Regulation Strategy Model Based on Generative Confrontation Network. Mob. Inf. Syst. 2022, 2022. [Google Scholar] [CrossRef]
- Yao, M.; Zhuang, L.; Wang, S.; Li, H. PMIVec: A word embedding model guided by point-wise mutual information criterion. Multimed. Syst. 2022, 28, 2275–2283. [Google Scholar] [CrossRef]
- Sehit, H.; Kadoglu, H. A study on the parameters effecting yarn snarling tendency. Text. Appar. 2020, 30, 2–49. [Google Scholar]
- Shao, Y.H.; Zhang, M.G.; Cao, J.P.; Guo, X.; Han, X.J. Effect of speed ratio between cylinder and taker-in on carding quality. J. Text. Res. 2020, 41, 39–44. [Google Scholar]
- Zhang, C.H.; Li, M. Relationship between raw cotton property and yarn strength. J. Text. Res. 2005, 26, 52–53. [Google Scholar]
- Jiang, H.Y. Research of New Spinning Technology on Flax Blended Yarn; Qiqihar University: Qiqihar, China, 2014. [Google Scholar]
- Wu, Z.G.; Zhang, S.G.; Xu, J.; Yu, C.G. Influence of Fiber Property and Spun Yarn Twist Factor on Breaking Tenacity of Cotton Yarn. Cotton Text. Technol. 2020, 48, 1–5. [Google Scholar]



| Micronaire Value | Fiber Strength | Fiber Fineness | Fiber Maturity | Short Fiber Rate(%) | Fiber Neps | Carding Cylinder Speed (r/min) | Carding Doffer Speed (r/min) | Feed Roller Speed (m/min) | Final Drafting Roller Speed (m/min) | Rough Yarn Twist Coefficient | Rough Yarn Spindle Speed (r/min) | Fine Yarn Twist Coefficient | Fine Yarn Spindle Speed (r/min) | Tensile Strength (cn/tex) |
|---|---|---|---|---|---|---|---|---|---|---|---|---|---|---|
| 4.68 | 29.5 | 174 | 0.86 | 10.8 | 243 | 1007 | 473 | 350 | 401 | 115 | 950 | 350 | 13,683 | 16.38 |
| 4.50 | 30.4 | 172 | 0.85 | 11.1 | 249 | 1022 | 470 | 345 | 410 | 113 | 933 | 356 | 13,612 | 16.11 |
| 4.61 | 29.8 | 171 | 0.85 | 10.6 | 244 | 1073 | 467 | 360 | 404 | 115 | 966 | 352 | 13,630 | 16.57 |
| 4.57 | 31.8 | 171 | 0.85 | 10.4 | 248 | 988 | 480 | 350 | 395 | 115 | 957 | 348 | 13,667 | 17.09 |
| 4.54 | 28.2 | 170 | 0.86 | 11.2 | 241 | 994 | 469 | 345 | 399 | 120 | 982 | 340 | 13,682 | 16.45 |
| 4.71 | 29.7 | 173 | 0.86 | 10.4 | 240 | 1039 | 471 | 350 | 395 | 120 | 923 | 353 | 13,625 | 16.37 |
| 4.49 | 31.9 | 172 | 0.85 | 10.7 | 243 | 990 | 478 | 355 | 400 | 114 | 952 | 355 | 13,708 | 16.54 |
| 4.34 | 29.8 | 174 | 0.86 | 11.0 | 243 | 1017 | 465 | 350 | 410 | 114 | 975 | 360 | 13,680 | 16.13 |
| 4.42 | 31.0 | 171 | 0.86 | 11.1 | 245 | 1056 | 469 | 350 | 406 | 120 | 990 | 358 | 13,702 | 16.21 |
| 4.66 | 29.2 | 172 | 0.86 | 10.6 | 242 | 986 | 471 | 345 | 394 | 110 | 973 | 348 | 13,633 | 16.52 |
| Parameter Name | BP | LSTM | GRU |
|---|---|---|---|
| Number of Hidden Layer Neurons | 24 | 24 | 24 |
| Activation Function | relu | sigmoid | sigmoid |
| Loss Function | MSE | MSE | MSE |
| Optimization Algorithm | Adam | Adam | Adam |
| Learning Rate | 0.0001 | 0.0001 | 0.0001 |
| Number of Iterations | 10,000 | 10,000 | 10,000 |
| Training Batch Size | 50 | 50 | 50 |
| Input Dimension and Quantity | (50,14) | (50,6,6) | (50,6,6) |
| Method | BP | LSTM | GRU | AT-GRU |
|---|---|---|---|---|
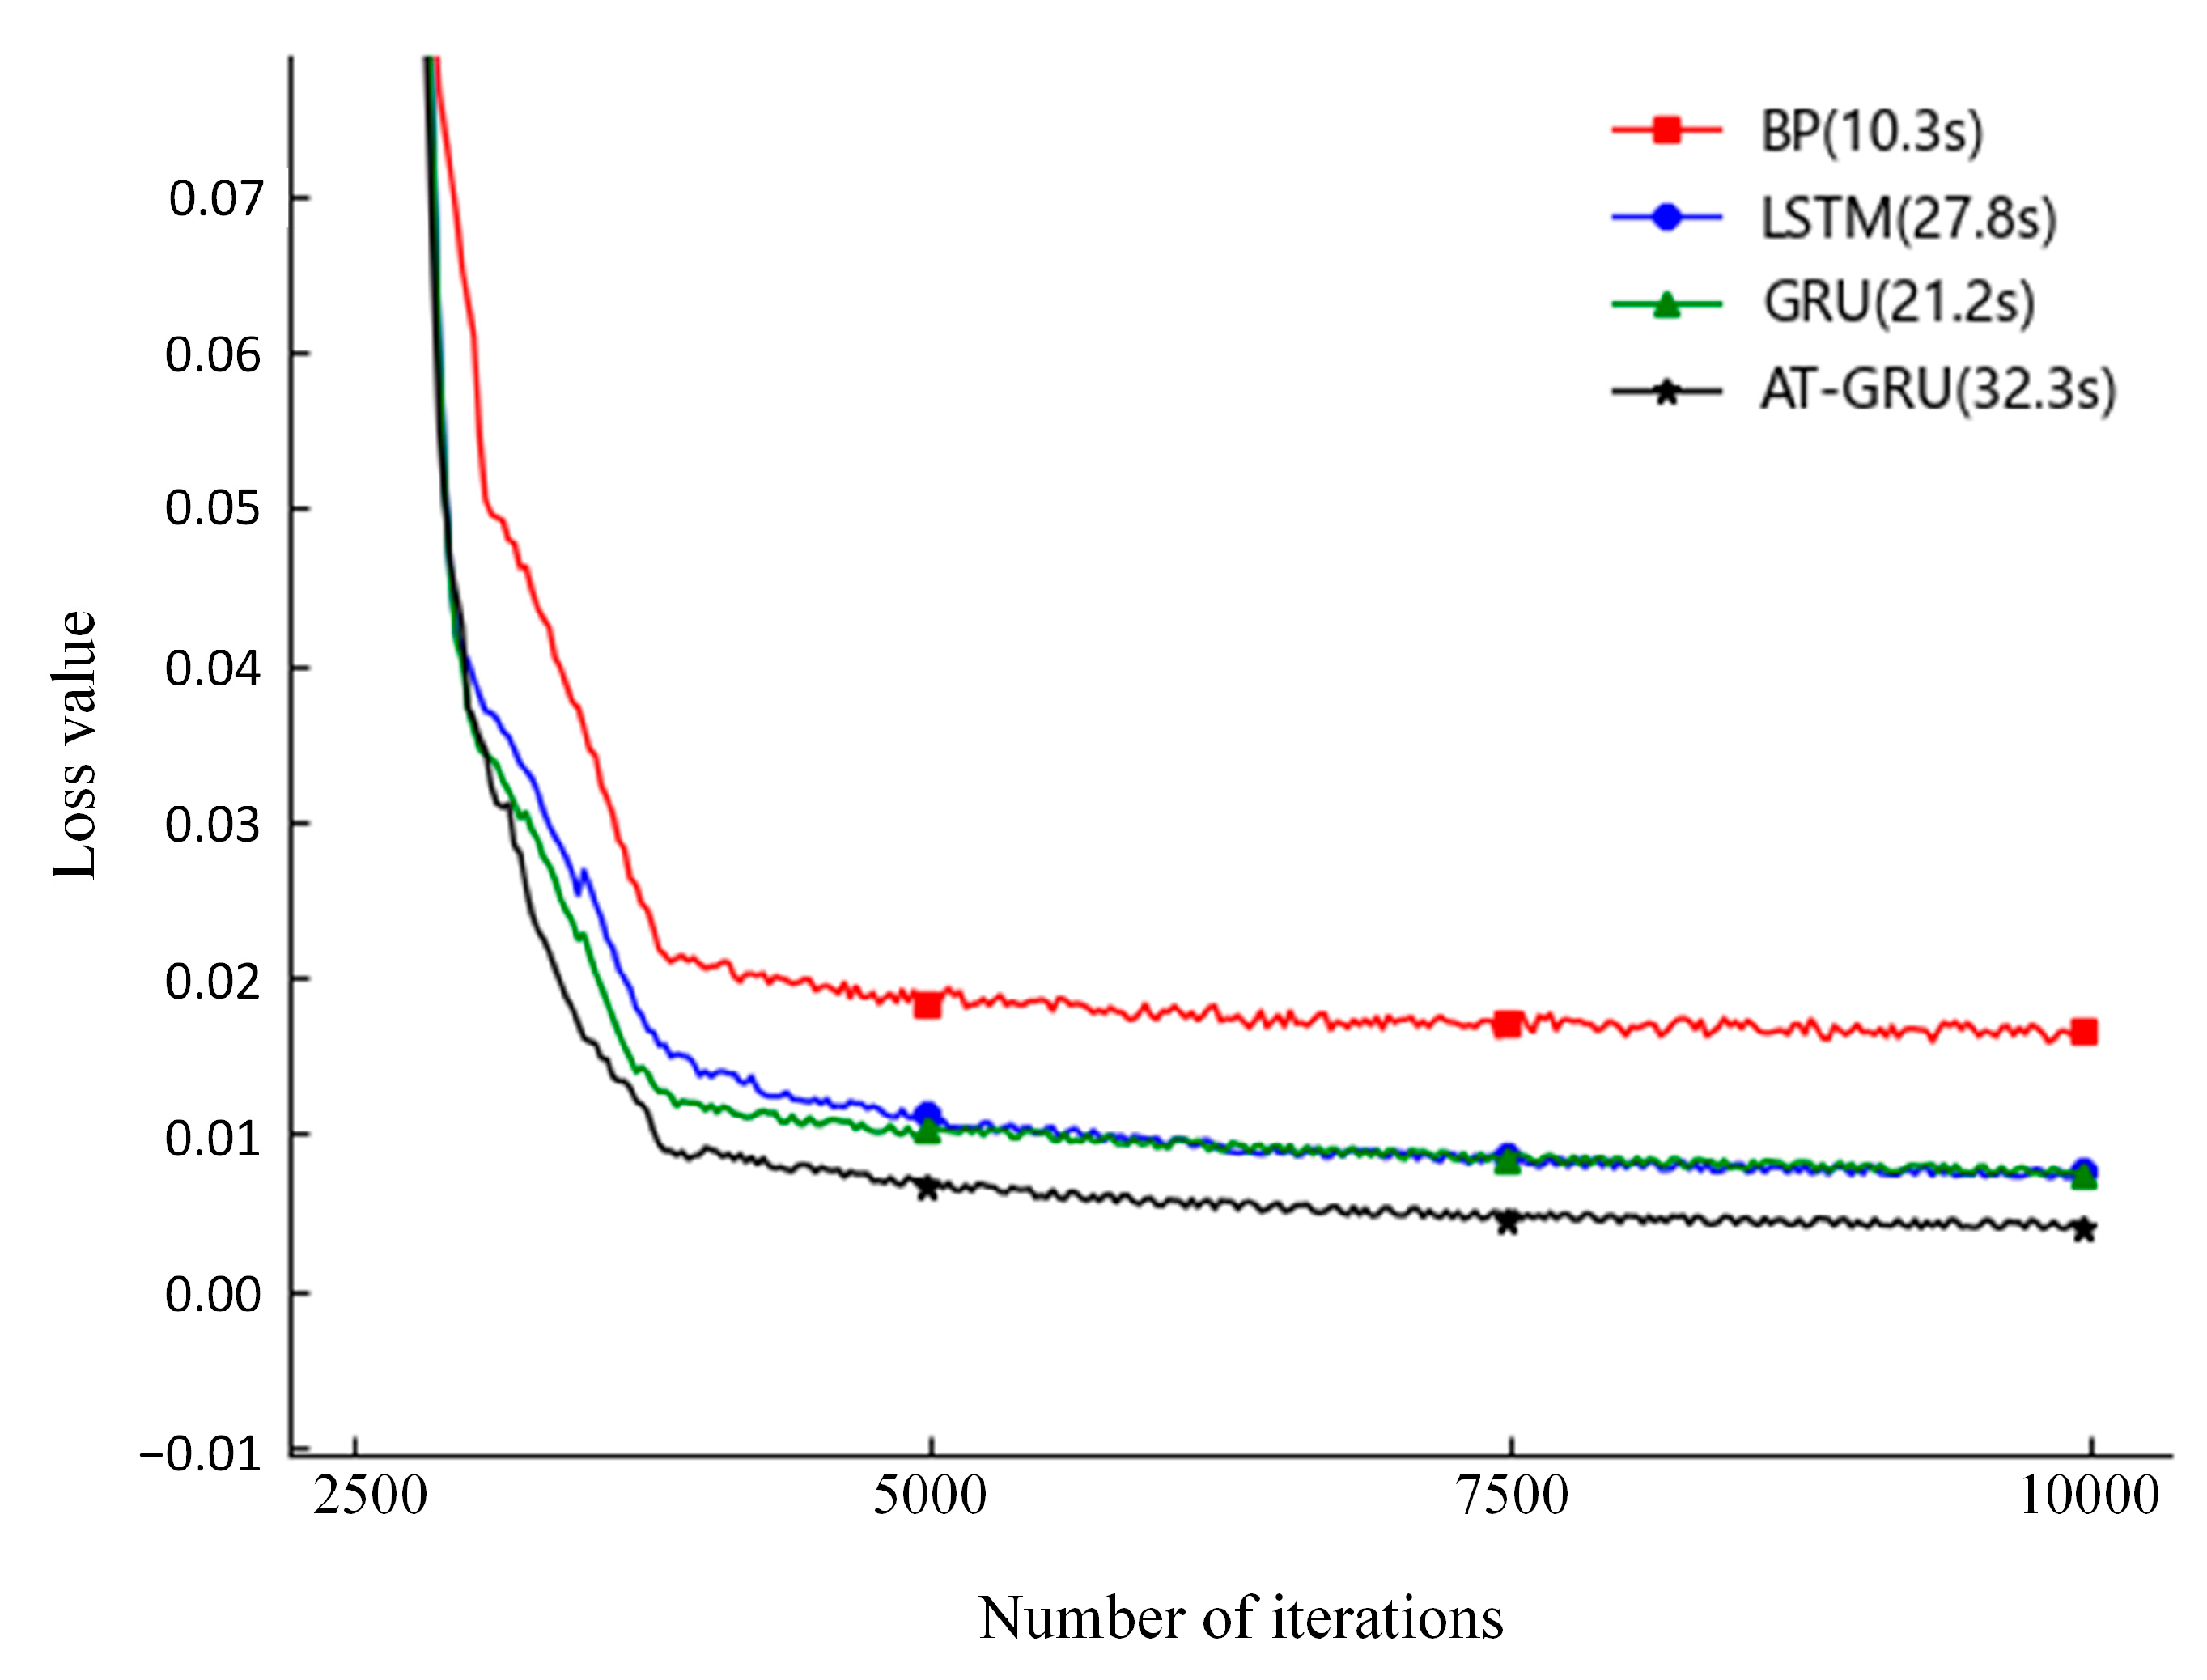
| Training Duration (s) | 10.32 | 27.84 | 21.27 | 32.31 |
| Average Loss Value | 0.019 | 0.009 | 0.008 | 0.005 |
| Test Sample No. | Predictive Model | |||
|---|---|---|---|---|
| BP | LSTM | GRU | Attention-GRU | |
| 1 | 1.03 | 2.17 | 2.04 | 3.81 |
| 2 | 1.49 | 2.34 | 2.06 | 3.62 |
| 3 | 0.98 | 1.99 | 2.17 | 4.17 |
| 4 | 1.32 | 2.03 | 1.88 | 3.73 |
| 5 | 1.21 | 2.15 | 2.00 | 3.89 |
| 6 | 0.86 | 2.45 | 2.30 | 4.61 |
| 7 | 1.08 | 1.76 | 1.83 | 3.29 |
| 8 | 1.14 | 2.22 | 2.01 | 3.76 |
| 9 | 1.03 | 2.03 | 2.14 | 2.48 |
| 10 | 1.09 | 2.42 | 1.62 | 3.61 |
| Total Time(ms) | 11.23 | 21.56 | 20.05 | 36.97 |
| Test Sample No. | Actual Value | BP | LSTM | GRU | Attention-GRU | ||||
|---|---|---|---|---|---|---|---|---|---|
| Prediction | Error | Prediction | Error | Prediction | Error | Prediction | Error | ||
| 1 | 16.21 | 16.33 | 0.12 | 16.22 | 0.01 | 16.15 | 0.06 | 16.18 | 0.03 |
| 2 | 16.28 | 16.52 | 0.24 | 16.43 | 0.15 | 16.44 | 0.16 | 16.19 | 0.09 |
| 3 | 16.57 | 16.71 | 0.14 | 16.42 | 0.15 | 16.45 | 0.12 | 16.61 | 0.04 |
| 4 | 16.59 | 16.66 | 0.07 | 16.72 | 0.13 | 16.57 | 0.02 | 16.66 | 0.07 |
| 5 | 16.11 | 16.18 | 0.07 | 16.10 | 0.01 | 16.10 | 0.01 | 16.14 | 0.03 |
| 6 | 16.37 | 16.37 | 0.00 | 16.37 | 0.00 | 16.27 | 0.10 | 16.38 | 0.01 |
| 7 | 16.53 | 16.75 | 0.22 | 16.56 | 0.03 | 16.43 | 0.10 | 16.63 | 0.10 |
| 8 | 16.52 | 16.60 | 0.08 | 16.47 | 0.05 | 16.60 | 0.08 | 16.49 | 0.03 |
| 9 | 16.78 | 16.84 | 0.06 | 16.87 | 0.09 | 16.84 | 0.06 | 16.72 | 0.06 |
| 10 | 16.13 | 16.19 | 0.06 | 16.23 | 0.10 | 16.19 | 0.06 | 16.13 | 0.00 |
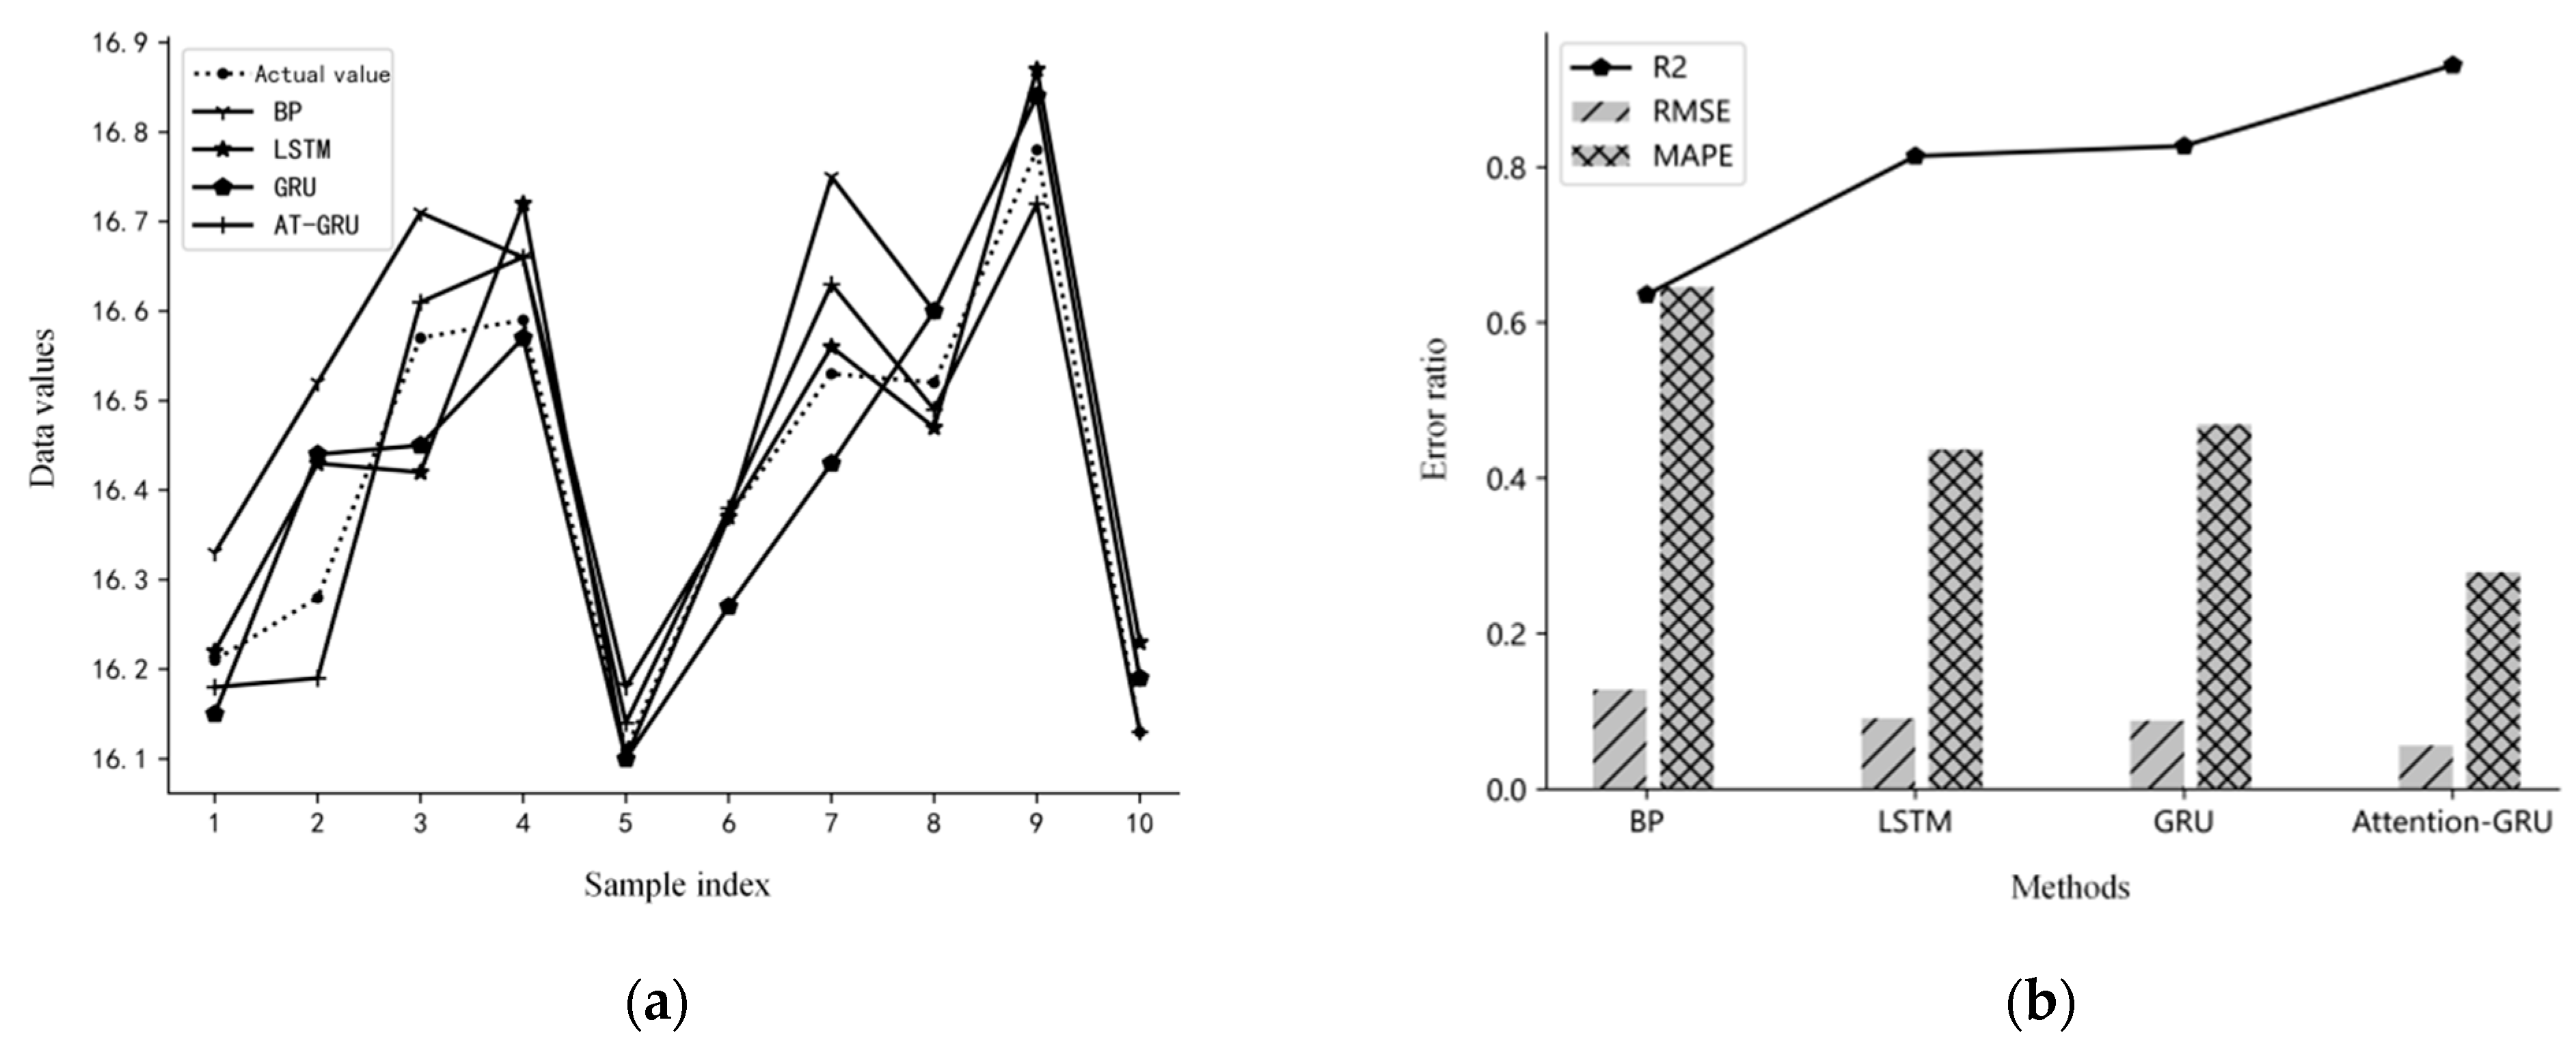
| Ermse | 0.128 | 0.091 | 0.088 | 0.056 | |||||
| Emape/% | 0.646 | 0.437 | 0.469 | 0.279 | |||||
| R2 | 0.636 | 0.814 | 0.827 | 0.931 | |||||
Disclaimer/Publisher’s Note: The statements, opinions and data contained in all publications are solely those of the individual author(s) and contributor(s) and not of MDPI and/or the editor(s). MDPI and/or the editor(s) disclaim responsibility for any injury to people or property resulting from any ideas, methods, instructions or products referred to in the content. |
© 2023 by the authors. Licensee MDPI, Basel, Switzerland. This article is an open access article distributed under the terms and conditions of the Creative Commons Attribution (CC BY) license (https://creativecommons.org/licenses/by/4.0/).
Share and Cite
Dai, N.; Jin, H.; Xu, K.; Hu, X.; Yuan, Y.; Shi, W. Prediction of Cotton Yarn Quality Based on Attention-GRU. Appl. Sci. 2023, 13, 10003. https://doi.org/10.3390/app131810003
Dai N, Jin H, Xu K, Hu X, Yuan Y, Shi W. Prediction of Cotton Yarn Quality Based on Attention-GRU. Applied Sciences. 2023; 13(18):10003. https://doi.org/10.3390/app131810003
Chicago/Turabian StyleDai, Ning, Haiwei Jin, Kaixin Xu, Xudong Hu, Yanhong Yuan, and Weimin Shi. 2023. "Prediction of Cotton Yarn Quality Based on Attention-GRU" Applied Sciences 13, no. 18: 10003. https://doi.org/10.3390/app131810003
APA StyleDai, N., Jin, H., Xu, K., Hu, X., Yuan, Y., & Shi, W. (2023). Prediction of Cotton Yarn Quality Based on Attention-GRU. Applied Sciences, 13(18), 10003. https://doi.org/10.3390/app131810003


