
Diagnosis of Citrus Greening Based on the Fusion of Visible and Near-Infrared Spectra


Abstract
:1. Introduction
2. Material and Methods
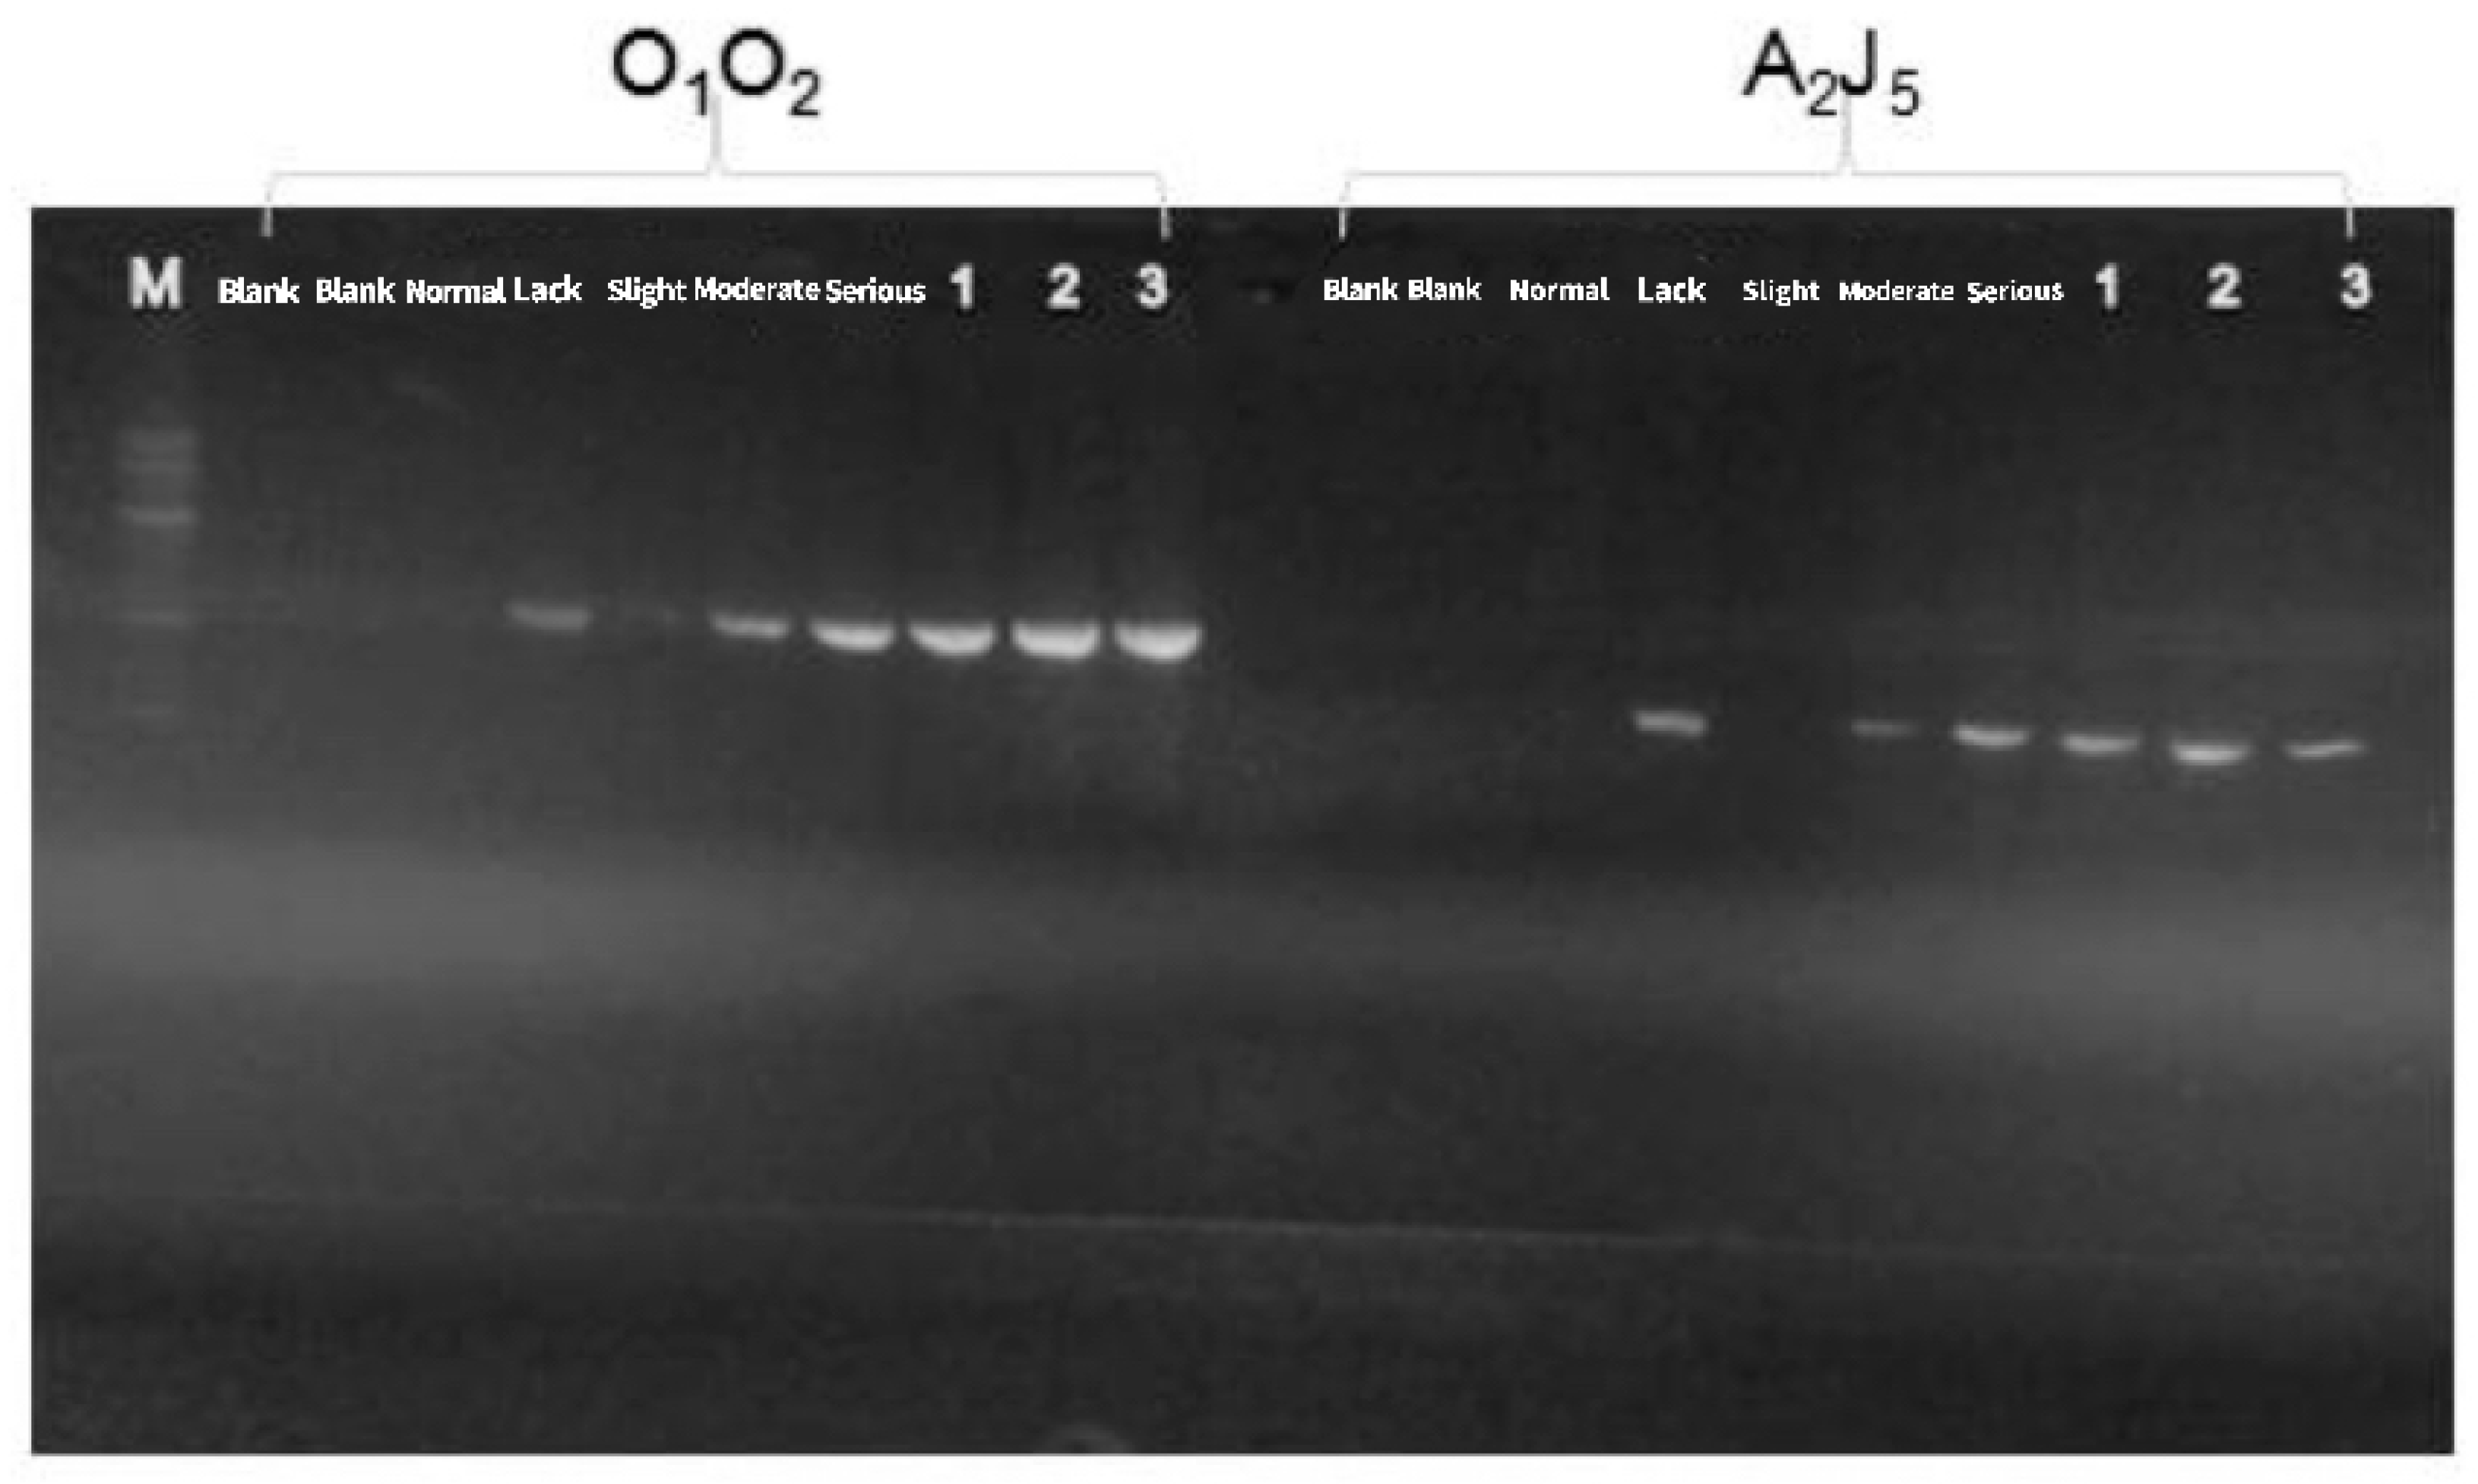
2.1. Sample Preparation
2.2. Spectrometers
2.3. Spectrum Acquisition
2.4. Dimension Reduction Method
2.5. Modeling Method
3. Results and Discussion
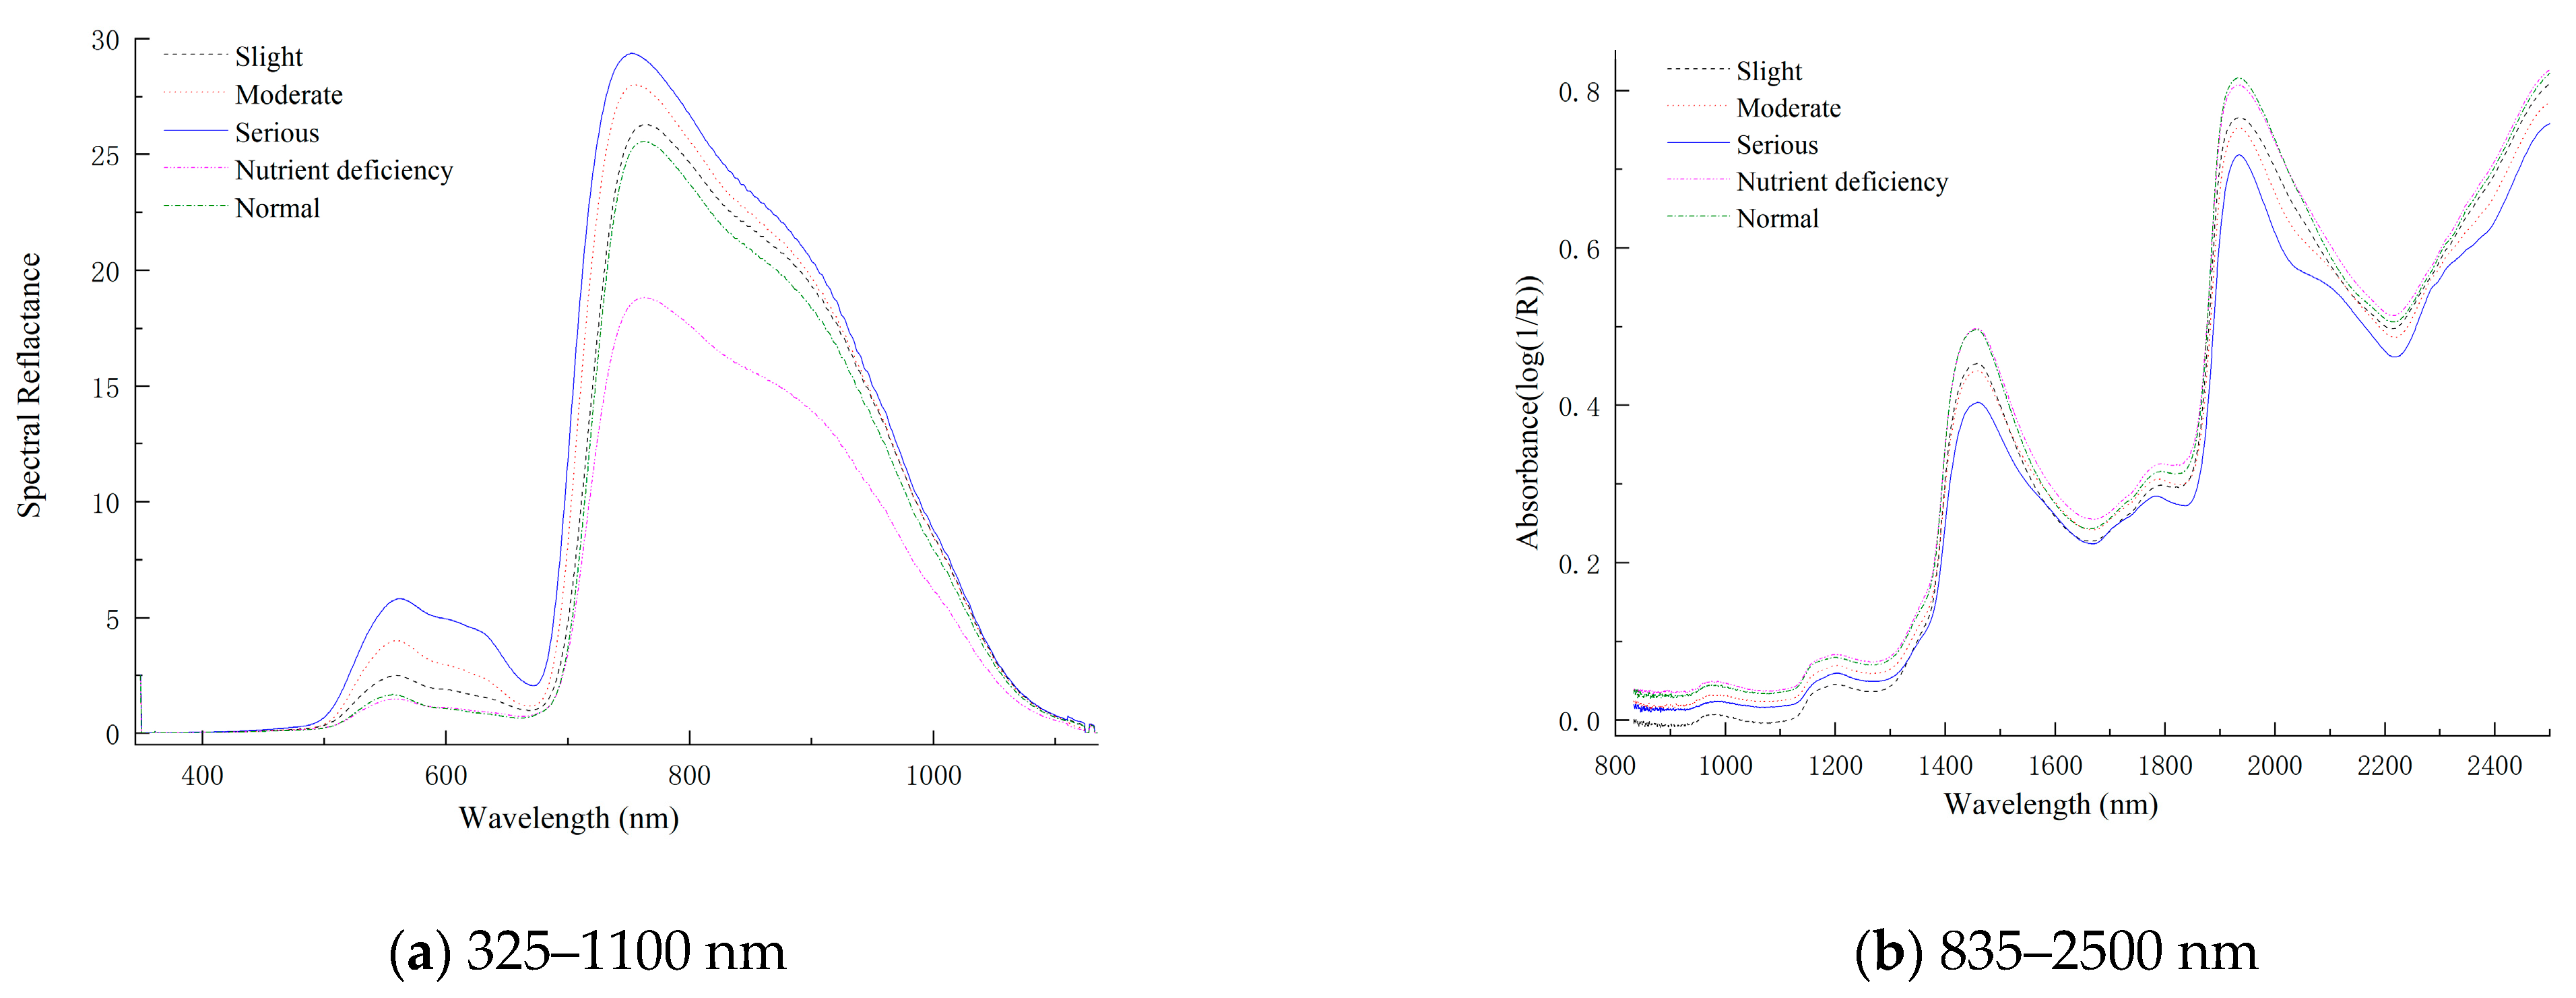
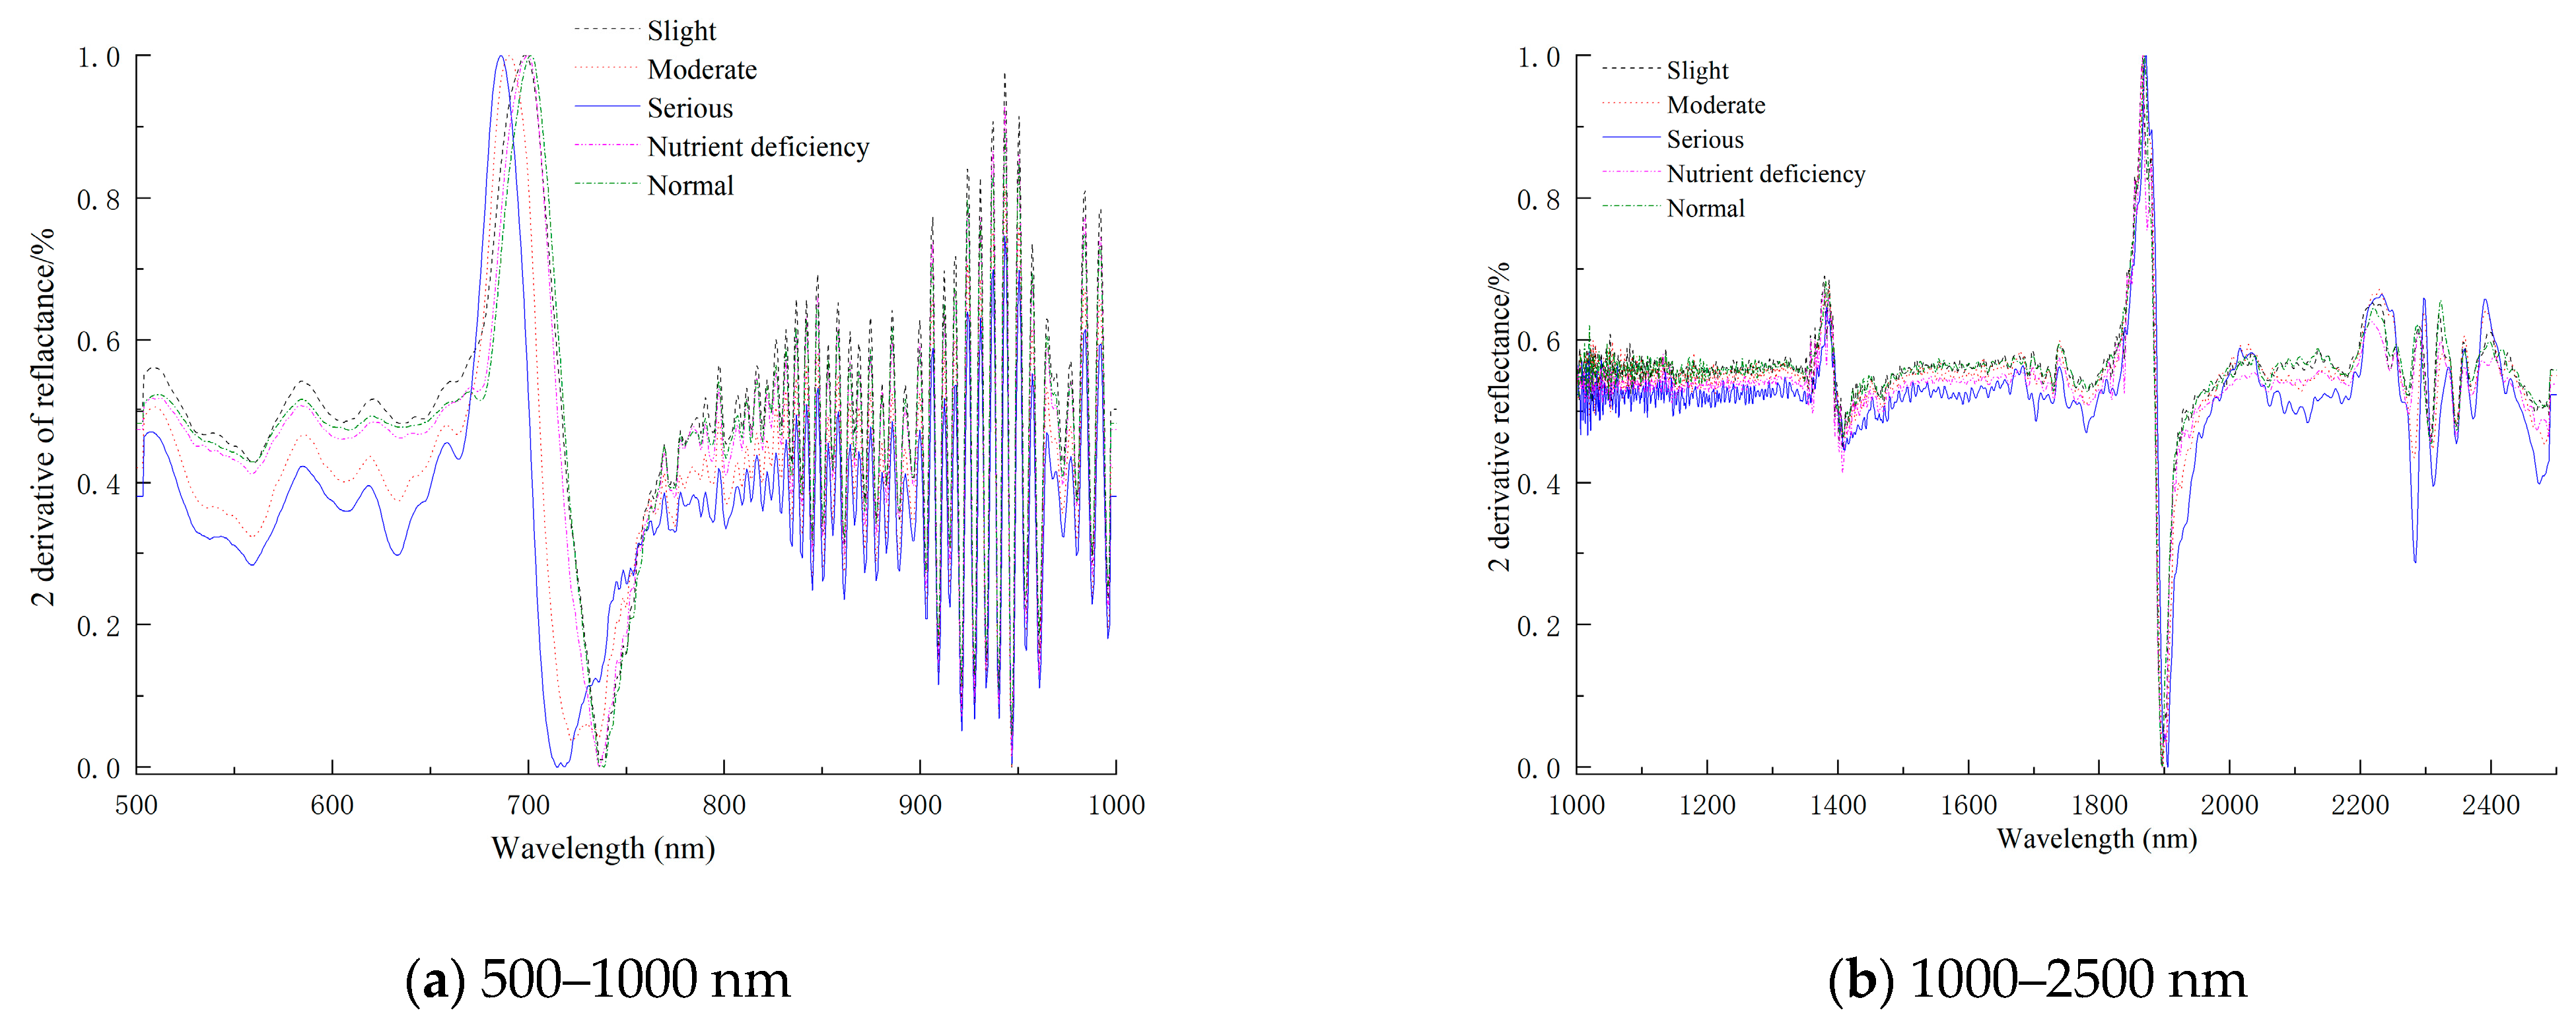
3.1. Spectral Characteristic Analysis and Pretreatment
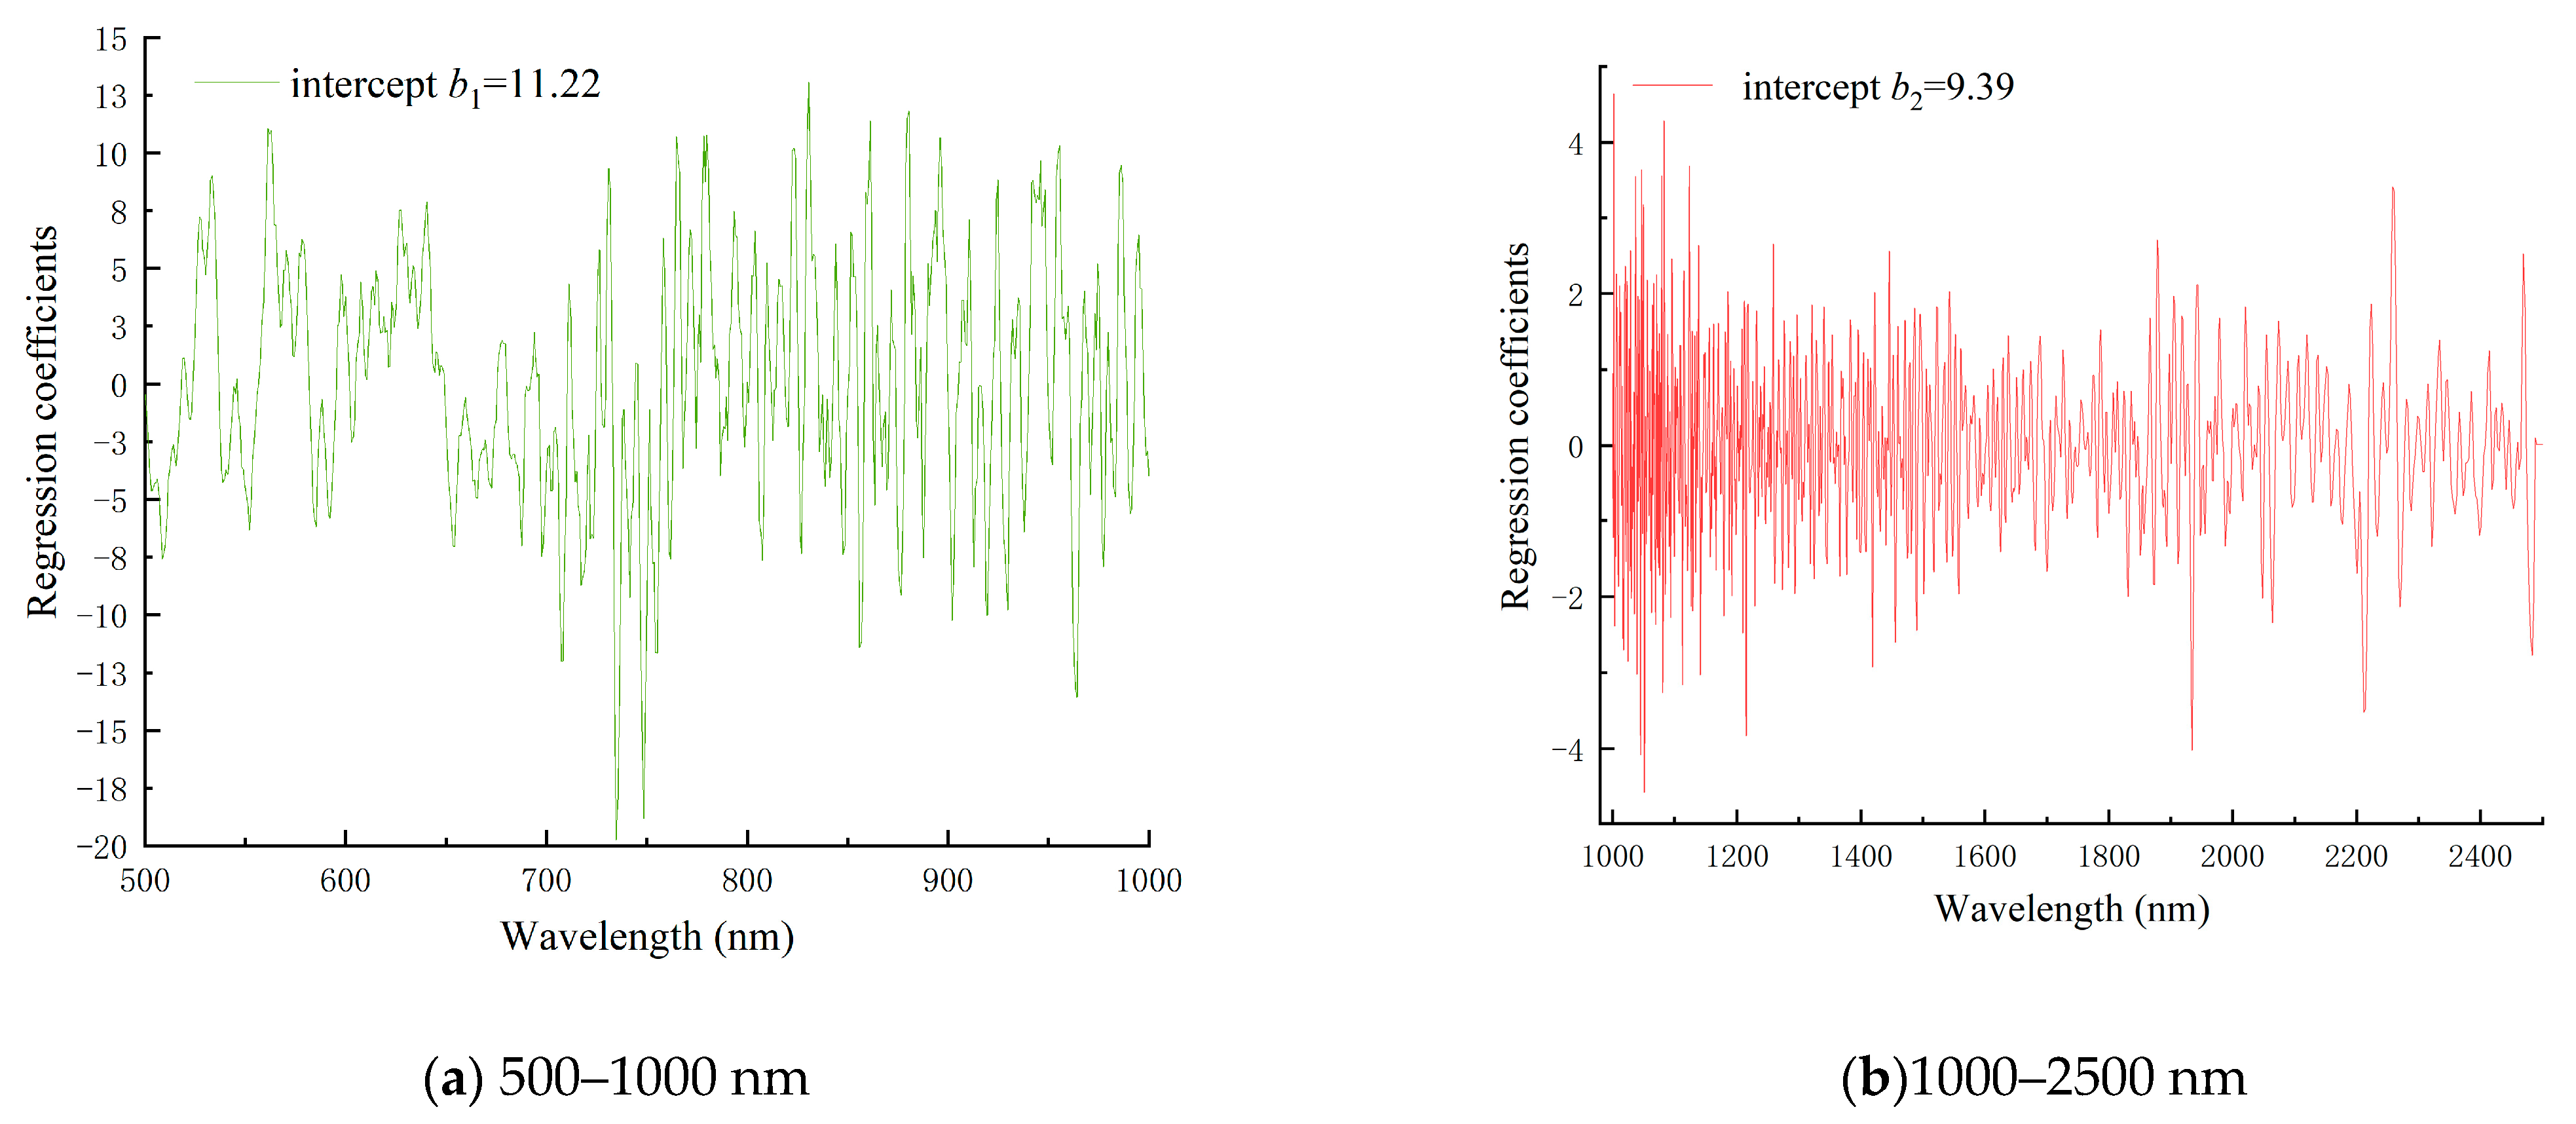
3.2. Feature Variable Screening
3.3. Fusion Model Building and Discriminant
3.3.1. Discriminant Model Based on Spectral Data Layer Fusion
3.3.2. Discriminant Model Based on Data Feature Layer Fusion
3.3.3. Discriminant Model Based on Decision Level Fusion
3.3.4. Discriminant Model Comparison Analysis
4. Conclusions
Author Contributions
Funding
Institutional Review Board Statement
Informed Consent Statement
Data Availability Statement
Acknowledgments
Conflicts of Interest
References
- Shan, Z.; Guo, H.; Feng, Z.; Deng, X. Cloning and sequencing of Hang longbing pathogen in shatianyou pomelo. J. Zhongkai Univ. Agric. Technol. 2005, 18, 45–48. [Google Scholar]
- Treguier, S.; Jacq, K.; Couderc, C.; Ferhout, H.; Tormo, H.; Kleiber, D.; Levasseur-Garcia, C. A method for highlighting differences between bacteria grown on nutrient agar using near infrared spectroscopy and principal component analysis. J. Near Infrared Spectrosc. 2021, 29, 269–277. [Google Scholar] [CrossRef]
- Ukuda-Hosokawa, R.; Sadoyama, Y.; Kishaba, M.; Kuriwada, T.; Anbutsu, H.; Fukatsu, T. Infection Density Dynamics of the Citrus Greening Bacterium “Candidatus Liberibacter asiaticus” in Field Populations of the Psyllid Diaphorina citri and Its Relevance to the Efficiency of Pathogen Transmission to Citrus Plants. Appl. Environ. Microbiol. 2021, 81, 3728–3736. [Google Scholar] [CrossRef] [PubMed]
- Barbin, D.; Sobottka, R.; Risso, W.; Zucareli, C.; Hirooka, E.Y. Influence of plant densities and fertilization on maize grains by near-infrared spectroscopy. Spectrosc. Lett. 2016, 49, 73–79. [Google Scholar] [CrossRef]
- Lin, X. Studies on the Distribution and Control Technology of Citrus Huanglongbing in Hunan Province. Master’s Thesis, Agricultural University Of Hunan, Changsha, China, 2020. [Google Scholar] [CrossRef]
- Yu, J.; Zhang, M.; Tao, J. The control research progress of liberobacter asiaticum in Taizhou city. Agric. Sci. Technol. 2015, 6, 1237–1242. [Google Scholar]
- Lu, L.; Fan, G.; Hu, X. PCR detection of huanglongbing pathogen in different parts of citrus plants in the field and analysis of the cause of the disease. Plant Prot. 2011, 2, 45–49. [Google Scholar]
- Yang, D.; Yang, Y.; Li, H. Comparation of digital PCR and fluorescent PCR for detecting kitchen-waste vegetable oil. Chin. J. Health Lab. Technol. 2015, 19, 3221–3225+3230. [Google Scholar]
- Gao, Y.X.; Lu, Z.J.; Zhong, B.L.; Yi, L.; Su, H.N.; Zhao, P.Y. Citrus greening comparative study of two kinds of fluorescent quantitative PCR detection system. China Soc. Plant Prot. 2014, 5, 237–249. [Google Scholar]
- Hu, H.; Yin, Y.; Zhang, L.; Zhao, Y.; Xia, Y.; Wang, Z.; Tan, J. Detection of Citrus Huanglongbing by Conventional and Two Fluore scence Quantitative PCR Assays. Sci. Agric. Sin. 2006, 12, 2491–2497. [Google Scholar]
- Wang, A.; Deng, X. The research on the diagnosis technology of Citrus Huang longbing. Guangdong Agric. Sci. 2008, 6, 101–103. [Google Scholar]
- Sankaran, S.; Mishra, A.; Maja, J. Visible-near infrared spectroscopy for detection of Huanglongbing in citrus orchards. Comput. Electron. Agric. 2011, 2, 27–134. [Google Scholar] [CrossRef]
- Windham, W.; Poole, G.; Park, B.; Heitschmidt, G.; Hawkins, S.A.; Albano, J.P.; Gottwald, T.R.; Lawrence, K.C. Rapid screening of Huanglongbing-infected citrus leaves by near-infrared reflectance spectroscopy. Trans. ASABE 2011, 54, 2253–2258. [Google Scholar] [CrossRef]
- Sindhuja, S.; Reza, E. Visible-near infrared spectroscopy based citrus greening detection: Evaluation of spectral feature extraction techniques. Crop Prot. 2011, 30, 1508–1513. [Google Scholar]
- Duan, H.; Zhu, R.; Xu, W.; Qiu, Y.-Y.; Yao, X.-D.; Xu, C.-J. Hyperspectral Imaging Detection of Total Viable Count from Vacuum Packing Cooling Mutton Based on GA and CARS Algorithms. Spectrosc. Spect. Anal. 2017, 37, 847–852. [Google Scholar]
- Chen, C. Medical Diagnostic Technology Development of Spectral Signal Combined with Multi-Fusion Strategy. Master’s Thesis, Xinjiang University, Ürümqi, China, 2021. [Google Scholar] [CrossRef]
- Nweke, H.F.; Wah, T.Y.; Mujtaba, G.; Al-garadi, M.A. Data fusion and multiple classifier systems for human activity detection and health monitoring: Review and open research directions. Inf. Fusion 2019, 46, 147–170. [Google Scholar]
- Yang, Q.; Deng, X.; Sun, X. Application and Research Progress of Spectral Data Fusion Technology in Food Testing. Sci. Technol. Food Ind. 2020, 41, 324–329. [Google Scholar]
- Dian, R.; Li, S.; Fang, L. Multispectral and hyperspectral image fusion with spatial-spectral sparse representation. Int. J. Inf. Fusion 2019, 49, 262–270. [Google Scholar] [CrossRef]
- Li, Y.H.; Li, Y.X.; Tan, W. Based on the near-range and medium-infrared spectral method fusion to determine the black fruit and Chinese wolfberry origin and quality information. Spectrosc. Spect. Anal. 2020, 40, 3878–3883. [Google Scholar]
- Gholizadeh, A.; Coblinski, J.; Saberioon, M. vis-NIR and XRF Data Fusion and Feature Selection to Estimate Potentially Toxic Elements in Soil. Sensors. 2021, 21, 2386. [Google Scholar] [CrossRef]
- Wang, W.; Peng, Y. Simultaneous detection of multiple quality paramrters of pork based on fused dual band specteal. Spectrosc. Spect. Anal. 2016, 12, 4001–4005. [Google Scholar]
- O’Rourke, S.; Stockmann, U.; Holden, N.M.; McBratney, A.B.; Minasny, B. An assessment of model averaging to improve predictive power of portable vis-NIR and XRF for the determination of agronomic soil properties. Geoderma. 2016, 279, 31–44. [Google Scholar] [CrossRef]
- Mishra, A.R.; Karimi, D.; Ehsani, R.; Lee, W.S. Identification of Citrus Greening (HLB) Using a VIS-NIR Spectroscopy Technique. Trans. ASABE 2012, 50, 711–720. [Google Scholar] [CrossRef]
- Hocquellet, A.; Toorawa, P.; Bové, J.; Garnier, M. Detection and identification of the two Candidatus Liberobacter species associated with citrus huanglongbing by PCR amplification of ribosomal protein genes of the β operon. Mol. Cell. Probes. 1999, 13, 373–379. [Google Scholar] [CrossRef] [PubMed]
- Li, T.; Ke, C. Detection of the bearing rate of Liberobacter asiaticum, in citrus psylla and its host plant Murraya panciculata by Nested PCR. Acta Phytophylacica Sin. 2002, 29, 31–35. [Google Scholar]
- Qian, W. Study on Detection Method of Citrus Yellow Dragon Disease Based on Nucleic Acid Amplification. Master’s Thesis, Zhejiang University, Hangzhou, China, 2018. [Google Scholar]
- Li, X.; Li, M.; Won, S. Visible-NIR Spectral Feature of Citrus Greening Disease. Spectrosc. Spect. Anal. 2014, 34, 1553–1559. [Google Scholar]
- Yuan, Y.; Jiang, Z.; Wang, D. Study on classification standard of Citrus Huanglongbing disease. Zhenjiang Agric. Sci. 2010, 1, 121–123. [Google Scholar]
- Hawkins, S.; Park, B.; Poole, G.; Gottwald, T.; Windham, W.R.; Lawrence, K.C. Detection of Citrus Huanglongbing by Fourier Transform Infrared-Attenuated Total Reflection Spectroscopy. Appl. Spectrosc. 2010, 64, 100–103. [Google Scholar] [CrossRef] [PubMed]
- Wang, J.; Zhang, X.; Wang, J. On-Site Evaluation of Raw Milk Qualities by Protable Vis/NIR Transmittance Technique. Spectrosc. Spect. Anal. 2014, 10, 2679–2684. [Google Scholar]
- Farzaneh, D.; Farhad, S.; Seyed, H.S.P.; Haidar, F. UAV-based multispectral imagery for fast Citrus Greening detection. J. Plant Dis. Prot. 2019, 126, 307–318. [Google Scholar]
- Chen, Z.; Li, X.; Fan, X. Method for the Discrimination of the Variety of Potatoes with Vis/NIR Spectroscopy. Spectrosc. Spect. Anal. 2016, 36, 2474–2478. [Google Scholar]
- Sun, J.; Wu, X.; Zhang, X. Research on Lettuce Leaves’ Moisture Prediction Based on Hyperspectral Images. Spectrosc. Spect. Anal. 2016, 2, 522–526. [Google Scholar]
- Yang, I.-C.; Tsai, C.-Y.; Hsieh, K.-W.; Yang, C.-W.; Ouyang, F.; Lo, Y.M.; Chen, S. Integration of SCIMCA and near-infrarded spectroscopy for rapid and pricise identification of herbal medicines. J. Food Drug Anal. 2013, 21, 268–278. [Google Scholar] [CrossRef]
- Liu, S. Comparative analysis of image fusion effect evaluation by different resampling methods based on PCA and DWT transformation. Sci. Technol. Innov. 2022, 12, 70–74. [Google Scholar]
- Yue, X.J.; Quan, D.P.; Hong, T.S. Non-destructive hyperspectral measurement model of chlorophyll content for citrus leaves. Trans. Soc. Agric. Eng. (Trans. CSAE) 2015, 31, 294–302. [Google Scholar]
- Liu, S.; Tian, Y.; Zhang, F. Hyperspectral imaging for nondestructive detection of hanfu apple diseases using successive projections algorithm and BP neural network. Food Sci. 2017, 38, 277–282. [Google Scholar]
- Lin, P.; Chen, Y.; He, Y. Identification of geographical origin of olive oil using visible and Near-Infrared Spectroscopy technique combined with chemometrics. Food Bioprocess Technol. 2012, 5, 235–242. [Google Scholar] [CrossRef]
- Barker, M.; Rayens, W. Partial least squares for discrimination. J. Chemom. 2003, 17, 166–173. [Google Scholar] [CrossRef]
- Chen, M. Research on Fault Diagnosis Method of Complex Industrial Process Based on LS-SVM. Master’s Thesis, Nanjing University of Science and Technology, Nanjing, China, 2009. [Google Scholar]
- Vapnik, V.N. Overview of statistical learning theory. IEEE Trans. Neural Netw. 1999, 10, 988–999. [Google Scholar] [CrossRef]
- Liu, X.; Lin, B.; Luo, H. Bearing faults diagnostics based on hybrid LS-SVM and EMD method. Measurement. 2015, 59, 145–166. [Google Scholar] [CrossRef]
- Cheng, M.; Nhat-Duc, H.; Wu, Y. Hybrid intelligence approach based on LS-SVM and Differential Evolution for construction cost index estimation: A Taiwan case study. Autom. Constr. 2013, 35, 306–313. [Google Scholar] [CrossRef]
- Xu, D.; Wu, W.M.; Wang, J.Q. Study on the Correlation between Leaf Chlorophyll Content of Populus euphratica and the Hyperspectral Remote Sensing Data in Upstreamf Tarim River. J. Tarim Univ. 2012, 24, 53–59. [Google Scholar]
- Huang, Y.; Wang, J.; Li, X. Research on fast discrimination between Panax Ginseng and Panax Quinque folium based on near infrared spectroscopy. Spectrosc. Spect. Anal. 2010, 30, 2954–2957. [Google Scholar]
- Huang, G.; Han, L.; Yang, Z. Evaluation of the nutrient metal content in Chinese animal manure compost using Near Infrared Spectroscopy (NIRS). Bioresour. Technol. 2008, 99, 8164–8169. [Google Scholar] [CrossRef] [PubMed]
- Hu, X. Study on NIR spectral characteristics and authenticity discrimination model of milk powder. Inn. Mong. Agric. Univ. 2020, 7, 233–238. [Google Scholar]
- Windham, W.; Kandala, C.V.; Sundaram, J.; Nuti, R.C. Determination of Peanut Pod Maturity by Near-Infrared Reflectance Spectroscopy. Trans. ASABE. 2010, 53, 491–495. [Google Scholar] [CrossRef]
- Li, X.; Lee, W.; Li, M. Spectral difference analysis and airborne imaging classification for citrus greening infected trees. Comput. Electron. Agric. 2012, 83, 32–46. [Google Scholar] [CrossRef]
- Cunliffe, S.; Martin, P.; Baker, M. Near infrared absorption spectroscopy for the quantification of unsulfated alcohol in sodium lauryl ether sulfate. J. Near Infrared Spectrosc. 2010, 29, 11–23. [Google Scholar] [CrossRef]
- Muhammad, B.; Zou, X.; Muhmmad, A. Near infrared spectroscopy coupled with chemometric algorithms for predicting chemical components in black goji berries (Lycium ruthenicum Murr.). J. Near Infrared Spectrosc. 2020, 26, 275–286. [Google Scholar]
- Sun, X.; Subedi, P.; Walker, R. NIRS prediction of dry matter content of single olive fruit with consideration of variable sorting for normalisation pre-treatment. Postharvest Biol. Technol. 2012, 163, 111–123. [Google Scholar] [CrossRef]
- Cao, J.; Zhuo, L. An improved non-negative matrix factorization method of blind unmixing for hyperspectral imagery. Sci. J. Earth Sci. 2013, 3, 107–118. [Google Scholar]


| The Number of Samples | Grade | Leaf Infection | Representative Sample Color Picture |
|---|---|---|---|
| 36 | Normal | No symptoms of greening, polymerase chain reaction test negative | 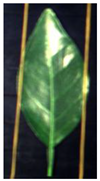 |
| 36 | Slight greening disease | Slight symptoms, polymerase chain reaction test positive | 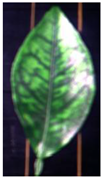 |
| 36 | Moderate greening disease | Moderate symptoms, polymerase chain reaction test positive | 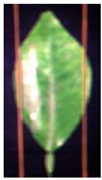 |
| 36 | Serious greening disease | Serious symptoms, polymerase chain reaction test positive |  |
| 36 | Nutrient deficiency | No symptoms of greening, polymerase chain reaction test negative |  |
| Wavelength Range | Kernel Function | Operation Time(s) | Identification Accuracy(%) | ||
|---|---|---|---|---|---|
| Name | Number of Variables | Parameter | |||
| 500–1000 | RBF_Kernel | 665 | γ = 135.62 σ2 = 12,704.14 | 5.44 | 90% |
| Lin_Kernel | 665 | γ = 115.60 | 3.97 | 94% | |
| 1000–2500 | RBF_Kernel | 1555 | γ = 25.14 σ2 = 31.65 | 6.27 | 92% |
| Lin_Kernel | 1555 | γ = 8.29 | 2.23 | 96% | |
| 500–2500 | RBF_Kernel | 2220 | γ = 2090.26 σ2 = 27,965.65 | 9.48 | 92% |
| Lin_Kernel | 2220 | γ = 306.04 | 4.16 | 98% | |
| 500–2500 after second derivative | RBF_Kernel | 2220 | γ = 124.73 σ2 = 19,820.81 | 4.50 | 100% |
| Lin_Kernel | 2220 | γ = 0.09 | 3.06 | 100% | |
| 500–2500 s derivative normalization | RBF_Kernel | 2220 | γ = 586.13 σ2 = 69,463.80 | 6.02 | 98% |
| Lin_Kernel | 2220 | γ = 0.09 | 3.26 | 100% | |
| Number of Samples in the Modeling Set | Prediction Set Sample Number | Identification Accuracy (%) | RMSEC (%) | RMSEP (%) | Rc | Rp | Pc |
|---|---|---|---|---|---|---|---|
| 126 | 30 | 100% | 0.77 | 0.45 | 0.91 | 0.97 | 19 |
| 117 | 39 | 100% | 0.76 | 0.42 | 0.93 | 0.98 | 15 |
| 104 | 52 | 100% | 0.65 | 0.47 | 0.94 | 0.97 | 13 |
| 94 | 62 | 100% | 0.78 | 0.41 | 0.90 | 0.98 | 13 |
| Selection Method | Wavelength Range | Kernel Function | Operation Time/s | Identification Accuracy/% | ||
|---|---|---|---|---|---|---|
| Name | Number of Variables | Parameter | ||||
| PCA | 500–2500 before normalized | RBF_Kernel | 11 | γ = 251.44 σ2 = 46.01 | 1.63 | 100% |
| Lin_Kernel | 11 | γ = 0.09 | 0.66 | 100% | ||
| 500–2500 after normalized | RBF_Kernel | 11 | γ = 2047.44 σ2 = 101.57 | 1.63 | 100% | |
| Lin_Kernel | 11 | γ = 8.81 | 2.05 | 100% | ||
| SPA | 500–2500 before normalized | RBF_Kernel | 55 | γ = 0.93 σ2 = 6.11 | 1.42 | 100% |
| Lin_Kernel | 55 | γ = 0.19 | 1.01 | 100% | ||
| 500–2500 after normalized | RBF_Kernel | 60 | γ = 13.17 σ2 = 70.27 | 1.89 | 96% | |
| Lin_Kernel | 60 | γ = 29.12 | 1.39 | 100% | ||
| Selection Method | PCA | SPA | ||
|---|---|---|---|---|
| Pretreatment method | before normalization | after normalization | before normalization | after normalization |
| Number of variables | 11 | 11 | 55 | 60 |
| Identification accuracy (%) | 90% | 85% | 65% | 88% |
Disclaimer/Publisher’s Note: The statements, opinions and data contained in all publications are solely those of the individual author(s) and contributor(s) and not of MDPI and/or the editor(s). MDPI and/or the editor(s) disclaim responsibility for any injury to people or property resulting from any ideas, methods, instructions or products referred to in the content. |
© 2023 by the authors. Licensee MDPI, Basel, Switzerland. This article is an open access article distributed under the terms and conditions of the Creative Commons Attribution (CC BY) license (https://creativecommons.org/licenses/by/4.0/).
Share and Cite
Xiao, H.; Liu, Y.; Liu, Y.; Xiao, H.; Sun, L.; Hao, Y. Diagnosis of Citrus Greening Based on the Fusion of Visible and Near-Infrared Spectra. Appl. Sci. 2023, 13, 10082. https://doi.org/10.3390/app131810082
Xiao H, Liu Y, Liu Y, Xiao H, Sun L, Hao Y. Diagnosis of Citrus Greening Based on the Fusion of Visible and Near-Infrared Spectra. Applied Sciences. 2023; 13(18):10082. https://doi.org/10.3390/app131810082
Chicago/Turabian StyleXiao, Huaichun, Yang Liu, Yande Liu, Hui Xiao, Liwei Sun, and Yong Hao. 2023. "Diagnosis of Citrus Greening Based on the Fusion of Visible and Near-Infrared Spectra" Applied Sciences 13, no. 18: 10082. https://doi.org/10.3390/app131810082
APA StyleXiao, H., Liu, Y., Liu, Y., Xiao, H., Sun, L., & Hao, Y. (2023). Diagnosis of Citrus Greening Based on the Fusion of Visible and Near-Infrared Spectra. Applied Sciences, 13(18), 10082. https://doi.org/10.3390/app131810082