Article

Noise-Tolerant Data Reconstruction Based on Convolutional Autoencoder for Wireless Sensor Network †

1
Department of Information Communication Convergence Technology, Soongsil University, Seoul 06978, Republic of Korea
2
Department of Software Engineering, Jeonbuk National University, Jeonju 54896, Republic of Korea
3
School of Electronic Engineering, Soongsil University, Seoul 06978, Republic of Korea
*
Author to whom correspondence should be addressed.
This paper is an extended version of our paper published in 2023 International Conference on Information Networking (ICOIN), Bangkok, Thailand, 11–14 January 2023.
Appl. Sci. 2023, 13(18), 10090; https://doi.org/10.3390/app131810090
Submission received: 24 August 2023 / Revised: 4 September 2023 / Accepted: 5 September 2023 / Published: 7 September 2023
(This article belongs to the Section Computing and Artificial Intelligence)

Abstract

:
Maintaining data dependability within wireless sensor network (WSN) systems has significant importance. Nevertheless, the deployment of systems in unattended and hostile areas poses a major challenge in dealing with noise. Consequently, several investigations have been conducted to address the issue of noise-affected data recovery. Nevertheless, previous research has primarily focused on the internal noise of the system. Neglecting to include external factors that impact the WSN system in the study might lead to findings that are not true to reality. Hence, this research takes into account both internal and external noise factors, such as rain, fog, or snow conditions. Moreover, in order to maintain the temporal characteristics and intersensor relationships, the data from multiple sensor nodes are consolidated into a two-dimensional matrix format. The stacked convolutional autoencoder (SCAE) model is proposed, which has the capability to extract data features. The stack design of the SCAE enables it to effectively mitigate the issue of vanishing gradients. Moreover, the weight sharing approach used between the two subnetworks also enhances the efficiency of the weight initialization procedure. Thorough experiments are conducted using both simulated WSN systems and real-world sensing data. Experimental results demonstrate that the SCAE outperforms existing methods for reconstructing noisy data.

1. Introduction

The unprecedented growth of the Internet of Things (IoT) has caused wireless sensor networks (WSNs) to receive considerable attention from the research community. WSNs consist of hundreds of limited-resource sensors connected via wireless links. The main purpose of WSN systems is to collect information about their surroundings. First, the sensor nodes gather data from the environment. Subsequently, they transfer these data to a base station (BS) or sink node for processing. Researchers worldwide have been interested in WSNs owing to their low cost and wide variety of applications. WSNs can be used in many terrains, such as land [1], underground [2], and underwater [3]. They also offer great promise for a variety of applications, such as military target tracking and surveillance [4,5], natural disaster relief [6,7], and biomedical health monitoring [8,9].
It is difficult to monitor every sensor node because the majority of them are located in areas that are not easily accessible. Therefore, sensors may malfunction or be exposed to various factors. This leads to noise issues when the WSN operates, which significantly affects the system performance. One study [10] shows that the WSN performance is significantly degraded when receiving and transmitting data via wireless channels that are influenced by noise. The network may experience data loss or corruption.
Many different noise-causing factors exist, and each has a different impact on the system, depending on the environment and the system itself. Therefore, studying the effects of noise is critical for increasing the effectiveness of the entire system. Various sources of noise can interfere with wireless networks. Generally, the noise is caused by internal or external events. Internal events are factors inside the WSN system that produce noise, and they occur when sensor nodes gather and measure information from their surroundings. In contrast, external events are noise-causing factors from the outside. These could include environmental changes, the sudden appearance of an obstruction between the sensor node and the base station, etc. External events mainly impact WSNs when transmitting data from the sensor nodes to the sink nodes.
Although noise reduction in WSNs is not a new research topic, very few studies have specifically investigated noise caused by external events. This motivated us to carefully consider the noise caused by harsh weather conditions, including rain, snow, and fog. These weather conditions were modeled as attenuation models. The impact of these unfavorable weather conditions was considered when data were transferred from the sensor nodes to a sink node. This noise can negatively affect the reliability of the data because it causes some data packets to be lost when transferring from the sensor nodes to the base station. The missing data packets significantly affect the completeness of the data received by the sink node.
Traditional methods to prevent missing data require the sensor to resend the packet data. However, this solution is not desirable because of energy loss, communication delay, and inefficiency. In recent years, missing data reconstruction has become the preferred approach. The process of missing data reconstruction involves the recovery or reconstruction of missing data through the utilization of previously collected data points [11]. Many studies use algorithms for data recovery. However, most of them do not efficiently use the data from readings from the past, present, and neighborhood because the proposed algorithms are relatively simple and ineffective.
In [12], the authors proposed a data reconstruction algorithm that replaces the missing data with the average of the data series, relying on its own data history. This is quite straightforward. An approach based on machine learning was proposed to address this problem by exploring the correlation between data in the sensors [13]. However, traditional machine learning algorithms only calculate the relationship between data from the same sensor and ignore data from neighboring sensors. Therefore, a reconstruction approach based on a convolutional neural network (CNN) emerges as a potential approach for utilizing multiple directions of data from multiple sensors.
A CNN combined with an autoencoder (CAE) is a popular model for reconstructing missing data. This model takes advantage of the spatiotemporal correlations in sensor data; thus, its performance should be better than that of existing data recovery methods. Therefore, in this study, we employed a CAE to address the loss of data due to noise.
In a normal CAE model, before training, the convolution layer and dense layer weights are initialized randomly. However, random weight initialization may cause the optimized loss function to drop into weak local optima when the training is complete. As a result, the performance of the CAE is significantly diminished. Therefore, we proposed a stacked convolutional autoencoder (SCAE), which is more advanced. This technique pretrains the initial weights before the learning model employs them in the training process. Therefore, this method can obtain a stronger local optimum compared with a traditional CAE. Finally, we compared the performance of the SCAE with other available data reconstruction techniques in terms of error.
In addition to external noise, in this research, we also consider the impact of noise caused by internal events, specifically thermal noise. The noise corrupts the data sent to the sink node, which also decreases the data transmission reliability. The proposed SCAE not only solves the problem of losing data from external event noise but also revises data changed by internal events.
The main contributions of this study are as follows:
  • We analyzed the impact of noise caused by harsh weather conditions, such as rain, snow, and fog. We also considered the effect of noise due to internal factors, such as thermal noise.
  • We successfully adopted a stacked convolutional autoencoder (SCAE) to reconstruct the data affected by this noise.
  • We conducted extensive experiments to demonstrate the outstanding performance of the proposed model in terms of training and testing errors.
The remaining sections of this paper are structured as follows: In Section 2, we discuss the recent data reconstruction investigations. Internal and external noise models are introduced in Section 3. The proposed framework for data reconstruction is presented in Section 4. The experiment conducted to evaluate the proposed model is described in Section 5. The analysis of the contributions of this study is presented in Section 6. The paper concludes in Section 7.

2. Related Work

External and internal events play a crucial role in the reliability of data transmissions, and their study has grown increasingly appealing in recent years. Table 1 summarizes recent studies on noise reduction, considering both internal and external events.

2.1. External Events

As mentioned previously, external events mainly affect WSNs when sending packets from sensor nodes to the base station. This section reviews previous studies related to recovering data lost through external events.
In [14], the authors employed an approach based on matrix factorization (MF) using any weights to recover the missing time series data. Although this method can be used with numerous attributes, it is extremely complex. A distributed data prediction model was proposed by [12]. The model predicted upcoming measurements and recovered the missing sensor readings that resulted from diffusion faults and sleep schedules. In [15], an approach was proposed to predict missing readings from a sensor node by utilizing matrix completion techniques. The proposed method considers the correlation between sensor nodes to address the randomly missing data. The disadvantage of these algorithms is that they are relatively straightforward and have limited success in discovering the relationship between the data and sensors to recover the missing data.
In the study [16], a method for reconstructing missing data was introduced. This method utilized a multiple linear regression (MLR) model that incorporated spatiotemporal correlation. The results demonstrated the effectiveness of the model in terms of the mean absolute error (MAE), mean squared error (MSE), and data reliability. Subsequently, a clustering strategy was employed to compute the internode correlation. Another study [13] proposed a novel approach using deep learning techniques to recover lost measurement data. The recovered signal was highly consistent with the original signal in both the time and frequency domains.

2.2. Internal Events

In this section, we summarize research on reconstructing model data lost through internal events. Jana et al. [21] introduced a framework to identify and address sensor faults, which are missing, spiky, random, and drifting. Initially, a CNN was employed to determine the existence of a fault and classify its specific type. Subsequently, a collection of distinct CAE networks, each specifically trained to correspond to a particular type of fault, was utilized for the purpose of reconstruction. Jeong et al. [18] introduced a data-centric approach involving a bidirectional recurrent neural network (BRNN) to reconstruct sensor data. This approach takes into account the spatiotemporal correlations present among the sensor data.
Researchers have investigated data reconstruction techniques based on compressive sensing in order to mitigate the impact of data packet losses in wireless sensor networks [19]. This system uses a compressive sensing technique to rebuild data after a packet loss. The algorithm under consideration demonstrates significant promise within the domain of structural health monitoring. Tay et al. [20] used a recursive graph median filter to simultaneously address impulsive and Gaussian noise. The proposed filter is ideal for sensor networks with low resources because it can be implemented with distributed processing.
The data reconstruction scheme proposed by Chen et al. [17] utilizes matrix completion and temporal stability as its foundation. The problem of data reconstruction was initially conceptualized as a matrix completion task, wherein structural noise was taken into account. This approach relied on the identification and utilization of low-rank characteristics inherent in the sensory environmental data. The matrix completion issue was then constrained to achieve short-term stability to further reduce the reconstruction error. To overcome this issue, an algorithm based on the operator splitting technique and the block coordinate descent method was developed.

3. Noise Model

In this study, we considered the impact of extreme weather conditions on WSN systems, as illustrated in Figure 1, by building attenuation models of wireless signal transmissions. In addition, we investigated the effect of noise due to internal factors by considering the effect of thermal noise on the transmission process.

3.1. External Noise

In this section, the effects of external events, including extreme weather conditions, on wireless signal transmission are considered. First, we modeled the weather conditions as an attenuation model. Subsequently, we calculated the data loss based on the model.

3.1.1. Rainfall Attenuation Model

Rain attenuation plays a significant role in determining the dependability of a wireless network. Let k and α be the frequency-dependent coefficients associated with linear polarization. The values of the variables k and α may be determined by the use of curve-fitting-derived equations, which are applied to the connection frequency f. Let ( k v , α v ) and ( k h , α h ) denote the vertical and horizontal local polarizations, respectively. k h | v and α h | v are calculated based on the equation below.
log 10 k h | v = j = 1 4 a j h | v exp log 10 f b j h | v c j h | v 2 + m k h | v log 10 f + c k h | v ,
α h | v = j = 1 5 a j h | v exp log 10 f b j h | v c j h | v 2 + m α h | v log 10 f + c α h | v ,
where a j h | v , b j h | v , c j h | v , m k h | v , c k h | v , m α h | v , and c α h | v are coefficients referenced from [22].
The coefficients are determined as follows [23]:
k = k h + k v + ( h h k v ) c o s 2 ( θ ) c o s ( 2 τ ) 2 ,
α = k h α h + k v + ( k h k v c o s 2 ( θ ) c o s ( 2 τ ) 2 k ,
where θ and τ represent the elevation and tilt angles of the signal, which are associated with the propagation route and vary from 90 ° to 90 ° .
In this work, a rainfall attenuation model, as described in [23], was used to estimate the route loss of signals propagating inside an area experiencing rainfall. The rain attenuation γ rain (dB/km) is calculated based on the power law relationship as follows:
γ rain = k R α ,
where R (mm/h) is the rain rate.

3.1.2. Snow Attenuation Model

Connectivity in WSNs experiences a decrease in reliability and performance as a result of signal attenuation and depolarization induced by air particles. Similar to rainfall, snowfall may have a substantial impact on the transmission of radio frequency (RF) communications. It is a widely used approach to consider snow as equivalent to rainfall and calculate the attenuation of signal transmission using a rain model. According to [24], the wet snow attenuation γ snow (dB/km) is significantly influenced by the frequency of propagation. The variable R S (mm/h) is defined as the liquid water content, and the snow attenuation is determined as follows:
γ snow = 0.00349 × R s 1.6 λ 4 + 0.00224 × R s λ ,
where λ (cm) is the wavelength of the propagating signal carrier frequency f (Hz).

3.1.3. Fog Attenuation Model

Let ξ (g/m3) be the density of liquid water in the fog. According to [25], the fog attenuation, denoted as γ fog , is then determined using the Rayleigh approximation, which may be expressed as follows:
γ fog = K l ( f , T ) ξ ,
where K l ( f , T ) (dB/km/(g/m3)) is the specific attenuation coefficient based on the signal carrier frequency f (GHz) and cloud liquid water temperature T (K).
The main relaxation frequency f p and the secondary relaxation frequency f s are defined in the following expressions:
f p = 20.2 146 ( 300 T 1 ) + 316 ( 300 T 1 ) 2 ,
f s = 39.8 f p .
ϵ represents the dielectric permittivity coefficient, which can be computed by using the double Debye equation [26]:
ϵ = ϵ 0 ϵ 1 1 + f f p + ϵ 1 ϵ 2 1 + j f f s + ϵ 2 ,
where j = 1 . Therefore, the imaginary and real components of ϵ are below:
ϵ = f ( ϵ 0 ϵ 1 ) f p ( 1 + ( f f p ) 2 ) + f ( ϵ 1 ϵ 2 ) f s ( 1 + ( f f s ) 2 ) ,
ϵ = ϵ 0 ϵ 1 1 + ( f f p ) 2 + ϵ 1 ϵ 2 1 + ( f f s ) 2 + ϵ 2 ,
where
    ϵ 0 = 77.66 + 103.3 ( 300 T 1 ) ,
  ϵ 1 = 0.067 ϵ 0 ,
ϵ 2 = 3.52 .
The specific coefficient of fog attenuation is determined using the following calculation:
K l ( f , T ) = 0 , 819 f ϵ 1 + 2 + ϵ ϵ 2 .
As a result, the fog attenuation is determined as follows:
γ fog = 0 , 819 f ξ ϵ 1 + 2 + ϵ ϵ 2 .

3.1.4. Weather Noise

The signal attenuation caused by weather conditions is incorporated into the path loss log-normal shadowing channel model. Let γ weather | weather = { rainfall , snow , fog } represent the level of attenuation caused by severe weather conditions, including heavy rainfall, wet snow, and fog. The total signal attenuation induced by inclement weather, denoted as L weather , may be determined using the following formula:
L weather = d × γ weather ,
where d (km) represents the distance between the receiver and emitter of the two sensors.
The received signal strength indicator (RSSI) (dBm) refers to the measurement of signal intensity at the receiver sensor, which is located at a distance d from the transmitter sensor. The expression for the value of RSSI at a given distance d is as follows:
RSSI ( d ) = P tx P loss ( d 0 ) 10 η pl log 10 d d 0 L weather X σ ,
where P tx and X σ represent the transmitted power and a zero-mean Gaussian distribution with variance σ due to multipath and shadow fading. Moreover, P loss = 20 log 10 ( 4 π d 0 / λ ) represents the path loss over a reference distance of d 0 = 1 (m) [27], while 10 η pl log 10 d d 0 denotes the additional path loss due to the distance between the transmitter and receiver, where η pl is the path loss coefficient.
The threshold value of the RSSI is denoted as RSSI threshold . In this research, we established a value of 80 dBm as the threshold for the RSSI [28]. In the event that the RSSI of the receiver sensor falls below the predetermined threshold value, the receiver sensor is unable to successfully retrieve the signal that was originally provided by the sender. Consequently, the packets that are received are dropped. In summary, we may model this information as follows:
S receive = 0 , RSSI < RSSI threshold , S receive , RSSI > RSSI threshold .

3.2. Internal Noise

In practice, the data collected from the environment by sensors is not always clean. Numerous factors can influence measurement data. Specifically, this study examines the impact of thermal noise on the received data. Thermal noise is often described as Gaussian white noise with a zero mean and high variance δ noise 2 δ normal 2 . Adding Gaussian noise, S noise , causes the sensor output variance to increase significantly above the usual state. We express the receiver signal S receive under the effect of noise as
S receive = S normal + S noise ,
where S noise = N ( 0 , δ noise 2 ) . Based on [29], we set δ noise 2 = 0.1 and δ normal 2 = 0.01 . In order to assess the impact of internal noise on sensor data, an experiment was conducted using real-world data and focusing on the presence of thermal noise. In this investigation, a publicly available dataset was used, including measurements of particulate matter (PM) 2.5 levels in Beijing City, China, spanning the time period from December 2013 to October 2022. Figure 2 shows normal data and the data affected by thermal noise when we run the experiment with the PM 2.5 dataset.

4. Methodology

As shown in Figure 3, our architecture consists of two main phases, namely, data processing and data reconstruction. During the data preprocessing phase, the input data obtained from several sensors will be collected and combined into a two-dimensional form. This procedure facilitates the incorporation of temporal attributes and the interconnection of sensors within the incoming data. During the data reconstruction phase, the processed data serve as the primary reference. The proposed model is used for the purpose of extracting intrinsic features while efficiently eliminating both internal and external noise.

4.1. Data Preprocessing

The input data play an important role in the CAE architecture for data reconstruction. To efficiently use the CAE, we propose to format the input data as a combination of data from multiple sensors in the WSN system. We thereby utilize a temporal data structure that combines a historical record and the relationship between neighboring sensors. At each sample time, the sensor measures the data from the environment and transmits it to the central sensor via a wireless channel.
We set N as the number of samples used to build the data for the training process. By employing sequential data, we can utilize historical records to explore the relationship between data in contiguous time samples in the same sample interval for the training process. Thus, the data of the i-th sensor s i can be expressed as follows:
S i = { s i , 1 , s i , 2 , , s i , N } ,
where s i , n denotes the received data of sensor S i at the n-th sample time. We set M as the number of sensors required to obtain data from the environment.
Obviously, in addition to considering the relationship between data on the same sensor, the relationship between sensors also needs to be considered. Therefore, it motivates us to combine the data of M sensors by formatting them as a two-dimensional (2D) array for the input data. Therefore, input data A, formatted for the CAE networks, is illustrated in Figure 4 and expressed as
Y = { S 1 , S 2 , , S M } .
Therefore, a CAE architecture was utilized to exploit the input data as a 2D array for the training process. The CAE architecture for reconstruction is presented in detail in the following subsection.

4.2. Convolutional Autoencoder for Data Reconstruction

A reconstruction method called an autoencoder (AE) [30] attempts to learn an approximation to the identity function, that is, x = f ( x ) , where x is the input and f ( x ) is the output. The bottleneck layer contains fewer nodes than the previous layers to obtain a representation of the input. The bottleneck layer encodes the underlying data structure (typically in compressed form). Subsequently, the encoder layers compress the data, and the decoder layers decompress it.
Unlike artificial neural networks, the AE does not use information from the area around the input data. In contrast to other neural network designs that employ stacking, the convolution process takes advantage of the spatial and temporal data structures to find correlations more quickly. Two ideas, convolution and autoencoding, are combined [31] to find underlying features in the data while retaining the neighborhood relationships between the pixels. They begin with convolutional layers that extract features, followed by bottleneck layers that employ feature maps to compress the data. The decoder, which completes the reconstruction, follows. Owing to the preservation of the 2D input data structure and the fact that each feature does not need to be connected to the global scale, a CNN-based AE (CAE) is far more resilient than AE and can rebuild images using small patches rather than requiring complete image information [32].
A CAE model, which is a powerful tool for compressing and reconstructing data, is described in Figure 5. The model is made up of two main kernel networks, the encoder and decoder, which work together to encode and decode data, respectively. Convolution layers are used in both the encoder and decoder kernels to extract the necessary information from the input data and reconstruct it using the bottleneck layer.
To further improve the performance of the AE model, dense layers are employed between the AE and decoder kernels. These layers serve to enhance the encoding and decoding processes, thereby improving the overall performance of the network for data reconstruction. In this study, careful consideration was given to the number of dense layers used in the model. After evaluating performance, it was determined that five dense layers provided optimal results. Notably, a symmetric dense layer network is used for encoding and decoding purposes, ensuring that the number of nodes in dense layers 1 and 5 is equal, and layers 2 and 4 are equal. By carefully considering the structure of the CAE model, including the use of convolution and dense layers, this study has successfully developed a powerful tool for data reconstruction. As seen in Figure 5, the affected data from 20 sensors S i are composed of the missing data due to the extreme weather conditions and noise due to internal events. After the training process, the affected data are reconstructed to become the data S ^ i as close to the data S i as possible.
In the training process, the loss function of the mean squared error (MSE) is used and minimized by the CAE network model to make the output data Y ^ approximate the ground truth Y as closely as possible. This can be expressed as follows:
L = 1 K train i = 1 K train | | Y ^ i Y i | | 2 = 1 K train i = 1 K train m = 1 M S ^ i , m S i , m 2 ,
where K train denotes the number of training data points in each batch.
Backpropagation is used to update the weights of the layers using the gradient descent method, as follows:
W conv = W conv η W conv L W deconv = W deconv η W conv 2 L W 12 = W 12 η W 12 L W 23 = W 23 η W 23 L W 34 = W 34 η W 34 L W 45 = W 45 η W 45 L ,
where η denotes the learning rate of the training process. In addition, W conv and W deconv denote the weights of the convolutional layers in the encoder and decoder kernels, respectively. Furthermore, W 12 , W 23 , W 34 , and W 45 correspond to the weights between dense layers { 1 , 2 } , { 2 , 3 } , { 3 , 4 } , and { 4 , 5 } , respectively.

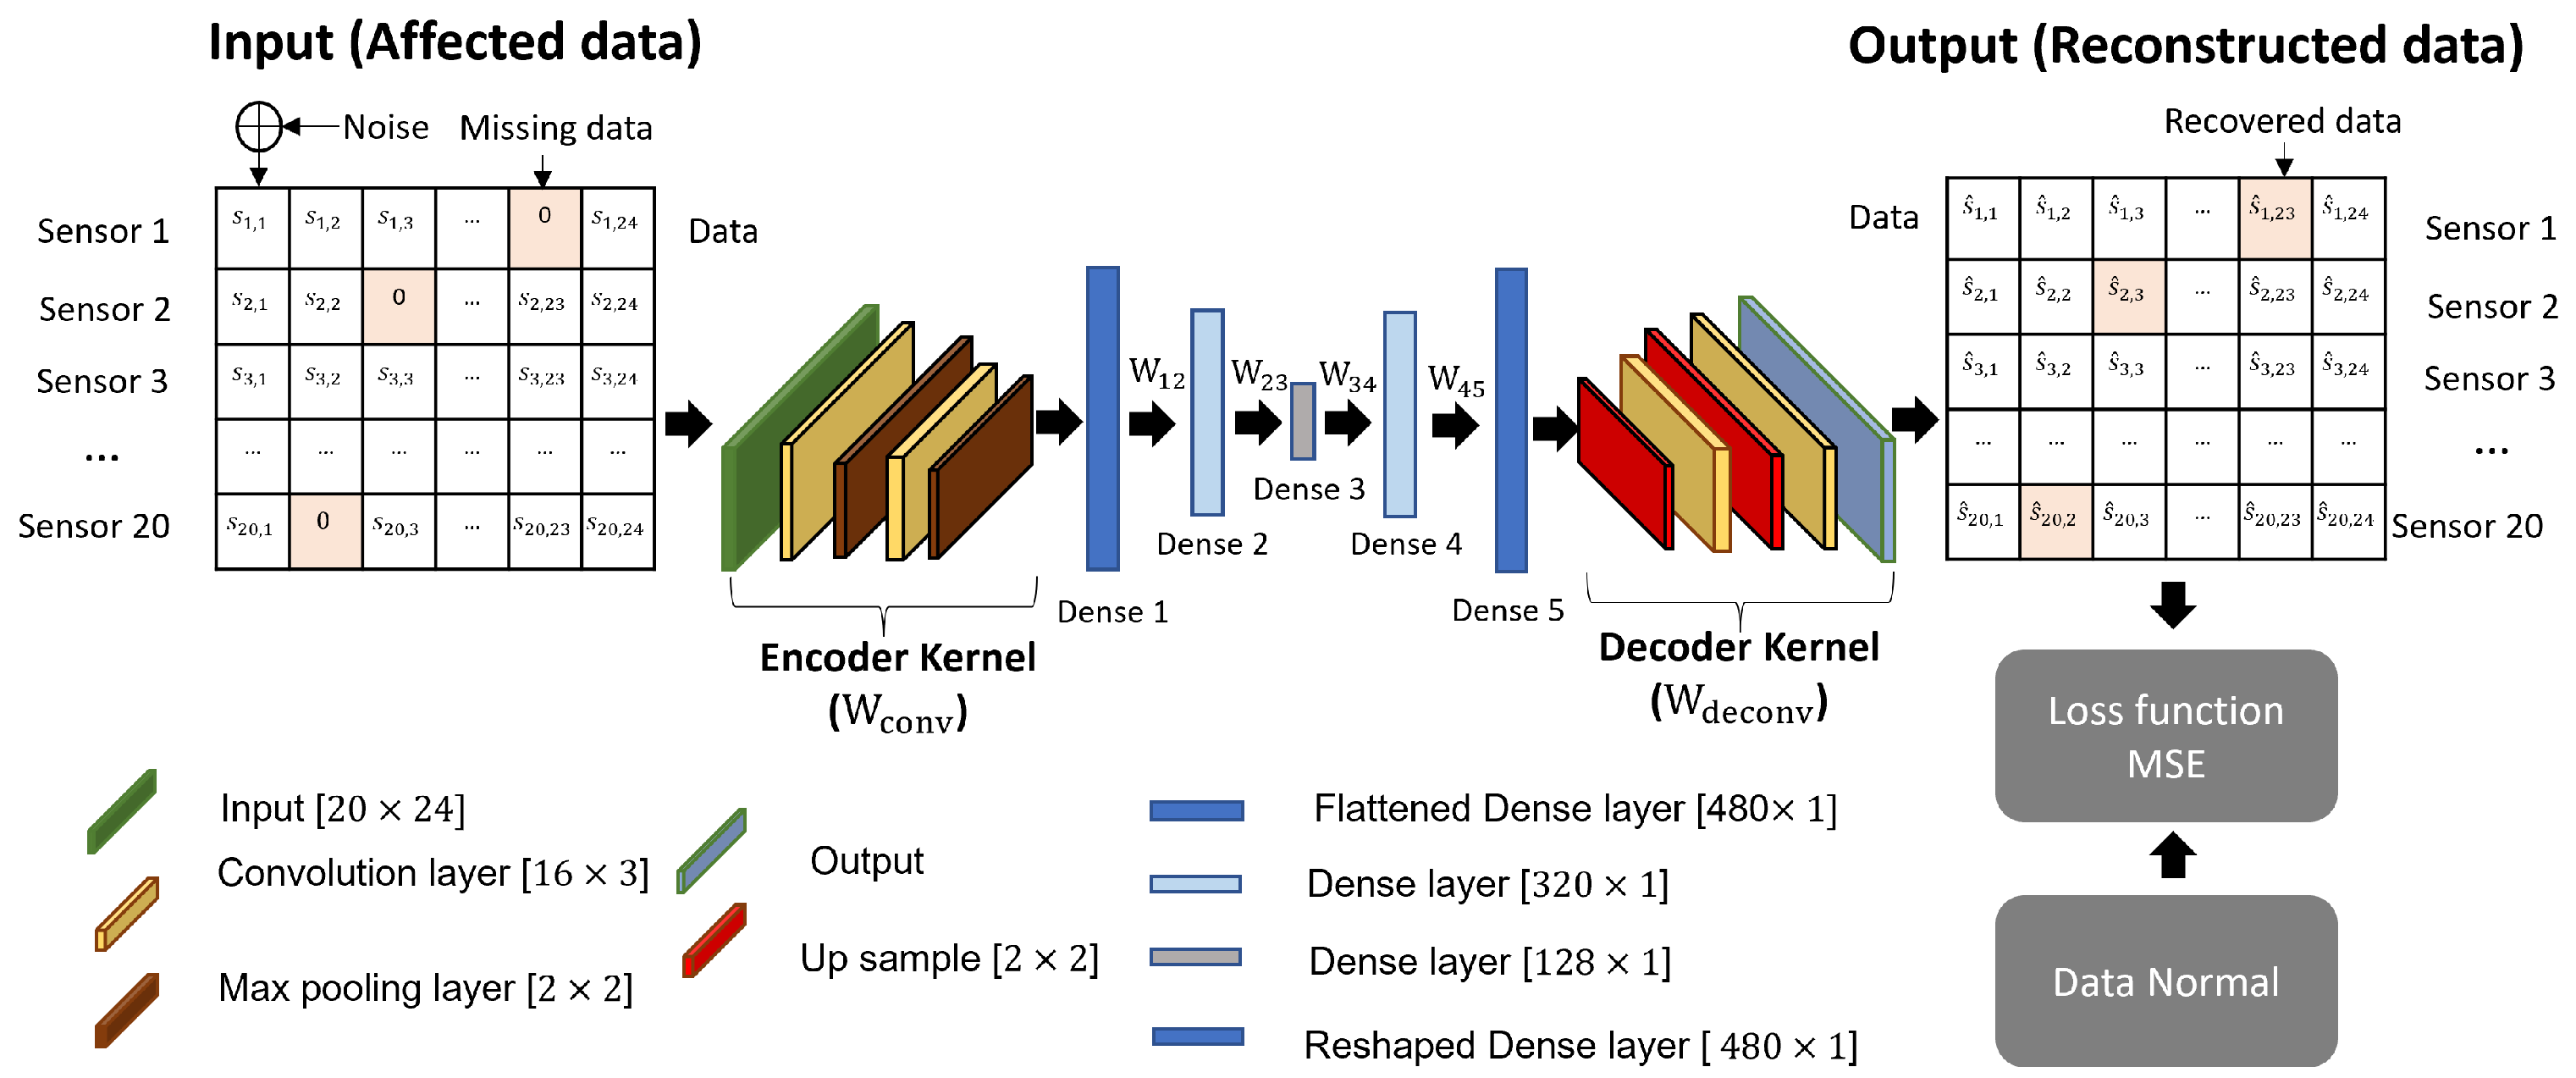
4.3. Proposed Stacked Convolutional Autoencoder for Data Reconstruction

To train a conventional CAE, the weights of the convolution and dense layers must be randomly initialized before training. However, randomly initializing the weights leads to an optimized loss function L that is prone to falling into weak local optima after finishing training. Consequently, the performance of the CAE is significantly degraded.
To address this problem, we propose an SCAE model for efficiently reconstructing problems caused by external and internal events. Specifically, our proposed model is composed of two AE subnets, such as subnets AE 1 and AE 2, which are trained to obtain the optimal weights. After each subnet is trained, the complete initial AE network uses alternative weights from the AE subnets for the training process. The architecture of the proposed model is illustrated in Figure 6.
The structure of subnet AE 1 is composed of the encoder and decoder kernels from the initial CAE network; they contain weights W conv and W deconv , respectively. The structure of subnet AE 2 is composed of the dense layers of the initial CAE network, which contain weights W 12 , W 23 , W 34 , and W 45 , respectively. Based on the stacked AE framework, the first step is to train subnet AE 1 to obtain the weights W conv and W deconv . Subsequently, subnet AE 2 is trained using the trained subnet AE 1 to obtain W 12 , W 23 , W 34 , and W 45 . Finally, the entire SCAE network is trained using the pretrained weights as the initial weights. The training process is presented in detail below.

4.3.1. Step 1: Recursive Pretraining of the Weights

(1) Training subnet AE 1. The loss function of the MSE is used and minimized by the subnet AE 1 network model to make the output data Y ^ approximate the ground truth Y as closely as possible, as follows:
L 1 ( W conv , W deconv ) = 1 K 1 i = 1 K 1 | | Y ^ i Y i | | 2 ,
where K 1 is the number of training data samples in each batch of subnet AE 1.
Backpropagation is used to update the weights of the convolution layers using the gradient descent method, as follows:
W conv = W conv η W conv L 1 W deconv = W deconv η W conv 2 L 1 .
(2) Training subnet AE 2. We set Q as the output data of the encoder kernel in subnet AE 1 after completing the training process in Step 1. Subnet AE 2 uses output data Q as its input. Moreover, the subnet AE 2 network model also minimizes the loss function of the MSE to approximate the output data Q ^ as closely as possible to the output of subnet AE 1’s encoder kernel. The loss function L 2 of subnet AE 2 is expressed as
L 2 ( W 12 , W 23 , W 34 , W 45 ) = 1 K 2 i = 1 K 2 | | Q ^ i Q i | | 2 ,
where K 2 denotes the number of training data samples in each batch.
Backpropagation is used to update the weights of the dense layers using the gradient descent method, as follows:
W 12 = W 12 η W 12 L 2 W 23 = W 23 η W 23 L 2 W 34 = W 34 η W 34 L 2 W 45 = W 45 η W 45 L 2

4.3.2. Step 2: Use the Preinitialized Weights from Step 1 to Train the Entire SCAE Network

After weights W conv , W deconv , W 12 , W 23 , W 34 , and W 45 are pretrained, they serve as the starting points for training the entire network. Step 2 uses a training procedure similar to that of the CAE model presented above.

5. Experiment and Evaluation

5.1. Experimental Settings

The low-energy adaptive clustering hierarchy (LEACH) was the first dynamic clustering protocol proposed for hierarchical sensor networks and is a routing method developed by Heinzelman of MIT [33]. The LEACH protocol has been widely acknowledged as a proactive sensor network protocol that operates in a self-organizing hierarchical manner. It utilizes adaptive clustering techniques to effectively reduce the energy consumption of network components, hence prolonging their operational lifespan [34].
The core concept of the LEACH protocol is to organize nodes into clusters to distribute energy among all nodes in a network. LEACH assumes that the sink node is fixed and located far from the sensor nodes. In addition, all the sensor nodes are homogeneous and have limited energy and memory. Consequently, inside every cluster, a central node known as a cluster head (CH) collects the data acquired from the sensors within its cluster and then sends it to the sink node. This approach serves to decrease energy consumption and mitigate the amount of data sent to the central base station. It is assumed that the sensor nodes are positioned at the same height and that the antennas are mounted in a vertical orientation. Consequently, the elevation angle θ and tilt angle τ of the signal are both configured to be 0, as shown in Table 2.
Figure 7 presents a LEACH-based WSN simulated using MATLAB, with the simulation parameters summarized in Table 3. The sink node is denoted by a green asterisk, which is positioned at the fixed coordinates of ( 250 , 460 ) . The sensor nodes are scattered in a random manner within an area of 500 m by 500 m. Each iteration consists of two phases: setup and steady state. In the setup phase, two CH nodes are selected from among the sensor nodes. The CH nodes are denoted as orange circles in Figure 7. Each CH broadcasts an advertising message (ADV-CH) to the other nodes, shown as small circles without a background color, resulting in the formation of two distinct clusters. Subsequently, each member node decides which cluster it belongs to by selecting the CH node with the highest received signal strength indicator for its ADV-CH message.
In the steady-state phase, nodes gather data from their respective environments and send them to their CH within their designated time slot, following a time division multiple access (TDMA) schedule. CHs receive all data from their member nodes during normal operation and transmit them to the BS. Following a pre-established temporal interval, the network initiates a further iteration by turning back to the setup and steady-state stages.
In addition to constructing a simulation model for a LEACH-based WSN, we also include real sensor data gathered in Beijing City, China, from December 2013 to October 2022. The sensor member nodes gather environmental data, such as PM2.5, P10, AQI, temperature, and O3. These data will be sent to the CH nodes using a wireless channel. In order to evaluate the effectiveness of the data reconstruction model, we introduce additional noise to the sensed data and attempt to effectively recover the original data. The presence of noise encompasses both internal sources, such as thermal noise, and external sources caused by adverse weather conditions, such as rain, fog, or snow, simulated according to the parameters in Table 2.
Given that the sensor nodes are situated in close proximity, it may be assumed that they are impacted by identical weather conditions. The measurement of attenuation can be determined by leveraging the equations outlined in Section 3.1 and applying the environmental parameters specified in Table 2. The addition of weather-induced attenuation to all data transmission channels from member nodes to the CH is carried out in accordance with Equation (19). If the RSSI at the receiver sensor falls below the predetermined threshold RSSI, the sensed data will be assigned a value of 0. Conversely, if the RSSI exceeds or equals the threshold, the received value will stay unchanged. In the presence of internal noise, each data sample is susceptible to the addition of noise that is randomly produced based on a Gaussian distribution with variance δ noise 2 = 0.1 , as explained in Section 3.2.

5.2. Performance Evaluation

The difference between the ground truth and reconstructed data was used to evaluate the effectiveness of the data reconstruction model after the training process. We can use the aforementioned MSE loss function (24) for evaluation; however, the measurement units of the datasets differ. As a result, for convenience of use, we normalize the loss function into the common metric (%), called an error metric, which can be used to evaluate various forms of various datasets. In this study, the error metric was employed as a reliable method for assessing the performance of all data reconstruction techniques. It was calculated as follows:
error(%) = | | Exact data Reconstructed data | | 2 | | Exact data | | 2 × 100 , = i = 1 K | | Y ^ i Y i | | 2 i = 1 K | | Y ^ i | | 2 × 100 ,
where the exact data are the ground truths, and the reconstructed data are the outputs of the reconstruction schemes.
In addition, K = { K train , K test } , where K train and K test correspond to the number of training and testing data of the training and testing errors, respectively. Therefore, the error value reflects the performance of the system after training and testing. The higher the error value, the worse the system performance. In essence, it is equivalent to the value of the loss function after normalization to enable the objective evaluation of the system performance with all types of datasets.
For the purpose of evaluating the effectiveness of the proposed model, this study investigates several noise-affected data reconstruction methods.
  • Partial least squares regression (PLSR): PLSR [35] models each relationship in multivariable data using statistical techniques. Based on the detected correlation, it is possible to make predictions for data that are influenced by noise.
  • Bidirectional recurrent neural network (Bi-RNN): Bi-RNN [18] can capture temporal dependencies in both the forward and reverse orientations. Bi-RNN can effectively denoise and reconstruct data sequences.
  • Convolutional autoencoder (CAE): The CAE [31] inherits the data recovery capabilities of the AE network. Additionally, the combination with a convolutional network helps the CAE handle effectively two-dimensional data.

5.2.1. Impact of the Dense Layers on the SCAE Model

As mentioned previously, the number of dense layers plays an important role in improving the encoding and decoding processes of the SCAE network model for data reconstruction. To evaluate the efficiency of different numbers of dense layers in the SCAE, we conducted an experiment using the real PM 2.5 dataset.
All member sensors collected PM 2.5 data from the environment and transmitted them to CH nodes in a LEACH-based WSN system. The impacts of external and internal events, such as extreme weather conditions and noise, on the PM 2.5 dataset were simulated based on the phenomena presented above. After the SCAE is trained, the results shown in Table 4 prove that the number of dense layers must be set appropriately for the proposed learning system.
If the number of dense layers is too small, the learning model struggles to learn the characteristics of the dataset. In contrast, if the number of dense layers is excessive, the learning model can take too long to run and may readily fall into a local optimum. As can be seen, when the number of dense layers is one, the mistakes are the greatest, and when the number of dense layers is five, the errors are minimized. As a result, we selected five dense layers for the architecture proposed in this study.

5.2.2. Performance Comparison

We conducted an experiment using the PM 2.5 dataset to verify the effectiveness of the SCAE model. Particularly, both internal and external noise affect sensed data simultaneously. Training and testing errors are the two performance metrics used to evaluate the efficiency of the proposed framework. Table 5 summarizes the simulation results when running the experiments with the process dataset using several existing reconstruction techniques. We selected partial least squares regression (PLSR) [35] and a bidirectional recurrent neural network (RNN) [18] because they are popular and traditional regression techniques that can be used for reconstruction. As shown in Table 5, the proposed stacked CNN achieved the best results with a training error of 1.06 % and a testing error of 1.09 %.
In addition to investigating the performance of the proposed framework using the parameters provided in Table 2, we conducted experiments involving varying degrees of severity for different types of weather situations. A survey of weather conditions at different levels using the PM 2.5 dataset is carried out in Table 6. It can be seen that weather conditions have a significant impact on the performance of data reconstruction after using the proposed SCAE model. As weather conditions worsen, the ability of data reconstruction to function effectively decreases. This is due to the increased attenuation of signals between the sensor receiver and the transmitter. Essentially, when the weather is severe, more of the transmitted data are lost, making it more challenging to recover the information.
In addition, experiments were conducted to investigate the influence of internal noise on the performance of data reconstruction using the PM 2.5 dataset. The noise variance value is determined within the range of 0.1 to 1, with no consideration of weather-related factors. Figure 8 and Figure 9 provide convincing evidence of the enhanced performance shown by the proposed approach in comparison with the original CAE. In particular, with a variance of noise of 0.1 , the training error of the SCAE is 1.33 , whereas that of the CAE is 2.54 . When the variance of the noise was raised to a value of 1, the training error of the CAE exhibited a rise of more than twice the magnitude compared with that of the SCAE. Similarly, the test error gap between the SCAE and CAE is 1.38 when δ noise 2 = 0.1 ; however, it increases to 2.73 when δ noise 2 = 1 . It is obvious that the SCAE consistently outperforms the CAE with varying noise variance.
In addition to the PM 2.5 dataset that we used to evaluate the efficiency of the proposed SCAE network, we also conducted experiments with many different datasets, such as the temperature, air quality index (AQI), O3, and PM 10 listed in Table 7. It can be observed that the SCAE operates efficiently with different datasets and outperforms the normal CAE. Therefore, it can be concluded that using stack techniques for pretraining the weights significantly improves the data reconstruction performance. The proposed model can discover a better local optimum than traditional AE models.

6. Discussion

The effectiveness of the proposed SCAE model in recovering noise-affected data is shown via experimental analysis. Table 5 presents the performance comparison results for PLSR, RNN, and SCAE. While the training error of PLSR is more than three times that of the SCAE, that of RNN is more than two times greater. Similarly, PLSR, RNN, and SCAE have testing errors of 3.42 , 2.69 , and 1.09 , respectively. It is evident that the SCAE demonstrates superior performance compared with currently available data reconstruction approaches. This is the result of using the data of multiple sensors simultaneously, which not only preserves the temporal component of the data of each sensor but also reveals the relationship between the sensors. In addition, the use of a convolutional autoencoder architecture enhances the efficacy of data extraction, particularly when dealing with two-dimensional data. The improvement in the ability to identify and analyze data patterns leads to increased efficiency in the recovery of affected data.
Furthermore, the comparison between the SCAE and CAE is conducted in different scenarios. The experimental results indicate that, despite their shared use of a hybrid CNN and AE framework, the SCAE exhibits superior performance than the CAE across all evaluated comparisons. In the context of using the PM 2.5 dataset, it was observed that the training error of the CAE reached 1.53 % , while that of the SCAE was shown as 1.06 % . Table 5 displays the testing errors of the CAE and SCAE, which are 1.5 % and 1.09 % , respectively. Moreover, the employing of additional actual datasets, such as temperature, AQI, O3, or PM10, demonstrates that the SCAE exhibits enhanced efficacy in the reconstruction of data. In investigations with varying Gaussian noise variances, training and testing errors are substantially reduced. When the variance of the noise increases from 0.1 to 1, there is an observed increase in the gap between the testing error of the CAE and the SCAE. Specifically, the difference in testing error between the two models rises from 1.38 % to 2.73 % , as clearly shown in Figure 9.
The enhanced performance shown by the SCAE in comparison with the CAE may be attributed to enhancements in both the initialization of model weights and the underlying model architecture. The utilization of a more complex structure may give rise to the issue of vanished gradients in the backpropagation process. The use of random weight initialization might also contribute to the possibility of vanishing gradients, hence restricting the model to learn effectively. Furthermore, the presence of inadequately initialized weights might lead to the model getting stuck in local optimum situations. The SCAE employs a stacked fashion, which serves the dual purpose of reducing the size of subnets and optimizing the weight initialization process via the use of a weight sharing mechanism. The efficiency of this approach has been clearly proven through intensive experiments with real-world data.

7. Conclusions

In this study, we addressed the problem of recovering data from noise-affected WSN systems. In contrast with previous investigations that only focused on internal noise, our study incorporates a consideration of external influences, which enhances the feasibility of our research findings in real-world scenarios. The noise that impacts the WSN system is categorized into two main sources: internal noise, such as thermal noise, and external noise, which encompasses adverse weather conditions. The use of data from multiple sensors concurrently is suggested in order to maintain the temporal characteristics of the data and the interdependencies among the sensors. Moreover, the SCAE model, as described, demonstrates efficiency in effectively extracting data characteristics while also addressing the limitations of the original CAE in terms of network structure and weight initialization. Thorough experiments were conducted using both WSN simulations and real-world sensor data. The experimental findings demonstrate that the SCAE has superior performance compared with existing models in noise-affected data reconstruction.
In the future, we intend to expand the performance evaluation of the proposed model to WSN systems implementing additional protocols and real-world datasets. Additionally, we also desire to fine-tune the hyperparameters in order to enhance the performance of the model.

Author Contributions

Conceptualization, T.T.L.; Methodology, T.T.L. and T.P.T.; Formal analysis, T.T.L.; Writing—original draft, T.T.L.; Writing—review & editing, T.P.T., J.C. and M.Y.; Supervision, M.Y.; Funding acquisition, J.C. and M.Y. All authors have read and agreed to the published version of the manuscript.

Funding

This work was supported by the Korea Environmental Industry and Technology Institute (KEITI) through a grant funded by the Korean government (Ministry of Environment) (Project No. RE202101551, Development of IoT-Based Technology for Collecting and Managing Big Data on Environmental Hazards and Health Effects).

Institutional Review Board Statement

Not applicable.

Informed Consent Statement

Not applicable.

Data Availability Statement

The data presented in this study are available on request from the corresponding author.

Conflicts of Interest

The authors declare no conflict of interest.

References

  1. Kadir, E.A.; Irie, H.; Rosa, S.L. Modeling of wireless sensor networks for detection land and forest fire hotspot. In Proceedings of the 2019 International Conference on Electronics, Information, and Communication (ICEIC), Auckland, New Zealand, 22–25 January 2019; pp. 1–5. [Google Scholar]
  2. Sadeghi, S.; Soltanmohammadlou, N.; Nasirzadeh, F. Applications of wireless sensor networks to improve occupational safety and health in underground mines. J. Saf. Res. 2022, 83, 8–25. [Google Scholar] [CrossRef] [PubMed]
  3. Luo, J.; Chen, Y.; Wu, M.; Yang, Y. A survey of routing protocols for underwater wireless sensor networks. IEEE Commun. Surv. Tutor. 2021, 23, 137–160. [Google Scholar] [CrossRef]
  4. Simon, G.; Maróti, M.; Lédeczi, A.; Balogh, G.; Kusy, B.; Nádas, A.; Pap, G.; Sallai, J.; Frampton, K. Sensor Network-Based Countersniper System. In Proceedings of the 2nd International Conference on Embedded Networked Sensor Systems, Baltimore, MD, USA, 3–5 November 2004; pp. 1–12. [Google Scholar] [CrossRef]
  5. Yick, J.; Mukherjee, B.; Ghosal, D. Analysis of a prediction-based mobility adaptive tracking algorithm. In Proceedings of the 2nd International Conference on Broadband Networks, Boston, MA, USA, 7 October 2005; Volume 1, pp. 753–760. [Google Scholar] [CrossRef]
  6. Castillo-Effer, M.; Quintela, D.; Moreno, W.; Jordan, R.; Westhoff, W. Wireless sensor networks for flash-flood alerting. In Proceedings of the Fifth IEEE International Caracas Conference on Devices, Circuits and Systems, Punta Cana, Dominican, 3–5 November 2004; Volume 1, pp. 142–146. [Google Scholar] [CrossRef]
  7. Rahman, M.; Rahman, S.; Mansoor, S.; Deep, V.; Aashkaar, M. Implementation of ICT and Wireless Sensor Networks for Earthquake Alert and Disaster Management in Earthquake Prone Areas. Procedia Comput. Sci. 2016, 85, 92–99. [Google Scholar] [CrossRef]
  8. Gao, T.; Greenspan, D.; Welsh, M.; Juang, R.; Alm, A. Vital Signs Monitoring and Patient Tracking Over a Wireless Network. In Proceedings of the 2005 IEEE Engineering in Medicine and Biology 27th Annual Conference, Shanghai, China, 17–18 January 2006; pp. 102–105. [Google Scholar] [CrossRef]
  9. Lorincz, K.; Malan, D.; Fulford-Jones, T.; Nawoj, A.; Clavel, A.; Shnayder, V.; Mainland, G.; Welsh, M.; Moulton, S. Sensor networks for emergency response: Challenges and opportunities. IEEE Pervasive Comput. 2004, 3, 16–23. [Google Scholar] [CrossRef]
  10. Saeed, U.; Jan, S.U.; Lee, Y.D.; Koo, I. Fault diagnosis based on extremely randomized trees in wireless sensor networks. Reliab. Eng. Syst. Saf. 2021, 205, 107284. [Google Scholar] [CrossRef]
  11. Du, J.; Chen, H.; Zhang, W. A deep learning method for data recovery in sensor networks using effective spatio-temporal correlation data. Sens. Rev. 2018, 39, 208–217. [Google Scholar] [CrossRef]
  12. El-Sayed, W.M.; El-Bakry, H.M.; El-Sayed, S.M. Integrated data reduction model in wireless sensor networks. Appl. Comput. Inform. 2020, 19, 41–63. [Google Scholar] [CrossRef]
  13. Fan, G.; Li, J.; Hao, H. Using deep learning technique for recovering the lost measurement data. In EASEC16; Springer: Berlin/Heidelberg, Germany, 2021; pp. 229–237. [Google Scholar]
  14. Song, X.; Guo, Y.; Li, N.; Yang, S. A novel approach based on matrix factorization for recovering missing time series sensor data. IEEE Sens. J. 2020, 20, 13491–13500. [Google Scholar] [CrossRef]
  15. Kortas, M.; Habachi, O.; Bouallegue, A.; Meghdadi, V.; Ezzedine, T.; Cances, J.P. Robust Data Recovery in Wireless Sensor Network: A Learning-Based Matrix Completion Framework. Sensors 2021, 21, 1016. [Google Scholar] [CrossRef] [PubMed]
  16. Zaid, Y.; Zhang, B.; Ismael, W.M.; Xie, Y.; Surname, G.N.; Wang, H. ST-MLR: A Spatio-temporal Multiple Linear Regression Missing Data Reconstruction Approach for Improving WSN Data Reliability. In Proceedings of the 2021 International Congress of Advanced Technology and Engineering (ICOTEN), Taiz, Yemen, 4–5 July 2021; pp. 1–6. [Google Scholar]
  17. Chen, Z.; Chen, L.; Hu, G.; Ye, W.; Zhang, J.; Yang, G. Data reconstruction in wireless sensor networks from incomplete and erroneous observations. IEEE Access 2018, 6, 45493–45503. [Google Scholar] [CrossRef]
  18. Jeong, S.; Ferguson, M.; Hou, R.; Lynch, J.P.; Sohn, H.; Law, K.H. Sensor data reconstruction using bidirectional recurrent neural network with application to bridge monitoring. Adv. Eng. Inform. 2019, 42, 100991. [Google Scholar] [CrossRef]
  19. Jana, D.; Nagarajaiah, S.; Yang, Y.; Li, S. Real-time cable tension estimation from acceleration measurements using wireless sensors with packet data losses: Analytics with compressive sensing and sparse component analysis. J. Civ. Struct. Health Monit. 2022, 12, 797–815. [Google Scholar] [CrossRef]
  20. Tay, D.B. Sensor network data denoising via recursive graph median filters. Signal Process. 2021, 189, 108302. [Google Scholar] [CrossRef]
  21. Jana, D.; Patil, J.; Herkal, S.; Nagarajaiah, S.; Duenas-Osorio, L. CNN and Convolutional Autoencoder (CAE) based real-time sensor fault detection, localization, and correction. Mech. Syst. Signal Process. 2022, 169, 108723. [Google Scholar] [CrossRef]
  22. International Telecommunication Union Specific Attenuation Model for Rain for Use in Prediction Methods. 2005. Available online: https://www.itu.int/rec/R-REC-P.838 (accessed on 22 August 2023).
  23. Regonesi, E.; Luini, L.; Riva, C. Limitations of the ITU-R P.838-3 model for rain specific attenuation. In Proceedings of the 2019 13th European Conference on Antennas and Propagation (EuCAP), Krakow, Poland, 31 March–5 April 2019; pp. 1–4. [Google Scholar]
  24. Fares, M.A.; Fares, S.C.; Ventrice, C.A. Attenuation of the electromagnetic waves due to moist and wet snow. In Proceedings of the Proceedings 2007 IEEE SoutheastCon, Richmond, VA, USA, 22–25 March 2007; pp. 99–104. [Google Scholar]
  25. International Telecommunication Union Recommendation ITU-R P.840-7. Attenuation Due to Clouds and Fog. P Series. Radiowave Propagation. 2017. Available online: https://www.itu.int/dms_pubrec/itu-r/rec/p/R-REC-P.840-7-201712-S!!PDF-E.pdf (accessed on 22 August 2023).
  26. Manabe, T.; Liebe, H.J.; Hufford, G.A. Complex permittivity of water between 0 and 30 thz. In Proceedings of the 1987 Twelth International Conference on Infrared and Millimeter Waves, Lake Buena Vista, FL, USA, 14–18 December 1987; pp. 229–230. [Google Scholar] [CrossRef]
  27. Kurt, S.; Tavli, B. Path Loss Modeling for Wireless Sensor Networks: Review of Models and Comparative Evaluations. IEEE Antennas Propag. Mag. 2016, 59, 18–37. [Google Scholar] [CrossRef]
  28. Laiou, A.; Malliou, C.; Lenas, S.A.; Tsaoussidis, V. Autonomous Fault Detection and Diagnosis in Wireless Sensor Networks using Decision Trees. J. Commun. 2019, 14, 544–552. [Google Scholar] [CrossRef]
  29. Zhan, Z.; Villemaud, G.; Gorce, J.M. Analysis and reduction of the impact of thermal noise on the Full-Duplex OFDM radio. In Proceedings of the 2014 IEEE Radio and Wireless Symposium (RWS), Newport Beach, CA, USA, 19–23 January 2014; pp. 220–222. [Google Scholar]
  30. Goodfellow, I.; Bengio, Y.; Courville, A. Deep Learning; MIT Press: Cambride, MA, USA, 2016. [Google Scholar]
  31. Mao, X.J.; Shen, C.; Yang, Y.B. Image restoration using convolutional auto-encoders with symmetric skip connections. arXiv 2016, arXiv:1606.08921. [Google Scholar]
  32. Masci, J.; Meier, U.; Cireşan, D.; Schmidhuber, J. Stacked convolutional auto-encoders for hierarchical feature extraction. In Artificial Neural Networks and Machine Learning—ICANN 2011: 21st International Conference on Artificial Neural Networks, Espoo, Finland, June 14–17, 2011, Proceedings, Part I 21; Springer: Berlin/Heidelberg, Germany, 2011; pp. 52–59. [Google Scholar]
  33. Heinzelman, W.; Chandrakasan, A.; Balakrishnan, H. An application-specific protocol architecture for wireless microsensor networks. IEEE Trans. Wirel. Commun. 2002, 1, 660–670. [Google Scholar] [CrossRef]
  34. Li, Y.Z.; Zhang, A.L.; Liang, Y.Z. Improvement of Leach Protocol for Wireless Sensor Networks. In Proceedings of the 2013 Third International Conference on Instrumentation, Measurement, Computer, Communication and Control, Shenyang, China, 21–23 September 2013; pp. 322–326. [Google Scholar] [CrossRef]
  35. Hou, M.; Chaib-draa, B. Online incremental higher-order partial least squares regression for fast reconstruction of motion trajectories from tensor streams. In Proceedings of the 2016 IEEE International Conference on Acoustics, Speech and Signal Processing (ICASSP), Shanghai, China, 20–25 March 2016; pp. 6205–6209. [Google Scholar] [CrossRef]
Figure 1. Low-energy adaptive clustering hierarchy (LEACH)–based WSN system being affected by the environment and external and internal events.
Applsci 13 10090 g001
Figure 2. Received signal at sensor nodes affected by noise.
Applsci 13 10090 g002
Figure 3. Overview of the proposed architecture.
Applsci 13 10090 g003
Figure 4. Formatting input data for the CAE architecture in a WSN.
Applsci 13 10090 g004
Figure 5. Architecture of the CAE.
Applsci 13 10090 g005
Figure 6. Architecture of the SCAE.
Applsci 13 10090 g006
Figure 7. LEACH-protocol-based WSN system.
Applsci 13 10090 g007
Figure 8. Training error comparison with different noise variance using the PM 2.5 dataset.
Applsci 13 10090 g008
Figure 9. Testing error comparison with different noise variance using the PM 2.5 dataset.
Applsci 13 10090 g009
Table 1. Related work.
PaperYearTypeDatasetPurposeMethod
[14]2020External eventsReal dataReconstructing missing dataAlgorithm
[12]2020External eventsReal data and noiseReconstructing missing dataAlgorithm
[15]2021External eventsSimulated dataReconstructing missing dataAlgorithm
[16]2021External eventsReal dataReconstructing missing dataMachine learning
[13]2021External eventsReal data and noiseReconstructing lost dataDeep learning
[17]2018Internal eventsReal dataReconstructing dataAlgorithm
[18]2021Internal eventsReal dataReconstructing dataBidirectional recurrent
neural network
[19]2022Internal eventsReal dataReconstructing dataAlgorithm
[20]2021Internal eventsReal data and noiseDenoising dataAlgorithm
[21]2022Internal eventsReal data and noiseReconstructing dataConvolutional neural network
Table 2. Environmental parameters.
ParameterValue
Elevation angle θ 0
Tilt angle τ 0
Signal carrier frequency f 1.9 GHz
Rain rate R rain (rainfall)10 mm/h
Liquid water content R s (wet snow) 2.5 mm/h
Liquid water density (fog) ξ 0.5 g/m3
Cloud liquid water temperature T (fog) 288.15 K
Table 3. Simulation parameters for the LEACH-based WSN system.
ParameterValue
Number of nodes20
Number of clusters2
Amount of data for each node67,680
Sample time1 h
Size of packet header 25 bytes
Size of data packet 50 bytes
Routing protocolLEACH
Table 4. Comparison of results when using the SCAE model with different numbers of dense layers.
Number of Dense Layers01357
Training Error (%) 2.12 1.92 1.52 1.06 1.42
Testing Error (%) 2.23 2.21 1.65 1.09 1.62
Table 5. Performance comparisons among existing reconstruction algorithms using the PM 2.5 dataset.
AlgorithmTraining Errors %Testing Errors %
Partial Least Squares Regression 3.37 3.42
Bidirectional RNN 2.57 2.69
CAE 1.53 1.55
SCAE1.061.09
Table 6. Surveying the SCAE with the different levels of weather conditions using the PM 2.5 dataset.
Weather ConditionLevel of Weather ConditionsTraining Error (%)Testing Error (%)
Rain ( R r a i n )Light (1 mm/h) 0.13 0.21
Moderate ( 2.5 mm/h) 0.47 0.49
Heavy (10 mm/h) 0.52 0.57
Wet snow ( R s )Light (1 mm/h) 0.12 0.23
Moderate ( 1.5 mm/h) 0.41 0.43
Heavy ( 2.5 mm/h) 0.46 0.52
Fog ( ξ )Light ( 0.01 g/m3) 0.08 0.12
Medium ( 0.05 g/m3) 0.19 0.24
Thick ( 0.5 g/m3) 0.32 0.38
Table 7. Comparison between the SCAE and CAE with different datasets.
DatasetAlgorithmTrainingTesting
Error (%)Error (%)
TemperatureCAE 0.57 0.69
SCAE0.360.44
AQICAE 1.25 1.43
SCAE0.891.03
O 3 CAE 1.72 1.71
SCAE1.231.241
PM 10CAE 3.12 3.34
SCAE2.823.01
Disclaimer/Publisher’s Note: The statements, opinions and data contained in all publications are solely those of the individual author(s) and contributor(s) and not of MDPI and/or the editor(s). MDPI and/or the editor(s) disclaim responsibility for any injury to people or property resulting from any ideas, methods, instructions or products referred to in the content.

