
A Comprehensive Evaluation and Analysis of Ground Surface Damage Due to Mining under Villages Based on GIS


Abstract
:1. Introduction
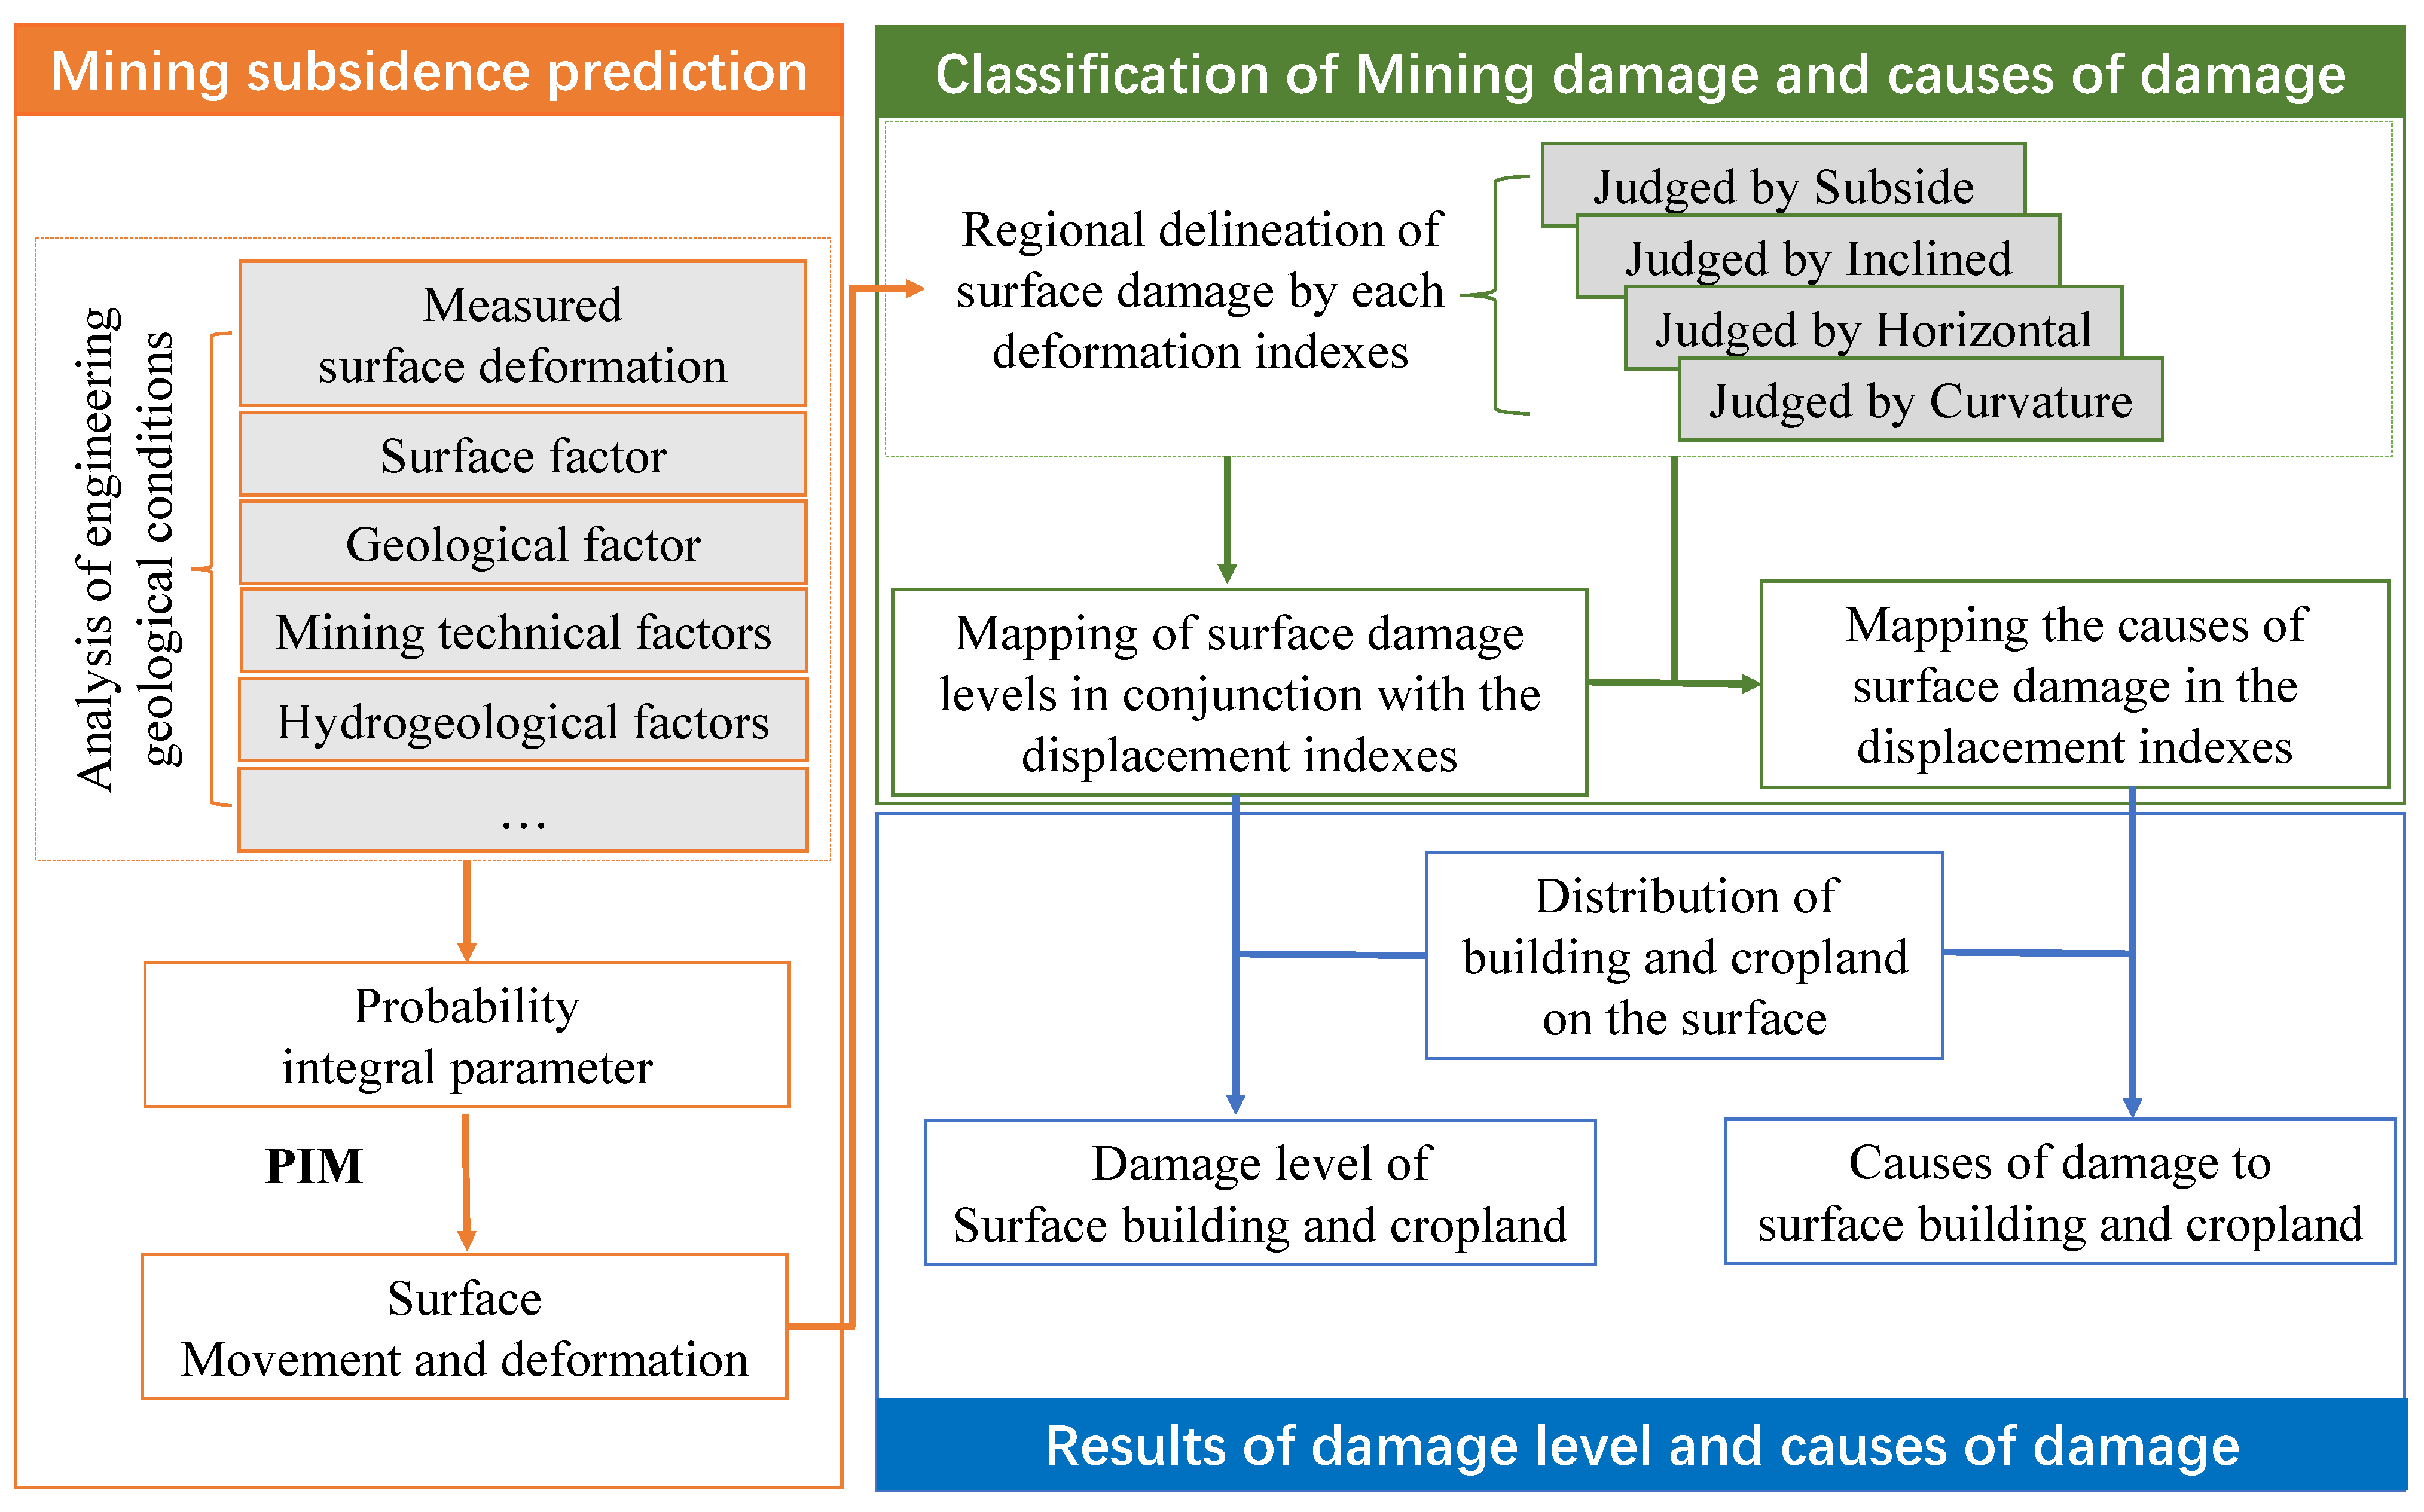
2. Comprehensive Ground Surface Damage Forecast Method
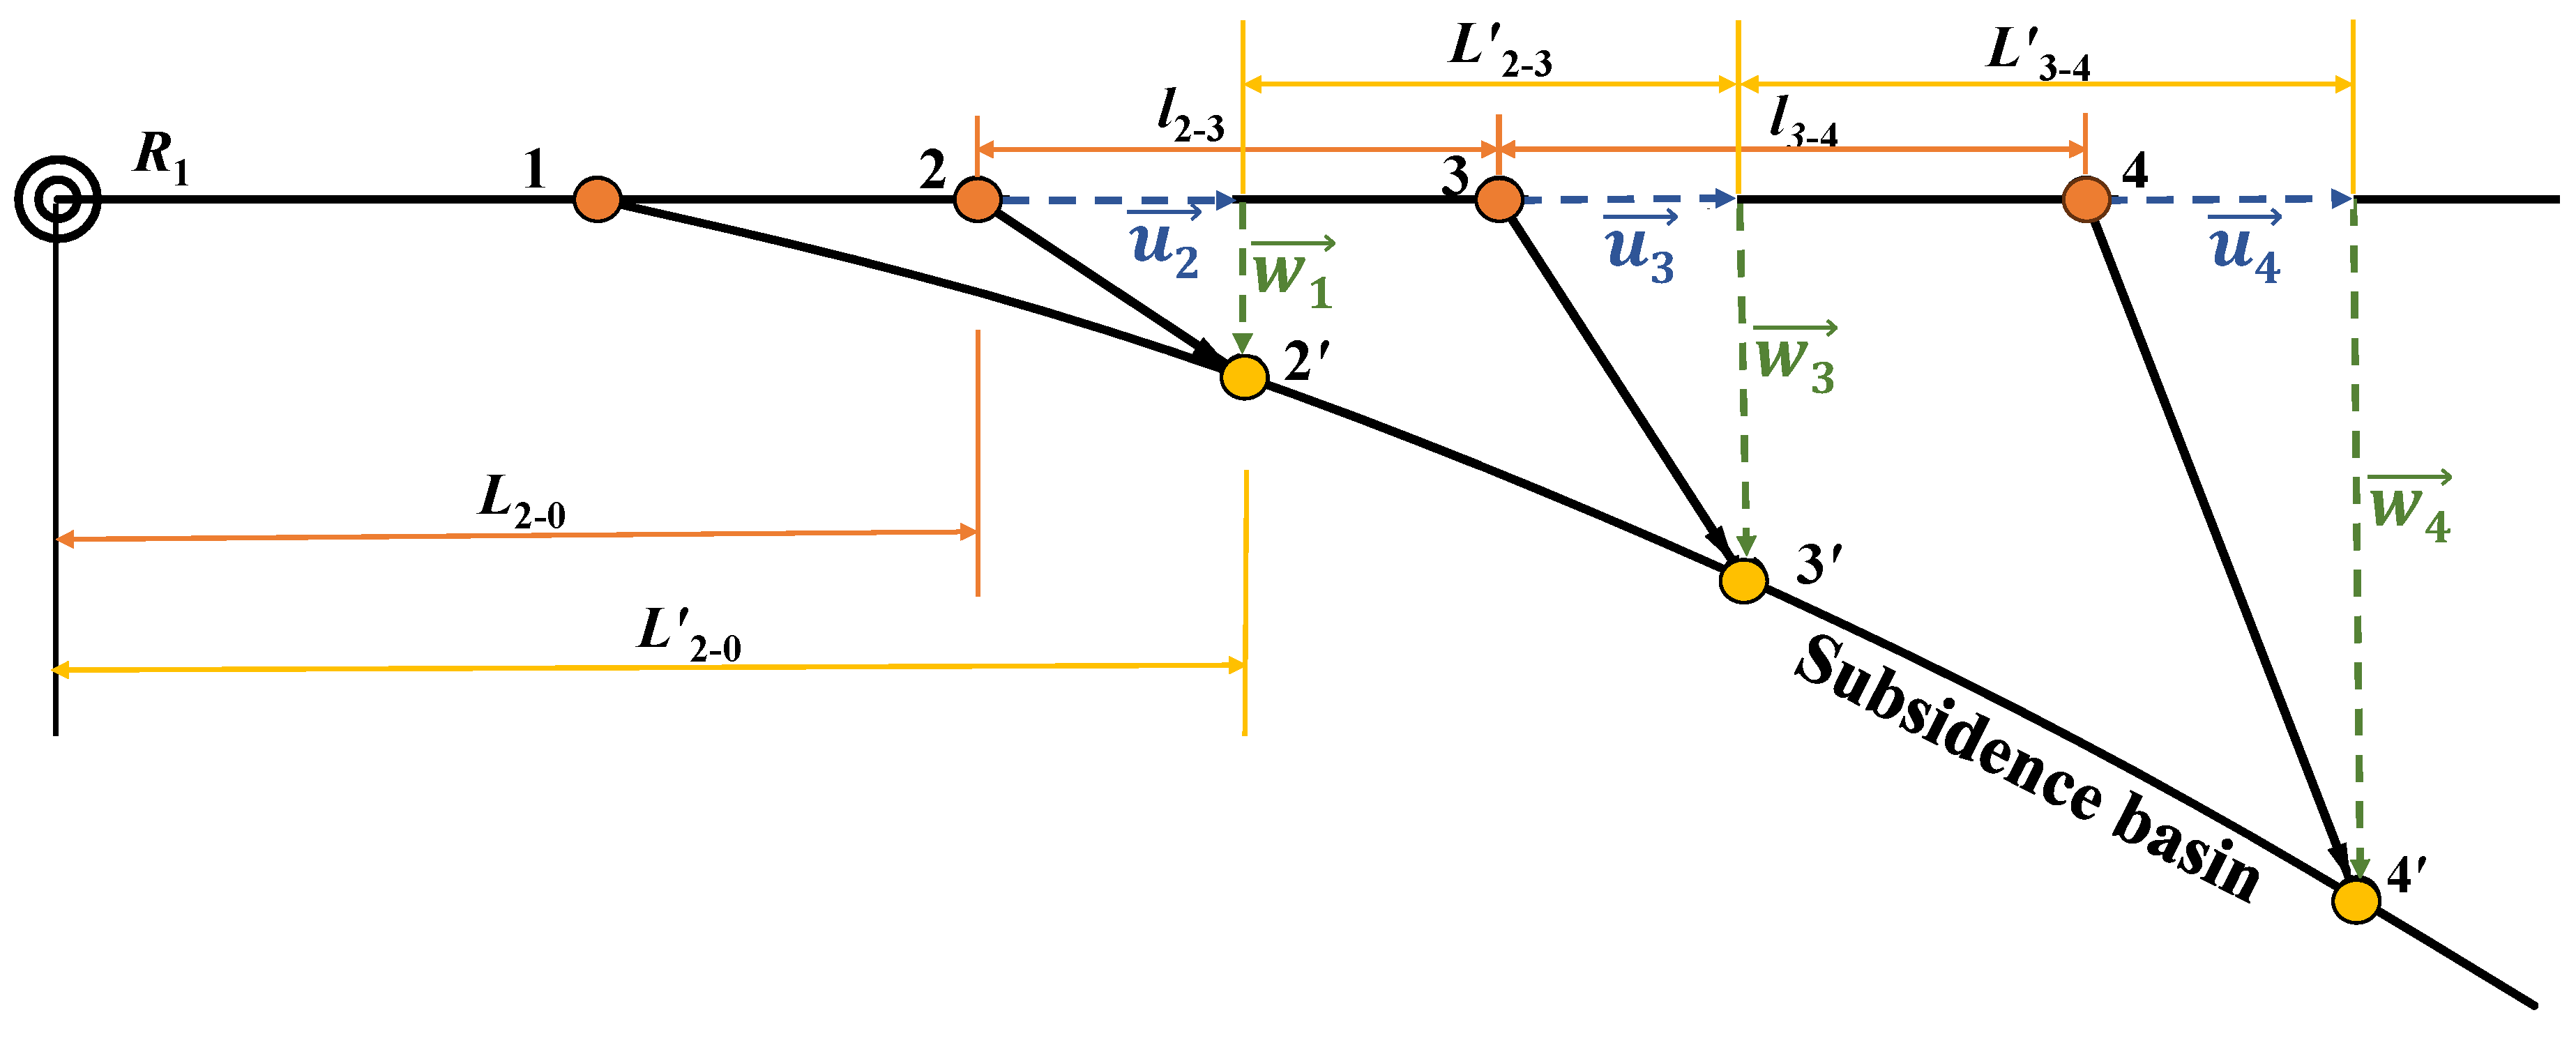
2.1. Displacement and Deformation Forecast
2.2. Forecast and Assessment Indexes
2.2.1. Coal-Mining-Induced Building Damage Assessment Indexes
2.2.2. Coal-Mining-Induced Cropland Damage Assessment Indexes
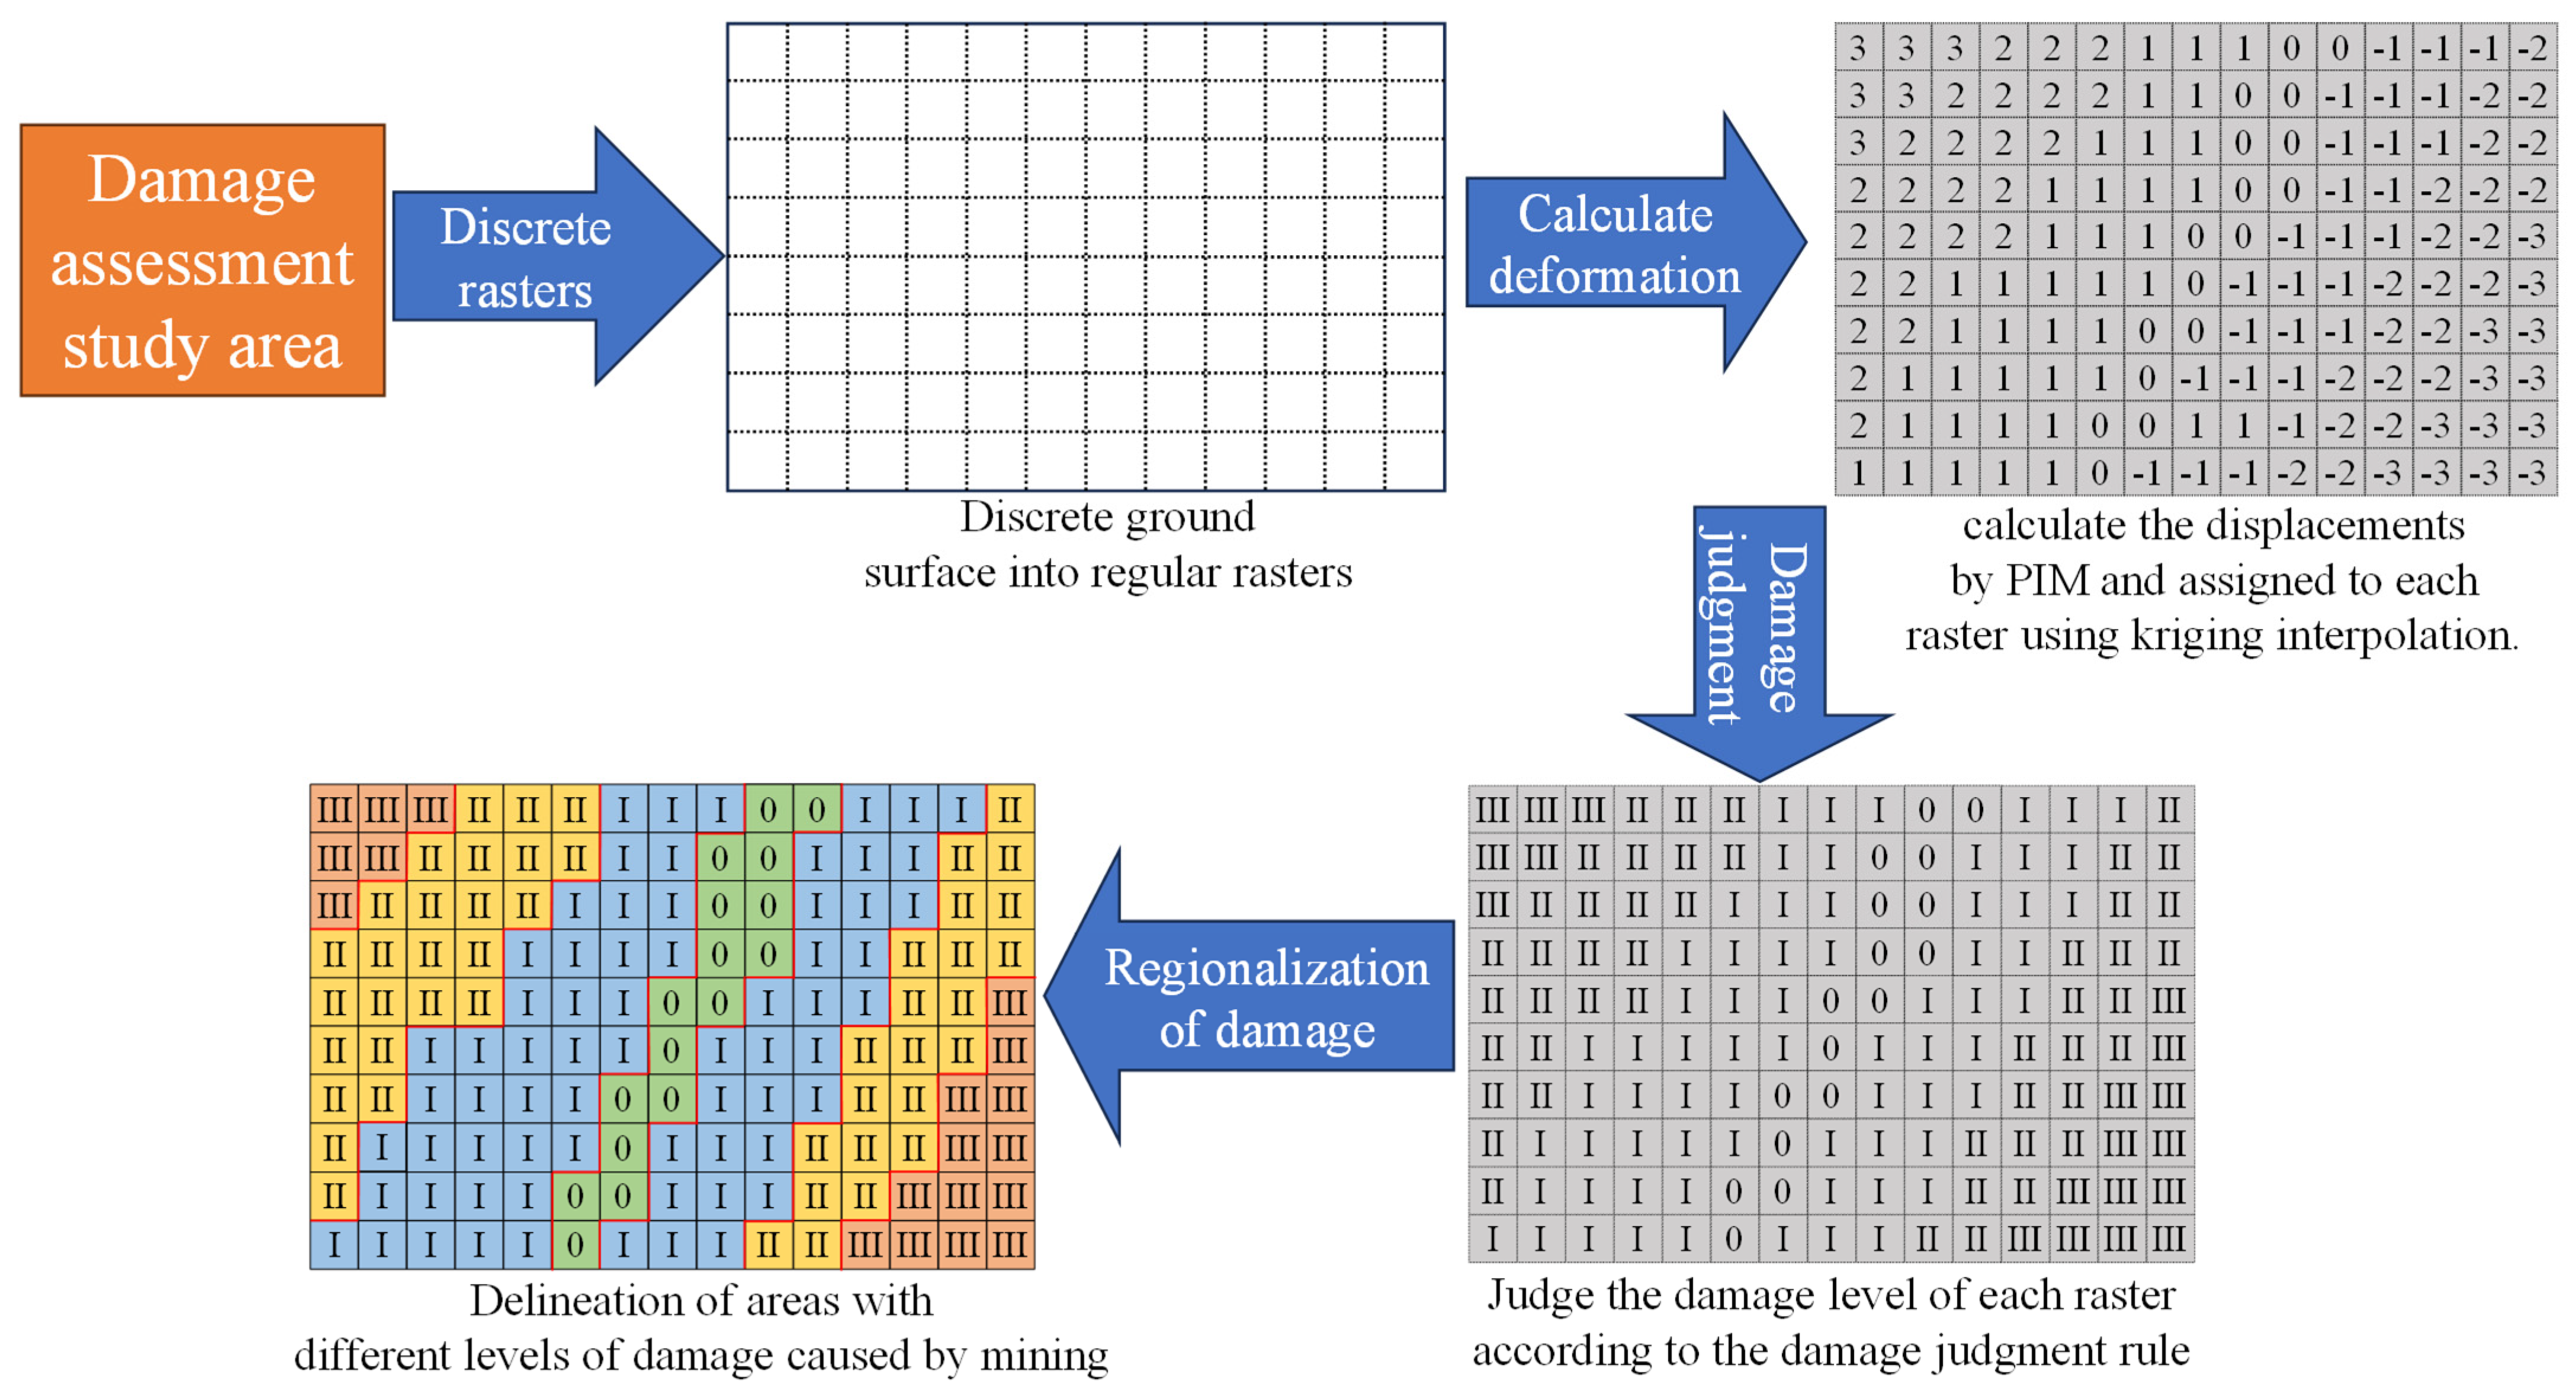
2.3. Comprehensive Damage Area Division
3. Analysis of Influencing Factors of Ground Surface Damages
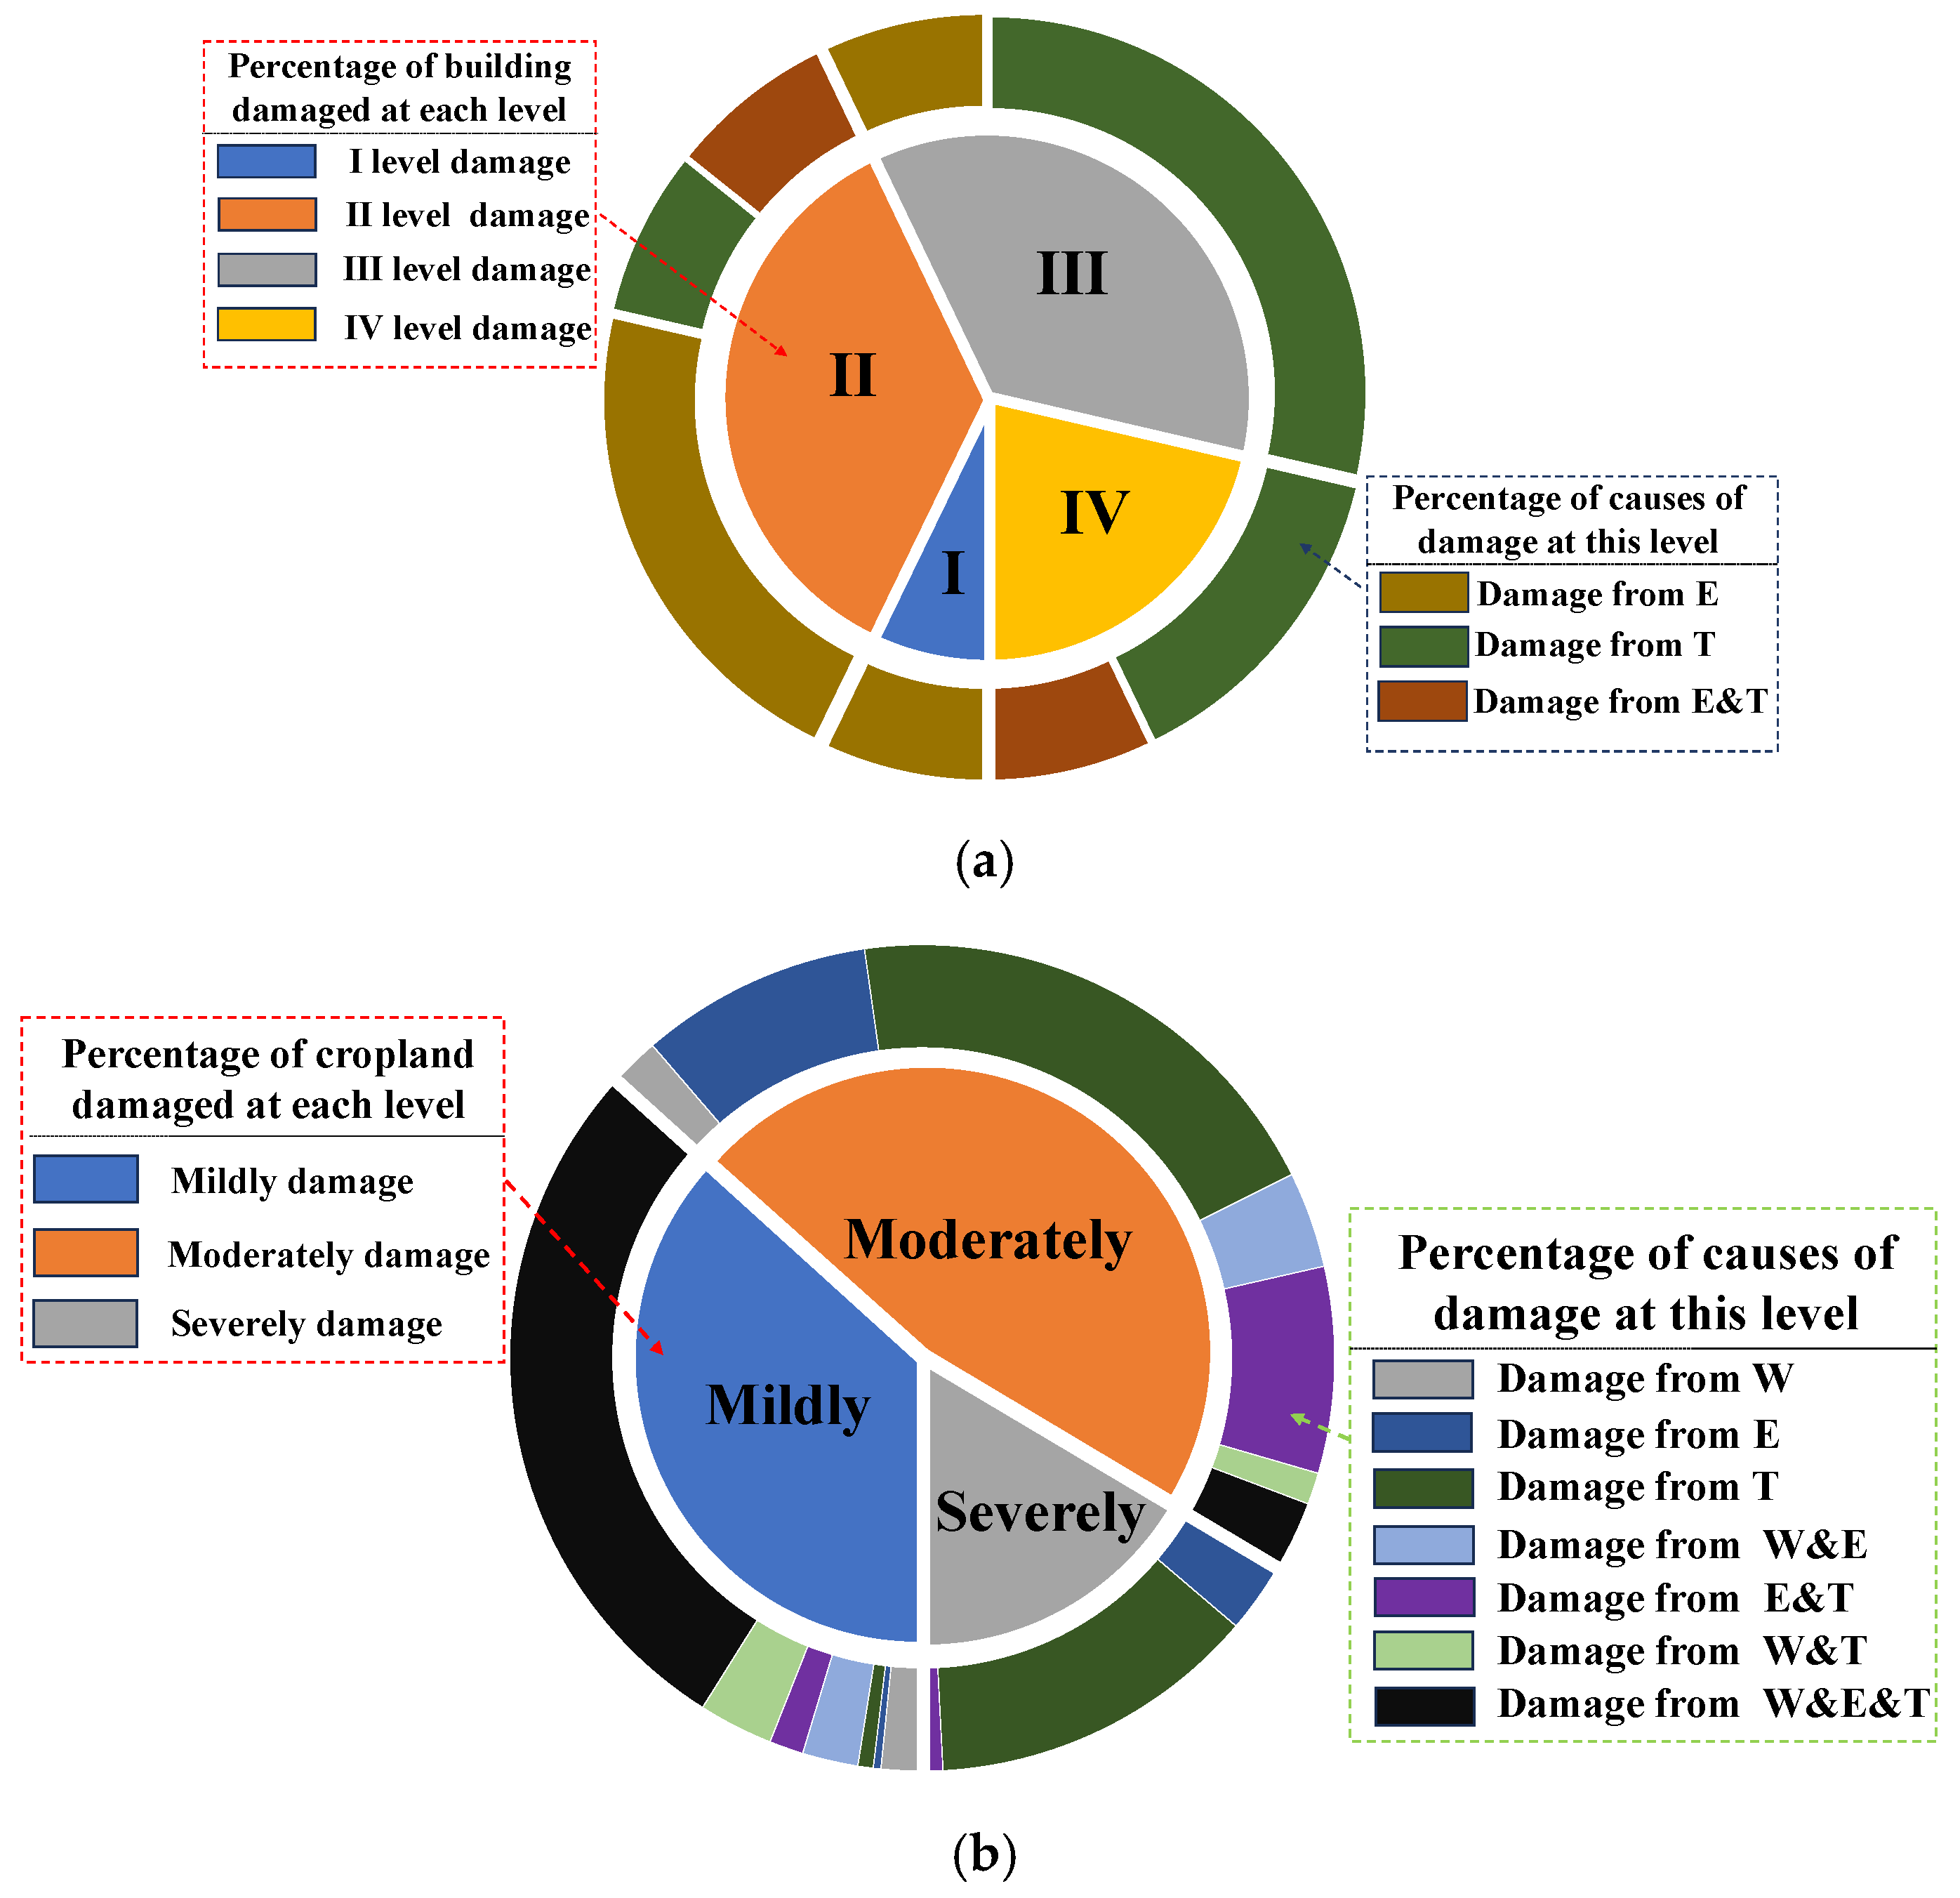
3.1. Damage Cause Distribution
3.2. Quantitative Analysis of Damage Causes of Each Damage Level
- (1)
- The map of the damage ranges caused by multiple deformation indexes integrated on the ground surface was imported, and all rasters with their damage level at in the targeted area were extracted. It was assumed that there were rasters in total, and those rasters were numbered .
- (2)
- If the damage level assessment factors of raster were displacement indexes and , and the corresponding damage assessment results of raster were , and , respectively, the comprehensive level of raster was , according to the ground surface damage assessment rules. If the single assessment grade of deformation index to raster was , the deformation index had no influence upon the damage level of raster . If , the contribution of to the comprehensive damage assessment result was 1. Parameters , and were adopted to characterize whether displacement indexes and contributed to the comprehensive damage level of raster , and then could be calculated using Equation (8):
- (3)
- Therefore, the number of displacement indexes contributing to the deterioration of the raster up to the damage level at were exactly . It was assumed that when the damage level was , the corresponding building or cropland damage degree was (this is a relative value that quantifies the relative damage consequences of each damage level upon buildings and croplands on the ground surface), and the deformation index contributed to the raster ’s final damage level, namely = 1; then, the increment calculation method for coal-mining-induced damage due to factor is shown in Equation (9).
- (4)
- Among those extracted rasters of a damage level at , the coal-mining-induced damage increment due to factor is shown in Equation (10):
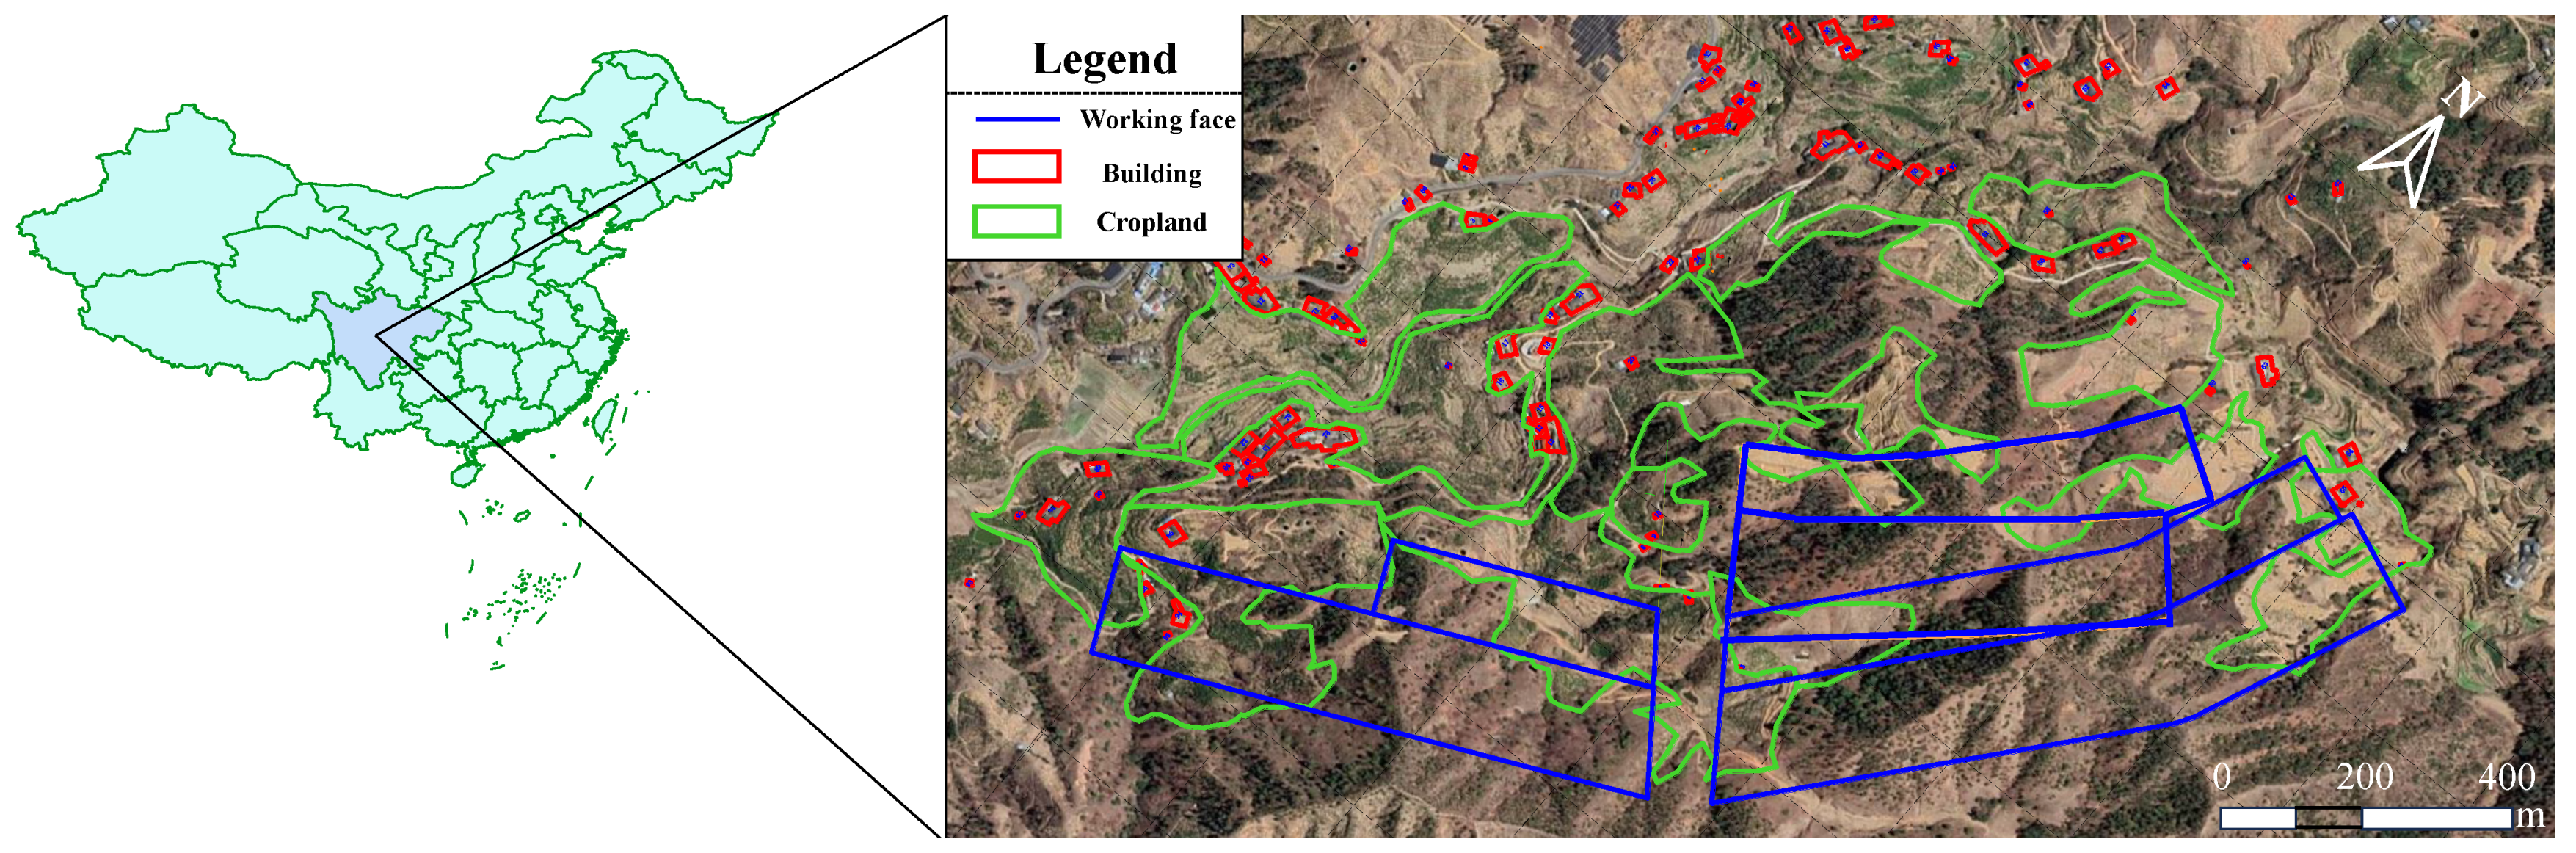
4. Case Analysis
4.1. Overview of the Targeted Area
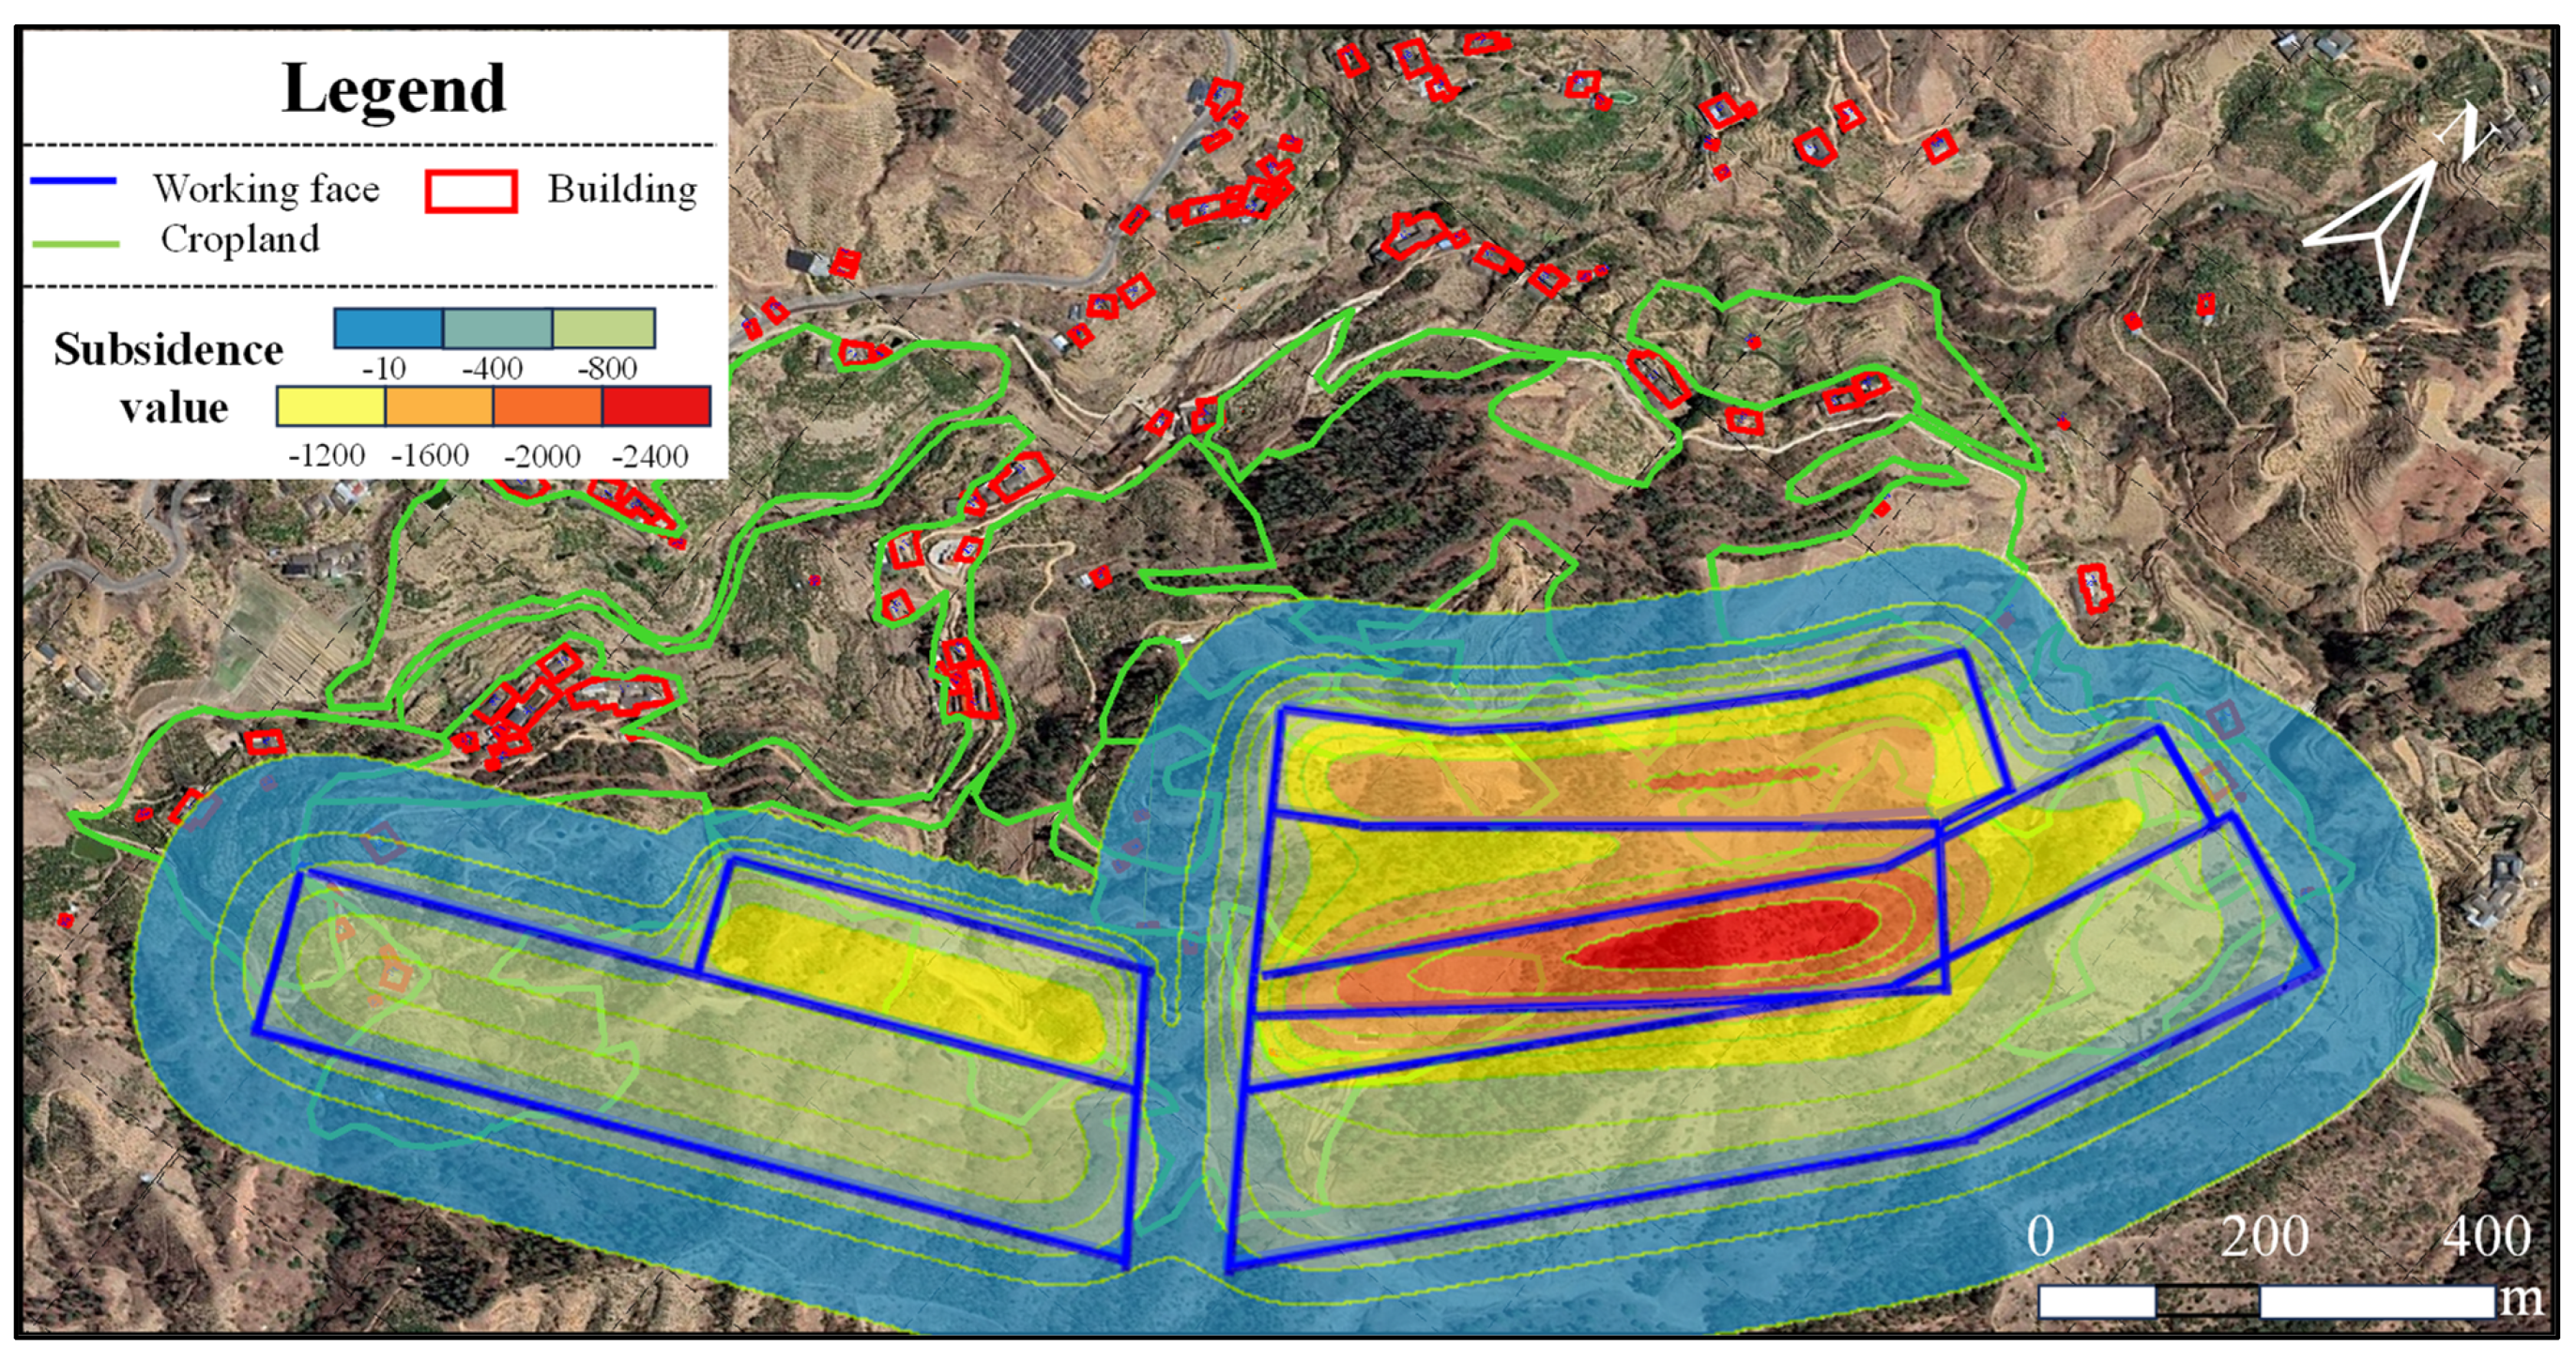
4.2. Forecast of Displacement and Deformation of Ground Surface
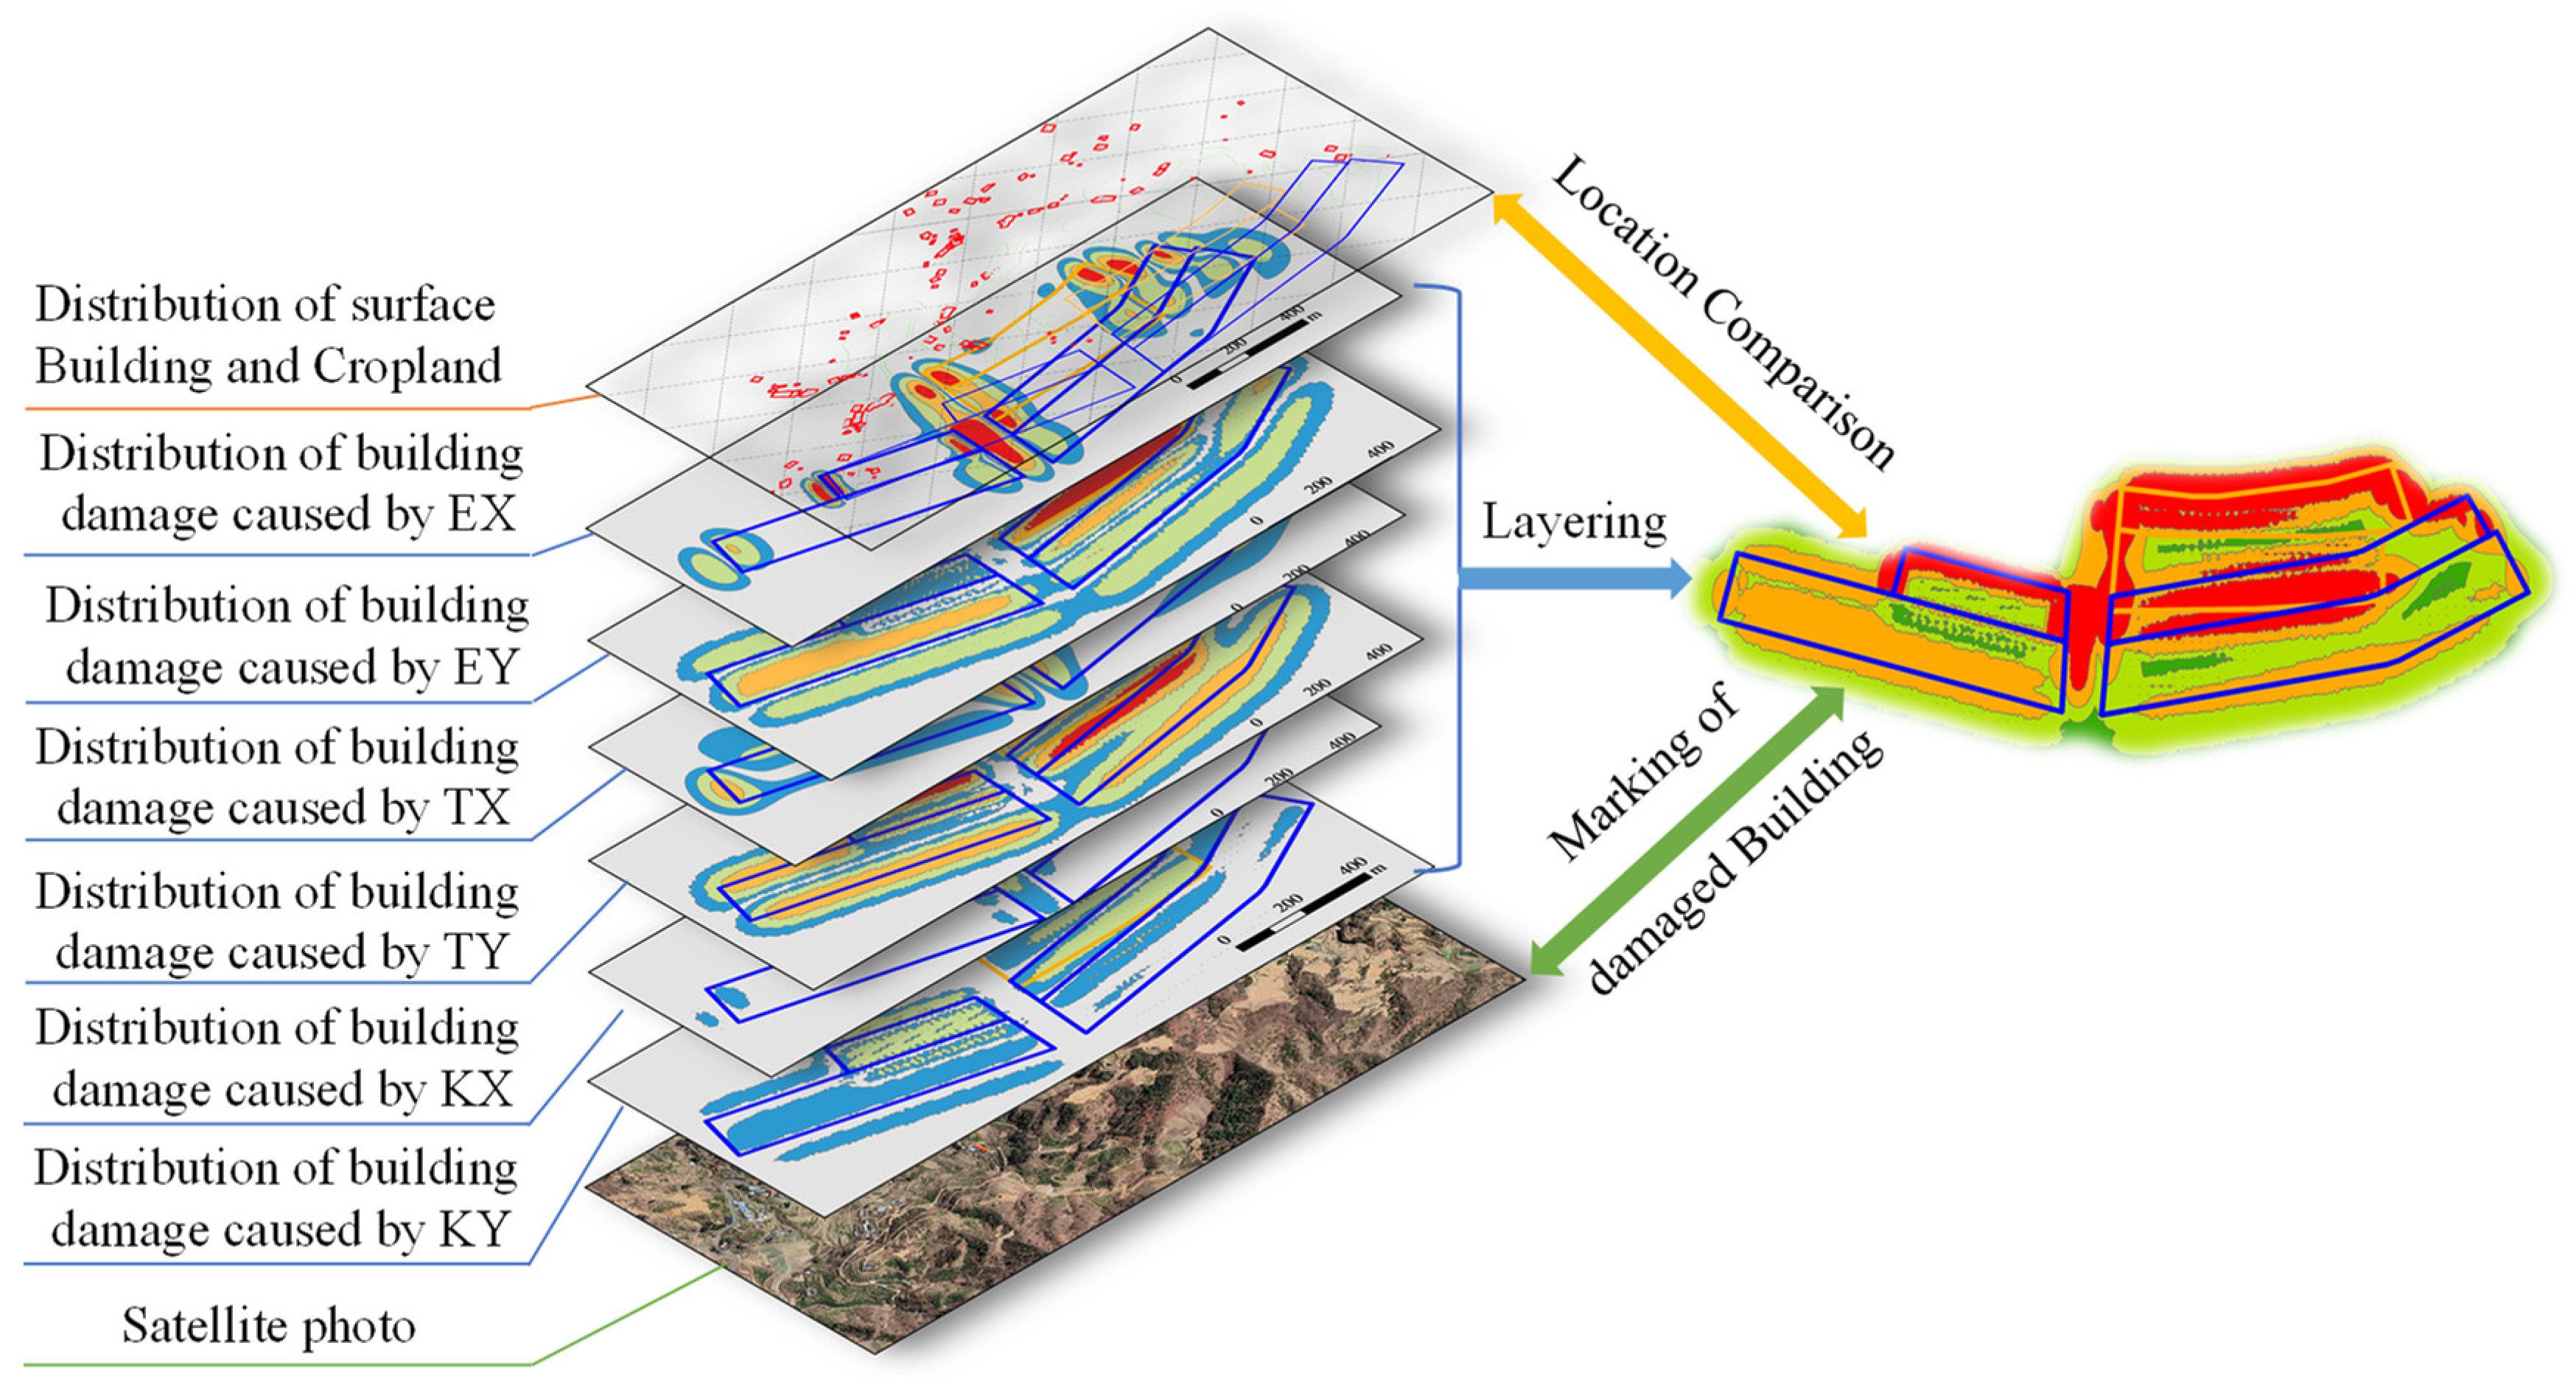
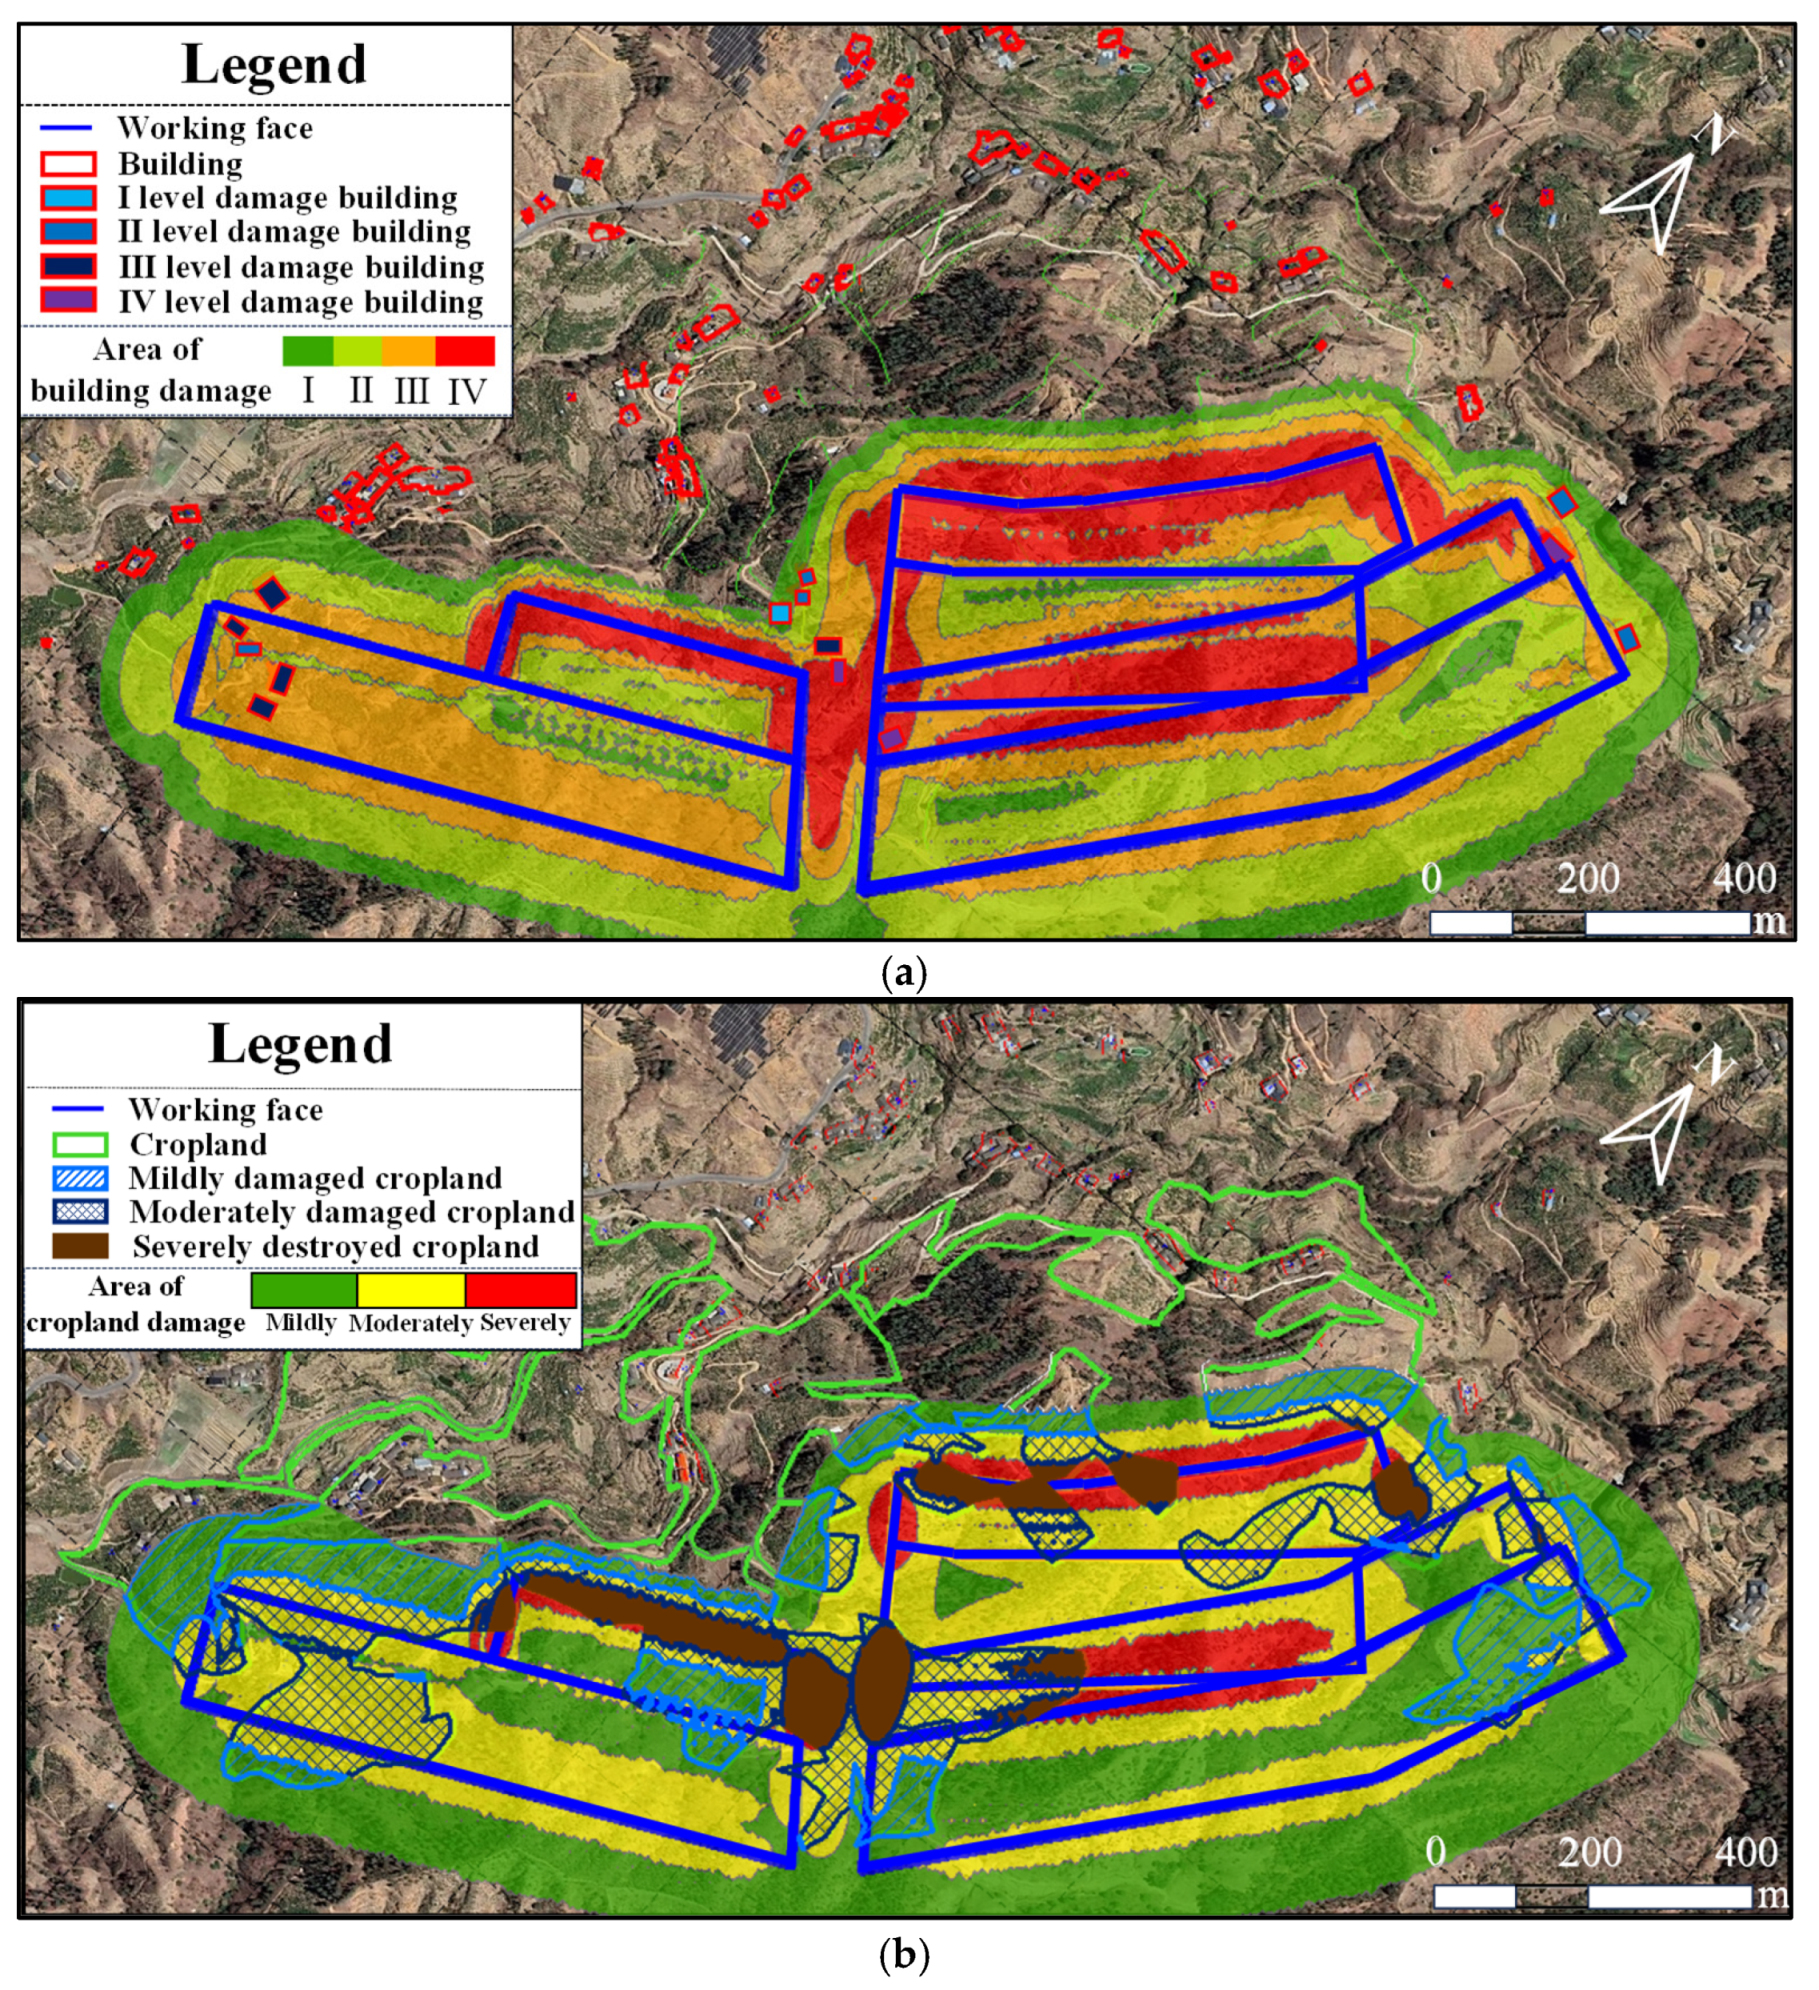
4.3. Regional Distribution Results of Comprehensive Damages
4.4. Distribution Results of Damages Due to Displacement Indexes
4.5. Quantitative Analysis of Influences of Displacement Indexes on Damages of Each Level
5. Mitigation Countermeasures against Building and Cropland Damages in Coal Mining Subsidence Areas
5.1. Mitigation Countermeasures against Surface Building Damage
5.2. Measures for Cropland Reclamation
5.3. Mining-Techniques-Based Damage Mitigation Measures
6. Conclusions
- (1)
- The displacement and deformation of the ground surface due to coal mining were analyzed by virtue of GIS, and the damage range on the ground surface was divided by multiple displacement indexes so as to quickly determine and extract the building and cropland damage level and quantity.
- (2)
- The damage causes were discussed in terms of damage range. The damaged area caused by each deformation index was further divided using the Raster Calculator and the law of the influence of deformation index upon each damage level was quantitatively analyzed by virtue of the contribution rate. The contribution-rate-based damage cause analysis method can effectively reflect the distribution of both building and cropland damage causes.
- (3)
- A given mine in China was taken for case verification. According to the forecast, 14 buildings suffered from coal-mining-induced damages and 32.67 hm2 of the cropland area was damaged or destroyed in total. A causal analysis of both the building and cropland damages showed that building damage was triggered by inclined T and that seven buildings were destroyed; among them, five buildings were damaged by horizontal deformation E, and two buildings were damaged jointly by E and T. Concerning cropland damage, most of the damaged or destroyed area was caused by inclined T, accounting for 33.48%. As damage level was aggravated, the proportion of building damage caused by E decreased, while the proportion of building damage caused by T increased, and the proportion of damaged cropland area caused by inclined T increased.
Author Contributions
Funding
Institutional Review Board Statement
Informed Consent Statement
Data Availability Statement
Conflicts of Interest
References
- Huang, J.; Tian, C.; Xing, L.; Bian, Z.; Miao, X. Green and Sustainable Mining: Underground Coal Mine Fully Mechanized Solid Dense Stowing-Mining Method. Sustainability 2017, 9, 1418. [Google Scholar] [CrossRef]
- Cao, W.; Wang, X.; Li, P.; Zhang, D.; Sun, C.; Qin, D. Wide Strip Backfill Mining for Surface Subsidence Control and Its Application in Critical Mining Conditions of a Coal Mine. Sustainability 2018, 10, 700. [Google Scholar] [CrossRef]
- Wang, J.A.; Shang, X.C.; Ma, H.T. Investigation of catastrophic ground collapse in Xingtai gypsum mines in China. Int. J. Rock Mech. Min. Sci. 2008, 45, 1480–1499. [Google Scholar] [CrossRef]
- Solarski, M.; Machowski, R.; Rzetala, M.; Rzetala, M.A. Hypsometric changes in urban areas resulting from multiple years of mining activity. Sci. Rep. 2022, 12, 2982. [Google Scholar] [CrossRef] [PubMed]
- Machowski, R. Changes in the Landform and Water Conditions of the Industri-Alized Urban Area as a Result of Mining Activities. Land 2022, 11, 1710. [Google Scholar] [CrossRef]
- Wang, W.; Wu, K.; Chen, R.; Wang, R.; Diao, X. Comprehensive evaluation of building damage in mining areas based on GIS and random forest. Coal Sci. Technol. 2022, 50, 201–207. [Google Scholar] [CrossRef]
- Saeidi, A.; Deck, O.; Seifaddini, M.; Heib, M.A.; Verdel, T. An improved methodology for applying the influence function for subsidence hazard prediction. Georisk Assess. Manag. Risk Eng. Syst. Geohazards 2022, 16, 347–359. [Google Scholar] [CrossRef]
- Chi, S.; Wang, L.; Yu, X. A New Method for Calculating Prediction Parameters of Surface Deformation in the Mining Area. Appl. Sci. 2023, 13, 8030. [Google Scholar] [CrossRef]
- Xuan, D.; Xu, J. Grout injection into bed separation to control surface subsidence during longwall mining under villages: Case study of Liudian coal mine, China. Nat. Hazards 2014, 73, 883–906. [Google Scholar] [CrossRef]
- Yang, X.; Lei, S.; Shi, Y.; Wang, W. Effects of Ground Subsidence on Vegetation Chlorophyll Content in Semi-Arid Mining Area: From Leaf Scale to Canopy Scale. Int. J. Environ. Res. Public Health 2023, 20, 10493. [Google Scholar] [CrossRef]
- Bell, F.G.; Stacey, T.R.; Genske, D.D. Mining subsidence and its effect on the environment: Some differing examples. Environ. Geol. 2000, 40, 135–152. [Google Scholar] [CrossRef]
- Zhao, B.; Guo, Y.; Wang, W.; He, S. Impact of Underground Coal Seam Mining on Stability and Slippage of the Loess Slope. Sustainability 2023, 15, 6485. [Google Scholar] [CrossRef]
- Liu, X.; Guo, G.; Li, H. Study on Damage of Shallow Foundation Building caused by Surface Curvature Deformation in Coal Mining Area. KSCE J. Civ. Eng. 2019, 23, 4601–4610. [Google Scholar] [CrossRef]
- Trzałkowski, P. Some Remarks on Impact of Mining Based on an Example of Building Deformation and Damage Caused by Mining in Conditions of Upper Silesian Coal Basin. Pure Appl. Geophys. 2019, 176, 2595–2605. [Google Scholar] [CrossRef]
- Gayarre, F.L.; Álvarez-Fernández, M.I.; González-Nicieza, C.; Álvarez-Vigil, A.E.; García, G.H. Forensic analysis of buildings affected by mining subsidence. Eng. Fail. Anal. 2010, 17, 270–285. [Google Scholar] [CrossRef]
- Can, E.; Kuşcu, Ş.; Kartal, M.E. Effects of mining subsidence on masonry buildings in Zonguldak hard coal region in Turkey. Environ. Earth Sci. 2012, 66, 2503–2518. [Google Scholar] [CrossRef]
- Cui, X.M.; Zhang, B.; Peng, C. Current status and progress on the estimation of mining induced building damage. J. China Coal Soc. 2015, 40, 1718–1728. [Google Scholar] [CrossRef]
- Kwinta, A.; Gradka, R. Analysis of the damage influence range generated by underground mining. Int. J. Rock Mech. Min. Sci. 2020, 128, 104263. [Google Scholar] [CrossRef]
- Chen, Y.; Hu, Z.; Li, P.; Li, G.; Yuan, D.; Guo, J. Assessment and Effect of Mining Subsidence on Farmland in Coal–Crop Overlapped Areas: A Case of Shandong Province, China. Agriculture 2022, 12, 1235. [Google Scholar] [CrossRef]
- Zhang, Y.; Hu, Z.; Han, J.; Liu, X.; Feng, Z.; Zhang, X. Spatiotemporal Relationship between Ecological Restoration Space and Ecosystem Services in the Yellow River Basin, China. Land 2023, 12, 730. [Google Scholar] [CrossRef]
- Zhao, X.; Li, J.; Liu, Z.; Li, W.; Zhang, P.; Zhou, S. Evaluation of Damaged Farmland Extent in Overlapped Areas of Farmland and Coal Resources with High Phreatic Water Level. Environ. Sci. Technol. 2014, 37, 177–181+192. [Google Scholar]
- Jin, H.; Bai, Z.; Zhou, W.; Wang, J.; Li, S. Case Study on rehabilitation FEE of Destroyed Farmland in Coal Mines in Loess Hilly Terrain. Resour. Ind. 2013, 15, 111–117. [Google Scholar] [CrossRef]
- Esaki, T.; Djamaluddin, I.; Mitani, Y. A GIS-based prediction method to evaluate subsidence-induced damage from coal mining beneath a reservoir, Kyushu, Japan. Q. J. Eng. Geol. Hydrogeol. 2008, 41, 381–392. [Google Scholar] [CrossRef]
- Kim, K.D.; Lee, S.; Oh, H.J.; Choi, J.K.; Won, J.S. Assessment of ground subsidence hazard near an abandoned underground coal mine using GIS. Environ. Geol. 2006, 50, 1183–1191. [Google Scholar] [CrossRef]
- Feng, Q.; Liu, G.; Lei, M.; Fu, E.; Zhang, H.; Zhang, K. Land subsidence induced by groundwater extraction and building damage level assessment—A case study of Datun, China. J. China Univ. Min. Technol. 2008, 18, 556–560. [Google Scholar] [CrossRef]
- Nadudvari, A. Using radar interferometry and SBAS technique to detect surface subsidence relating to coal mining in Upper Silesia from 1993–2000 and 2003–2010. Environ. Socio-Econ. Stud. 2016, 4, 24–34. [Google Scholar] [CrossRef]
- Yuan, Y.; Li, S.; Zhang, Q.; Li, L.; Shi, S.; Zhou, Z. Risk assessment of water inrush in karst tunnels based on a modified grey evaluation model: Sample as Shangjiawan Tunnel. Geomech. Eng. 2016, 11, 493–513. [Google Scholar] [CrossRef]
- Akcin, H. A GIS-based building risk assessment for the subsidence due to undercity coal mining activities in Zonguldak, Turkey. Arab. J. Geosci. 2021, 14, 376. [Google Scholar] [CrossRef]
- Zhang, X.Q. Damage Assessment Visualization Research on the Ground Buildings of Village by Coal Mining. Master’s Thesis, Taiyuan University of Technology, Taiyuan, China, 2015. Available online: https://kns.cnki.net/KCMS/detail/detail.aspx?dbname=CMFD201502&filename=1015603809.nh (accessed on 20 August 2023).
- Huang, H. Analysis of Mining Subsidence of Loess and Damage Evaluation. Master’s Thesis, Xi’an University of Science and Technology, Xi’an, China, 2017. Available online: https://kns.cnki.net/KCMS/detail/detail.aspx?dbname=CMFD201801&filename=1017725608.nh (accessed on 19 August 2023).
- Tan, X.; Song, B.; Bo, H.; Li, Y.; Wang, M.; Lu, G. Extraction of Irregularly Shaped Coal Mining Area Induced Ground Subsidence Prediction Based on Probability Integral method. Appl. Sci. 2020, 10, 6623. [Google Scholar] [CrossRef]
- Malinowska, A.; Hejmanowski, R.; Dai, H. Ground movements modeling applying adjusted influence function. Int. J. Min. Sci. Technol. 2020, 30, 243–249. [Google Scholar] [CrossRef]
- National Coal Bureau of the People’s Republic of China. Regulation of Mining and Pillar Leaving under Building, Water-Body, Railway and Main Underground Engineer; Coal Industry Press: Beijing, China, 2000; pp. 81–90. (In Chinese)
- Zhao, B. The System of Prediction Evaluation on Mining Damage. Master’s Thesis, Xi’an University of Science and Technology, Xi’an, China, 2005. [Google Scholar]
- Li, P.; Tan, Z.; Yan, L. A Shaft Pillar Mining Subsidence Calculation Using Both Probability Integral Method and Numerical Simulation. CMES-Comput. Model. Eng. Sci. 2018, 117, 231–249. [Google Scholar] [CrossRef]
- Zhao, K.; Xu, N.; Mei, G.; Tian, H. Predicting the distribution of ground fissures and water-conducted fissures induced by coal mining: A case study. SpringerPlus 2016, 5, 977. [Google Scholar] [CrossRef] [PubMed]
- Zhang, P. Research on GIS Visualization Evaluation System of Main Environmental Resources Damage in Subsidence Area. Master’s Thesis, Qingdao University of Technology, Qingdao, China, 2009. [Google Scholar]
- Liao, M.G. Research on Damage Characteristics and Evaluation Index of Building Caused by Mining in Plain Village. Ph.D. Thesis, China University of Mining and Technology (Beijing), Beijing, China, 2015. [Google Scholar]
- He, T.; Xiao, W.; Zhao, Y.; Chen, W.; Deng, X.; Zhang, J. Continues monitoring of subsidence water in mining area from the eastern plain in China from 1986 to 2018 using Landsat imagery and Google Earth Engine. J. Clean. Prod. 2021, 279, 123610. [Google Scholar] [CrossRef]
- Hu, Z.; Shao, F.; McSweeney, K. Reclaiming subsided land with Yellow River sediments: Evaluation of soil-sediment columns. Geoderma 2017, 307, 210–219. [Google Scholar] [CrossRef]
- D/T 1031.3-2011; Regulations for the Preparation of Land Reclamation Programs Part 3: Shaft Coal Mines. Ministry of Land and Resources of the People’s Republic of China: Beijing, China, 2011. (In Chinese)
- Zhang, L.; Wang, J.; Feng, Y. Life cycle assessment of opencast coal mine production: A case study in Yimin mining area in China. Environ. Sci. Pollut. Res. 2018, 25, 8475–8486. [Google Scholar] [CrossRef]
- Smoliński, A.; Malashkevych, D.; Petlovanyi, M.; Rysbekov, K.; Lozynskyi, V.; Sai, K. Research into Impact of Leaving Waste Rocks in the Mined-Out Space on the Geomechanical State of the Rock Mass Surrounding the Longwall Face. Energies 2022, 15, 9522. [Google Scholar] [CrossRef]
- Malashkevych, D.; Petlovanyi, M.; Sai, K.; Zubko, S. Research into the coal quality with a new selective mining technology of the waste rock accumulation in the mined-out area. Min. Miner. Depos. 2022, 16, 103–114. [Google Scholar] [CrossRef]
- Xin, J.; Jiang, Q.; Gong, F.; Liu, L.; Liu, C.; Liu, Q.; Yang, Y.; Chen, P. Mechanical behaviors of backfill-rock composites: Physical shear test and back-analysis. J. Rock Mech. Geotech. Eng. 2024, 16. [Google Scholar]
- Xin, J.; Jiang, Q.; Li, S.; Chen, P.; Zhao, H. Fracturing and energy evolution of rock around prefabricated rectangular and circular tunnels under shearing load: A comparative analysis. Rock Mech. Rock Eng. 2023, 1–18. [Google Scholar]
- Bai, E.; Guo, W.; Tan, Y.; Huang, G.; Guo, M.; Ma, Z. Roadway Backfill Mining with Super-High-Water Material to Protect Surface Buildings: A Case Study. Appl. Sci. 2020, 10, 107. [Google Scholar] [CrossRef]
- Guo, W.J.; Wang, H.L.; Chen, S.J. Coal pillar safety and surface deformation characteristics of wide strip pillar mining in deep mine. Arab. J. Geosci. 2016, 9, 137. [Google Scholar] [CrossRef]
- Esterhuizen, G.S.; Dolinar, D.R.; Ellenberger, J.L. Pillar strength in underground stone mines in the United States. Int. J. Rock Mech. Min. Sci. 2011, 48, 42–50. [Google Scholar] [CrossRef]
- Guo, W.; Tan, Y.; Bai, E. Top coal caving mining technique in thick coal seam beneath the earth dam. Int. J. Min. Sci. Technol. 2017, 27, 165–170. [Google Scholar] [CrossRef]


| Damage Level | Surface Movement Deformation Thresholds | ||
|---|---|---|---|
| Horizontal Deformation (mm/m) | Curvature Deformation (10−3/m) | Inclined Deformation (10−3/m) | |
| I | ≤2.0 | ≤0.2 | ≤3.0 |
| II | 2.0~4.0 | 0.2~0.4 | 3.0~6.0 |
| III | 4.0~6.0 | 0.4~0.6 | 6.0~10.0 |
| IV | >6.0 | >0.6 | >10.0 |
| Damage Level | Surface Movement Deformation Thresholds | ||
|---|---|---|---|
| Subsidence (mm) | Horizontal Deformation (mm/m) | Inclined Deformation (10−3/m) | |
| mildly damaged | ≤1500 | ≤4.0 | ≤6.0 |
| moderately damaged | 1500~3000 | 4.0~8.0 | 6.0~12.0 |
| severely destroyed | >3000 | >8.0 | >12.0 |
| Coal Seam | Subsidence Factor | Horizontal Movement Factor | Uphill Angle of Critical Deformation (°) | Downhill Angle of Critical Deformation (°) | Offset Distance of Inflection Point |
|---|---|---|---|---|---|
| 21 | 0.6 | 0.3 | 69 | 65 | 0.1 H |
| 17 | 0.72 | 0.3 | 69 | 65 | 0.1 H |
| Damage level | I | II | III | IV | Total |
| Number of building damages/size | 1 | 5 | 5 | 3 | 14 |
| Damage level | Mildly damaged | Moderately damaged | Severely destroyed |  | Total |
| Cropland area/hm2 | 11.96 | 15.34 | 5.37 | 32.67 |
| Damage reason | E | T | J | E&T | T&K | E&K | E&T&K | Total |
| Number of house damages/size | 5 | 7 | 0 | 2 | 0 | 0 | 0 | 14 |
| Damage reason | W | E | T | W&E | E&T | W&T | W&E&T | Total |
| Cropland area/hm2 | 1.19 | 3.95 | 10.94 | 1.94 | 3.34 | 1.36 | 9.95 | 32.67 |
| Damage Level | Contribution Rate of Each Deformation Index to Building Damage (%) | ||
| E | T | K | |
| I | 69.53 | 28.30 | 2.17 |
| II | 54.79 | 40.47 | 4.74 |
| III | 36.1 | 63.85 | 0.05 |
| IV | 32.96 | 67.03 | 0.01 |
| Damage Level | Contribution Rate of Each Deformation Index to Cropland Damage (%) | ||
| W | E | T | |
| mildly damaged | 33.38 | 32.68 | 33.94 |
| moderately damaged | 14.4 | 29.09 | 56.51 |
| severely destroyed | 0 | 21.74 | 78.26 |
Disclaimer/Publisher’s Note: The statements, opinions and data contained in all publications are solely those of the individual author(s) and contributor(s) and not of MDPI and/or the editor(s). MDPI and/or the editor(s) disclaim responsibility for any injury to people or property resulting from any ideas, methods, instructions or products referred to in the content. |
© 2023 by the authors. Licensee MDPI, Basel, Switzerland. This article is an open access article distributed under the terms and conditions of the Creative Commons Attribution (CC BY) license (https://creativecommons.org/licenses/by/4.0/).
Share and Cite
Zhao, B.; Chen, P.; Wang, J.; Zhang, J.; Zhai, D. A Comprehensive Evaluation and Analysis of Ground Surface Damage Due to Mining under Villages Based on GIS. Appl. Sci. 2023, 13, 10136. https://doi.org/10.3390/app131810136
Zhao B, Chen P, Wang J, Zhang J, Zhai D. A Comprehensive Evaluation and Analysis of Ground Surface Damage Due to Mining under Villages Based on GIS. Applied Sciences. 2023; 13(18):10136. https://doi.org/10.3390/app131810136
Chicago/Turabian StyleZhao, Bingchao, Pan Chen, Jingbin Wang, Jingui Zhang, and Di Zhai. 2023. "A Comprehensive Evaluation and Analysis of Ground Surface Damage Due to Mining under Villages Based on GIS" Applied Sciences 13, no. 18: 10136. https://doi.org/10.3390/app131810136
APA StyleZhao, B., Chen, P., Wang, J., Zhang, J., & Zhai, D. (2023). A Comprehensive Evaluation and Analysis of Ground Surface Damage Due to Mining under Villages Based on GIS. Applied Sciences, 13(18), 10136. https://doi.org/10.3390/app131810136