Article

A Study on Fatigue Crack Reinforcement of Bridge Deck and U-Rib Weld after Considering Residual Stress

School of Civil Engineering, Suzhou University of Science and Technology, Suzhou 215009, China
*
Author to whom correspondence should be addressed.
Appl. Sci. 2023, 13(18), 10185; https://doi.org/10.3390/app131810185
Submission received: 1 August 2023 / Revised: 1 September 2023 / Accepted: 6 September 2023 / Published: 11 September 2023

Abstract

:
In order to study the fatigue performance of the initial crack between the CFRP reinforced deck and the U-rib weld after considering the residual stress, the welding residual stress of the deck and the U-rib weld was analyzed by the welding subprogram of ABAQUS, and then the segment model of the deck and the U-rib of the steel bridge deck was established by using the interaction technology of FRANC 3D-ABAQUS, and the stress intensity factor of the crack between the deck and the U-rib weld under the vehicle-only, vehicle-residual stress combined loads, and CFRP-strengthened combined loads were analyzed. The growth analysis of cracks before and after reinforcement was carried out. The results show that the amplitude of the stress intensity factor of the crack tip is less than the threshold when only the vehicle is applied, and the crack will not spread. After considering the residual stress, the maximum KI value of the crack at the welding toe is increased by 6.9 times compared with the maximum value of the vehicle only, and the maximum KI value at the welding root is increased by 10.7 times; the reinforcement method of CFRP pasted on the lower surface has a reinforcement effect on the fatigue crack at the welding toe, but the fatigue crack at the welding root has no reinforcement effect; the reinforcement effect of the welded toe crack increases with the increase of the number of CFRP layers, length, and width. When the weld toe crack after reinforcement extends to half the thickness of the deck, the number of car-residual stress combined load cycles increases by 43% compared to when it is not reinforced.

1. Introduction

Orthotropic steel bridge decks are composed of decks that directly bear loads and mutually orthogonal longitudinal and transverse ribs, which are connected by welding, and have advantages such as high bearing capacity, light weight, and fast construction. Steel bridge decks are often used in large-span bridges, making the structure complex and having numerous welds [1,2]. The uneven temperature field during the welding process can generate complex residual stresses. The uneven temperature field during the welding process can generate complex residual stresses, and even small residual tensile stresses can accelerate structural fatigue damage and reduce its fatigue life [3,4,5,6]. Fatigue cracks that originate from the welding toe or root of the deck and U-ribs will propagate along the thickness direction of the deck under repeated vehicle loads and residual stresses [7,8,9]. If maintenance and reinforcement measures are not taken, they will eventually form through cracks that endanger driving safety. Carbon Fiber Reinforced Polymer (CFRP) has advantages such as high specific strength, high specific modulus, high strength, good fatigue resistance, strong designability, good high-temperature performance, good formability, and convenient adhesion [10,11,12]. In recent decades, the application of CFRP materials to reinforce steel structural components has become an effective choice for meeting increasing cyclic loads or repairing due to fatigue cracking. The use of CFRP materials for steel structure reinforcement can effectively reduce local stress and especially improve the fatigue performance of members. It has advantages that other methods cannot compare to, that is, it does not need to drill holes in the damaged parts to avoid new stress concentration areas. It has high research and use value for improving the fatigue life of steel members [13,14,15]. Zhang et al. conducted fatigue tests and analysis of CFRP reinforcement on cross-shaped specimens containing K-shaped welds, while Li et al. and Song et al. conducted reinforcement studies on fatigue cracks at the arc notch of the transverse partition of orthotropic steel bridges using CFRP material. The results showed that pasting the CFRP sheet shared the stress at the weld toe and improved the fatigue performance of the weld toe [16,17,18]. Therefore, adopting CFRP materials to improve the fatigue problem of orthotropic steel bridge decks will be a future research focus.
FRANC 3D 7.5.5 version is a software specifically designed for analyzing crack growth, which simplifies some of the tedious steps of crack growth compared to non-professional software such as ABAQUS (2020 version) and ANSYS. However, due to the inability of FRANC 3D to perform model preprocessing work, it is necessary to combine ABAQUS and other finite element software when analyzing cracks using FRANC 3D. FRANC 3D uses the M-integral method to solve the stress intensity factor. Its mathematical expression is similar to the J-integral, but it can consider the influence of temperature, crack surface contact, crack surface traction, residual stress, etc., on the stress intensity factor. When analyzing cracks in FRANC 3D, the front edge of the crack is divided into unit ring grids to refine the grid, thereby reducing calculation errors and improving the accuracy of the calculation results. Refs. [19,20,21,22] compared the calculation results of FRANC 3D with the standard formula, and the validation results showed that FRANC 3D has high accuracy. The interaction process between FRANC 3D and ABAQUS is shown in Figure 1.

2. Analysis of Stress Characteristics in Welding Details of Deck-U-Ribs

2.1. Project Overview

Taking the Anqing Yangtze River Highway Bridge as an example, the thickness of the deck is 14 mm, the thickness of the U-ribs is 8 mm, the widths of the upper and lower U-ribs are 300 mm and 170 mm, respectively, the height of the U-ribs is 280 mm, the horizontal spacing is 600 mm, and the longitudinal spacing is 3750 mm. Five U-ribs are selected in the transverse direction and four diaphragms in the longitudinal direction as the segment model (Figure 2). C3D8R units are used for the segment model. Q345 steel is used in the model. The elastic modulus is 206 GPa and Poisson’s ratio is 0.3.

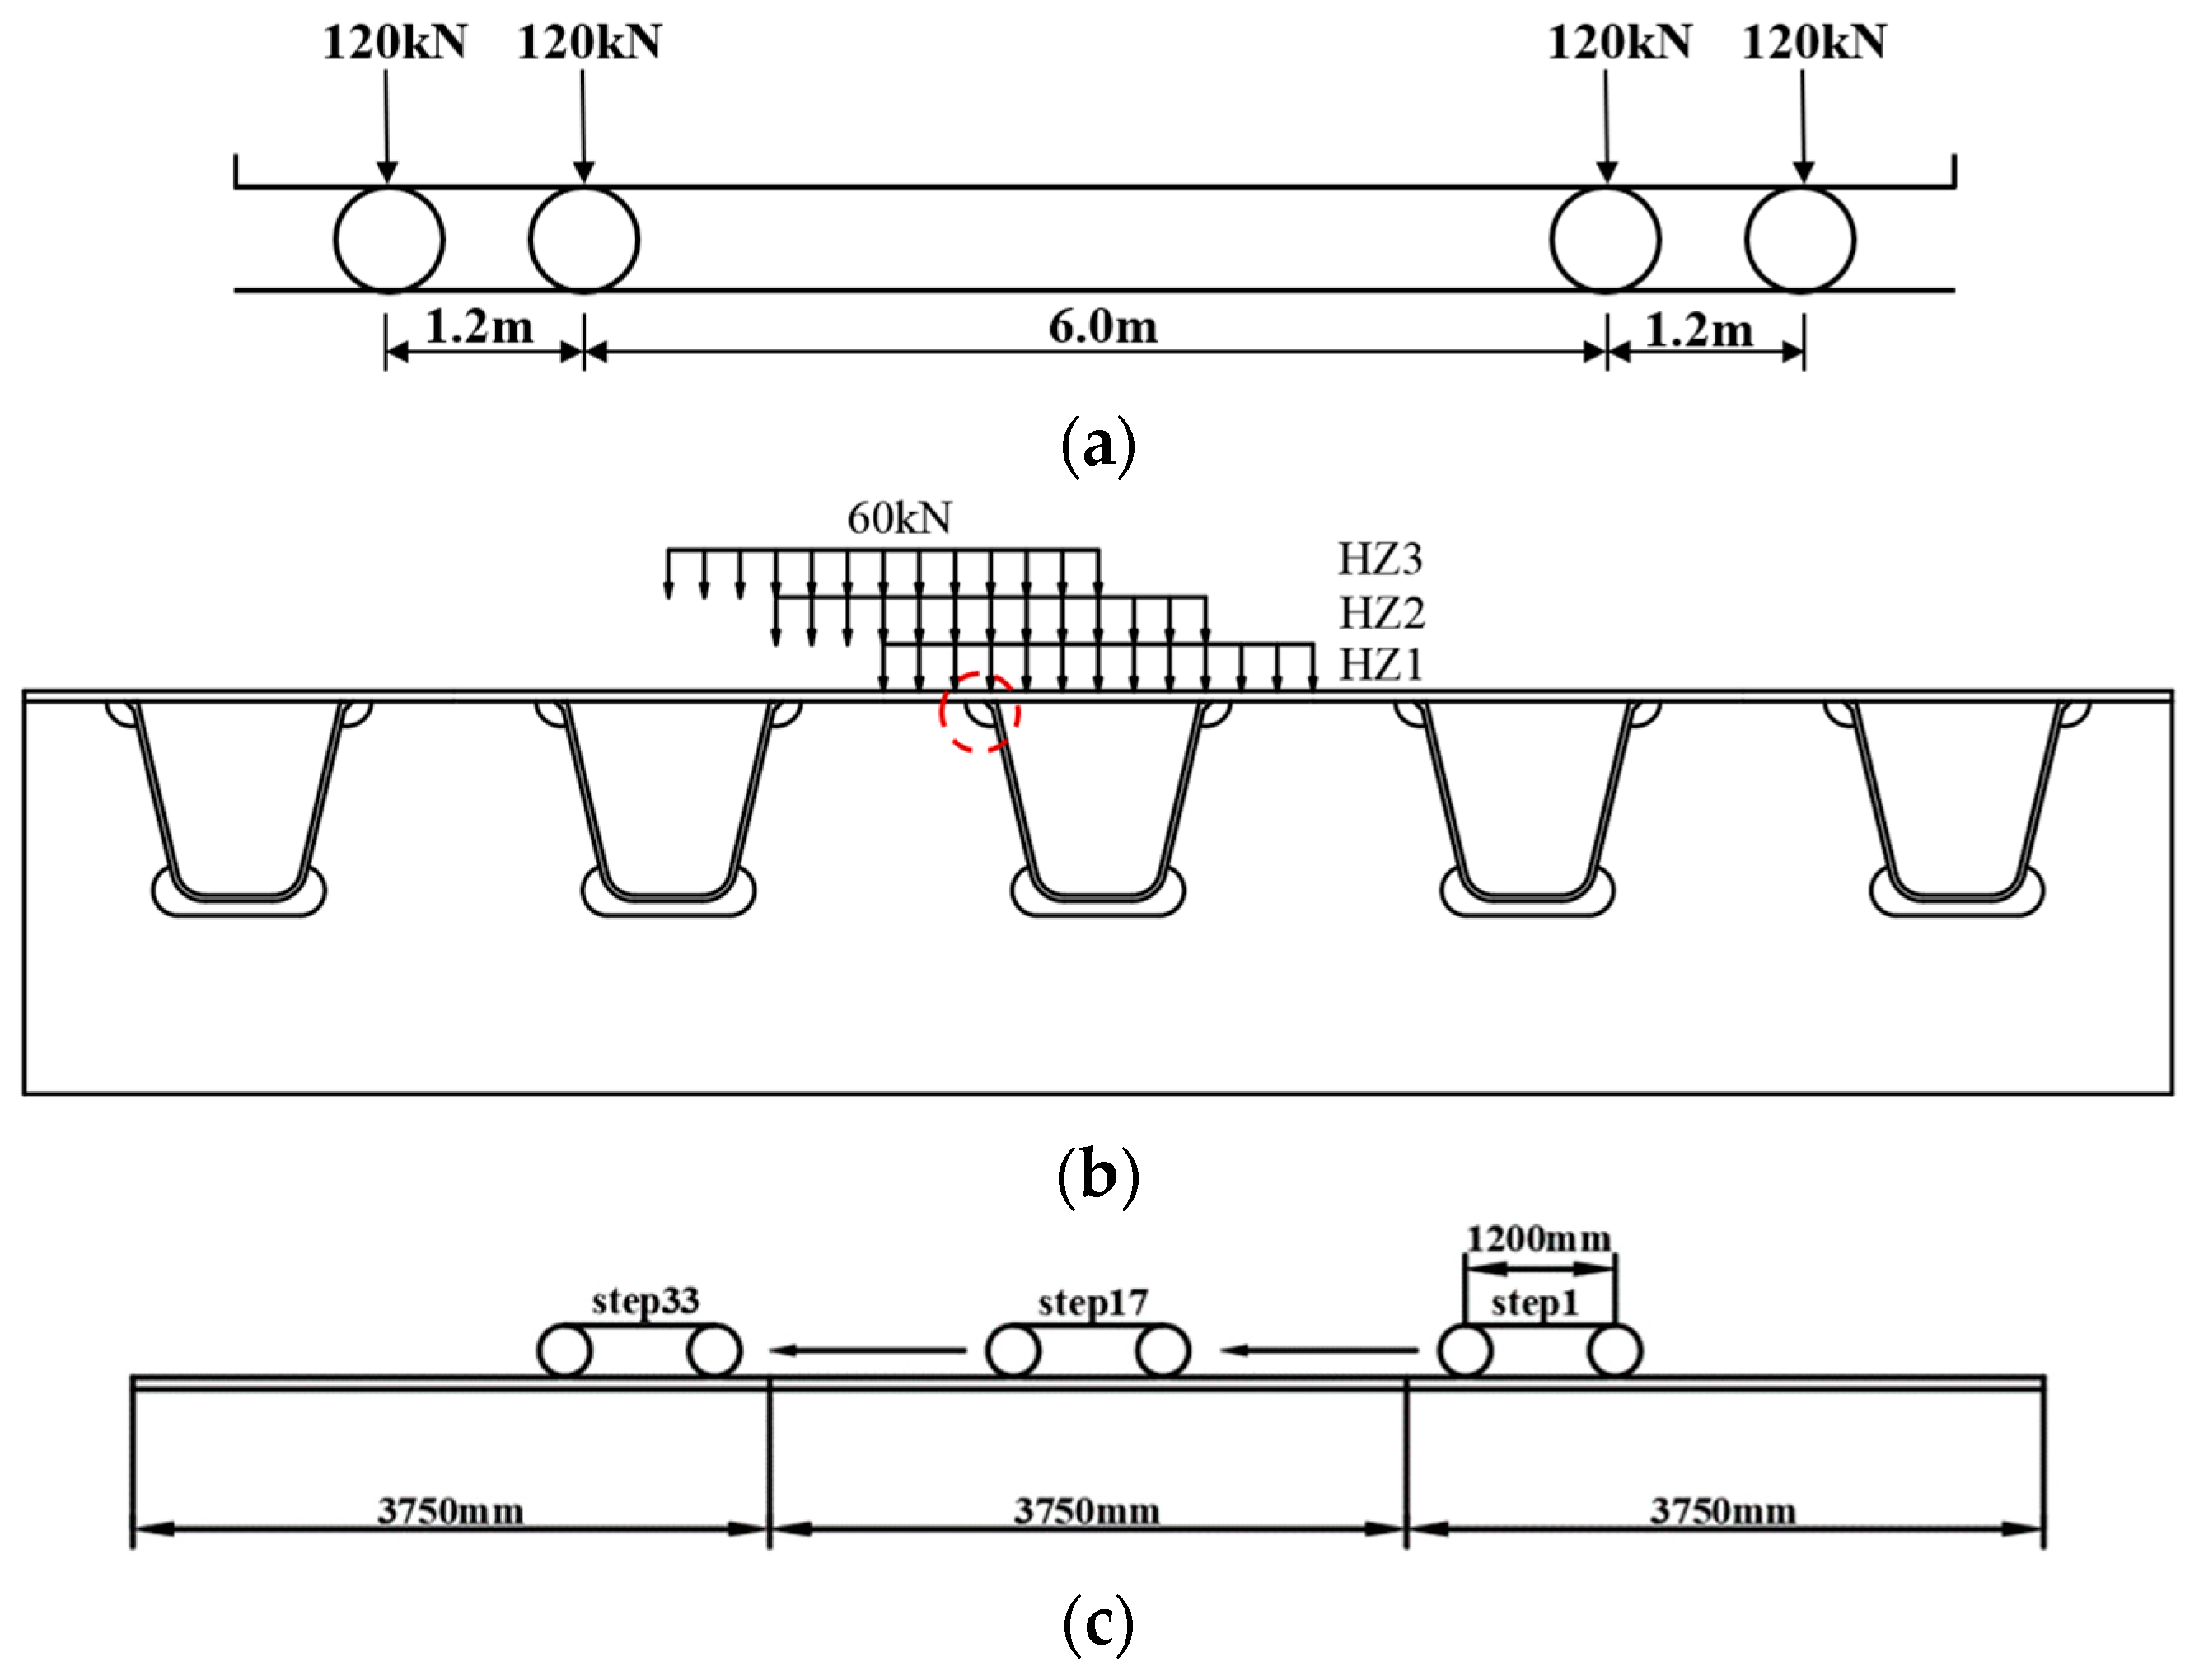
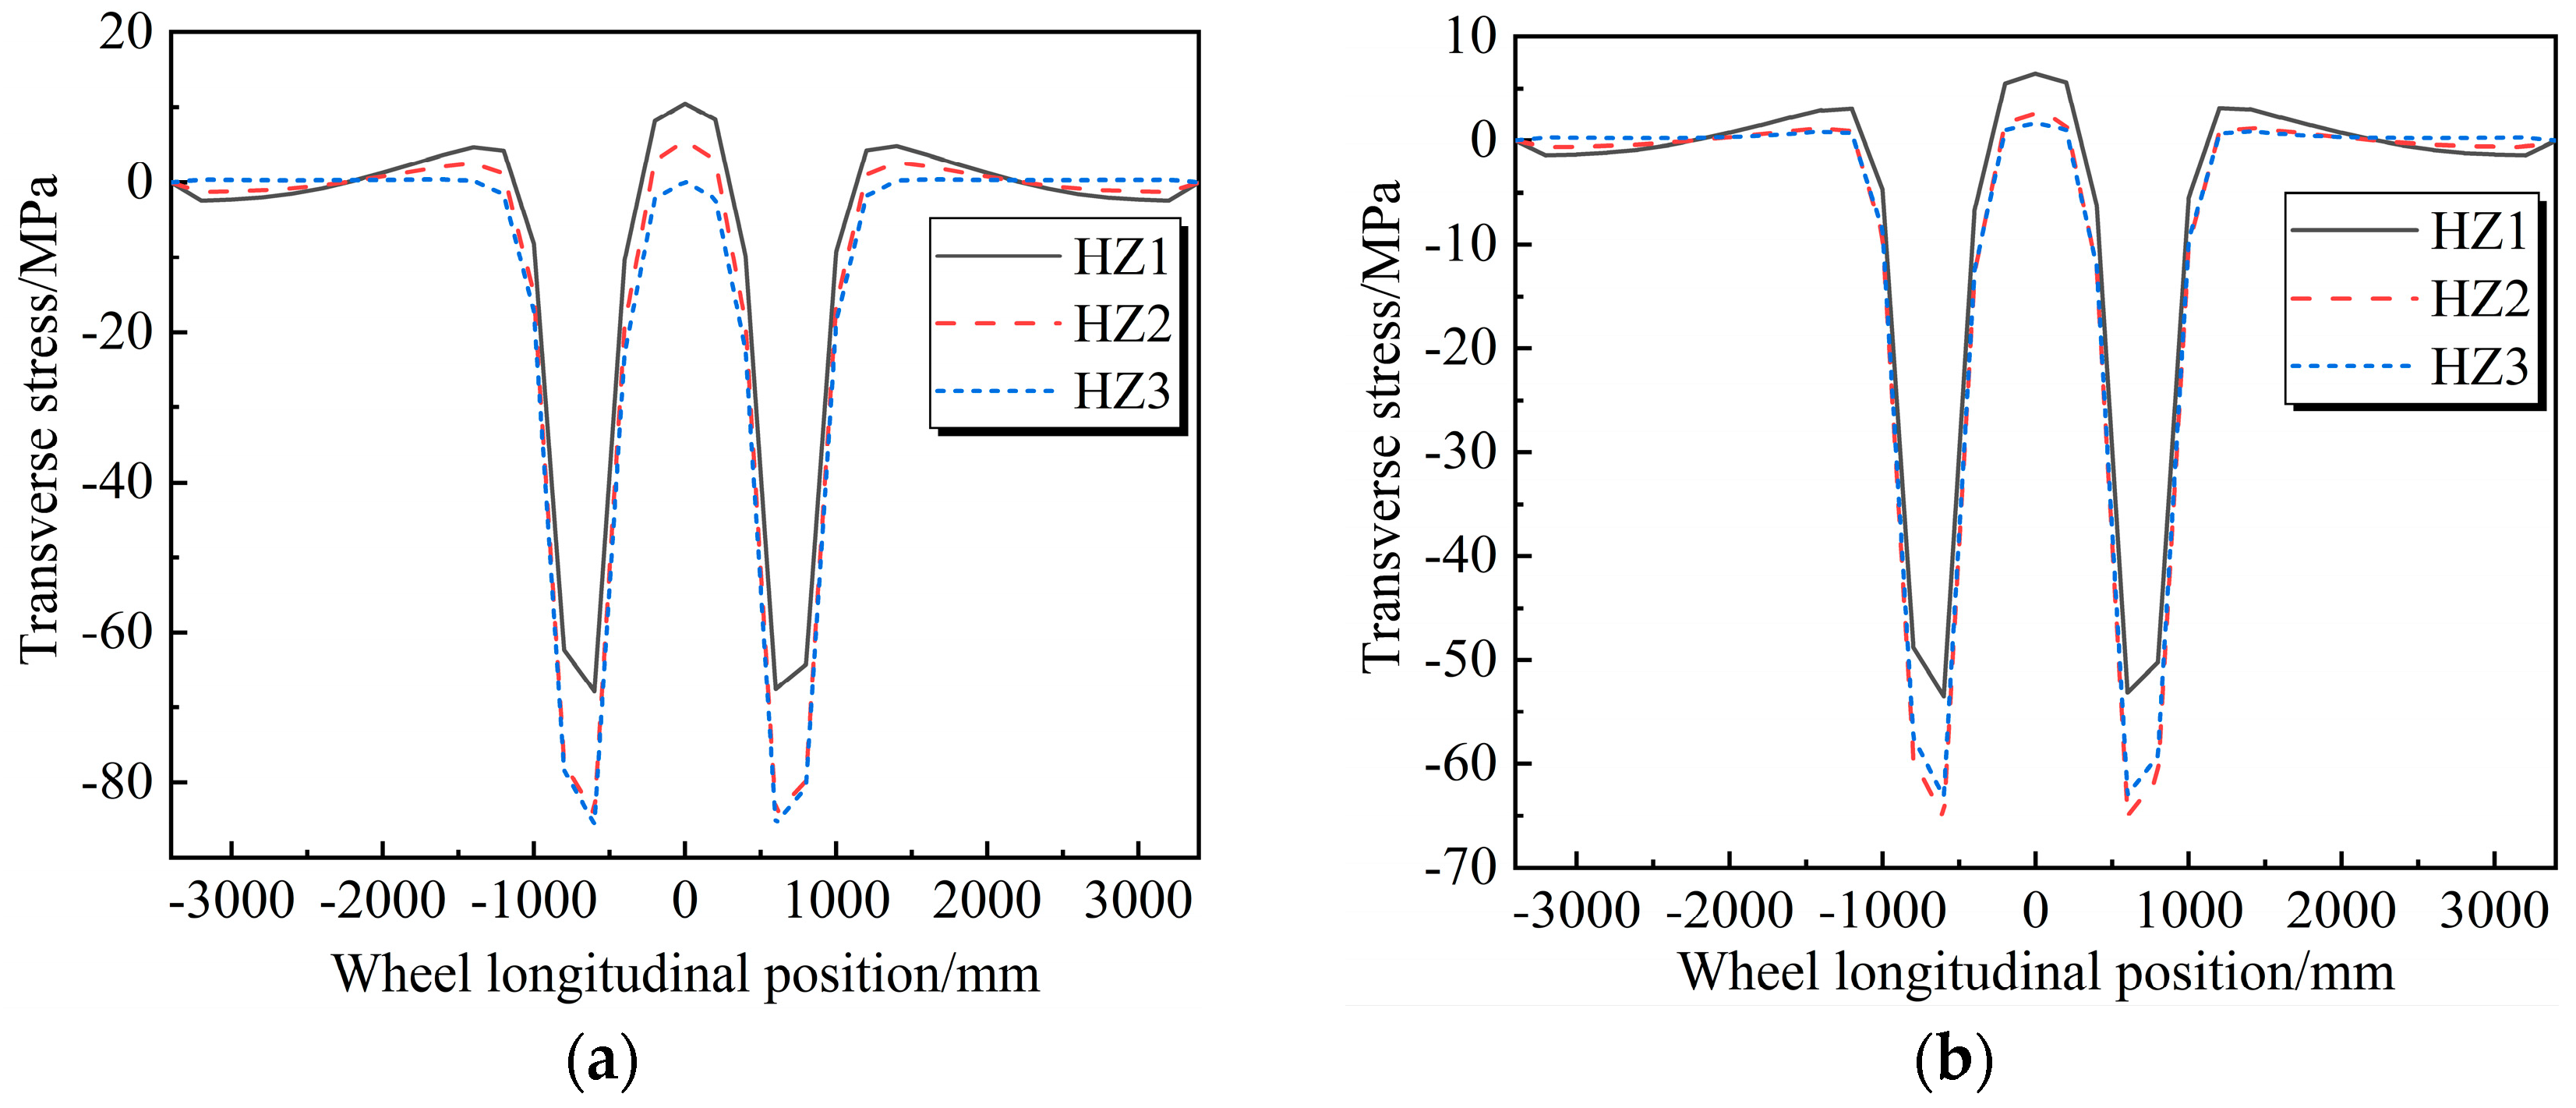
2.2. Loading Conditions

The loading vehicle adopts the fatigue load model III [23] in the “Design Specification for Highway Steel Structure Bridges” (JTG D64-2015), as shown in Figure 3a. In order to determine the most unfavorable load positions of the deck and U-ribs, three typical positions were selected in the transverse bridge direction: HZ1 located directly above the U-ribs; HZ2 located directly above the U-rib weld seam; and HZ3 located between two U-ribs, as shown in Figure 3b, which is a Dlaod mobile vehicle subroutine written in Fortran language for the longitudinal bridge direction, with a step size of 200 mm each time. There are a total of 33 working conditions, as shown in Figure 3c.
The fatigue cracking of the welding details of the steel bridge deck-U-rib is mainly affected by the transverse stress perpendicular to the weld seam. Therefore, only the transverse stress component at the welding details of the deck-U-rib is considered. The stress distribution at the welding connection between the steel bridge deck and the U-rib at different lateral loading positions under the action of moving vehicle loads is shown in Figure 4. The results indicate that when the lateral load is directly above the U-rib and the mobile vehicle travels to the midspan, the unfavorable load borne by the focus position is the greatest.

3. Finite Element Analysis of Welding Residual Stress

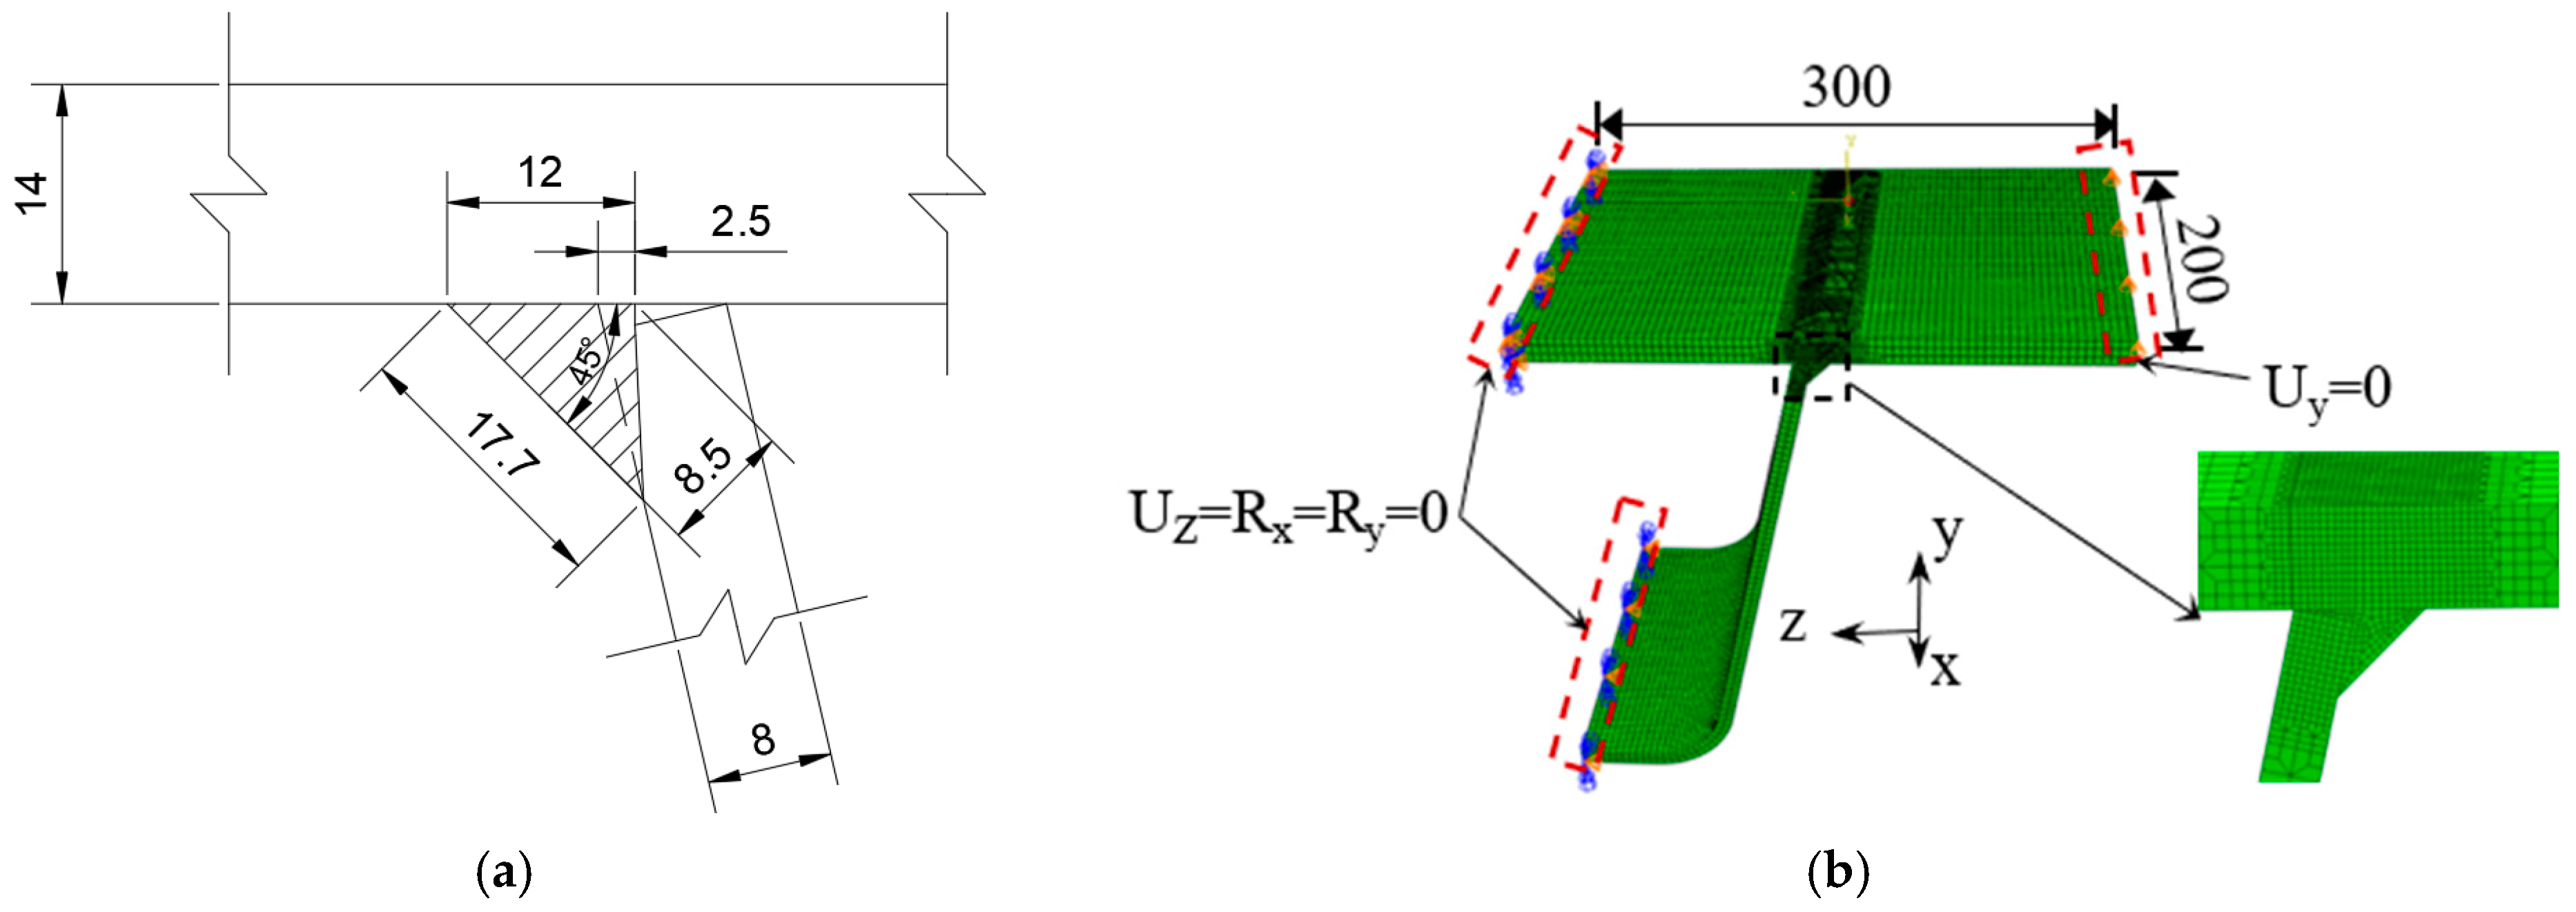
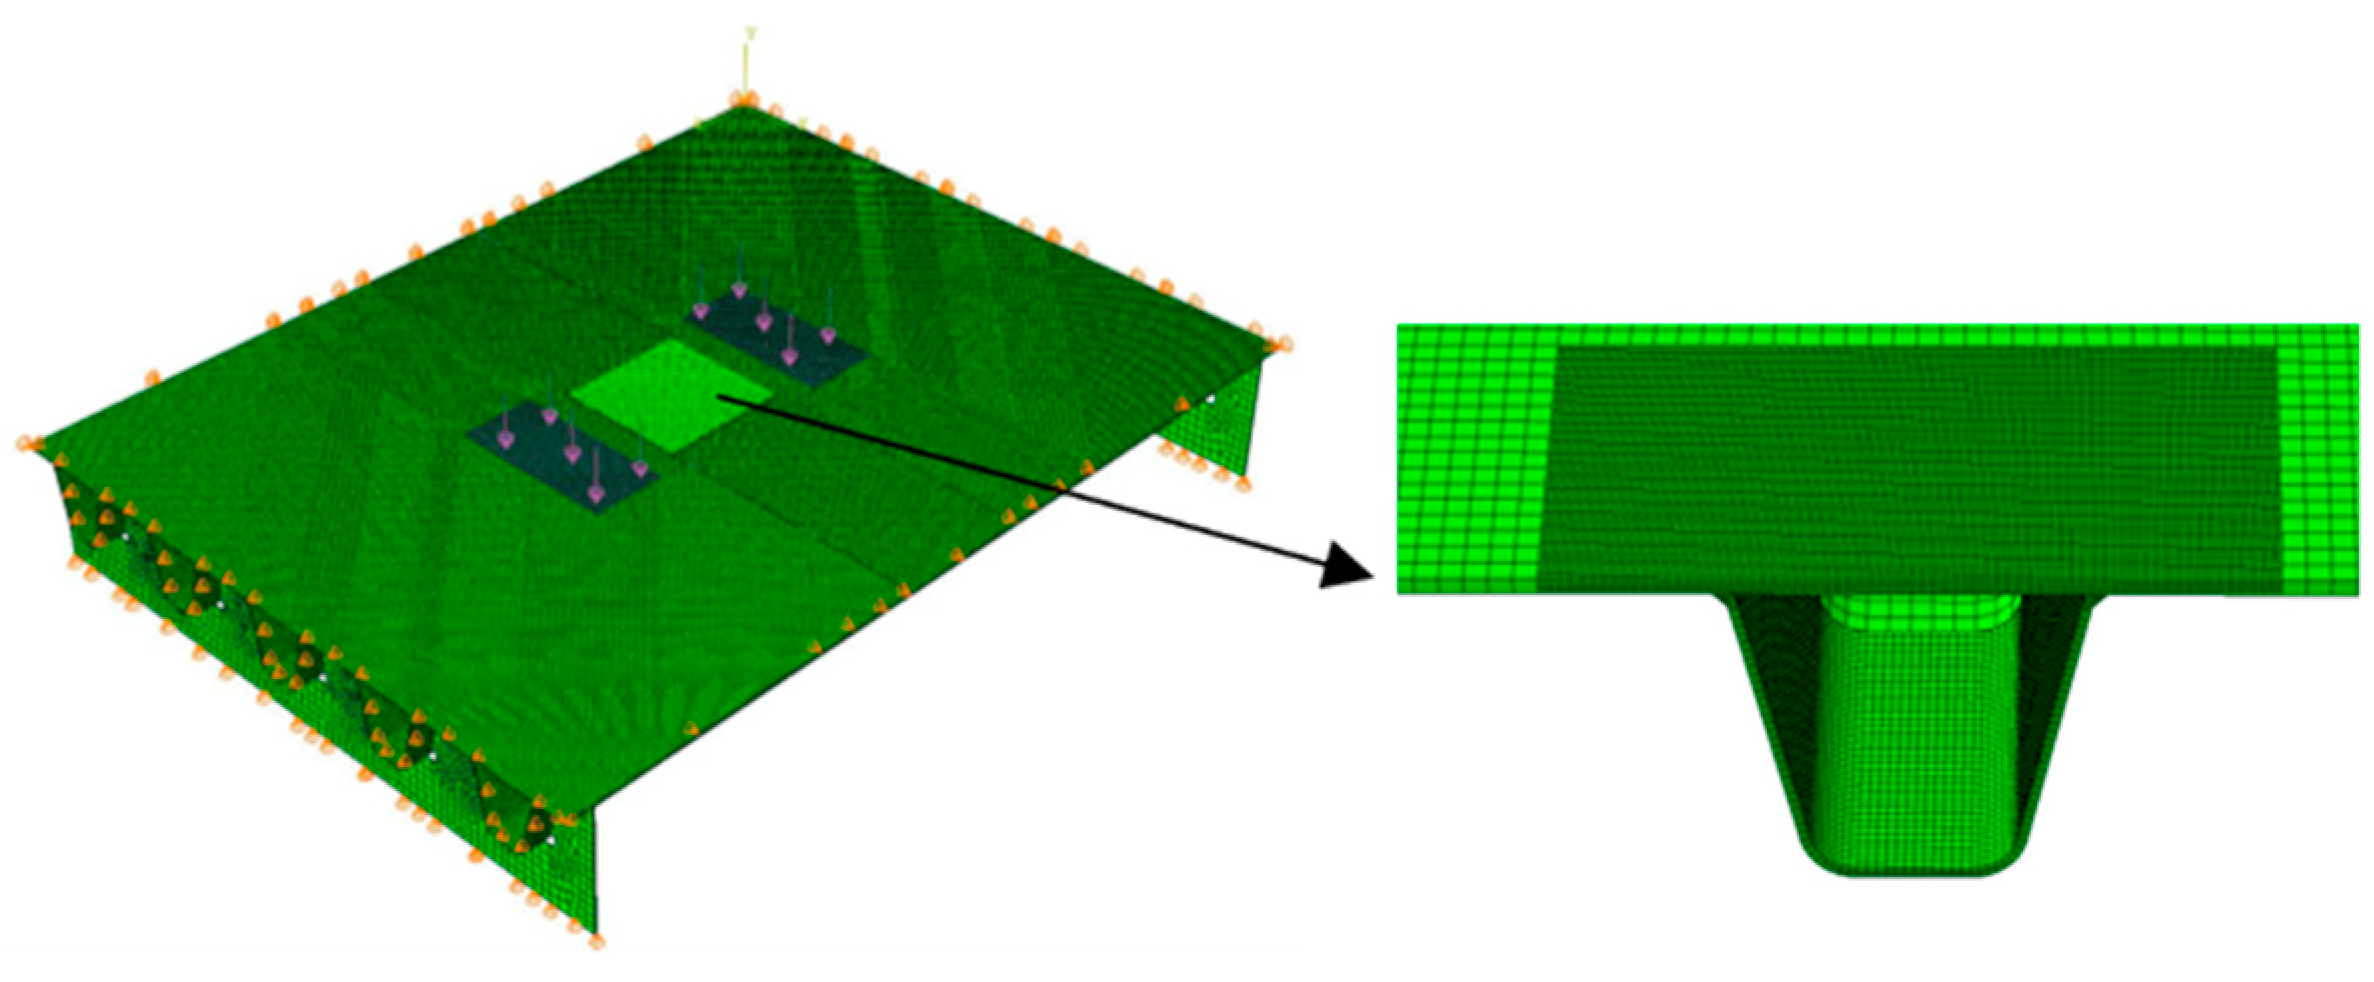
3.1. Welding Finite Element Model

The orthotropic steel bridge deck and U-ribs are connected by welding. During the welding process, uneven temperature fields, local restrained expansion and contraction, and local plastic deformation may occur. The enclosed colder material will suppress the shrinkage of the heating material, resulting in residual tensile stress near the weld seam. Higher residual tensile stress will accelerate the growth of fatigue cracks [24,25,26]. Following are directions for preparing the model. Select a half U-shaped rib with a transverse direction of 300 mm and a longitudinal direction of 200 mm for simulation of welding residual stress and divide the weld area into a 1 mm refined grid. The surrounding area adopts a 4 mm grid, and a 2 mm transition element is used between the two. Apply a symmetric constraint in the z-direction at the symmetrical centerline of the deck and U-rib, which constrains the translation in the z-direction and the rotation in the x and y directions. On the other side of the bottom surface of the deck, constrain the translation in the y direction, as shown in Figure 5b.
The welding simulation process involves complex material nonlinear problems, and the calculation requires defining the physical and thermodynamic parameters of the material at different temperatures. Due to the incomplete thermophysical parameters of steel materials at present, the temperature-dependent curve of Q345 steel material parameters was obtained from references [27,28], and the radiation Stephen Boltzmann constant was taken as 5.67 × 10⁻⁸ W/(m2·°C4) according to references [29]; the convection heat transfer coefficient is 13 W/(m2·K); absolute zero is −273.15 °C. The finite element analysis of welding residual stress is carried out using the sequential thermal coupling method, and the welding heat input process is simulated using the “life and death element” method to simulate the weld filling method. According to the boundary criterion of the welding pool, the isothermal surface is formed by taking the steel melting point of 1500 °C as the boundary, and the temperature equal to the melting point temperature forms the contour of the welding pool. The gray area is the area above the melting point, as shown in Figure 6. The shape of the welding pool is relatively close to the actual weld dimensions (Figure 5a), indicating that the selection of heat source model parameters is reasonable.

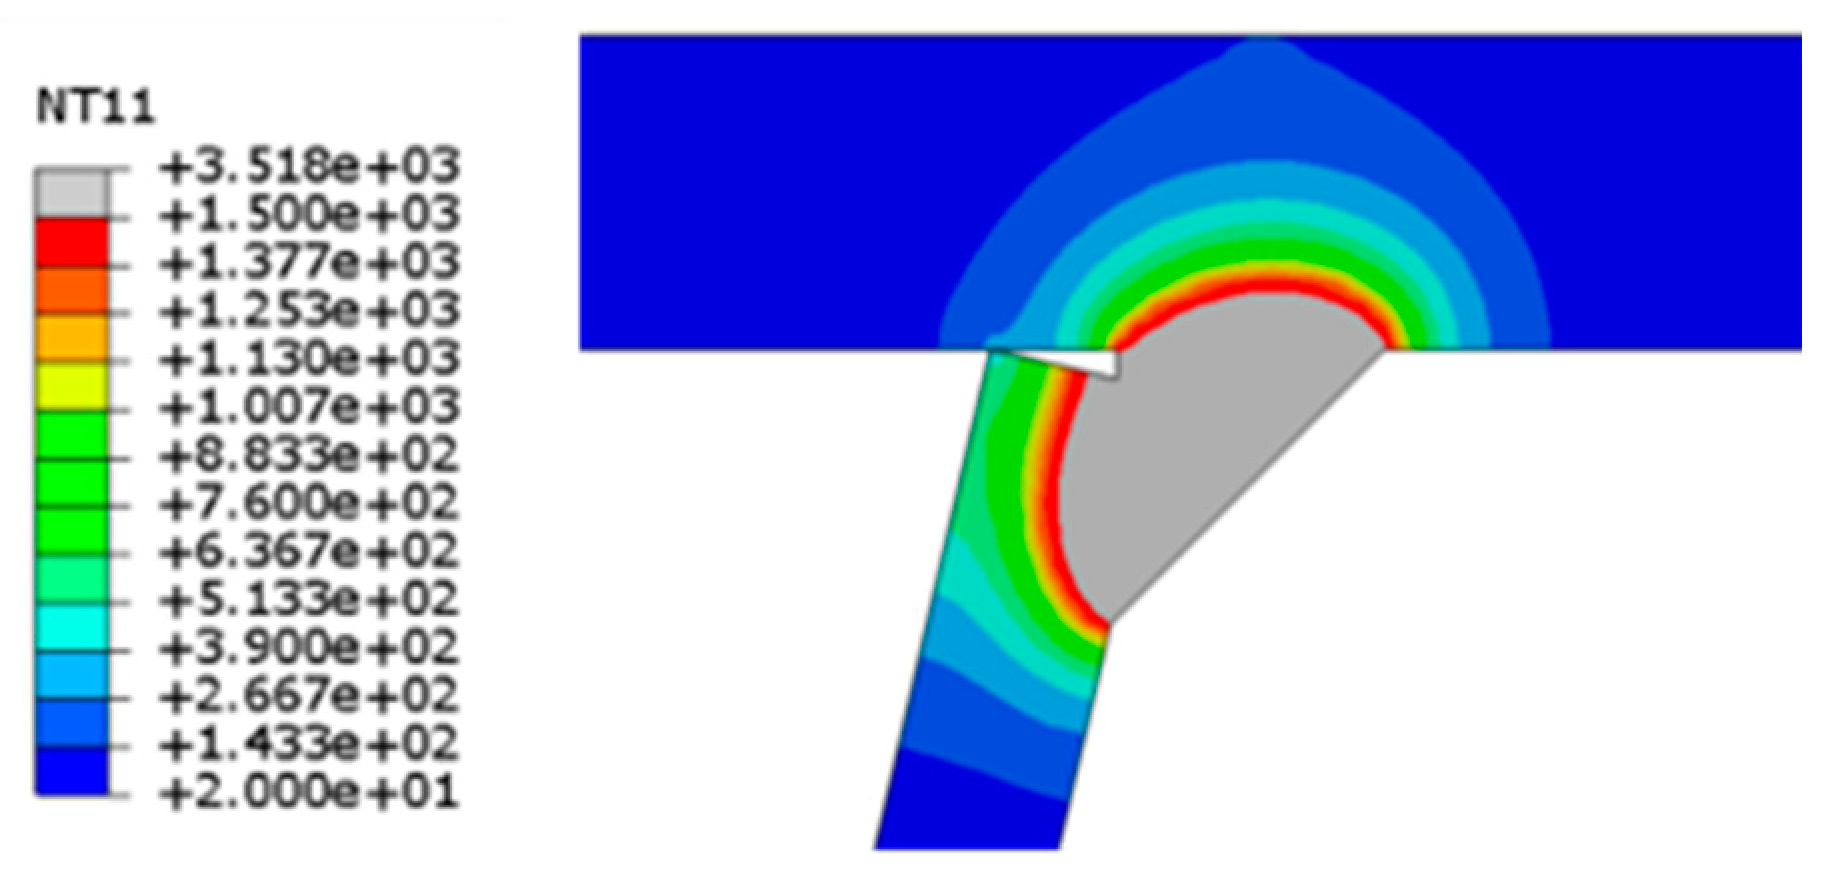
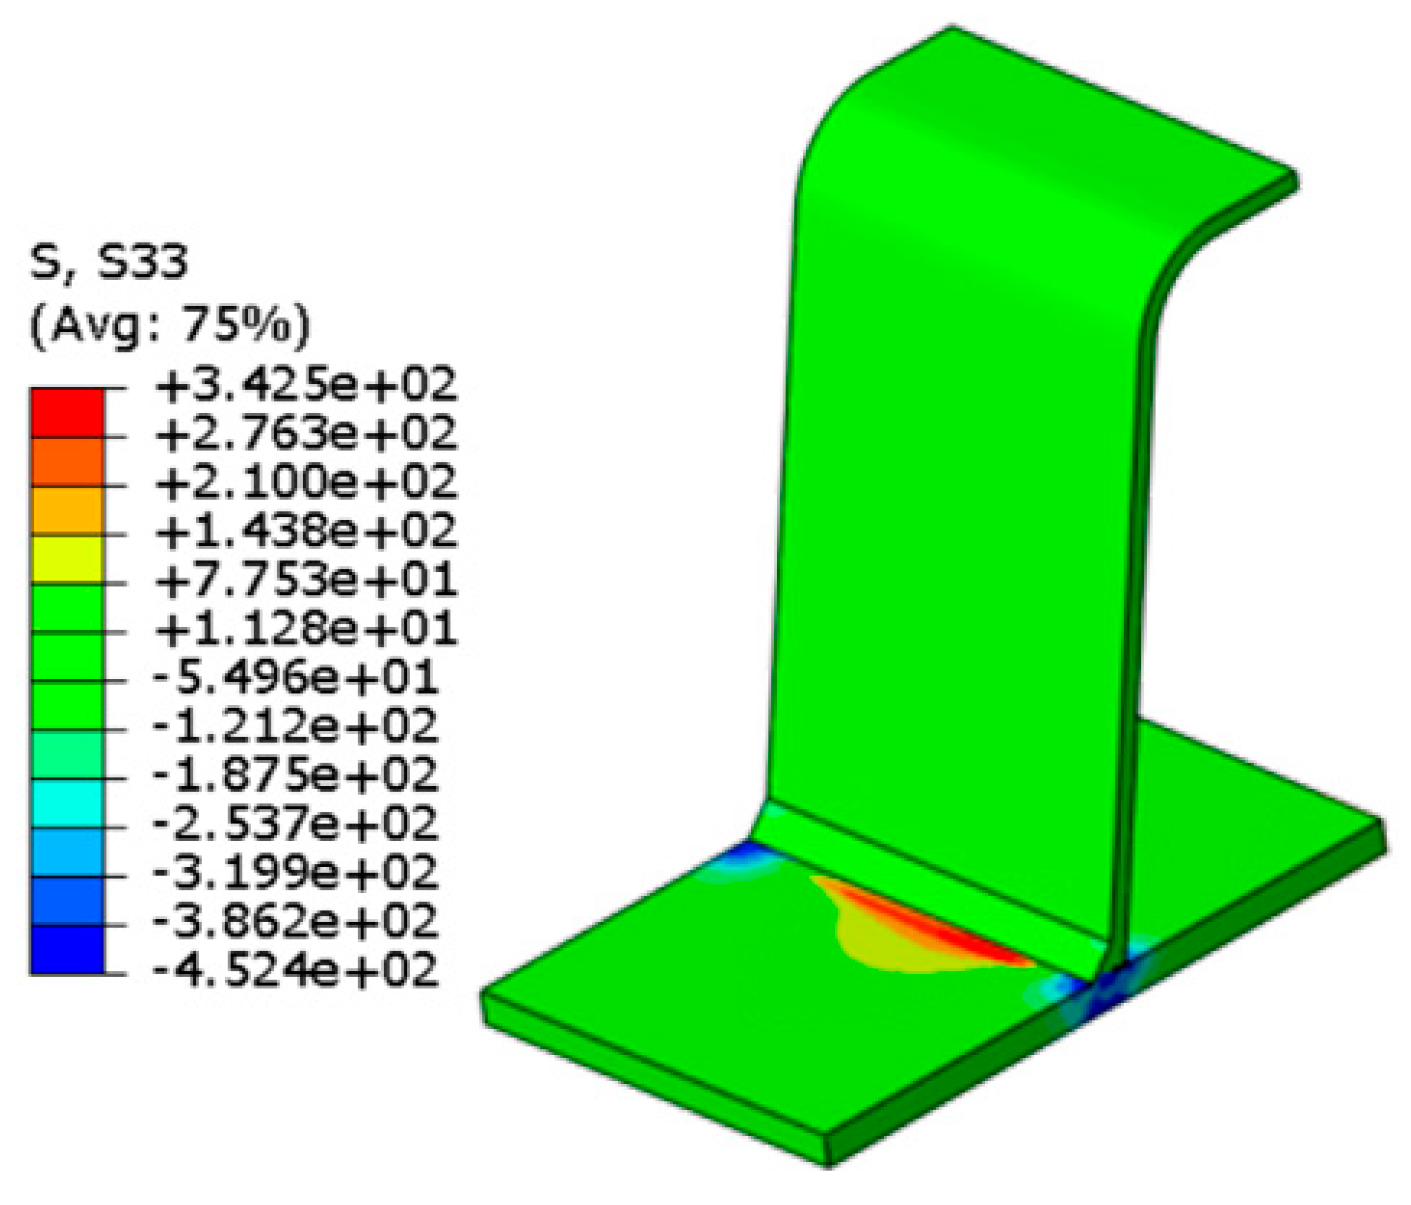
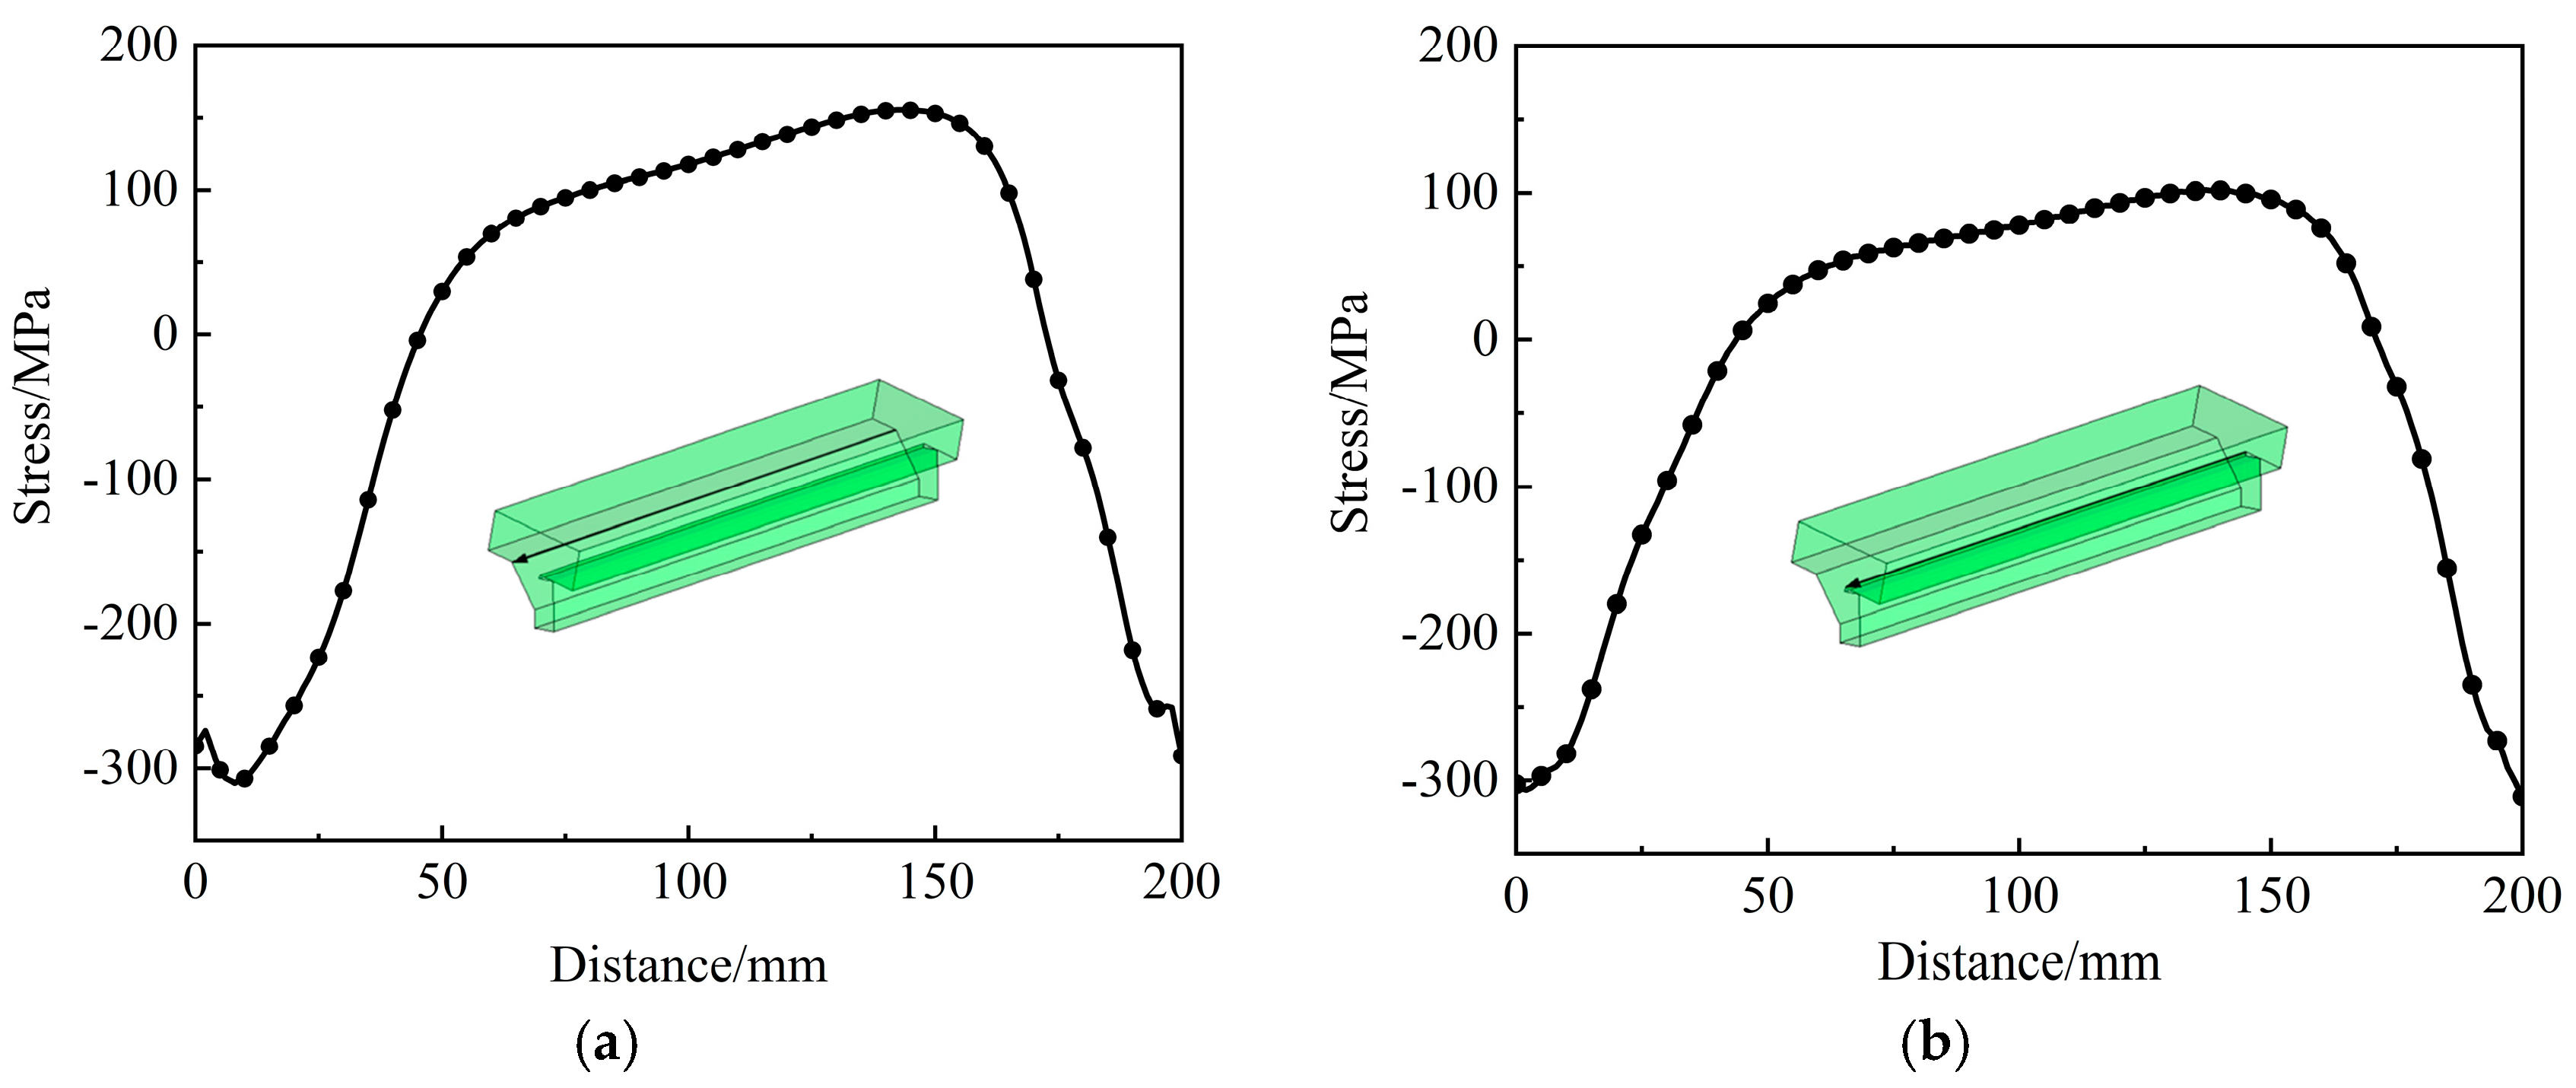
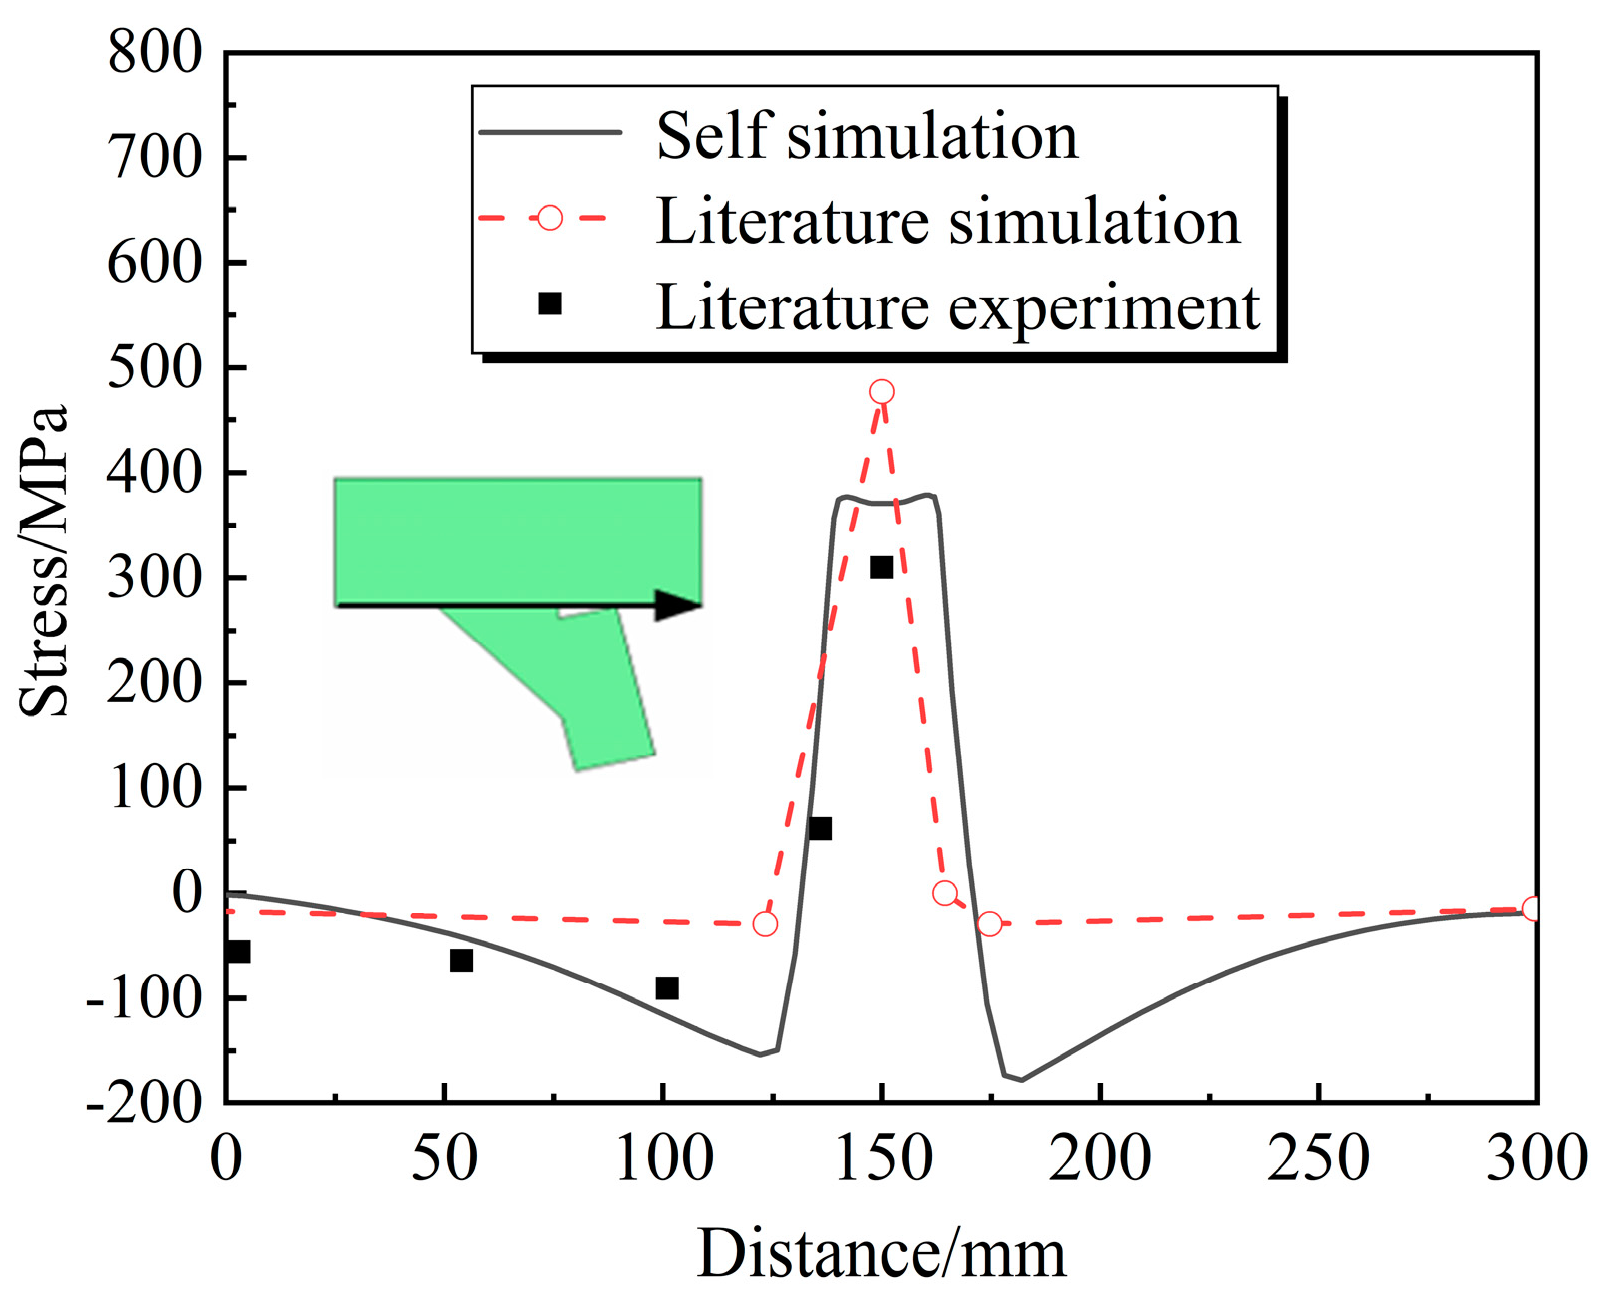
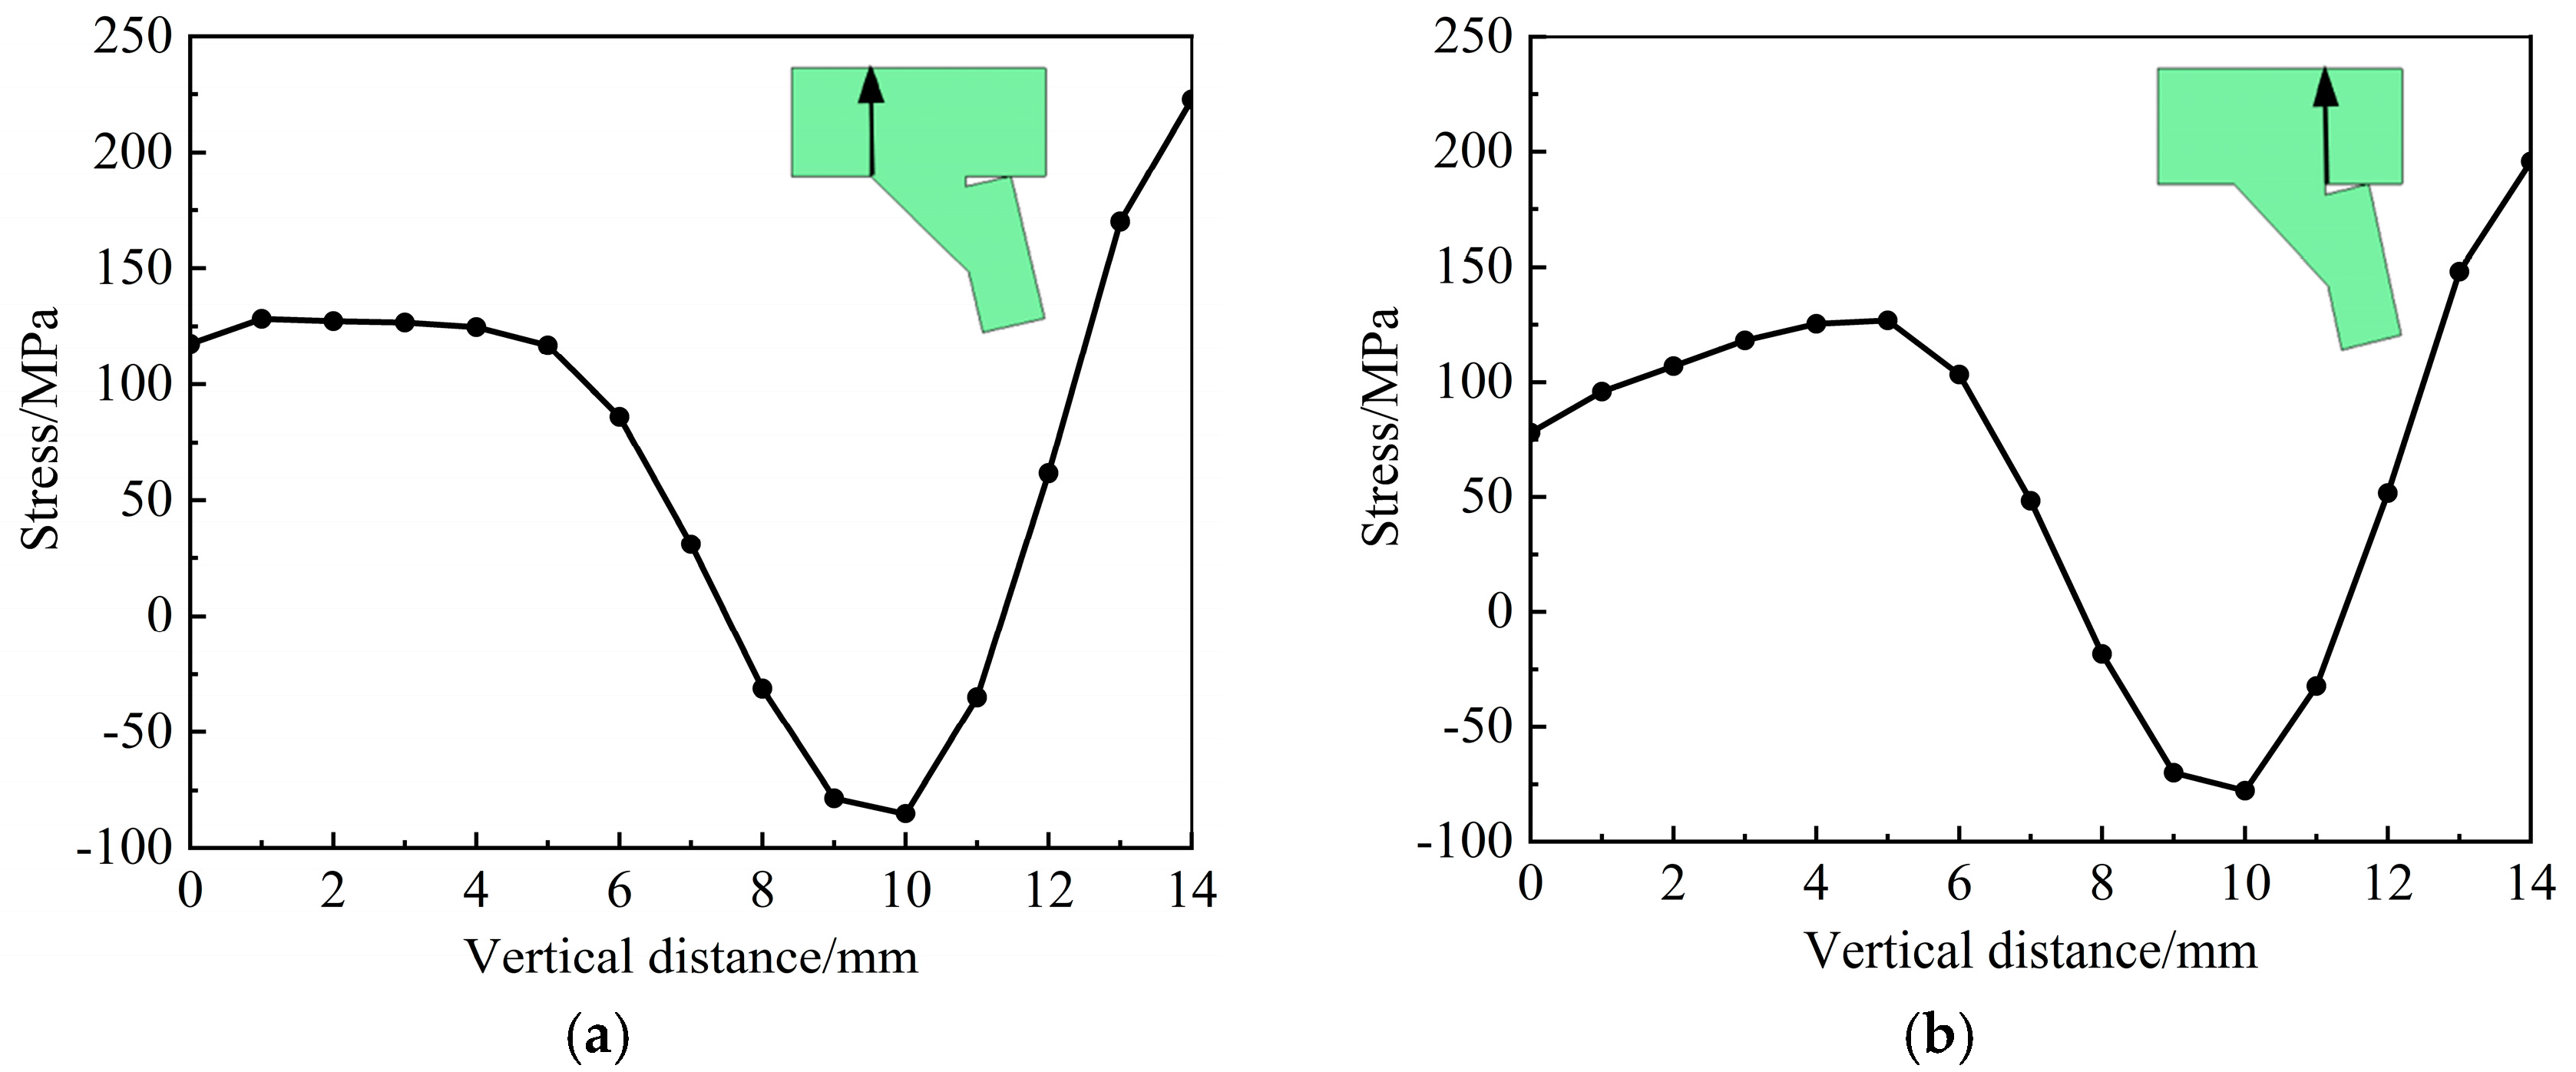
3.2. Welding Residual Stress Field Analysis Results

The transverse residual stress is caused by the uneven transverse temperature distribution during welding, which causes the material to expand and contract transversely. The results are shown in Figure 7. The transverse residual stress along the direction of the weld seam is shown in Figure 8, with compressive stress in the arc initiation and arc extinction zones and relatively stable tensile stress in the stable zone of the middle weld. Comparing the finite element analysis and experimental results of transverse residual stress at the intermediate weld seam in reference [30] with the simulation results in this paper, as shown in Figure 9, it was found that the simulation results in this paper are relatively consistent, indicating that the simulation of residual stress is reasonable. The welding toe and root at the connection between the orthotropic steel bridge deck and the U-rib are the locations where fatigue cracks are prone to initiate and develop along the direction of the weld seam. The transverse welding residual stress perpendicular to the weld seam direction is the most unfavorable among the residual stresses, which will accelerate the propagation of fatigue cracks. The transverse residual stress along the plate thickness direction at the welding toe and root at the middle welding stable positioning position x = 100 mm is shown in Figure 10, showing a tensile–compression–tensile distribution pattern.

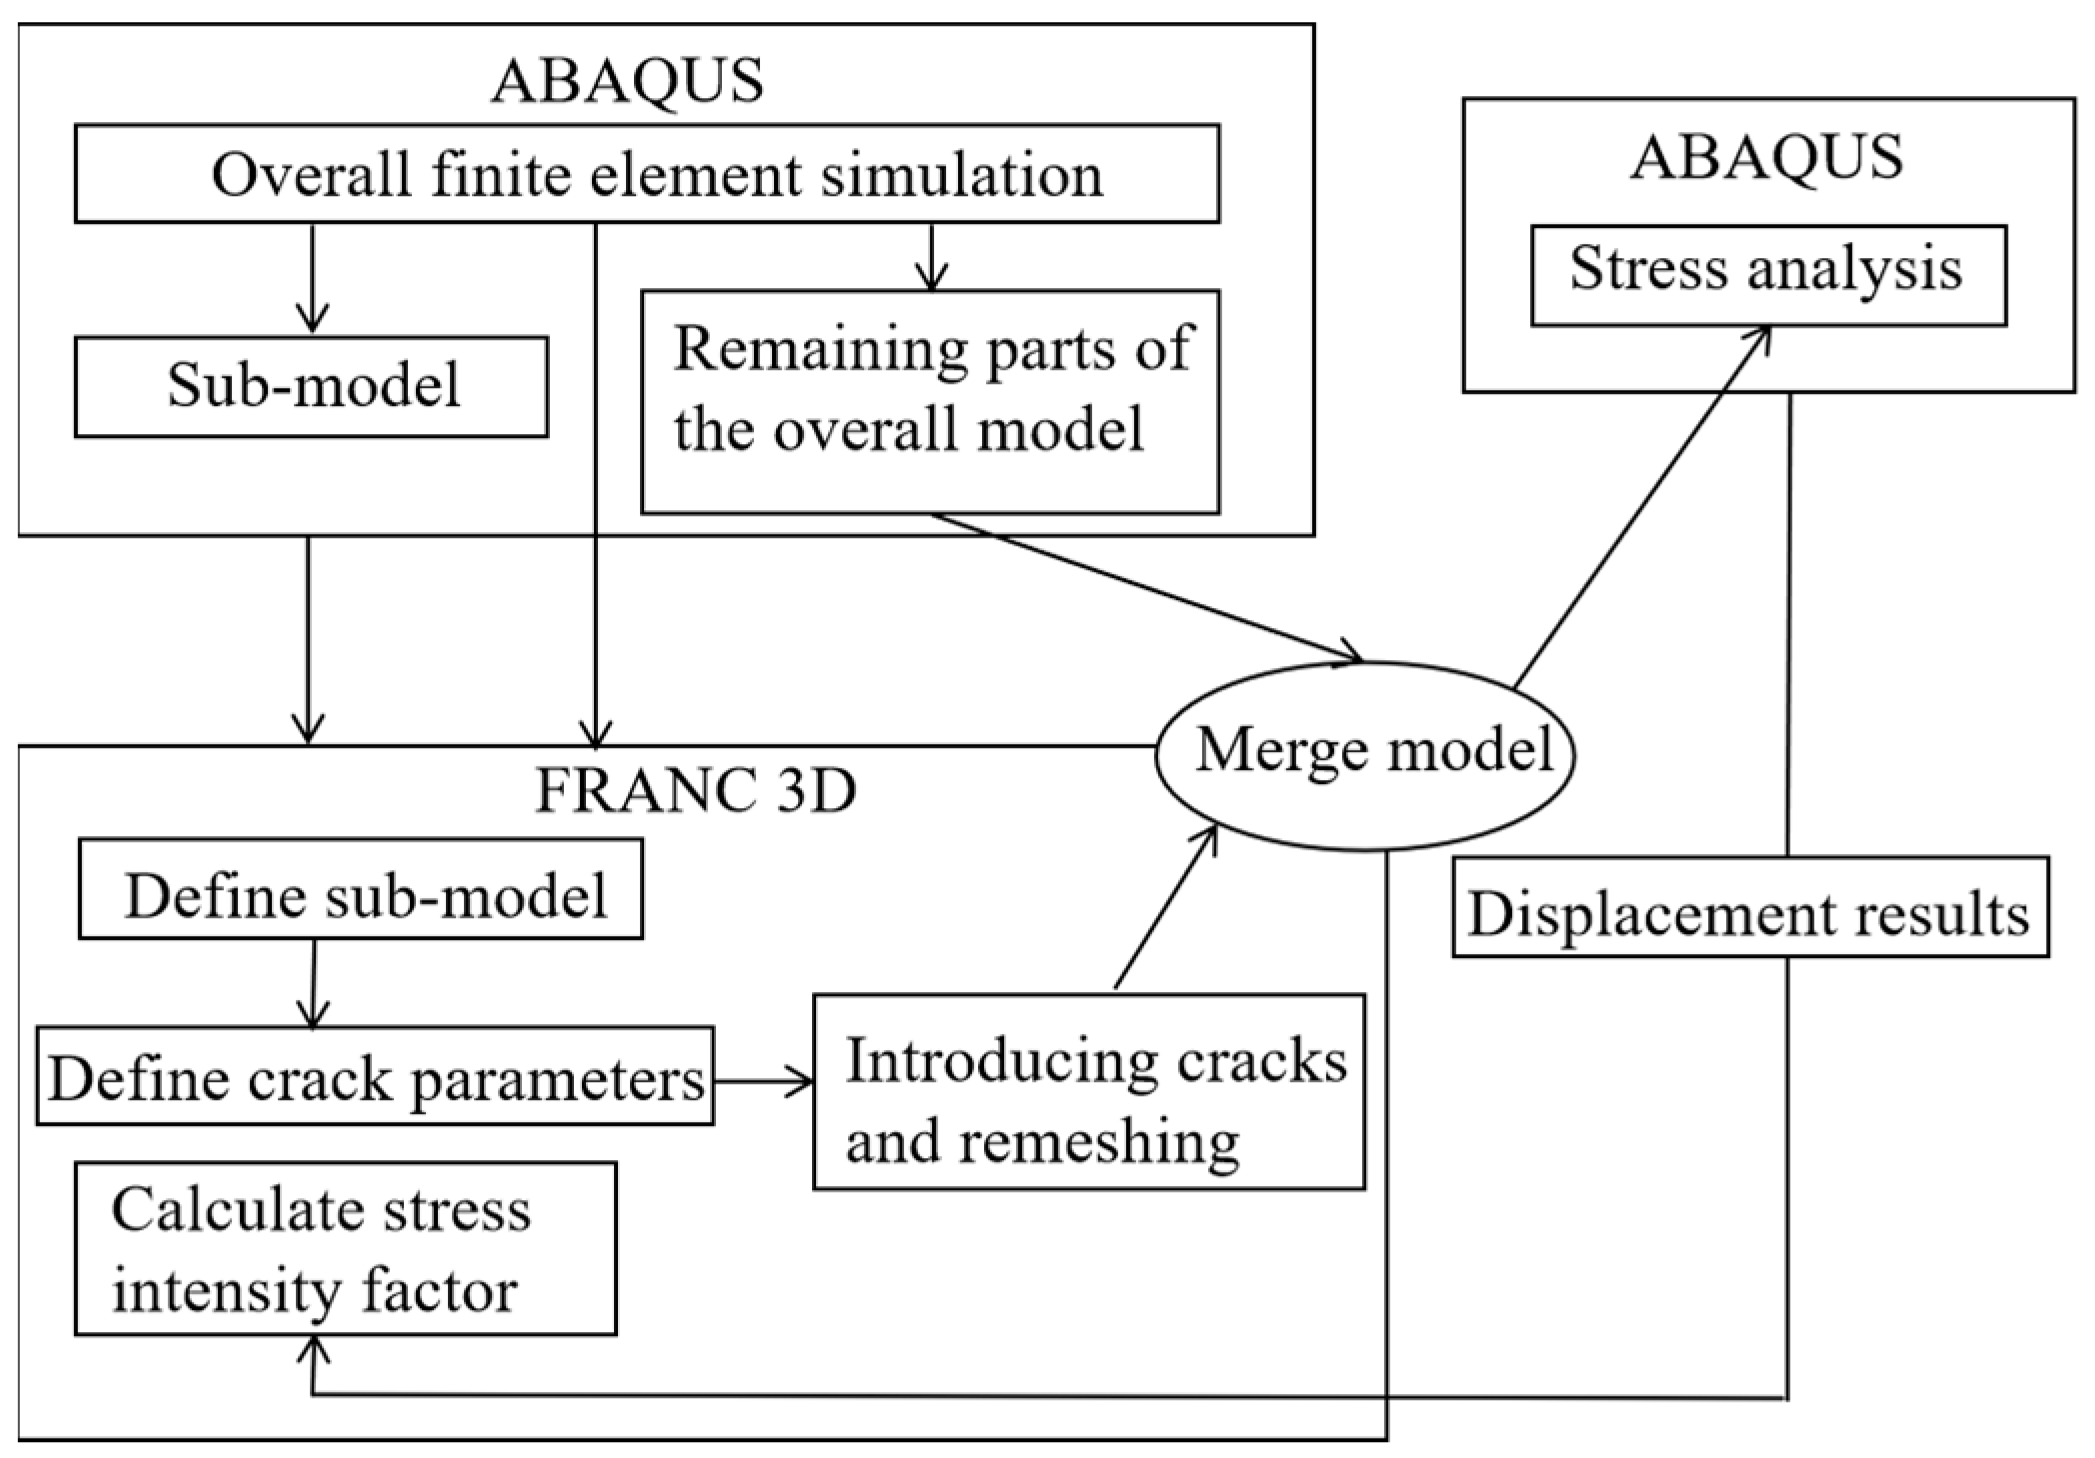
4. Stress Intensity Factor of Weld Crack

In fracture mechanics, the stress intensity factor at the crack tip is an important parameter for evaluating crack growth, which plays an important role in fatigue life prediction. In this paper, a crack containing a fracture mechanics model is established through ABAQUS-FRANC 3D to analyze the stress intensity factor.

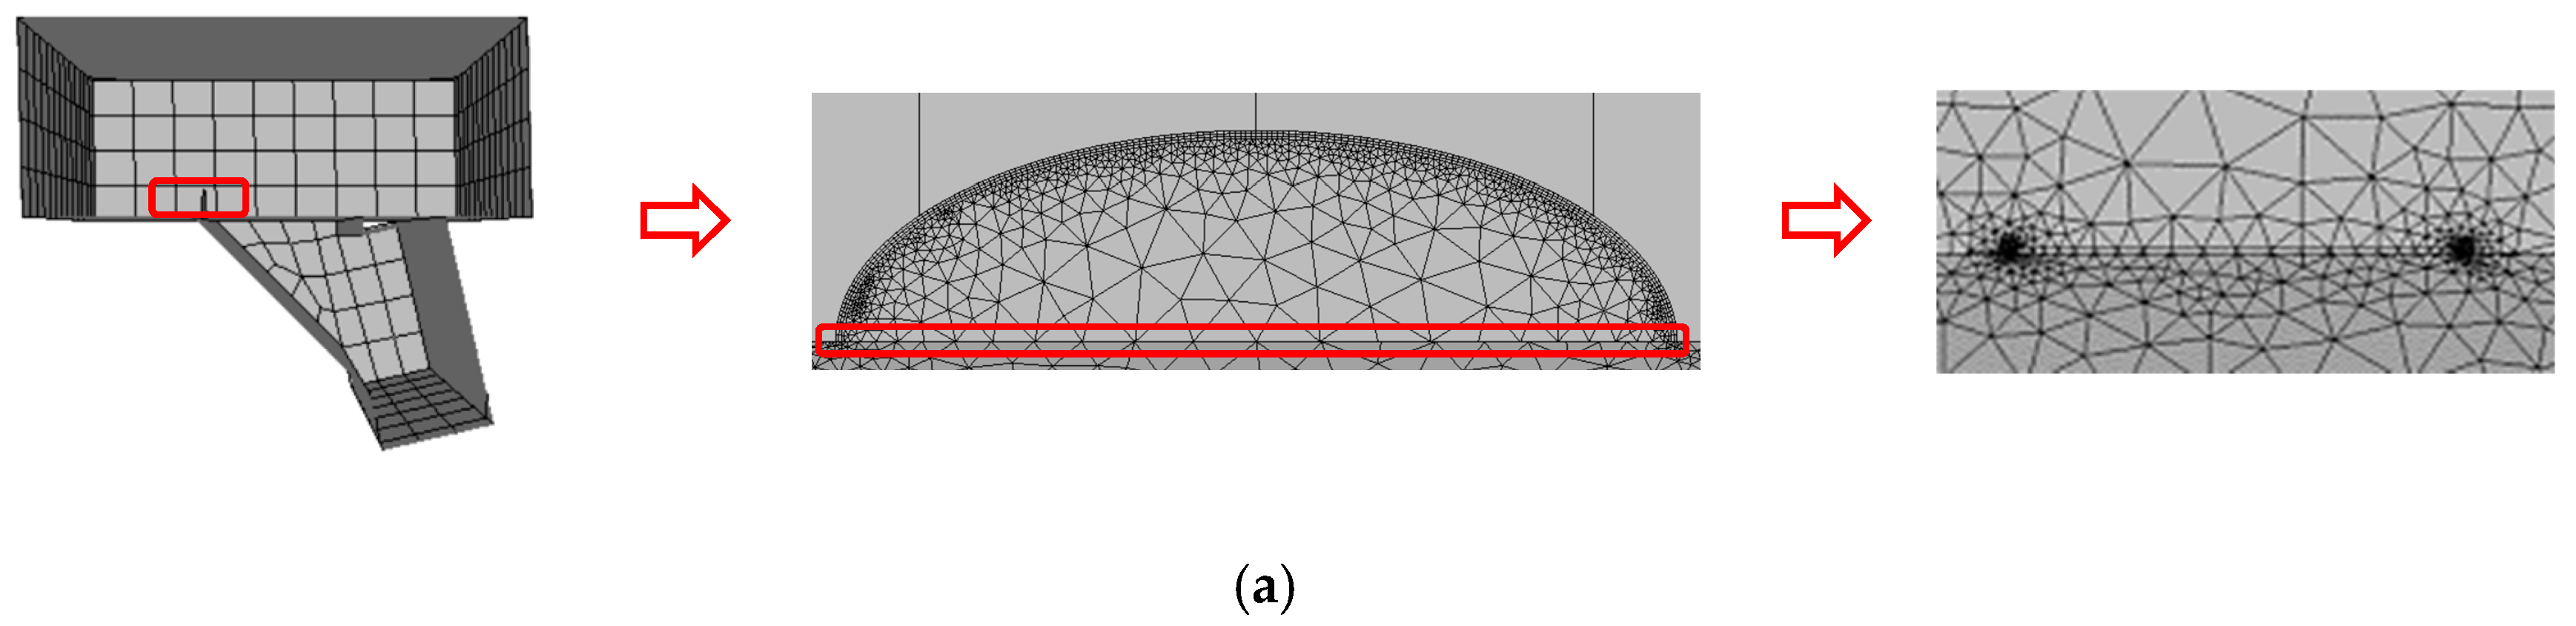
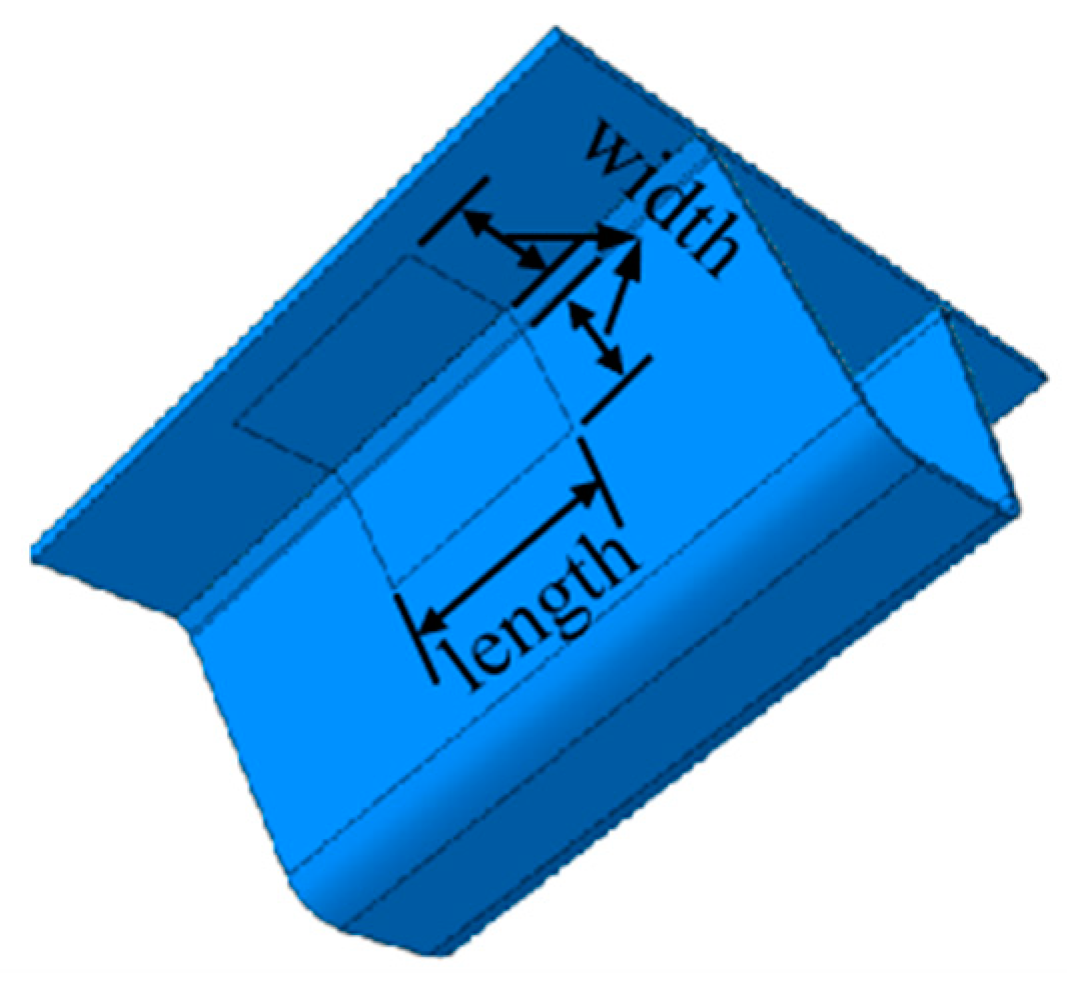
4.1. CFRP Reinforcement Model

The most unfavorable load loading positions for the weld details were obtained from Section 2.2. For each span of the orthotropic steel bridge deck, when the vehicle is in the middle of each span, cracks at the weld details of the U-rib and deck in the middle of the span will be more likely to propagate. Therefore, a reinforcement model was established based on the most dangerous load location. In order to simplify the calculation and ensure that the orthotropic steel bridge deck has significant local effects under vehicle loads, a local model with five U-ribs in the transverse direction and a single span in the longitudinal direction was selected for reinforcement analysis. And the vertical displacement of the diaphragm is constrained, the lateral displacement of the two sides of the deck is constrained, and the longitudinal displacement of the cross sections at both ends of the U-rib and the deck is constrained. The grid refinement is made for the focus area of the middle weld, as shown in Figure 11.
The key to the reinforcement of the fatigue cracks at the welding connection between the deck and the U-rib is to reduce stress concentration and improve the stress state of local cracks. This study adopts the method of pasting a CFRP sheet on the lower surface of the deck for the fatigue cracks at the welding details of the longitudinal ribs and the deck, as shown in Figure 12. The material characteristics of the CFRP sheet with a thickness of 0.167 mm are shown in Table 1. The CFRP and steel bridge surfaces are connected using a non-thickness cohesive force contact method, which does not require any presetting of the adhesive layer. When establishing the reinforcement model of the deck and the U-rib weld, only the steel bridge and CFRP composite material need to be established, and the bond-slip does not need to be considered.

4.2. Stress Intensity Factor Analysis

The International Welding Association and BS 7910 both proposed simplifying the initial defect crack into a half ellipse and suggested that the value of the short half-axis length in the crack depth direction be half of the value of the long half-axis length in the crack length direction. Currently, there is no relevant specification reference for the parameter setting of the initial crack. Therefore, in this paper, reference [9] takes a half ellipse with the initial crack size of the long half-axis a of 5 mm and the short half-axis b of 2.5 mm as the surface crack. The semi-elliptical crack is introduced into the weld toe and weld root of the sub-model for fracture mechanics analysis.
Firstly, a stress finite element analysis without cracks is conducted in ABAQUS, and the calculation results are imported into FRANC 3D. A sub-model is divided based on the most dangerous load location in FRANC 3D, and then a semi-elliptical crack is inserted in the corresponding position of the sub-model. FRANC 3D automatically regrids the local model with cracks, as shown in Figure 13. Then, FRANC 3D establishes a binding constraint relationship between the sub-model and the whole model of the inserted crack and combines them into a whole model. Stress analysis is carried out through ABAQUS, and FRANC 3D calls M-integral to calculate the stress intensity factor of the crack.

4.2.1. Stress Intensity Factor under Vehicle Only

When the vehicle is applied at the most unfavorable load position, the stress intensity factor of the weld toe crack at the midspan weld detail is shown in Figure 14. When the amplitude of the stress intensity factor is less than the threshold value of the stress intensity factor, the crack will not expand. Referring to BS 7608:1993, the threshold value of the stress intensity factor Kth = 63 MPa·mm1/2. Only under the action of vehicle load is the maximum value of KI at the weld toe 46 MPa·mm1/2, and the maximum value of KI at the weld root is 23 MPa·mm1/2, which is obviously less than the threshold value. Therefore, considering only the effect of the vehicle, theoretically, the crack at this location does not have the ability to propagate. It can be seen from the distribution of the stress intensity factor that the crack here is a mixed mode fatigue crack dominated by mode I.

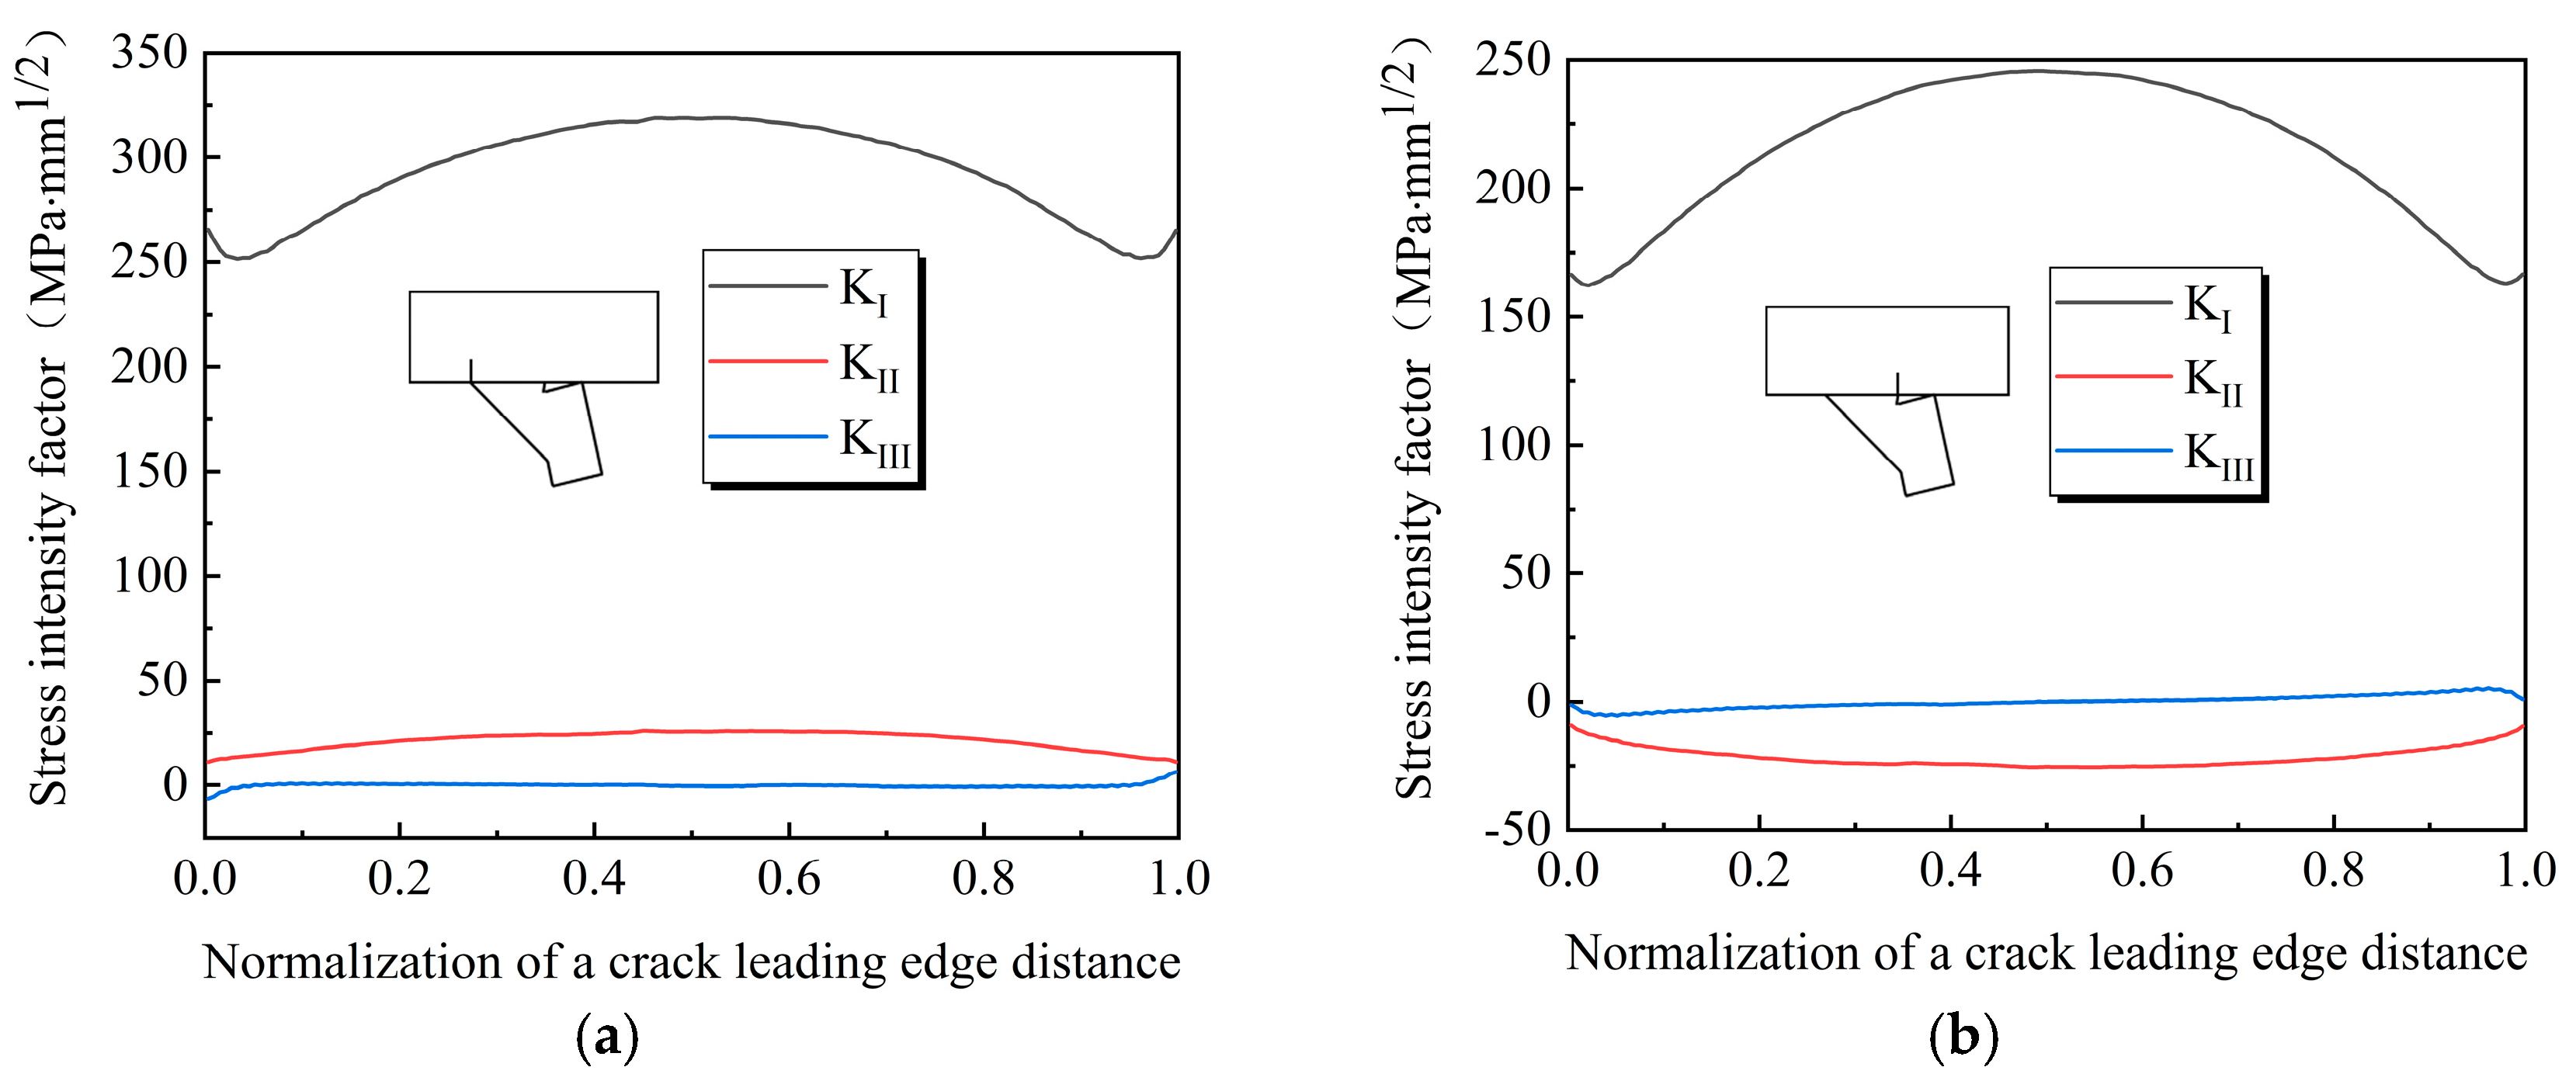
4.2.2. Stress Intensity Factor after Considering Residual Stress

According to Section 3.2, the transverse residual tensile stress generated at the connection between the deck and the U-rib has the greatest impact on fatigue cracks, which will accelerate crack development. This paper uses FRANC 3D to add lateral residual tensile stress to finite element analysis. Under the most unfavorable vehicle load and residual stress, the stress intensity factor at the midspan weld details is shown in Figure 15. The maximum value of the crack KI at the weld toe is 319 MPa·mm1/2 at the deepest point of the crack, which is about 6.9 times higher than that of the crack under vehicle loading only. The maximum value of the crack KI at the weld root is 246 MPa·mm1/2, which is about 10.7 times higher than that under vehicle loading only. Therefore, it can be found that the transverse residual stress has a significant impact on the fatigue crack at the weld joint. Therefore, when analyzing the crack at this location, the residual stress should not be ignored. Under the combined action of residual stress and vehicle load, the cracks at the welding details are also dominated by Type I composite cracks, and KI is much larger than KII and KIII.

4.2.3. Stress Intensity Factor after Reinforcement

In order to study the influence of the number of reinforcement layers on the effect, CFRP with a longitudinal length of 200 mm and a width of 100 mm was selected to reinforce the surface cracks at the weld toe. The schematic diagram of CFRP reinforcement is shown in Figure 16. Since the crack is mainly affected by KI, the reinforcement effect of CFRP on the crack is analyzed through the change of KI. Figure 17 shows the relationship between the stress intensity factor KI and the number of CFRP layers.
In Figure 17, it can be seen that the KI of the crack at the weld toe decreases with the increase of the number of CFRP layers, while the KI of the crack at the weld root does not change significantly with the increase of the number of CFRP layers. This is because CFRP is attached to the surface of the crack at the weld toe. When the crack surface is subjected to tensile stress, CFRP can limit the growth of the weld toe crack, while the crack at the weld root is not in contact with CFRP and is far away, thereby unable to play a reinforcing role. Therefore, the following text will only conduct reinforcement research on cracks at the weld toe.
Figure 18 shows the decreasing amplitude of stress intensity factor KI of cracks between adjacent layers of CFRP. The decreasing amplitude is large before the fifth layer and decreases after the fifth layer. From the first layer to the fifth layer, the decrease in KI was 24 MPa·mm1/2, 14 MPa·mm1/2, and 7 MPa·mm1/2, respectively. When CFRP increased to the seventh and ninth layers, the decrease in KI was 7 MPa·mm1/2 and 6 MPa·mm1/2, respectively. When the number of CFRP layers exceeds five, the reinforcement effect on cracks decreases.
Through analysis, it is found that selecting five layers for CFRP reinforcement is more reasonable, but the reinforcement effect of CFRP is also affected by size. Therefore, variables of different lengths and widths are set to analyze the reinforcement effect of different sizes. Figure 19 shows the relationship between the crack KI at the weld toe and different CFRP lengths while keeping the CFRP width unchanged at 100 mm. When the length exceeds 100 mm, the improvement in the reinforcement effect becomes weaker by increasing the CFRP length. Figure 20 shows the relationship between the crack KI at the weld toe and different CFRP widths while keeping the CFRP length unchanged at 200 mm. Compared with the CFRP length, different widths have a smaller impact on the reinforcement effect. When the width exceeds 50 mm, increasing the CFRP width weakens the improvement of the reinforcement effect. To sum up, five layers of CFRP with a length of 100 mm and a width of 50 mm are selected for reinforcement. Figure 21 shows the Stress intensity factor KI of the weld toe crack after reinforcement. KI in the figure is much larger than KII and KIII. Compared with the unreinforced ones, KI at the crack tip after reinforcement decreases by 35 MPa·mm1/2, and KI at the deepest crack decreases by 33 MPa·mm1/2.

5. Crack Growth

5.1. Crack Growth after Considering Residual Stress

After considering residual stress, growth analysis was conducted on a semi-elliptical crack with a major axis of 5 mm and a minor axis of 2.5 mm at the weld toe. According to IIW’s suggestion, the critical value of the crack is taken as half of the deck thickness. When the crack extends along the depth to half of the deck thickness, it indicates that the steel bridge has been damaged.
Figure 22 shows the change of the stress intensity factor value KI of the crack face when the weld toe crack starts from the initial depth of 2.5 mm and gradually expands to 7 mm depth. The distribution of KI gradually changes from small on both sides and large in the middle to large on both sides and small in the middle. The KI at both ends A and B of the crack always shows an increasing trend with increasing depth, while the KI at the middle C of the crack shows a first increasing and then decreasing trend with increasing depth. This is due to the difference in the distribution of transverse residual stress on the plate thickness. The residual tensile stress is high near the surface, and as the depth increases, the residual stress changes from tensile to compressive, slowing down the cracking of cracks.

5.2. Crack Growth after CFRP Reinforcement

By analyzing the number, length, and width of CFRP layers, a five-layer CFRP with a longitudinal length of 100 mm and a width of 50 mm was selected to reinforce the cracks at the weld toe, and fatigue crack growth was carried out. The relationship between the stress intensity factor KI on the crack surface at the weld toe after reinforcement and the growth depth is shown in Figure 23. The KI at the crack tips A and B increased from the initial 237 MPa·mm1/2 to 360 MPa·mm1/2, which is an increase of 51.9%. The KI at the crack tip C increased from the initial 287 MPa·mm1/2 to 364 MPa·mm1/2, which is an increase of 26.8%. Although the KI increment at crack tips A and B is greater than that at crack tip C, the KI at crack tip C is always greater than that at crack tips A and B during crack growth, indicating that CFRP has an inhibitory effect on the cracking of weld toe crack tips A and B.
Comparing the KI of pre-reinforcement and post-reinforcement weld toe cracks when they extend to half the plate thickness of 7 mm, as shown in Figure 24, it was found that the KI at crack tips A and B decreased by 98 MPa·mm1/2 after reinforcement, and the KI at the deepest crack point C decreased by 52 MPa·mm1/2. Figure 25 shows the relationship between the cyclic load and the growth of weld toe cracks before and after reinforcement. After 204,749 load cycles without reinforcement, the cracks expanded the crack expanded from 2.5 mm to 7 mm in depth. Expanded by 4.5 mm. The crack expanded in length from 5 mm to 9.2 mm. Expanded by 4.2 mm. After 292,658 load cycles after reinforcement, the depth of the crack expanded from the initial the depth of the crack expanded from the initial 2.5 mm to 7 mm. Expanded by 4.5 mm. The length of the crack expanded from 5 mm to 8.1 mm. Expanded by 3.1 mm. Compared with before reinforcement, the number of load cycles after reinforcement increased by 43%, and the extension of crack length decreased by 26%.

6. Conclusions

In this paper, CFRP is used to reinforce the fatigue cracks at the weld of the steel bridge deck and U-rib, and the influence of residual stress is considered in the study of reinforcement performance. The variation of the stress intensity factor of the fatigue crack at the weld of the top plate and the U-rib under the combined load of the vehicle, vehicle-residual stress, and the combined load after CFRP reinforcement is analyzed. The relationship between the crack stress intensity factor and the crack propagation depth under the combined load of vehicle-residual stress and the combined load after CFRP reinforcement is analyzed. The relationship between the crack propagation amount and the number of load cycles before and after reinforcement is compared. The following conclusions can be drawn:
(1)
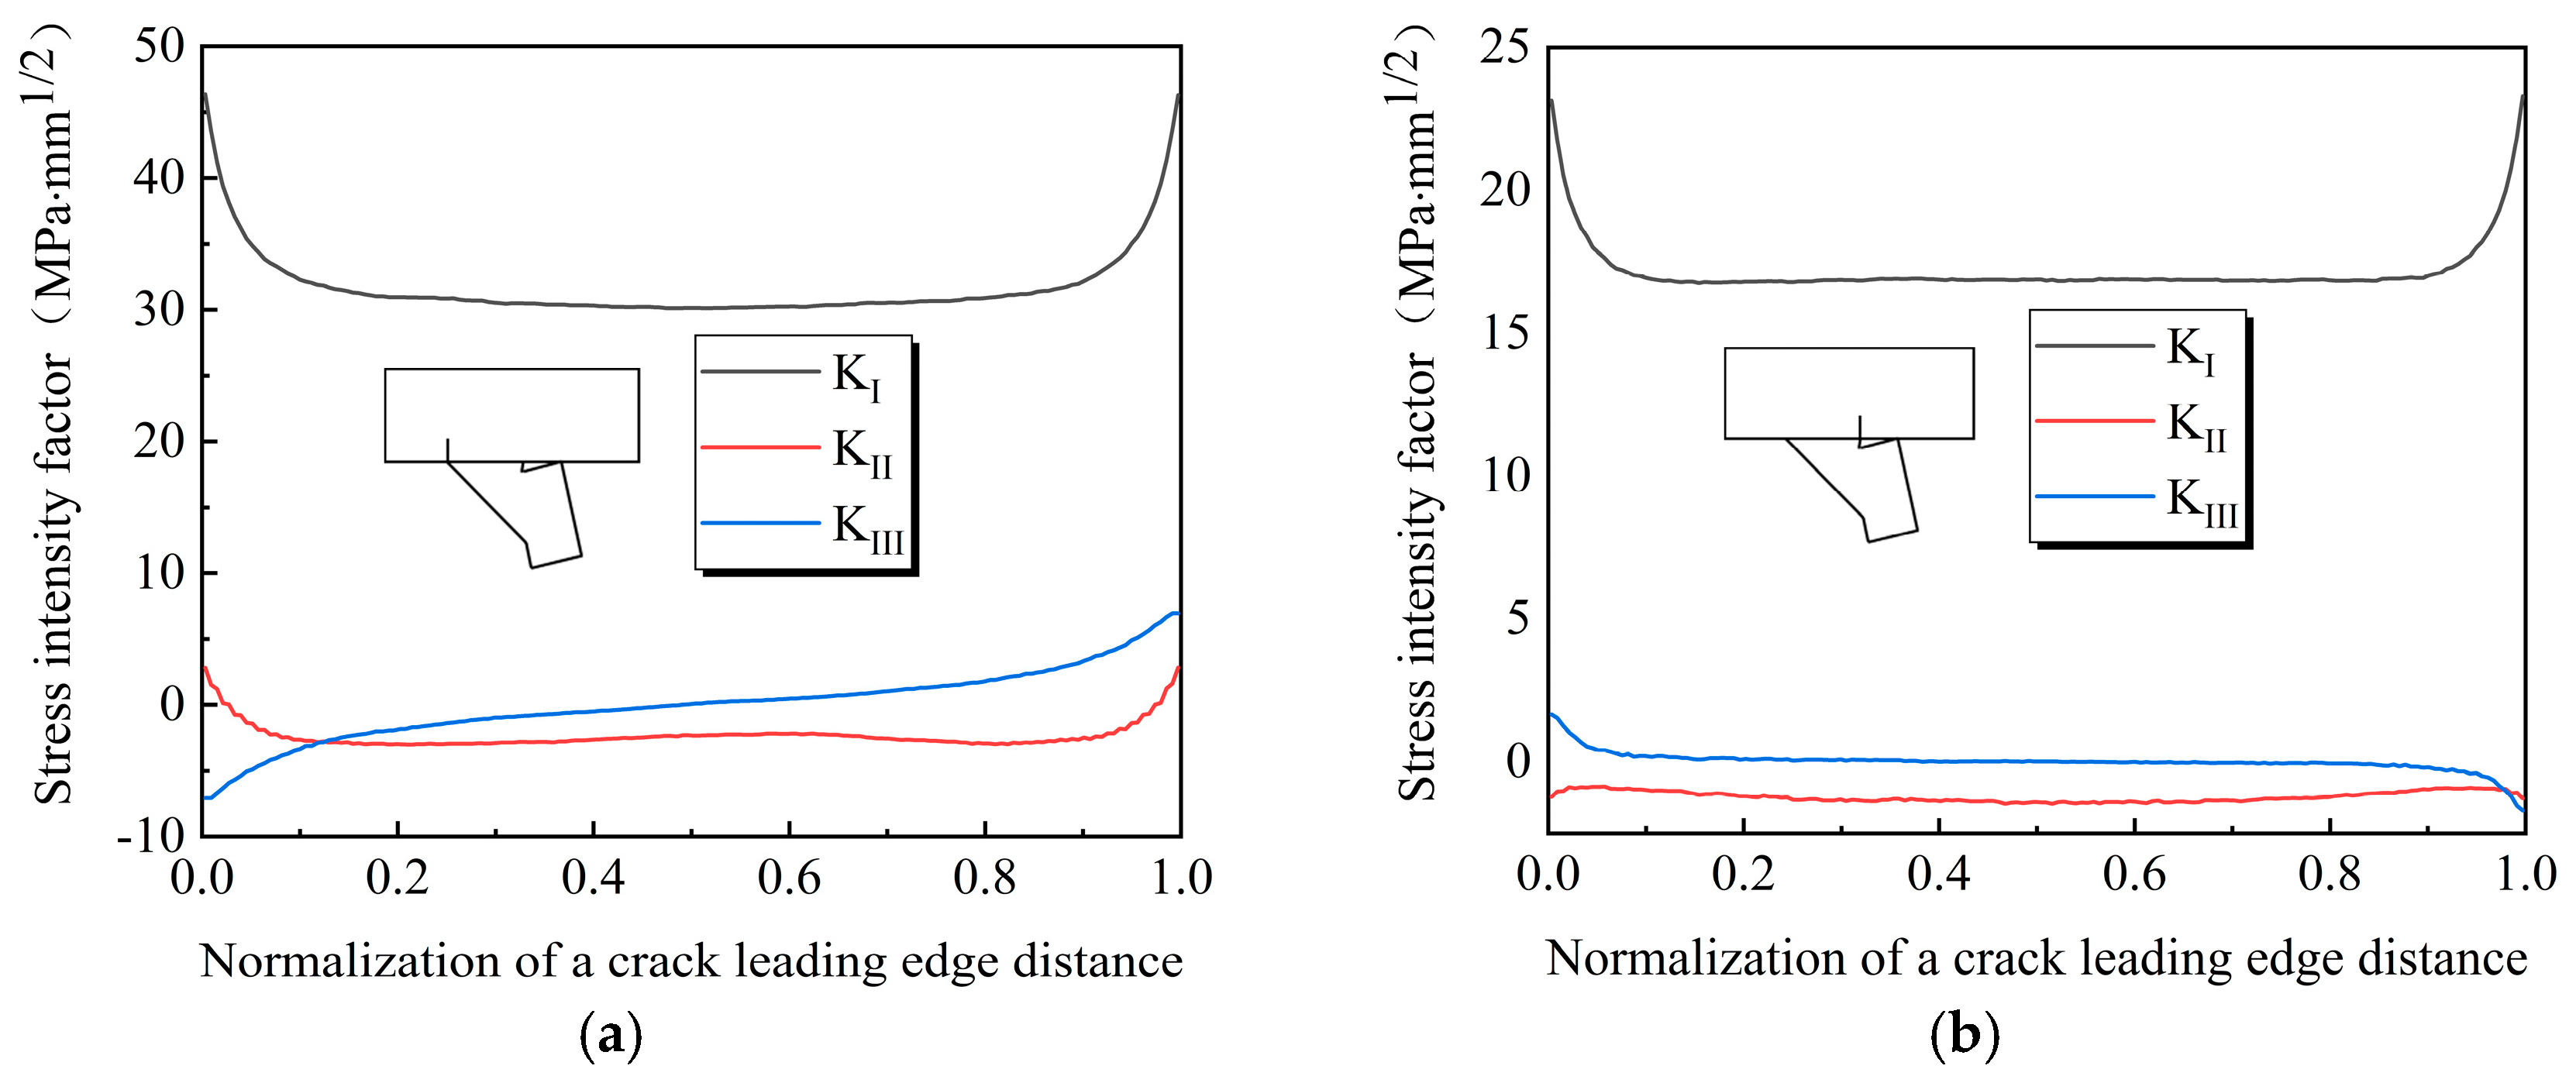
The amplitude of the stress intensity factor of the crack at the weld toe and weld root is less than the threshold value of the stress intensity factor when the vehicle only acts, and the crack will not expand. The initial crack at the welding connection between the deck and the U-rib under the combined load of the vehicle only, considering residual stress, and CFRP reinforcement is a composite crack dominated by Type I. Compared with vehicle only, considering residual stress, the maximum KI value of cracks at the weld toe increased by 6.9 times, and the maximum KI value of cracks at the weld root increased by 10.7 times.
(2)
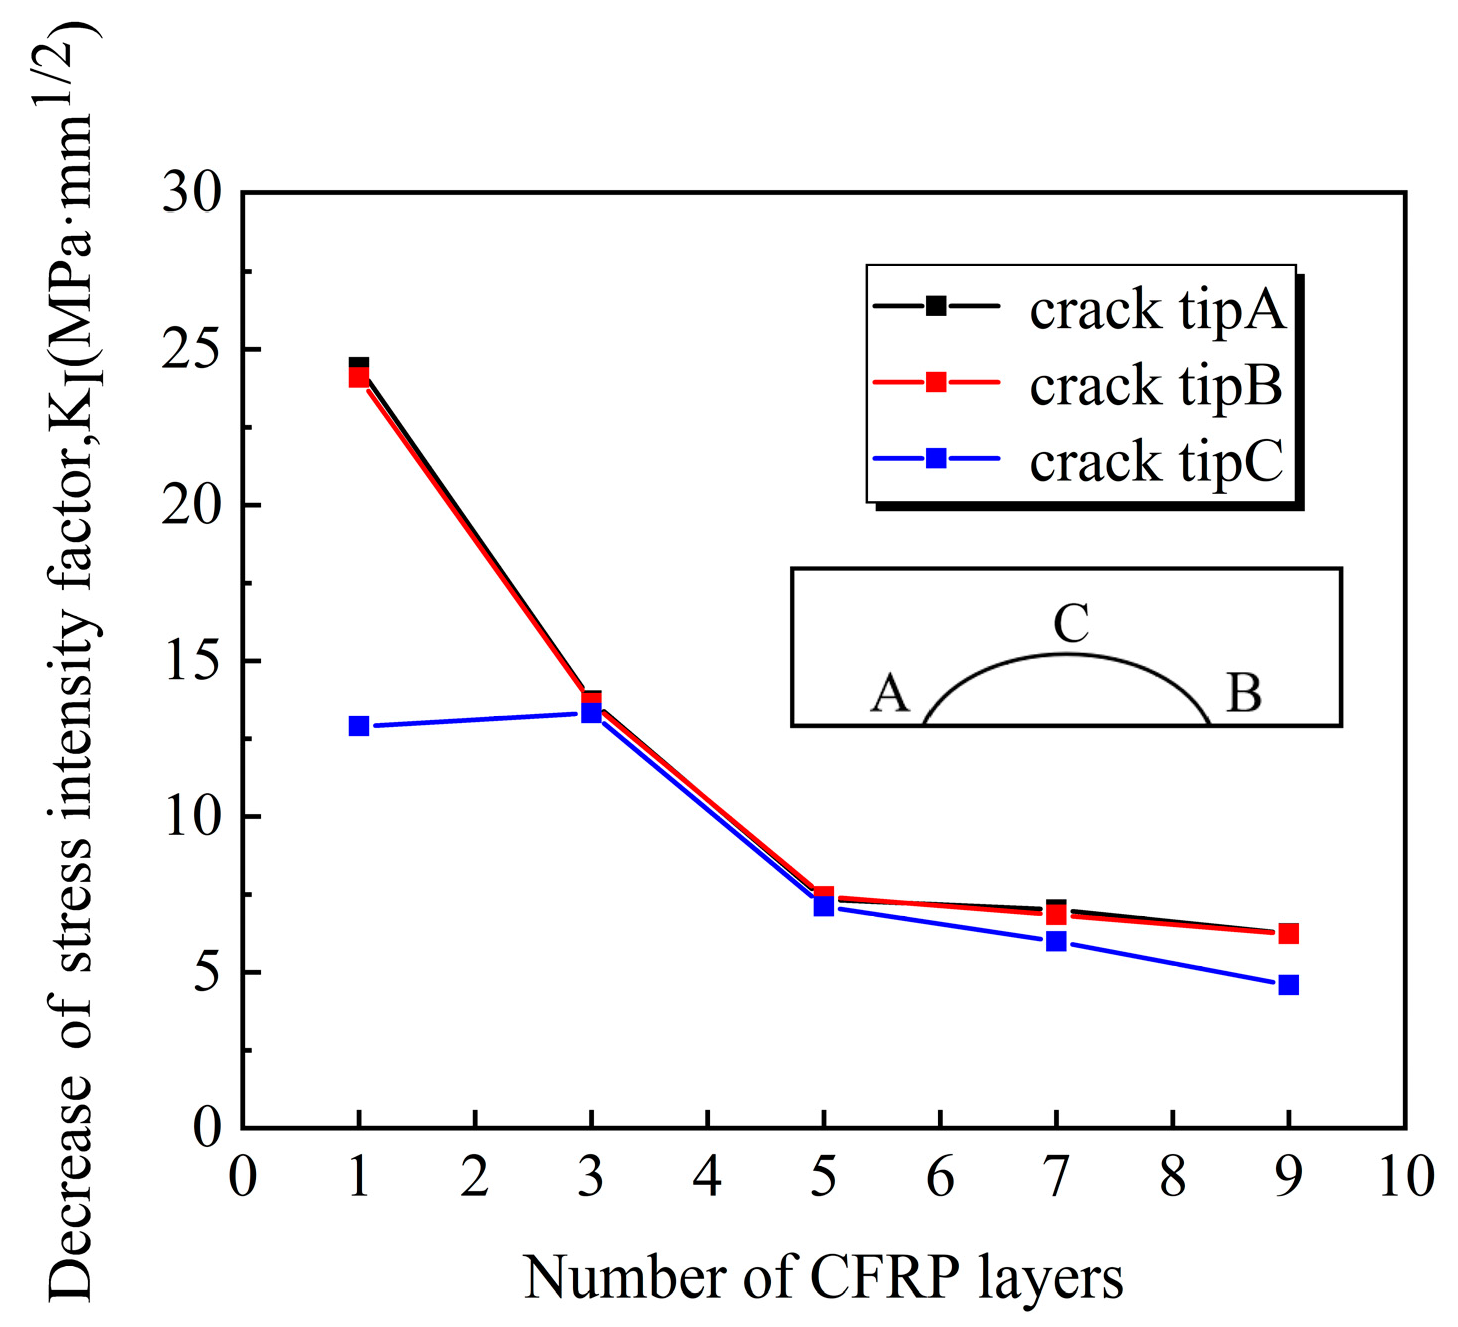
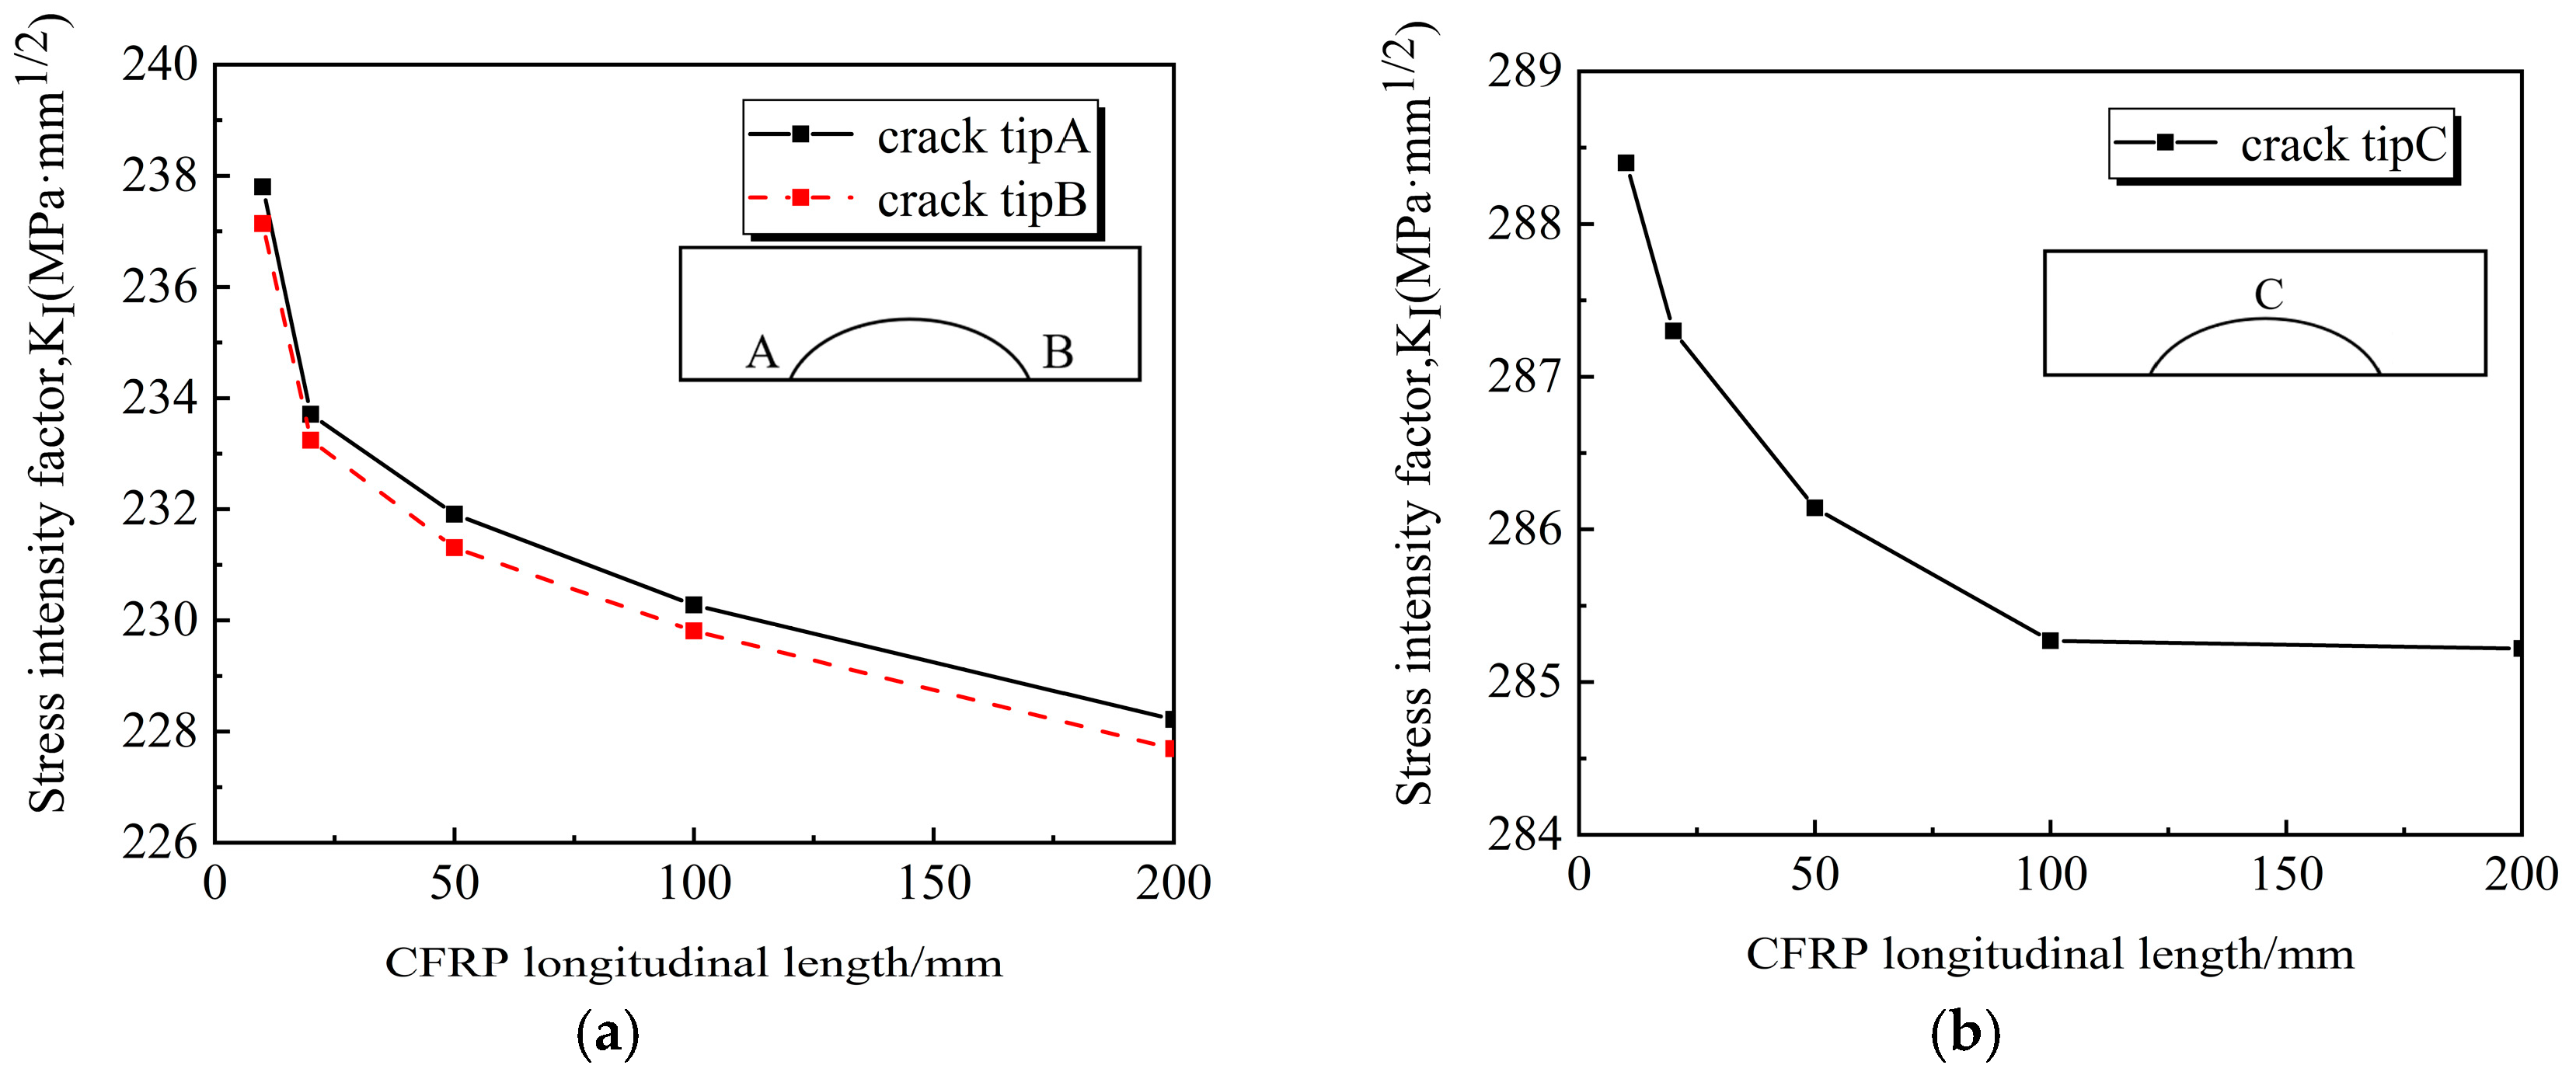
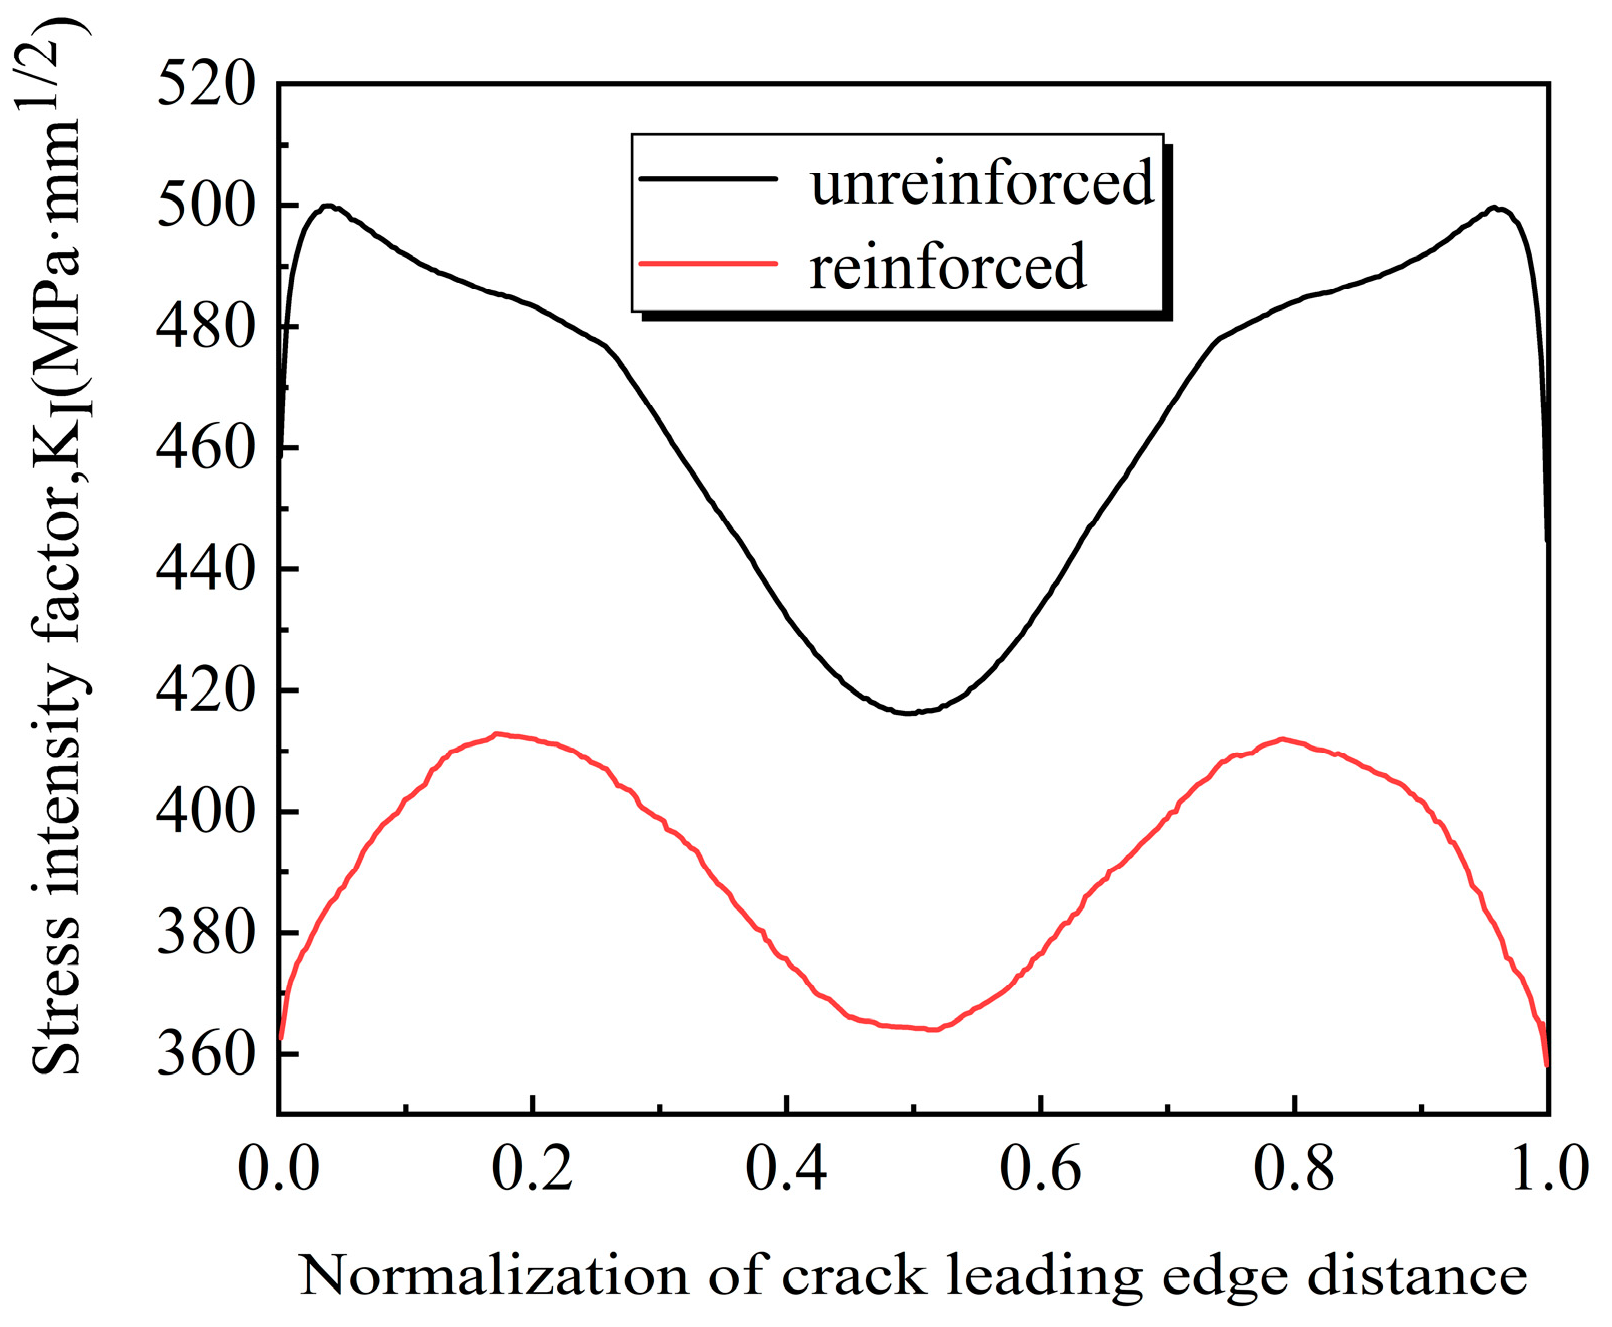
The reinforcement method of pasting CFRP on the lower side has a reinforcement effect on cracks at the weld toe but no reinforcement effect on cracks at the weld root. The reinforcement effect of weld toe cracks increases with the increase of the number, length, and width of CFRP layers but decreases after exceeding a certain value. Compared with the unreinforced condition, after CFRP reinforcement, the KI at the initial crack tips A and B at the weld toe decreased by 35 MPa·mm1/2, and the KI at the deepest crack point C decreased by 33 MPa·mm1/2.
(3)
When the crack at the weld toe was extended, it was found that after reinforcement, when the crack at the weld toe extended to half of the plate thickness by 7 mm, the KI at crack tips A and B decreased by 98 MPa·mm1/2 compared to unreinforced ones, and the KI at the deepest crack C decreased by 52 MPa·mm1/2. The number of load cycles increased by 43%, and the extension of the crack length decreased by 26%.

Author Contributions

Conceptualization, Y.H. and L.M.; review and editing, L.M.; performance of the finite element simulations and original draft, Y.H.; All authors have read and agreed to the published version of the manuscript.

Funding

The authors are grateful for the funding support from the Graduate Research Innovation Program (KYCX21_3036), the Natural Science Foundation of Jiangsu Province, China (Grant BK20190945), and the National Natural Science Foundation of China (Grant 51608343).

Institutional Review Board Statement

Not applicable.

Informed Consent Statement

Not applicable.

Data Availability Statement

The analysis data used to support the findings of this study are included within the article.

Conflicts of Interest

The authors declare no conflict of interest.

References

  1. Zhang, Q.H.; Bu, Y.Z.; Li, Q. Review on fatigue problems of orthotropic steel bridge deck. China J. Highw. Transp. 2017, 30, 14–39. [Google Scholar]
  2. Zhang, Q.H.; Cui, C.; Bu, Y.Z.; Li, Q.; Xia, S. State-of-the-art review of fatigue of steel bridge in 2019. J. Civ. Environ. Eng. 2020, 42, 147–158. [Google Scholar]
  3. Cui, C.; Bu, Y.Z.; Li, J.; Zhang, Q.H. Distribution characteristics of welding residual stress at U deck-to-rib connection detail of steel box girder. J. Southwest Jiaotong Univ. 2018, 53, 260–265. [Google Scholar]
  4. van den Berg, N.; Xin, H.; Veljkovic, M. Effects of residual stresses on fatigue crack propagation of an orthotropic steel bridge deck. Mater. Des. 2021, 198, 109294. [Google Scholar] [CrossRef]
  5. Kainuma, S.; Yang, M.; Jeong, Y.-S.; Inokuchi, S.; Kawabata, A.; Uchida, D. Fatigue behavior investigation and stress analysis for rib-to-deck welded joints in orthotropic steel decks. Int. J. Steel Struct. 2018, 18, 512–527. [Google Scholar] [CrossRef]
  6. Cheng, B.; Ye, X.H.; Cao, X.E.; Dave, M.D.; Cao, Y.S. Experimental study on fatigue failure of rib-to-deck welded connections in orthotropic steel bridge decks. Int. J. Fatigue 2017, 103, 157–167. [Google Scholar] [CrossRef]
  7. Fisher, J.; Barsom, J. Evaluation of cracking in the rib-to-deck welds of the Bronx–Whitestone Bridge. J. Bridge Eng. 2016, 21, 04015065. [Google Scholar] [CrossRef]
  8. Liu, Y.M.; Zhang, Q.H.; Cui, C.; Bu, Y.Z. Numerical simulation method for 3D fatigue crack propagation of orthotropic steel bridge deck. China J. Highw. Transp. 2016, 29, 89–95. [Google Scholar]
  9. Wang, C.S.; Zhai, M.S.; Tang, Y.M.; Chen, W.Z.; Qu, T.Y. Numerical fracture mechanical simulation of fatigue crack coupled propagation mechanism for steel bridge deck. China J. Highw. Transp. 2017, 30, 82–95. [Google Scholar]
  10. Chen, T.; Xia, Z.C.; Li, L.Z.; Zhang, N.X. Research on the fatigue life of steel plates with inclined cracks repaired with single-sided CFRP. J. Steel Constr. 2018, 35, 238–245. [Google Scholar]
  11. Yashar, D.; Dilum, F.; Ardalan, H.; Elyas, G. Behavior of cracked steel plates strengthened with adhesively bonded CFRP laminates under fatigue Loading: Experimental and analytical study. J. Compos. Struct. 2021, 266, 113816. [Google Scholar]
  12. Kamruzzaman, M.; Jumaat, M.Z.; Ramli, S.N.H.; Saiful, I. A Review on Strengthening Steel Beams Using FRP under Fatigue. Sci. World J. 2014, 2014, 702537. [Google Scholar] [CrossRef] [PubMed]
  13. Yu, Q.; Chen, T.; Gu, X. State-of-the-art on Fatigue Behavior of Steel Structures Strengthened with Carbon Fiber Reinforced Polymer Materials. J. Struct. Eng. 2011, 27, 127–132. [Google Scholar]
  14. Kamruzzaman, M.; Jumaat, M.Z.; Sulong, N.H.R.; Narmashiri, K.; Ghaedi, K.; Hosen, A. Experimental investigation on fatigue behavior of wide-flange steel I-beams strengthened using different CFRP end cutting shapes. Int. J. Steel Struct. 2019, 19, 760–768. [Google Scholar] [CrossRef]
  15. Chataigner, S.; Whabeh, M.; Garcia, S.D.; Benzarti, K.; Birtel, V.; Fischer, M.; Sopena, L.; Boundouki, R.; Lehmann, F.; Martin, E. Fatigue strengthening of steel bridges with adhesively bonded CFRP laminates: Case study. J. Compos. Constr. 2020, 24, 05020002. [Google Scholar] [CrossRef]
  16. Zhang, N.; Yue, Q.R.; Yang, Y.X.; Hu, L.Q.; Peng, F.M. Research on the fatigue tests of steel structure member reinforced with CFRP. J. Ind. Constr. 2004, 34, 19–21. [Google Scholar]
  17. Li, C.X.; Ke, L.; Chen, Z.Y.; He, J.; Guo, L.C.; Jiao, Y. Fatigue behavior and CFRP reinforcement of diaphragm cutouts in orthotropic steel bridge decks. China J. Highw. Transp. 2021, 34, 63–75. [Google Scholar]
  18. Song, Y.; Ding, Y.; Jiang, F.; Wang, Z.; Jia, H.J.; Chen, Z.Y.; Xu, C.; Ge, J.W. Fatigue Performance of CFRP-Strengthened Rib-to-Diaphragm Welded Details of Orthotropic Steel Decks: Experimental and Numerical Evaluation. Adv. Civ. Eng. 2022, 2022, 4730015. [Google Scholar] [CrossRef]
  19. Zhang, Y.H.; Guo, B.S.; Zhang, W.G.; Chen, F.H. Fatigue crack stress intensity factor of double-sided welded rib-to-deck joints in steel bridge deck. J. Civ. Environ. Eng. 2022, 44, 62–70. [Google Scholar]
  20. Zhao, Y.; Qin, Y.Y.; Li, Y.X. Study on FRANC3D for Fracture Expansion. West. J. Transp. Technol. 2011, 9, 69–72. [Google Scholar]
  21. Guo, S.L.; Lei, J.Q.; Huang, Z.W. Study on initial crack characteristics of inside weld in both-side welded U-rib. J. Cent. South Univ. (Sci. Technol.) 2021, 52, 3581–3594. [Google Scholar]
  22. Gadsden, S.A.; Al-Shabi, M.; Arasaratnam, I.; Habibi, S.R. Combined cubature kalman and smooth variable structure filtering: A robust nonlinear estimation strategy. Signal Process. 2014, 96, 290–299. [Google Scholar] [CrossRef]
  23. JTG/T D65-06-2015; Specifications for Design of Highway Concrete-Filled Steel Tubular Arch Bridges. Industry Standard of the People’s Republic of China: Beijing, China, 2015.
  24. Shigenobu, K.; Young-Soo, J.; Muye, Y.; Susumu, I. Welding residual stress in roots between deck plate and U-rib in orthotropic steel decks. J. Meas. 2016, 92, 475–482. [Google Scholar]
  25. Van, P.E.; Nagy, W.; Schotte, K.; Abdin, Z.; Hans, D.B. Determination of Residual Welding Stresses in a Steel Bridge Component by Finite Element Modeling of the Incremental Hole-Drilling Method. Appl. Sci. 2019, 9, 536. [Google Scholar]
  26. Masubuchi, K. Analysis of Welded Structures: Residual Stresses, Distortion, and Their Consequences; Elsevier: Amsterdam, The Netherlands, 2013; Volume 33. [Google Scholar]
  27. Cui, C.; Bu, Y.; Bao, Y.; Zhang, Q.; Ye, Z. Strain energy-based fatigue life evaluation of deck-to-rib welded joints in OSD considering combined effects of stochastic traffic load and welded residual stress. J. Bridge Eng. 2018, 23, 04017127. [Google Scholar] [CrossRef]
  28. Jiang, F.; Fu, Z.Q.; Ji, B.H.; Wan, L. Fatigue life evaluation of deck to U-rib welds in orthotropic steel deck integrating weldment size effects on welding residual stress. Eng. Fail. Anal. 2021, 124, 105359. [Google Scholar] [CrossRef]
  29. Zhao, Q.; Wu, C. Numerical analysis of welding residual stress of U-rib stiffened plate. J. Eng. Mech. 2012, 29, 262–268. [Google Scholar]
  30. Gu, Y. Research on Welding Residual Stresses and Distortions in Steel Bridge Decks Stiffened with U-Shaped Ribs. Ph.D. Thesis, Southwest Jiaotong University, Chengdu, China, 2016. [Google Scholar]
Figure 1. FRANC 3D–ABAQUS interaction flowchart.
Applsci 13 10185 g001
Figure 2. Finite element model. The blue color in the image represents the model, the light blue color in the middle represents the grid refinement area, and the orange color represents the boundary conditions.
Applsci 13 10185 g002
Figure 3. Loading conditions: (a) fatigue load calculation model III; (b) transverse loading condition (The red circle indicates the crack location to be analyzed); (c) longitudinal loading condition.
Applsci 13 10185 g003
Figure 4. Transverse stress history curves: (a) weld toe; (b) weld root.
Applsci 13 10185 g004
Figure 5. Welding details: (a) weld dimensions (unit: mm); (b) weld finite element model. The black dashed box represents the enlarged area, the red dashed box represents the boundary area, and the blue box represents the display of boundary conditions in software ABAQUS.
Applsci 13 10185 g005
Figure 6. Welding pool.
Applsci 13 10185 g006
Figure 7. Horizontal residual stress cloud map.
Applsci 13 10185 g007
Figure 8. Transverse residual stress along the weld seam. (a) Weld toe; (b) weld root.
Applsci 13 10185 g008
Figure 9. Verification of welding residual stress.
Applsci 13 10185 g009
Figure 10. Transverse residual stress along the thickness of the weld toe and weld root. (a) Weld toe; (b) weld root.
Applsci 13 10185 g010
Figure 11. CFRP reinforcement model.
Applsci 13 10185 g011
Figure 12. CFRP layout.
Applsci 13 10185 g012
Figure 13. Cracks of sub-model in FRANC 3D. (a) Weld toe; (b) weld root.
Applsci 13 10185 g013aApplsci 13 10185 g013b
Figure 14. Stress intensity factor of a crack under vehicle only. (a) Weld toe; (b) weld root.
Applsci 13 10185 g014
Figure 15. Stress intensity factor of a crack considering residual stress. (a) Weld toe; (b) weld root.
Applsci 13 10185 g015
Figure 16. The schematic diagram of CFRP reinforcement.
Applsci 13 10185 g016
Figure 17. The relationship between KI and the number of CFRP layers. (a) Weld toe; (b) weld root.
Applsci 13 10185 g017
Figure 18. The relationship between the decreasing amplitude of weld toe crack KI and the number of CFRP layers.
Applsci 13 10185 g018
Figure 19. Relationship between weld toe crack KI and CFRP length. (a) Crack tip A and B; (b) crack tip C.
Applsci 13 10185 g019
Figure 20. Relationship between weld toe crack KI and CFRP width. (a) Crack tip A and B; (b) crack tip C.
Applsci 13 10185 g020
Figure 21. Stress intensity factor of weld toe crack after reinforcement.
Applsci 13 10185 g021
Figure 22. Relationship between KI of the weld toe crack and growth depth (A, B and C represent the crack tip).
Applsci 13 10185 g022
Figure 23. Relationship between KI of weld toe crack and growth depth after reinforcement (A, B and C represent the crack tip).
Applsci 13 10185 g023
Figure 24. Comparison of KI before and after reinforcement when the weld toe crack extends to the plate thickness of 7 mm.
Applsci 13 10185 g024
Figure 25. Relationship between cyclic load and crack growth of weld toe before and after reinforcement. (a) Depth; (b) length.
Applsci 13 10185 g025
Table 1. Material characteristics of the CFRP sheet.
CFRPEx
MPa
Ey
MPa
Ez
MPa
Gxy
MPa
Gyz
MPa
Gzx
MPa
vxyvyzvzx
235,00010,00010,0005000250050000.280.280.35
Disclaimer/Publisher’s Note: The statements, opinions and data contained in all publications are solely those of the individual author(s) and contributor(s) and not of MDPI and/or the editor(s). MDPI and/or the editor(s) disclaim responsibility for any injury to people or property resulting from any ideas, methods, instructions or products referred to in the content.

