1. Introduction
Diabetes, a widespread disease affecting approximately 537 million individuals, is projected to rise to 783 million by 2045, according to research by the International Diabetes Federation (IDF) [
1]. Diabetic foot ulcer (DFU) is a prevalent complication among individuals with diabetes mellitus. Preventing and effectively treating diabetic foot ulcers is a challenging task due to their high recurrence rate. The presence of a DFU has been shown to significantly impact health-related quality of life, resulting in decreased physical function and mobility [
2]. This condition increases the risk of lower limb amputations in individuals with diabetes. When treating diabetic foot ulcers, promptness and assertiveness can make a significant difference in slowing the wound’s progression and preventing the need for amputation [
3].
Figure 1 demonstrate the rapid progression of a DFU over ten days.
Patients with diabetic foot ulcers (DFUs) and uncontrolled diabetes often experience a significant [
5] decrease in their quality of life. This is closely linked to frequent hospitalizations and a notable increase in treatment costs, particularly when the DFU fails to heal or recurs. In addition to the crucial need for early detection interventions, the integration of technology offers a promising avenue for enhancing the accuracy of results and simplifying examination procedures. By exploring technological solutions, we can potentially achieve more accurate diagnoses and streamline the overall assessment process. In Mauritius, the diabetic population currently stands at 22.6%, and this figure is projected to increase to 26.6% by the year 2045 [
1]. Furthermore, in 2021, the rate of pre-diabetic individuals reached 15.9% [
6], adding to the existing 22.6% prevalence. According to the Foot Care Clinic of APSA International, located in Mauritius, approximately 500 individuals undergo amputations each year as a result of type 2 diabetes, with an estimated 88% of these cases being preventable [
7]. Annually, an estimated 67% of amputations in the United States and 90% of amputations in the United Kingdom are attributed to diabetes [
8].
In healthcare, machine learning (ML) applications are predominantly employed to analyze extensive datasets, helping doctors and other medical professionals in making informed decisions. This technology proves invaluable in identifying anomalies, patterns, and trends, thus reducing the potential for human error and enhancing diagnostic accuracy. Research has shown that AI can accurately diagnose conditions such as retinal disorders [
9], diabetic retinopathy [
10], breast cancer [
11], and skin cancer [
12] through digital images. Furthermore, Brown et al. [
13] showed that a deep learning classification algorithm on images of retinopathy had comparable or better accuracy than clinical experts.
When addressing the prevention and treatment of diabetic foot ulcers (DFUs), the adoption of a multidisciplinary approach becomes crucial [
14]. In their study, Netten et al. [
15] investigated the reliability of utilizing mobile images for remote DFU assessment. Unfortunately, their experiment did not yield conclusive results, leading them to caution against relying solely on mobile images for making treatment decisions due to low validity and reliability. They recommended that clinicians gather as much additional information as possible when utilizing such images. In contrast, the system we propose maintains the importance of clinical expertise while leveraging the power of deep learning to provide more information for evaluating medical images. This additional information aims to enhance the clinician’s ability to design personalized treatment protocols for individual patients. By combining the strengths of deep learning and clinical expertise, our system seeks to bridge the gap and provide valuable support to clinicians in making informed decisions regarding DFU treatment.
Recognizing the immense potential of applying deep learning to digital images, a collaborative venture involving Manchester Metropolitan University, Lancashire Teaching Hospitals, and the Manchester University NHS Foundation Trust has established an international repository comprising approximately 11,000 diabetic foot ulcer (DFU) images. The primary objective of this repository is to facilitate the development of more advanced methods for DFU analysis. In our research, we utilize this dataset to train our algorithm and validate our model. The DFU challenge2021 organizers agreed to give access to this dataset [
16]. Additionally, we incorporated datasets obtained from Kaggle [
17,
18,
19] to further enhance our training process.
This research aims at evaluating the progress of the disease using images. When comparing two-element vectors, there exist various alternative similarity techniques that can be employed, such as the Euclidean distance, the Pearson correlation coefficient [
20], Spearman’s rank correlation coefficient, and others [
21]. The choice of technique for comparison depends on the specific objective we want to achieve. However, traditional similarity measurements may not be effective when dealing with complex datasets that exhibit diverse dimensions and characteristics and potentially require compression prior to processing. In such cases, Siamese Neural Networks (SNN) emerge as a promising solution. The architecture of Siamese Neural Networks was initially introduced in the early 1990s to address the challenge of signature verification as an image matching problem [
22].
Figure 2 provides an initial overview of the operation of Siamese Neural Networks (SNN).
The structure of a Siamese Neural Network (SNN) consists of two identical artificial neural networks, A and A’, as depicted in
Figure 2. These networks are designed to learn the underlying representations of input vectors. Operating as feedforward perceptrons, they utilize error back-propagation during the training process to optimize their performance. Working in parallel, the two networks generate outputs that are compared at the end using metrics such as cosine distance or Euclidean distance. The output of an SNN operation can be interpreted as the semantic similarity between the projected representations of the two input vectors.
The contrastive loss [
23] function is a type of distance-based loss function that updates the weights of a neural network in such a way that similar feature vectors have a minimal Euclidean distance. On the other hand, the distance is maximized between two dissimilar vectors. By employing the contrastive loss function, the neural network is encouraged to effectively separate and discriminate between different classes or categories based on their feature representations.
More formally, we suppose that we have a pair of DFU images
) and a label Y that is equal to 0 if the samples are similar, and 1 otherwise. To extract a low-dimensional representation of each sample, we use a Neural Network which can be a CNN or Any ensemble model that encodes the input images
into an embedding space where
and
. The contrastive loss is defined as:
As mentioned in
Section 2, our review of the existing literature reveals a noticeable scarcity of research focused on the application of deep learning specifically for assessing the progression of diabetic foot ulcers (DFUs) over time. While several classification techniques have been investigated, there is a notable gap when it comes to considering the temporal dimension of DFU evaluation. This research aims to address this critical gap by exploring the potential of Siamese Neural Networks for tracking and evaluating the development of DFUs over time. By filling this research void, we aim to provide valuable insights into the effective utilization of deep learning in the longitudinal assessment of DFUs.
This research investigates the application of Siamese Neural Networks (SNN) for the longitudinal follow-up of patients with diabetic foot ulcers (DFUs) who have undergone a treatment protocol under the guidance of a clinician. The DFU-Helper Framework helps clinicians gain better insight into the progression of DFU diseases and take corrective measures. This article makes the following key contributions:
A novel Siamese Neural Network model was validated in terms of performance against other models in terms of performance metrics;
Introduction of a valuable tool for clinicians to validate the efficacy of treatment protocols used for DFUs by harnessing the similarity learning capabilities of the Siamese Neural Network.
Overall, this research contributes to the field by presenting a novel approach using Siamese Neural Networks for assessing and validating treatment protocols for DFUs. This has the potential to enhance the personalized management of DFU patients and improve their overall outcomes.
The subsequent sections of this paper are organized as follows:
Section 2 provides a comprehensive analysis of relevant previous works in the field. In
Section 3, we present a detailed description of our proposed architecture. This is followed by the presentation of our experimental results in
Section 4. Finally, we conclude the paper with a summary of our findings and suggestions for future research, which are presented in
Section 5.
2. Related Works
This section investigates primarily the application of Siamese Neural Networks (SNNs) in the context of utilizing medical images for longitudinal disease evaluation. As a secondary objective, we extend our focus on the use of SNNs within the medical domain with the aim of gaining insights into their architectural adaptations that are more suited to our specific research objectives.
Li et al. [
24] used a Siamese Neural Network to monitor and assess the severity and progression of medical imaging in two specific diseases: retinopathy of prematurity (ROP) in retinal photographs and osteoarthritis in knee radiographs. The technique employed measures the similarity between two images captured at different time points. As no severity ranking labels were available, the authors computed a median Euclidean distance from a set of known normal images. Their approach involved using a convolutional Siamese network with a ResNet-101 [
25] architecture that had been pre-trained on the ImageNet dataset. To accommodate the specific requirements of their algorithms for the retina and knee, the final fully connected layer of ResNet-101 was modified to output three or five nodes, respectively, from each sub-network.The implementation of Li et al. was conducted in Python, utilizing the Adam optimizer with a learning rate of 5 × 10
. During training and validation, a batch size of 16 was employed, and the model was saved based on the lowest validation loss for subsequent testing evaluation. The results obtained from their experiments indicate that the utilization of Siamese Neural Networks and Euclidean distance measurements enables the representation of disease severity on a more nuanced and continuous spectrum compared to traditional categorical disease classification systems.
In a recent study by AbdulRaheem et al. [
26], the authors propose the use of Siamese Neural Networks (SNNs) for the continuous evaluation of eye disease severity. Similar to the work of Li et al. [
24] mentioned earlier, they employ a twin-CNN architecture. The proposed system is specifically demonstrated in the domain of diabetic retinopathy. However, it is important to note that AbdulRaheem et al. utilize a Siamese Triplet network, which aims to determine the distance between image embeddings. For the sub-network implementation, ResNet-101, a convolutional neural network architecture, was used. They incorporate a triplet mining algorithm, where the data are provided as triplet image pairs comprising an anchor image, a positive image, and a negative image. Each image pair is passed through the pre-trained network, which learns the distributed embedding of the images based on their similarities and dissimilarities with respect to the anchor image. The Euclidean distance between the images is then computed from the final connected layer, representing the difference between the images. This distance serves as an abstraction of the severity score for the respective image.
In their study, Akbar et al. [
27] proposed the use of Siamese Convolutional Neural Networks (CNNs) for the assessment of the continuous spectrum of lung edema severity using chest radiographs. Unlike the previous works mentioned, they employed a pre-trained CNN architecture called DenseNet121 [
28] instead of ResNet-101 [
25]. The authors utilized the Euclidean distance as a measure of similarity between images. For the optimization process, the Adam optimizer was chosen for all models, with a learning rate of 2e-5. Model weights were saved at each epoch if the validation loss decreased. If the validation loss plateaued or did not improve for more than 10 epochs, early stopping was applied. The results showed that their model successfully assessed the severity of pulmonary edema from chest radiography. To label the dataset used in this research, two certified radiologists participated in the study. The authors investigated the performance of their model using four different loss functions: contrastive loss, mean square error (MSE) loss, Huber loss, and a combination of contrastive and MSE loss.
Fiaidhi et al. [
29] leverage the characteristics of SNNs needing small samples of data for training. They introduced a Siamese neural model that uses a triplet loss function that enables the gastroenterologist to inject anchor images that can correctly identify the ulcerative colitis severity classes. To monitor the severity over time, a triplet loss function is applied. Gastroenterologists inject anchor images that can correctly identify the ulcerative colitis severity by using the classes and using the Mayo Clinic Ulcerative Colitis Endoscopic Scoring scale.
During our research, we also explored non-deep-learning-based methods for assessing image similarity in the context of medical images. Hu et al. [
30] proposed a method that relies on feature extraction and analysis. They applied their method to rat brain histological images and compared the similarity estimates with expert evaluations to demonstrate its effectiveness. Their approach involved various computer vision techniques, such as color model conversion, image normalization, anti-noise filtering, contour detection, conversion, and feature analysis. The feature search process utilized an anchor image. Inonescu et al. [
31] conducted a study on image similarity using 54 video files of endocapsules labeled by gastroenterologists. They employed techniques based on color histogram and Local Binary Patterns (LBP) Histogram and calculated the difference between image pairs to determine similarity. A value close to 0 indicated higher similarity. These studies demonstrate alternative approaches to assessing image similarity in medical imaging, utilizing feature-based methods and computer vision techniques instead of deep learning-based approaches. Now, we move on to explore the use of SNNs in the medical domain applied to images.
These studies presented above show methodologies for evaluating image similarity in medical imaging, employing feature-based methods and computer vision techniques as alternatives to deep learning-based approaches. Now, we move our focus to investigating the application of Siamese Neural Networks (SNNs) in the medical domain, specifically in the medical field, using image analysis.
Ornob et al. [
32] introduced a Siamese few-shot learning model for early detection of COVID-19, aiming to mitigate the long-term effects of this dangerous disease. Their proposed architecture combined few-shot learning with an ensemble of pre-trained Convolutional Neural Networks, enabling the extraction of feature vectors from CT scan images for similarity learning. They implemented a Triplet Siamese Network for classification, utilizing six transfer-learning-based models (ResNetV2, DenseNet, SwinTransformer, MobileNetV2, EfficientNetB0, ResNeXt-101) as the backbone of the network to create an ensemble model. This ensemble model generated embeddings for each image in the input triplet, enhancing the accuracy of the classification. Mehboob et al. [
33] implemented a Siamese Neural Network with a VGG-16 backbone and CNN for multiclass classification of Alzheimer’s Disease. They utilized the network to classify different stages of the disease. Zeng et al. [
34] proposed a novel Siamese Convolutional Neural Network (CNN) architecture using InceptionV3 [
35] as the backbone. Their work focused on binary classification, and they employed the Adam optimizer for training. Vasconcellos et al. [
36] conducted research on the classification of heartbeats using 12-Lead ECG datasets. They developed a Siamese Neural Network based on CNN for this task.
Table 1 provides a summary of other related works in the medical field that have explored the use of Siamese Networks.
Table 1 displays additional research where a Siamese Neural Networks is employed. The purpose of this investigation was to explore architectures utilized in the medical domain and assess their suitability for our requirements.
After working on the related work section, It is worth noting that no relevant research has been found in the literature regarding the evaluation of diabetic foot ulcers (DFUs) over time using deep learning techniques. While studies have addressed classification and detection techniques for DFUs, none have been found to engage SNN. In terms of longitudinal use of SNN we have also come across very little research work. We can conclude that the investigation of DFU evaluation over time using deep learning remains largely unexplored.
3. Proposed Architecture
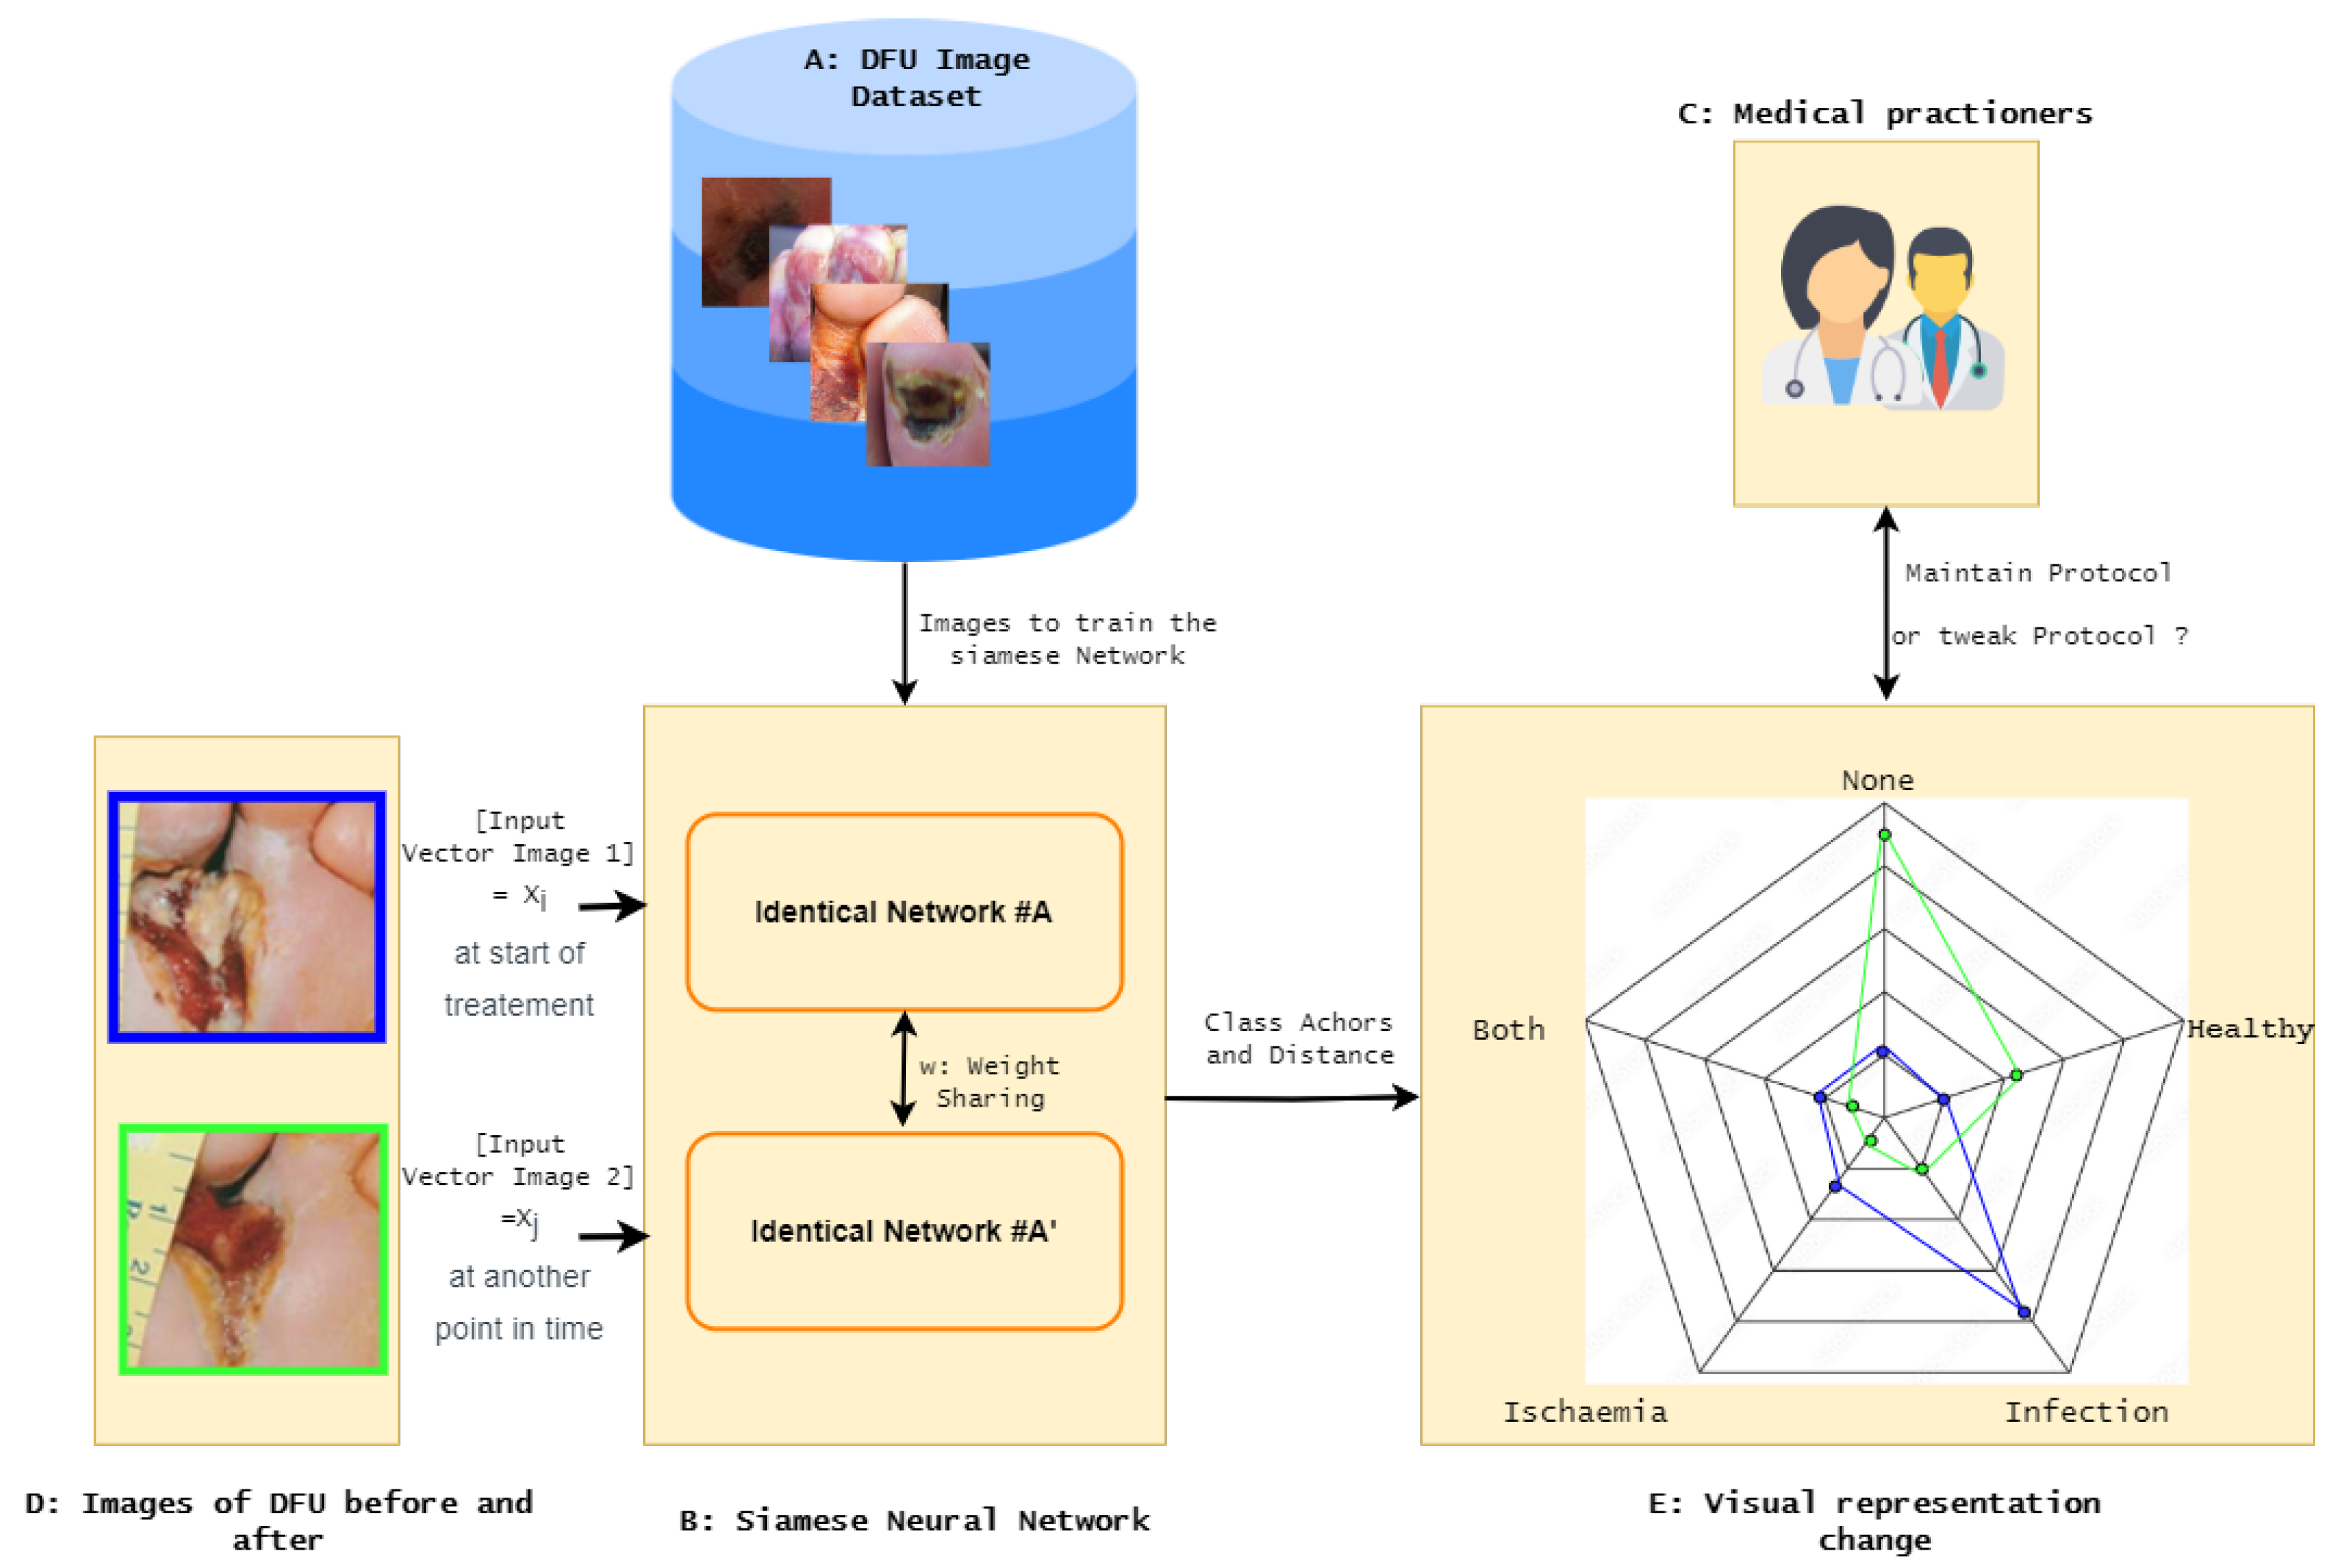
3.1. DFU-Helper Overall Framework
The overall framework, DFU-Helper, depicted in
Figure 3, illustrates the proposed approach for monitoring the treatment progress of a diabetic foot ulcer patient, as initiated by a medical practitioner.
The following gives an exhaustive description of the proposed DFU-Helper framework:
Obtain a representative dataset of diabetic foot ulcers (DFU) that provides a comprehensive description of different types of ulcers;
Train a Siamese Network using similarity learning on the dataset. This network will learn to distinguish between dissimilar images and group similar images together;
Test the SNN to validate its performance in terms of regrouping similar items closer and dissimilar items further. We plan to perform this step by testing it on a classification task and comparing it with known models;
Create anchor points for each significant class, including healthy, ischemia, infection, both, and none;
When a medical practitioner examines a patient for the first time, they capture an image of the wound, which is represented by the first image in
Figure 3. This image is marked with a blue border, indicating the pre-treatment stage. The practitioner then initiates an individualized treatment protocol;
During the subsequent visit, the doctor performs the standard evaluation procedure and captures another image of the wound. This new image is then fed into the system, along with the initial image, for further analysis and comparison;
The system generates a radar chart that plots the distances between the images and each of the anchor classes, as well as a table with the distances from the anchors;
In
Figure 3, we can observe that the blue line representing the initial image shows a closer similarity to the infection class. In the second image, the blue line is plotted as being more similar to the healthy class, indicating an improvement and a movement towards the normal class.
Having introduced the Siamese Neural Network that implements similarity learning, the subsequent section will delve into an explanation of what exactly similarity learning entails.
3.2. Similarity Learning
The main goal of the learning process is to adjust the parameters in order to minimize the distance between encoded features of similar input image pairs while simultaneously maximizing the distance between dissimilar image pairs. The choice of loss function for training depends on the image pairs, their associated labels, and the specific parameterized distance function being used.
Figure 4 provides an overview of the training process and feature vector extraction in the Siamese Neural Network (SNN). The anchor point for each class is computed as the average of the feature vectors belonging to that class. The sub-networks within our SNN consist of an ensemble of Convolutional Neural Network (CNN) backbones and Vision Image Transformers (ViT). Transformers have revolutionized natural language processing (NLP) by addressing the limitations of sequential data tasks previously handled by recurrent neural networks (RNNs). Transformers gained prominence through the influential paper "Attention Is All You Need", which leveraged self-attention mechanisms to capture contextual information in sentences [
43].
The loss function implemented in the Siamese network is not the same as the loss function in a traditional artificial neural network. In the proposed SNN, we choose to use the Large Margin Cotangent Loss, which we will explain in the next section.
3.3. Loss Function for Training the SNN
The loss function used during the training phase was the Large Margin Cotangent Loss (LMCoT) [
44]. The primary motivation behind LMCot is to address the limitation of the cosine function used in existing methods, such as ArcFace [
45]. The cosine function returns values between
, which limits its ability to accurately reflect the angle between vectors. In contrast, the cotangent function has an unrestricted range of values, making it more suitable for measuring angles.
The LMCot loss function is defined as follows:
where
L represents the LMCot loss,
N is the number of samples,
s is a scale parameter,
m is the margin,
is the angle between the weight and feature vector of the ground truth class, and
is the angle between the weight and feature vector of class
j.
To calculate the cotangent values, the LMCot loss function utilizes the -normalized feature vectors and weights. The loss function penalizes the difference between the cotangent of the ground truth angle and the cotangent of the angles for other classes. This encourages the model to optimize the decision boundary to improve classification accuracy.
In order to facilitate the comparison of a new DFU image, a reference point is essential. This reference point is referred to as the “class anchor”. The forthcoming section will explain the concept of class anchors and outline the methodology for their calculation.
3.4. Class Anchors
After training and validation of the SNN, the feature vectors of images belonging to each class are extracted and averaged, resulting in the generation of class anchors. During the testing phase, an input image is passed through one of the sub-networks of the SNN, which encodes it into a feature vector. In the lower-dimensional feature space, the feature vector of the test image is compared with the feature vectors of all the training samples using distance measures. This distance measure is utilized to plot a radar chart, providing a visual representation of the initial characteristics of the image. When a second image is inputted into the SNN, another plot is generated on the same radar chart, visually indicating the progression of the disease.
With the class anchors established, the subsequent step involves calculating the similarity between a new DFU image and the class anchors. The next section elaborates on this process.
Similarity Function between Test Image and Anchors
To assess similarity, both cosine distance and Euclidean distance are employed between the feature vector of an image and the class anchors, as depicted in
Figure 5. The cosine similarity function (
5) is utilized, and the calculation of distance includes both cosine distance (
4) and Euclidean distance (
6). These measures highlight the disparity between the feature vector of the test image and the feature vector of the anchor class.
Figure 6 gives a visual explanation of the cosine similarity and Euclidean distance. The cosine similarity represents the angle between two vectors, and the Euclidean distance represents the distance between two points in Euclidean space.
Now that the entire proposed process has been explained, it is imperative to dive into the rationale underlying the incorporation of class anchors within the framework.
3.5. Justification for Using Class Anchors
When utilizing the SNN for disease evolution assessment, the conventional representation of similarity between two images, as depicted in
Figure 2, does not suffice for our purpose. To illustrate this, we present a hypothetical scenario in
Figure 7,
Figure 8 and
Figure 9, where we compare two images, Image A and Image B, belonging to the same patient at different time points. In this context, direct image comparison using a similarity score alone does not necessarily provide insights into whether the situation is improving or deteriorating. Hence, we demonstrate the necessity of comparison with an anchor image to discern the progress or regression of the disease.
The DFU-Helper framework is a novel system that utilizes a Siamese Neural Network for implementing similarity learning. The SNN in DFU-Helper consists of subnetworks, which are ensembles of CNN and Vision transformers. The training of the SNN is performed using the LMCoT loss function, specifically designed for similarity learning. This framework represents a pioneering effort in the field of the application of deep learning for the longitudinal evaluation of DFU diseases over time.
4. Experiments and Results
In this section, we will outline the experiments conducted and the corresponding results. An integral part of the Artificial Neural Network pertains to the dataset’s quality. Hence, we begin with an introduction of the dataset utilized during the experimentation phase.
4.1. Dataset
Data quality is a crucial factor that directly affects the performance of supervised learning algorithms. The utilization of a representative and high-quality dataset is critical for achieving optimal accuracy and performance [
47]. In this study, we obtained the dataset from the DFUC2021 challenge organized by the Medical Image Computing and Computer-Assisted Intervention (MICCAI) society [
48]. The proper licensing was also secured for this research, ensuring that all ethical and legal requirements were met. We further added an addition class called healthy, which is available on Kaggle platform [
17,
18,
19]. Upon initial preprocessing, we observed that the dataset’s class distribution was imbalanced, with 621, 2555, 227, and 2552 instances belonging to the classes both, infection, ischemia, and none, respectively. The number of images of normal/healthy classes we obtained from Kaggle was 543. The reason to introduce the healthy class by collecting additional images from Kaggle is that the none class represents ulcers without any infection or ischemia [
48], therefore a healthy condition anchor was still required to assess ulcer evolution towards recovery. Sample images from the different classes are shown in
Figure 10 and give a better idea. From the class distribution, we can conclude that the dataset is imbalanced. Such an imbalance poses a challenge to the performance of supervised learning algorithms, as they tend to be biased towards the majority class. To address imbalanced data, we applied geometric data augmentation techniques.
To test the proposed system, it was mandatory to have the proper hardware and software setup. The next section focuses on the experimental set-up.
4.2. Experimental Setup
The experiments were conducted on the Windows 10 Professional operating system, running on a powerful hardware configuration comprising 64 GB of RAM and an Intel(R) Xeon(R) W-2155 CPU operating at 3.30 GHz. The system was further enhanced with an NVIDIA GeForce RTX 3060 GPU, boasting 12 GB of dedicated memory. To facilitate the experiments, the system was configured with CUDA version 11.7, Tensorflow 2.10.0, and Python 3.10.9.
The selection of hyperparameters in this study was influenced by available computational resources. The batch size was set to 8, and the input images were resized to dimensions of 224 by 224 pixels with RGB channels. The model was trained for 40 epochs. A fixed learning rate of was employed.
As explained in the previous section, the DFU-Helper framework uses a Siamese Neural Network, which is composed of two identical sub-networks. The following section explains the backbone used for the sub-networks.
4.3. Siamese Sub-Network Backbone
For the CNN backbone, we use EfficientNetV2S based on EfficientNet [
49] architectures, which have been shown to significantly outperform other networks in classification tasks while having fewer parameters. EfficientNetV2S has fewer parameters, making it more suitable for low-resource settings, and it uses a combination of efficient network design and compound scaling to achieve high accuracy with fewer parameters [
50].
The second backbone of the ensemble model is based on Vision Transformers.This was first introduced by the paper “An Image is Worth
Words: Transformers for Image Recognition at Scale” [
51], and is referred to as Vision Transformers (ViT). We chose Bidirectional Encoder representation for Image Transformers (BEiT), which uses a pre-training task called masked image modeling (MIM).
Having established all the parameters, the testing of DFU-Helper was conducted, and the next section provides a detailed explanation of the results obtained.
4.4. Results
In order to validate the performance of our model for monitoring image similarity against class anchors, we need to establish a method for evaluation. To achieve this, we decided to compare the classification capabilities of our model with published works on the same DFU dataset. After training our model and obtaining predictions on the test data, we applied a pseudo-labeling technique to the test data and retrained the model to further optimize its performance. Pseudo-labeling [
52] was performed using a threshold of 0.9 to ensure a well-balanced model. This approach allowed us to assess the effectiveness of our model and refine its performance.
The metrics that were considered to evaluate the performance DFU-Helper for classification task are explained in the next section.
4.4.1. Metrics
Commonly used metrics include precision, recall, and F-score, which are essential in quantifying the accuracy and effectiveness of proposed method and also bench-marking it against other proposed models. This section explain briefly the metrics we used.
The precision metric is determined by dividing the number of correctly classified positive samples by the total number of samples classified as positive, including those that were classified incorrectly. This metric serves as an indicator of the model’s ability to accurately classify samples as positive. The formula is shown in Equation (
7), where TP refers to the true positive and FP represents the false positive.
Recall is derived by dividing the number of positive samples that were correctly classified as positive by the total number of positive samples in the dataset, as illustrated in Equation (
8). This metric is used to evaluate the model’s capacity to identify positive samples accurately. Higher values of recall indicate that the model is better at detecting positive samples.
The F1-score is the harmonic mean of precision and recall values for a classification problem. The F1-score symbolizes high precision as well as high recall. It presents a good balance between precision and recall, and gives good results on imbalanced classification problems.
In multi-class classification with imbalanced data, the main consideration will be the Macro F1-Score. The formula is illustrated with Equation (
10), where n represents the number of class involved. In the DFU classification, n is equal to 4.
4.4.2. Comparison SNN in DFU-Helper framework
As discussed in previous sections, the DFU-Helper framework employs a Siamese Neural Network (SNN) for implementing similarity learning. It is crucial to assess the SNN’s reliability when dealing with DFU images. Since there is no existing work specifically focusing on SNN for DFU, we conducted a classification test using our trained SNN for similarity learning on a dataset of 5734 test samples. The predictions were then uploaded to the online platform provided by the organizers of the DFU2021 challenge. The results, presented in
Table 2, demonstrate the exceptional performance of our model across all evaluated metrics. This outcome signifies that our model effectively distinguishes between similar and dissimilar images.
In
Table 2, we present the application of the Siamese Neural Network (SNN) within the DFU-Helper Framework for the classification task. This comparison encompasses an evaluation against leading research endeavors that have leveraged DFU images for reference. Our SNN, trained using similarity learning, demonstrate superior performance compared to the results achieved by other researchers, with the exception of the infection F1-Score.
4.4.3. Results of DFU-Helper Framework
To demonstrate the effectiveness of the experiments, we obtained images from several published articles [
4,
57,
58] and we tried to compare if the findings of the model correlated with the descriptions given in the articles we are using as baseline. We present the results of multiple use cases using both cosine similarity and Euclidean distance calculations. By utilizing these different measures of similarity, we aim to provide a comprehensive analysis and ensure the reliability of our conclusions.
4.4.4. Use-Case #1
For the initial application case, we obtained images from the study conducted by Dayya et al. [
57]. The serial images, depicting the measurements of a Wagner grade 2 wound with progressive healing in a diabetic patient (A-C), are presented in
Figure 11.
The performance of our model was evaluated using cosine similarity and Euclidean distance metrics, as illustrated in
Figure 12 and
Figure 13, respectively. Upon processing image A, the model identified it to be highly similar to infection, with a cosine similarity score of 0.81 and a semantic similarity score of 0.41 using Euclidean distance. In both cases, image C was deemed similar to the anchor class “none and healthy”.
While the results seem obvious between images A and C, this is not the case for images A and B.
While the radar plot gives a good visual and quick understanding of disease progression, we need to closely analyze the detailed results of both similarity metrics we are using.
From
Table 3, we observe that Image A, upon arrival, has a similarity score of 0.81 with the infection class, which aligns with the description of the wound. However, for Image B, the similarity score shows less similarity with the infection class and higher similarity with both the healthy and ischemia classes. After 12 weeks of treatment, Image C clearly exhibits similarity to neither infection nor ischemia but rather to the healthy class. Similar trends can be seen in
Table 4.
4.4.5. Use-Case #2
For the second used case, we consider images from the work of Almonaci et al. [
58] (
Figure 14), which is a chronological evolution of an ulcer in a diabetic male patient who is 54 years old with type 2 diabetes, with image A showing the initial appearance of the ulcer, Image B showing the evolution of the DFU after 11 days, and Image C after 12 days.
From
Figure 15 and
Figure 16, we can see that semantic similarity is closest to Infection on day 1 for image A. According to the process applied by the doctor after debridement of the lesion on day 11 [
58], and the treatment protocol consisting of application of topical administration of AgNPs solution, we have the image after 12 days, which shows a drastic improvement as observed on both the radar charts, implying the ulcer is responsive to the treatment. However, based on the conclusion we studied in the work of Almonaci et al. [
58], where they seem to be more satisfied with the result on day 13, our model tends to show a regression from day 12 to day 13 in both the radar plots. They tend to again point towards a higher similarity to infection.
We shall now analyze what the numbers show in terms of similarity from
Table 5 and
Table 6. When the cosine distance is used on arrival on day 1, the similarity is clearly set to infection. However, once treatment is started, we can see that on day 12 there is a higher similarity to none and healthy, which is the same for Euclidean distance. For day 13, there is also the highest similarity to none, but instead of an increased similarity to both none and healthy, it shows a slight reduction. There may be an influence on the way the images are taken, which opens up the need to have a clearly defined protocol for the DFU images.
4.4.6. Use-Case #3
The images used in this third case were obtained from the study conducted by Tobalem et al. [
4].
Figure 1 shows the progression of DFU over 10 days. The patient had photographed the lesion twice daily, thinking it would heal spontaneously (Panel A). The preoperative photographs show erythema (day 1), blisters (day 3), a necrotizing abscess (day 6), and a wound infection requiring surgery (day 10) [
4]. We will use these images to show how the model and process we propose can be used not only by doctors but also by patients.
The radar charts shown in
Figure 17 and
Figure 18 offer valuable insights into the progression of DFU in the patient. On day 1, the model indicates a similarity of 0.6 with the infection class while also showing high values for the healthy and none classes, which may lead to some confusion. However, by day 2, the model clearly emphasizes the infection class, and subsequent days exhibit a shift towards both infection and ischemia. These results effectively demonstrate the model’s capability to track the development of DFU in the patient over time.
In this specific case, the model acts as supplementary evidence to illustrate the progression of DFU. Comparable conclusions can be drawn by examining
Figure 19 and
Figure 20.
From
Table 7 and
Table 8, the trends in terms of similarity follow the same pattern. From the research article [
4], the following descriptions were obtained: erythema (day 1), blisters (day 3), a necrotizing abscess (day 6), and a wound infection requiring surgery (day 10). On day 10, with cosine distance, there is a high similarity between ischemia and both, but for Euclidean distance, there is the highest similarity between both on day 10. However, from day 9 to day 10, the reduction in both similarities poses a problem, as based on the description from the research article, the situation is actually even more serious. Here, again, we see the need to have a control protocol for taking the picture or have our model better learn similarity by experimenting more in terms of architecture or dealing with the class imbalance.
4.5. Discussions
DFU-Helper is a framework that utilizes Siamese Similarity Learning to assist medical practitioners in validating follow-up diagnostics for treatment purposes. While our model demonstrates a strong correlation with the evaluation conducted in the research articles from which we sourced the test images, we were unable to assess its performance on real longitudinal DFU images, as was done by Li et al. [
24] in their studies on retinopathy of prematurity and osteoarthritis. Li et al. [
24] had a database of longitudinal images consisting of 4861 images from 870 patients for retinopathy of prematurity, and 10,012 images from 3021 patients for osteoarthritis. In contrast to our approach of showing progress across five class anchors, Li et al. [
24] employed an overall severity score and compared individual images against the established normal standards for both eyes and knees, providing a corresponding score as output.
As far as the architecture of our SNN is concerned, as opposed to all the work detailed in the related works sections, including those for severity evaluation over a time period [
24,
26,
27], none uses an ensemble of CNN and ViT for the sub-networks. For CNN, we use EfficientNet, which is known to achieve state-of-the-art results while dealing with images, the novel and widely used ViT, and more specifically, the BEiTV2 [
59]. When tested on a classification task, this architecture has a Macro F1-Score of 0.951 and an accuracy of 0.9395. The majority of work are concentrated on using CNN backbones namely VVG16, ResNet18, and InceptionV3.
In the study conducted by Ornob et al. [
32], they developed a detection method for COVID-19 by creating an ensemble of six pre-trained CNNs and the Vision Image Transformer (ViT), specifically the Swin Transformer, along with a Triplet Siamese Neural Network framework. Although we have concerns about the computational resources required, the concept of integrating cutting-edge models to achieve optimal results in the medical field is acceptable. As part of our future work, we propose evaluating the top-performing ensemble CNN and the top-performing ensemble ViT separately and subsequently combining the best ensembles to further improve detection accuracy.
In the selection of anchors for image comparison over time in DFU-Helper, we took a different approach compared to AbdulRaheem et al. [
26] and Akbar et al. [
27]. Instead of using 5 or 16 images per class, we utilized the maximum number of available images per class in our dataset to generate the class anchors. For training DFU-Helper and SNN, we introduced a novel loss function called Large Margin Cotangent (LMCoT), proposed by Duong et al. [
44], deviating from the commonly used contrastive loss or triplet loss functions in the relevant works we considered for severity estimation, disease detection, or classification. Interestingly, Akbar et al. [
27] explored four different loss functions, including contrastive loss, mean square error (MSE) loss, Huber loss, and a combination of contrastive and MSE loss, which holds its own merit.
In contrast to non-deep learning methods, Hu et al. [
30] simplifies the computational complexity by converting images to grayscale during processing. However, in our DFU-Helper, the SNN analyzes images while retaining the three RGB channels. Moreover, we used meticulously labeled data to ensure accurate training and validation for similarity learning in our model. The mentioned work does not specify the number of experts whose input was considered to calculate similarity, which contrasts with our algorithm that outputs similarity results. Additionally, in comparison to the approach proposed by Ionescu et al. [
31], which solely focuses on image equivalence without considering image content, our SNN, particularly the utilization of the ViT, places significant emphasis on the semantic content of the image.
The DFU-Helper framework can further be enhanced by incorporating additional deep learning architectures. To ensure its suitability for application in the public health domain, it is essential to establish a rigorous validation and testing protocol, thereby making the proposed framework more robust.
4.6. Limitations
One key limitation of our study is the quality of the dataset. With the promising results that deep learning is showing for exploiting medical images, there is a need to have a better-quality dataset. In this case, we had to introduce the healthy class images from another source. Secondly, with the limitation in processing power, there are other ensemble models for the sub-network that we were not able to test and evaluate, which could have given a better result in terms of showing similarity or dissimilarity. One of the disadvantages of the Siamese Neural Network is the high processing power needed. Finally, we do not have a way to compare the output of the DFU-Helper framework with a known severity grading, as in the case of the work of Li et al. [
24].
5. Conclusions and Future Works
In this paper, we used similarity learning to train an SNN and propose a DFU-Helper framework to assist doctors who diagnose and decide on the treatment protocol of DFU, and subsequently perform follow-up on a patient. We combined the CNN and ViT transformers and used transfer learning on the DFU dataset. As exposed in the limitations, there are several other models and techniques that can be further experimented with.
Machine learning offers a set of techniques and methods that can turn raw data into realistic and tailored knowledge [
60] which can, in turn, give additional insight to healthcare professionals. This tool must undergo testing in collaboration with healthcare experts who can formulate suitable protocols for its implementation within a cohort, as well as the collection of performance indicators.
In our study, our intention was not to replace healthcare professionals but rather to offer an additional perspective through the utilization of deep learning and image similarity architecture. However, it is important to highlight that the tool represents a novelty in the realm of DFU management. Currently, the management heavily relies on the practitioner’s experience, which, regrettably, can be susceptible to misinterpretation due to their workload. Incorporating DFU-Helper provides confirmation of their diagnoses, ultimately enhancing the reliability of the tool. Upon completing this phase, the ultimate objective would be to package the same functionality into a mobile application, enabling patients to engage in self-monitoring.
The prompt detection and efficient management of diabetic foot ulcers can play a crucial role in preventing the advancement of wounds and reducing the risk of amputations. Our research has the potential for further development as a tool for early detection of DFUs, as demonstrated by our experimental findings with the addition of the new Healthy Class.
An essential aspect of future work in this field is involving healthcare institutions in the data collection process, as data remains crucial for model development. This will necessitate further research into data confidentiality within the context of machine learning, and exploring federated learning models could be a potential avenue.
Secondly, the incorporation of explainability into the system is imperative. Subsequent research needs to focus on ensuring that the output of DFU-Helper is interpretable, thus gaining acceptance from medical professionals. This avenue opens up the realm of Explainable Artificial Intelligence (XAI), an area that has gained significant momentum in recent times.
The medium-term goal remains the initial deployment for doctors, with the ultimate aim of creating a patient application. This approach is aligned with the research conducted by Plonderer et al. [
61], which emphasizes the utilization of such tools in collaboration with healthcare experts.


 ,
, 


