Article

Discrimination of Healthy and Cancerous Colon Cells Based on FTIR Spectroscopy and Machine Learning Algorithms

Department of Clinical and Experimental Medicine, University of Foggia, 71122 Foggia, Italy
*
Author to whom correspondence should be addressed.
Appl. Sci. 2023, 13(18), 10325; https://doi.org/10.3390/app131810325
Submission received: 4 August 2023 / Revised: 13 September 2023 / Accepted: 13 September 2023 / Published: 14 September 2023
(This article belongs to the Section Optics and Lasers)

Abstract

:
Colorectal cancer was one of the most frequent causes of death due to cancer in 2020. Current diagnostic methods, based on colonoscopy and histological analysis of biopsy specimens, are partly dependent on the operator’s skills and expertise. In this study, we used Fourier transform infrared (FTIR) spectroscopy and different machine learning algorithms to evaluate the performance of such method as a complementary tool to reliably diagnose colon cancer. We obtained FTIR spectra of FHC and CaCo-2 cell lines originating from healthy and cancerous colon tissue, respectively. The analysis, based on the intensity values of specific spectral structures, suggested differences mainly in the content of lipid and protein components, but it was not reliable enough to be proposed as diagnostic tool. Therefore, we built six machine learning algorithms able to classify the two different cell types: CN2 rule induction, logistic regression, classification tree, support vector machine, k nearest neighbours, and neural network. Such models achieved classification accuracy values ranging from 87% to 100%, sensitivity from 88.1% to 100%, and specificity from 82.9% to 100%. By comparing the experimental data, the neural network resulted to be the model with the best performance parameters, having excellent values of accuracy, sensitivity, and specificity both in the low-wavenumber range (1000–1760 cm−1) and in the high-wavenumber range (2700–3700 cm−1). These results are encouraging for the application of the FTIR technique, assisted by machine learning algorithms, as a complementary diagnostic tool for cancer detection.

1. Introduction

The World Health Organization estimated nearly 10 million deaths due to cancer worldwide in 2020 [1]. In particular, colon and rectal cancer was one of the most common cancerous pathologies, ranking third place regarding the number of diagnosed cancer cases and second place for the number of cancer deaths. Early and accurate diagnosis can allow for more precise and targeted surgery, which could decrease the death rate. Currently, colonoscopy remains the gold standard for colorectal cancer screening [2], although it can only make preliminary diagnoses, which should be confirmed by histological evaluation of a biopsy specimen. The analysis of cytological and histological samples occurs through the microscopic observation of the morphology of cells, tissue, and lesions. This technique might be partially subjective because the evaluation is dependent on the experience and skill of the pathologist, instruments, staining procedure, and the approaches used to analyse the cytological and histological images [3].
Therefore, it is interesting to combine traditional diagnostic techniques with methodologies which are able to provide reliable diagnoses depending on the biochemical characteristics of the investigated cell and tissue samples, since the transformation of a normal cell to a cancerous state involves changes in the cellular biochemical environment. Fourier transform infrared (FTIR) spectroscopy could achieve this goal, because it provides biochemical information about the functional groups inside the main cell components, such as nucleic acids, proteins, and lipids [4,5,6], without requiring complex cell sample processing prior to measurements [7]. Indeed, FTIR microspectroscopy has largely been used to image and discriminate cancerous colon tissues from normal ones [8,9,10,11,12,13,14], whereas there are few FTIR investigations regarding cytological colon samples [15,16].
Nonetheless, FTIR spectra measured for healthy and cancerous cells are quite similar to each other, because the spectral features related to specific biochemical components are only slightly modified by the onset of pathology. Thus, a simple visual observation of the measured spectrum of cytological samples in most cases cannot discriminate positive from negative outcomes. The comparison of the intensity values of specific absorption peaks from the spectra of different cell types is in many cases insufficient to obtain a reliable diagnosis. The problem with making a diagnostic evaluation via cell samples can be addressed by measuring the FTIR spectra of such samples. Moreover, mathematical models based on specific algorithms should be built in advance in order to properly diagnose the pathology according to the measured spectra: they are known as “classification models”. In particular, the algorithms firstly operate on spectra of cellular samples whose classification (healthy, cancerous, metastatic, etc.) is known: these spectra are used to build classification models that will suitably allow for the classification of other unknown spectra. To build the classification models, the algorithms rely on the multivariate structure of the spectra that are provided to them. That is, instead of relying on the values of one or more specific variables (such as the absorption intensities at specific wavenumbers of the spectrum), they utilize a mathematical combination of several variables into new variables (often called “latent variables”) that have a certain desired property which discriminates the spectra of cells belonging to different classes. Therefore, such latent variables can be used to predict this property for unknown spectra [17].
Machine learning algorithms are mechanisms that can learn the hidden patterns from input data (whose classes are known) and predict the output of new unknown data. They have proven effective in solving classification problems in the biomedical field according to measured vibrational spectra [18,19,20]. Several types of classification software have been developed and optimized, and they are now available to support researchers in properly addressing the problem of attributing unknown spectra to a suitable class. One of such software is “Orange” (https://orangedatamining.com/), which is freely available and contains many classification algorithms [21]. Some popular and efficient algorithms included in Orange are CN2 rule induction (CN2-RI), logistic regression (LR), classification tree (CT), support vector Machine (SVM), k nearest neighbours (kNN), and neural network (NN).
The CN2_RI algorithm is a classification technique designed for the efficient induction of simple and comprehensible rules of form, “if cond then predict class” [22]. The CN2_RI algorithm generates, according to an iterative process, a list of rules for classifying samples [23]. In particular, first the algorithm sequentially searches for reliable rules that allow us to correctly classify a large number of samples of the dataset. The reliability of a given rule is estimated with a proper evaluation function [24]. Then, the samples covered by this rule are removed from the dataset, whereas the remaining samples are successively classified by other rules. The process eventually stops if all samples are classified and no more rules can be found [23]. Recently, the CN2_RI model was used to predict the risk level of cervical and ovarian cancer in association to stress [25], as well as to predict the severity of obstructive sleep apnoea syndrome [26], although the classification of vibrational spectra by this technique has not yet been reported in the literature.
LR is a binary classification model capable of providing the probability that an unknown sample belongs to one of two classes. During the training step, all selected variables, x, which characterize a sample are appropriately summarized to contribute to a new variable, z. In particular, the coefficients linking the variable z to the variables x are properly determined so that the values of the variable z approximate the values of 0 and 1 for the two classes, respectively. Next, the z values for the training samples are fitted with a sigmoid function (ranging between 0 and 1). By computing the sigmoid function of z (that is, a weighted sum of the input features), we obtain a probability (between 0 and 1) of an observation belonging to one of the two classes. Then, for the prediction of an unknown sample, first, the z value should be computed (using the previously determined coefficients) before it is entered into the sigmoid function: the probability of belonging to one of the two classes is established [17]. The LR model was used for the classification of new analogues of drugs at a high risk of being abused, belonging to the class of hallucinogenic amphetamines, based on their FTIR spectra [27]. L.A. Arevalo et al. reported that a LR model can discriminate between healthy controls and Alzheimer’s patients with a precision of 98% when the input for the model combines data from both Raman and FTIR spectra measured for cerebral spinal fluid [28].
The CT algorithm classifies data according to a hierarchical model composed of decision rules that are applied recursively to the variables in order to separate the dataset into single-class subsets [29]. The decision rules are found according to a tree structure, which consists of a root node, branches, internal nodes, and leaf nodes. The root node identifies a spectral feature that allows for the division of data into classes in the best possible way. The branches that originate from the root node report the decision rules regarding the value of the spectral features that separate the whole dataset into subsets according to the classes. If the decision rules do not allow for a complete separation of the whole dataset into classes, internal nodes are formed based on other spectral features. Further branches originating from the internal nodes report further decision rules, which allow us to continue the partition of the unclassified data until all data are separated according to the proper classes. The leaves are the terminal structures and represent the classification results of the data set [30]. Diagnostic models based on FTIR spectra classified by CT achieved an accuracy of 99.24% for discrimination between hepatocellular carcinoma and normal tissue [31]. Also, Raman spectra of neoplastic and normal nasopharyngeal cell lines were classified by CT with 98.5% accuracy [32].
SVM is a binary classification algorithm based on the optimization of separation of observation (i.e., spectra) belonging to different classes by finding hyperplanes, in a transformed space of the variables, that maximize the margin from the boundaries of observations belonging to the two classes. The optimal hyperplanes are identified during the training step and a criterion is established to separate the observations belonging to different classes, located on opposite sides of the hyperplanes (for example, the values −1 and +1 are used to encode the observations belonging to different classes). Then, an unknown observation is projected onto these hyperplanes and classified according to the criterion defined in the training step [18,33]. Recently, urine surface-enhanced Raman spectroscopy combined with the SVM algorithm enabled the diagnosis of liver cirrhosis and hepatocellular carcinoma with accuracy levels of 85.9% and 84.8%, respectively [34]. Also, FTIR of serum samples, in conjunction with the SVM algorithm, proved to be a sensitive tool for the detection of HCV infection and to assess the non-cirrhotic/cirrhotic status of patients [35].
The kNN algorithm is a classification method for estimating the likelihood that a sample will belong to one group or another based on which group the samples nearest to it belong to. The first step is the proper selection of the k value, because kNN attempts to predict the correct class for an unknown sample by calculating the distance between the sample and all the training samples, and, successively, selecting the k number of samples which are closest to the unknown sample. Then, the unknown sample is assigned to the prevalent class among the classes of the k neighbours. Raman spectroscopy of serum samples, coupled to the kNN classification model, has been used as a diagnostic technique for endometriosis [36]. The kNN algorithm has also been used for the classification of white blood cells in different types of acute myeloid leukaemia according to cells’ morphological characteristics [37].
The NN is a classification algorithm whose aim is to search for relationships among samples in a dataset through a process that mimics the way in which the human brain operates. The NN method is based on many artificial nodes (corresponding to neurons in the human brain) arranged in layers: each node is connected to all other nodes in the adjacent layers. Such layers are organized into input layers, output layers, and (one or more) hidden layers. The variables x of a dataset feed the input layer. All these variables are fed as input to every node in the hidden layer, where different linear combinations of the variables are built and a nonlinear function is applied to obtain new variables z, which depend on the original variables. This process occurs inside the hidden layer, where each neuron takes several variables x as inputs and produces one single output z. Finally, the new variables z can be used in different ways to obtain the final output y, which is the codified target variable [38]. NN-based algorithms applied to vibrational spectra data have been often used to solve classification problems in medicine [30,39,40].
In a previous paper, we discriminated, with excellent accuracy, healthy colon cells (FHC line) from cancerous ones (CaCo-2 line) according to FTIR spectra measured in transmission mode [16]. These cells were grown on glass coverslips and the discrimination was limited to absorption values measured in the 2700–3700 cm−1 spectral range, because glass slides are transparent to IR radiation only in such a range. In this work, we extended the investigation to a wider spectral range, including both the 1000–1760 cm−1 (LWR) and the 2700–3700 cm−1 (HWR) regions. Such measurements were allowed (i) by using a slide reflecting the IR radiation as a substrate on which the cells were grown and (ii) by using the transflection measurement method. A few machine learning algorithms were used to develop classification models in order to assign unknown spectra to the proper class. The aim of this work was to investigate which algorithm and which of the two spectral ranges allowed for a better classification of unknown cells. The obtained results point out that the employed classification models were able to discriminate the spectra from different types of cells with high accuracy, sensitivity, and specificity, particularly as far as the NN model is concerned. The performance of the classification models resulted to be excellent even when applied independently to the LWR and HWR spectra. This result is interesting because it suggests that it is possible to perform FTIR analysis of cell samples on glass slides (which are commonly used in medical practice) with excellent classification performance. Thus, this study represents a further investigation supporting the use of the FTIR spectroscopy and machine learning algorithms as complementary diagnostic tools in cytology.

2. Materials and Methods

2.1. Cell Culture and Preparation

Foetal human colon (FHC) is a human cell line, extracted from normal foetal colon tissue, that can be used to model healthy colon cells. An FHC line was purchased from ATCC (CRL-1831) (Manassas, VA, USA). These cells were grown in DMEM F12, to which 10 mM Hepes, 10 ng/mL cholera toxin, 5 μg/mL insulin, 5 μg/mL transferrin, 100 ng/mL hydrocortisone, 20 ng/mL EGF, and foetal bovine Serum with a 10% final concentration were added.
Human colorectal adenocarcinoma (CaCo-2) is a cell line consisting of human colorectal adenocarcinoma epithelial cells extracted from the colon tissue of a 72-year-old male. The CaCo-2 line is used to model cancerous colon cells. It was purchased from ATCC (Manassas, VA, USA). CaCo-2 cells were grown in Dulbecco’s Modified Eagle’s medium (DMEM), supplemented with 4 mmol/dm3 L-glutamine, 1% penicillin/streptomycin, 10% foetal bovine serum (FBS), and 1% non-essential amino acids (NEAA) at 37 °C and 5% CO2.
The cells were cultured on poly-lysine-coated MirrIR low-e slides (Kevley Technologies, Chesterland, OH, USA). The slides were located inside petri dishes incubated at 37 °C and 5% CO2. Before FTIR measurements, the cells were fixed by means of paraformaldehyde 3.7% and preserved inside a desiccator.

2.2. FTIR Measurements

FTIR spectra were measured in the transflection mode by using a FTIR Microscope HYPERION 2000 (Bruker Optik GmbH, Ettlingen, Germany), where the IR radiation beam came from a Vertex 70 Bruker interferometer (Bruker Optik GmbH). The IR signal was detected by a mercury cadmium telluride (MCT) device, cooled at liquid N2 temperature. Each spectrum was measured in the 1000–4000 cm−1 spectral range by averaging the signal of 64 scans, with a resolution of 4 cm−1. Then, the 1000–1760 cm−1 (LWR) and 2700–3700 cm−1 (HWR) spectral ranges were selected and analysed for each spectrum. The IR radiation was focused with a 15X objective onto a few cells included in the sampling area with a size of about 80 μm × 80 μm. The background signal was detected within a slide area without any cells. The numbers of measured cells were 50 and 60 for the healthy and cancerous types, respectively. The spectra were normalised using the standard normal variate (SNV) method, which decreases the spectrum baseline shifts related to scattering effects [41] and minimises the differences in absorption intensity due to cells having different thicknesses. The SNV normalization was performed independently for the LWR and HWR of each FTIR spectrum. The t-test analysis was performed using SigmaPlot software (version 12.5, Systat Software, San Jose, CA, USA).

2.3. Spectra Analysis

Each of the two different sets of spectra, related to healthy FHC cells and cancerous CaCo-2 cells, was separated into a calibration set, containing 70% spectra from each cell type, and a test set, including the remaining 30% of the spectra. Therefore, the calibration set included spectra of 35 healthy cells and 42 cancerous cells, whereas the test set comprised spectra of 15 healthy cells and 18 cancerous cells. The spectra of the calibration set were randomly selected by a random number generator; thus, the samples included in the calibration and test sets for the LWR and HWR corresponded to the same FTIR spectra.
The machine learning training analysis was performed for the calibration sets using six classification models included in Orange software 3.35.0. In particular, the following algorithms were considered: CN2-RI, LR, CT, SVM, kNN, and NN. For each algorithm, the different parameter values that were used to control the learning process were tuned until the accuracy of the model was optimized. Full cross-validation was used to validate the results obtained via the investigated machine learning models with the spectra of the calibration set.

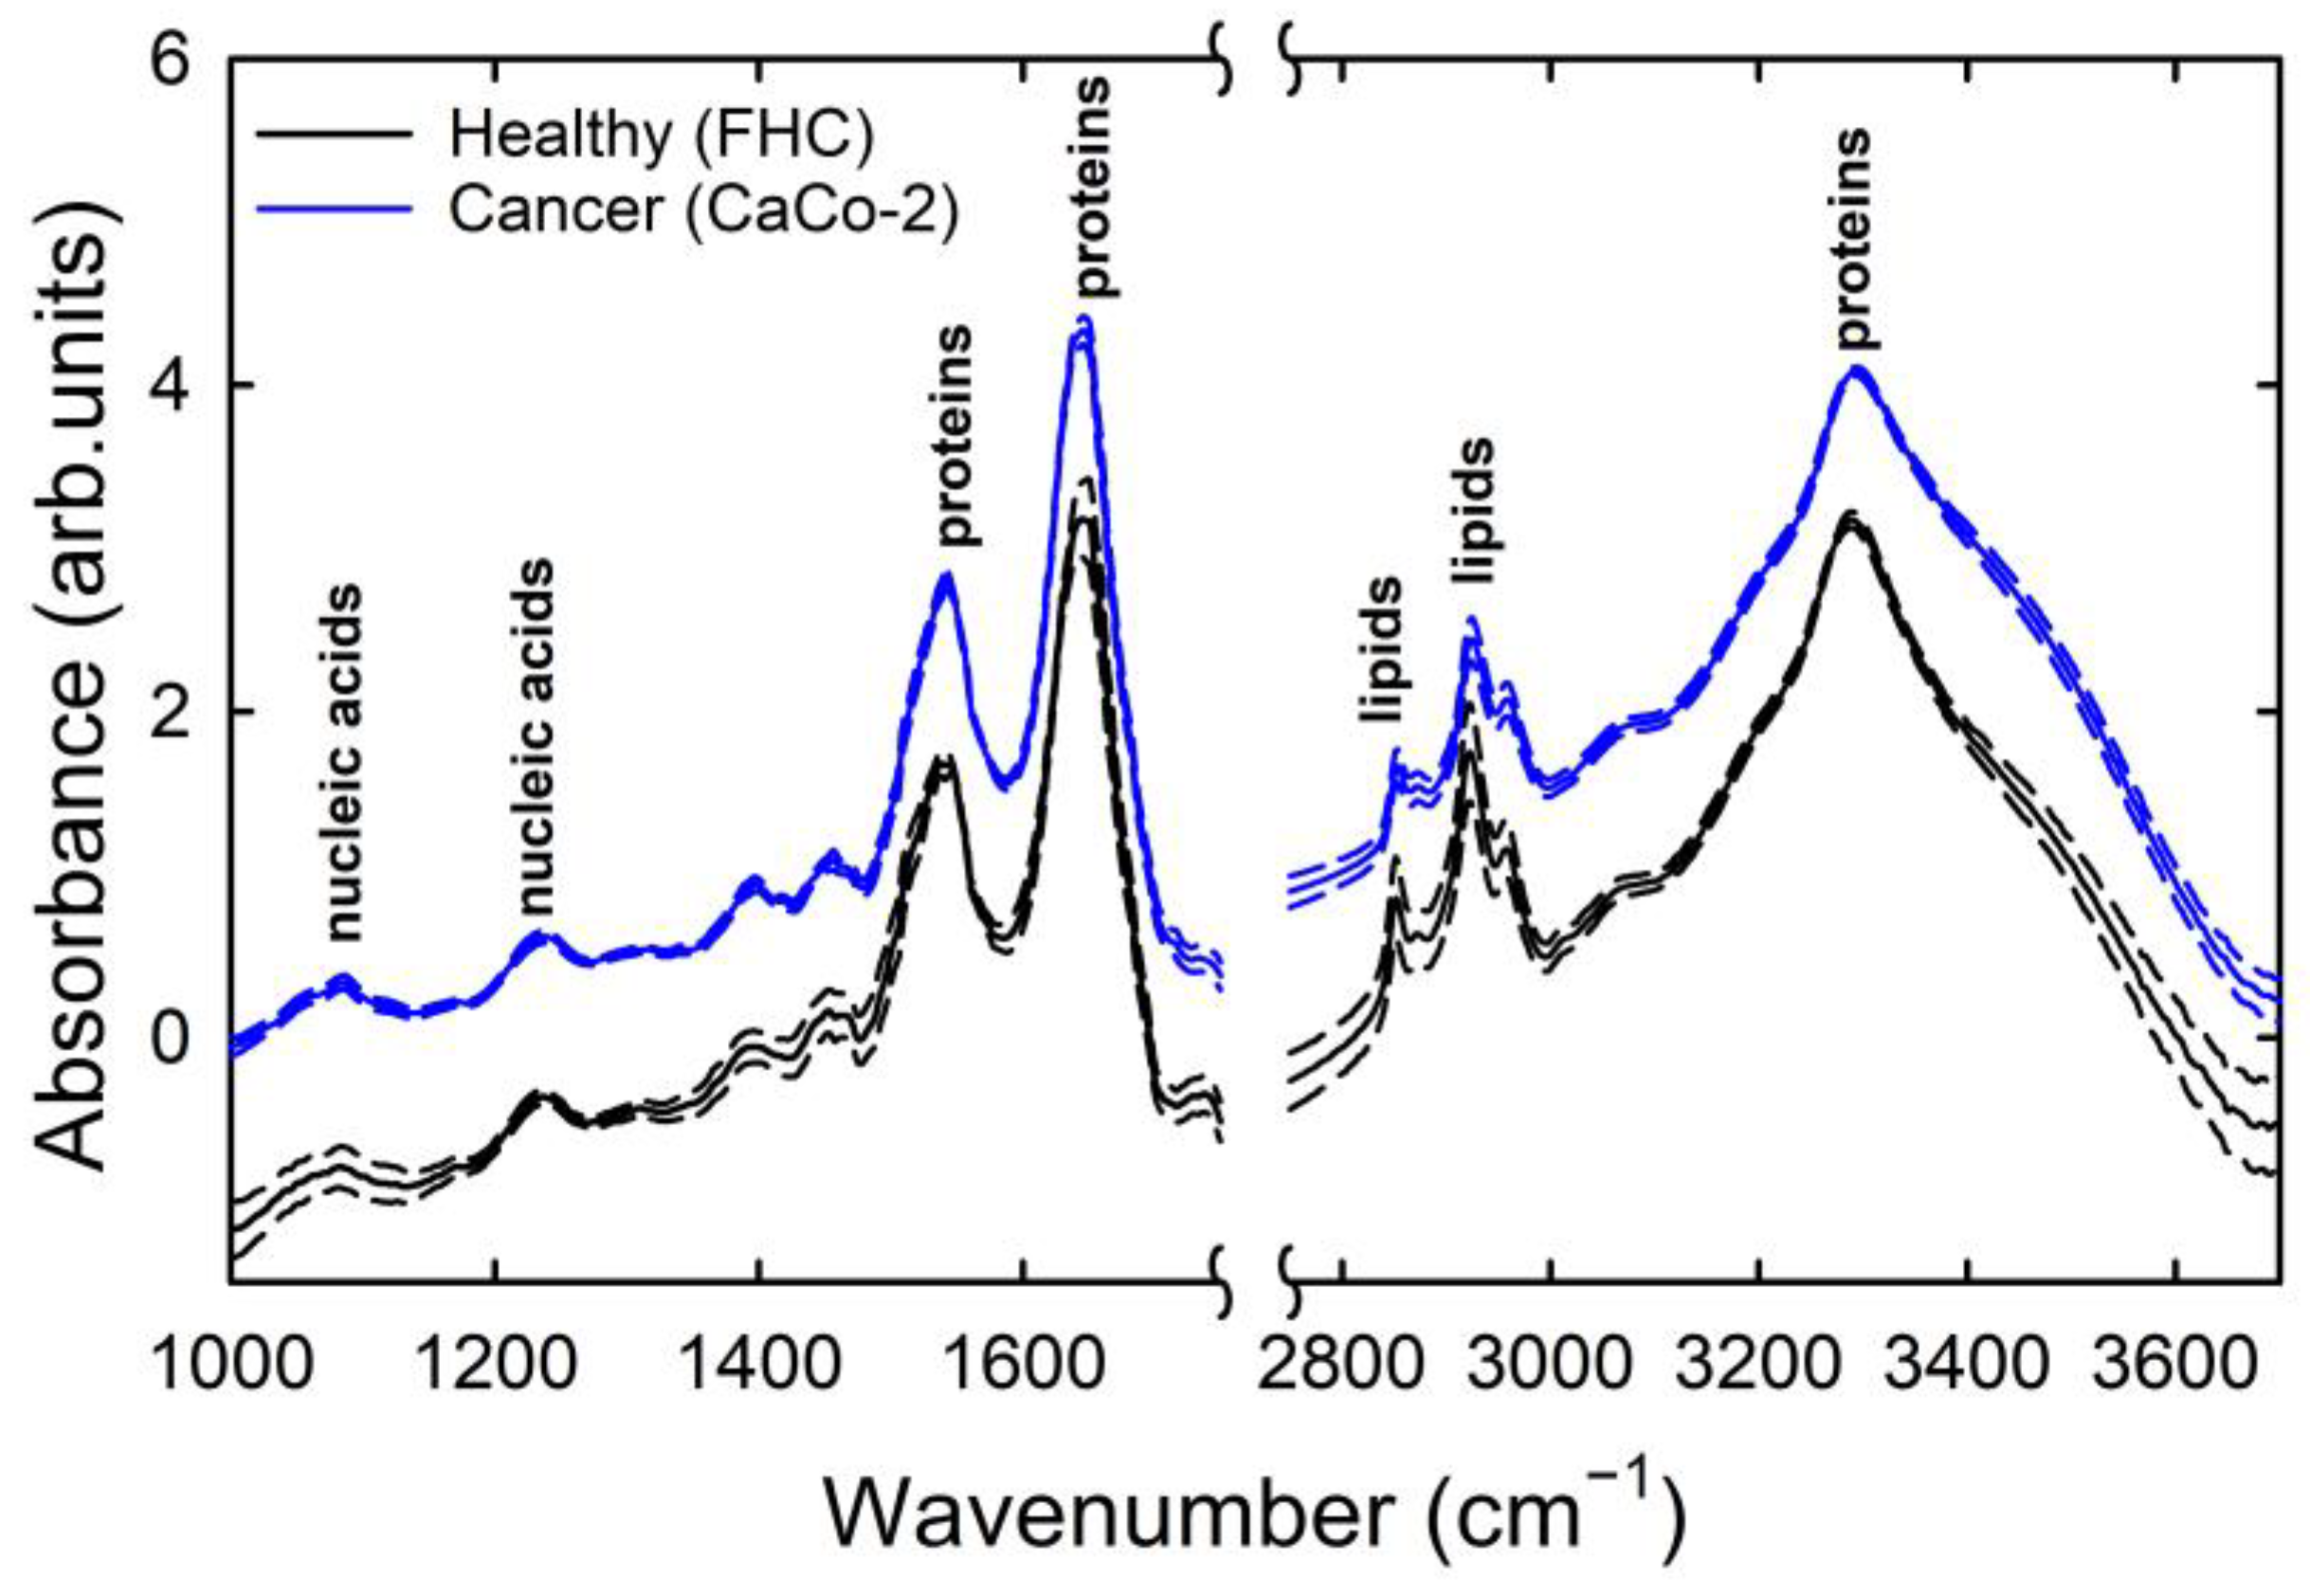
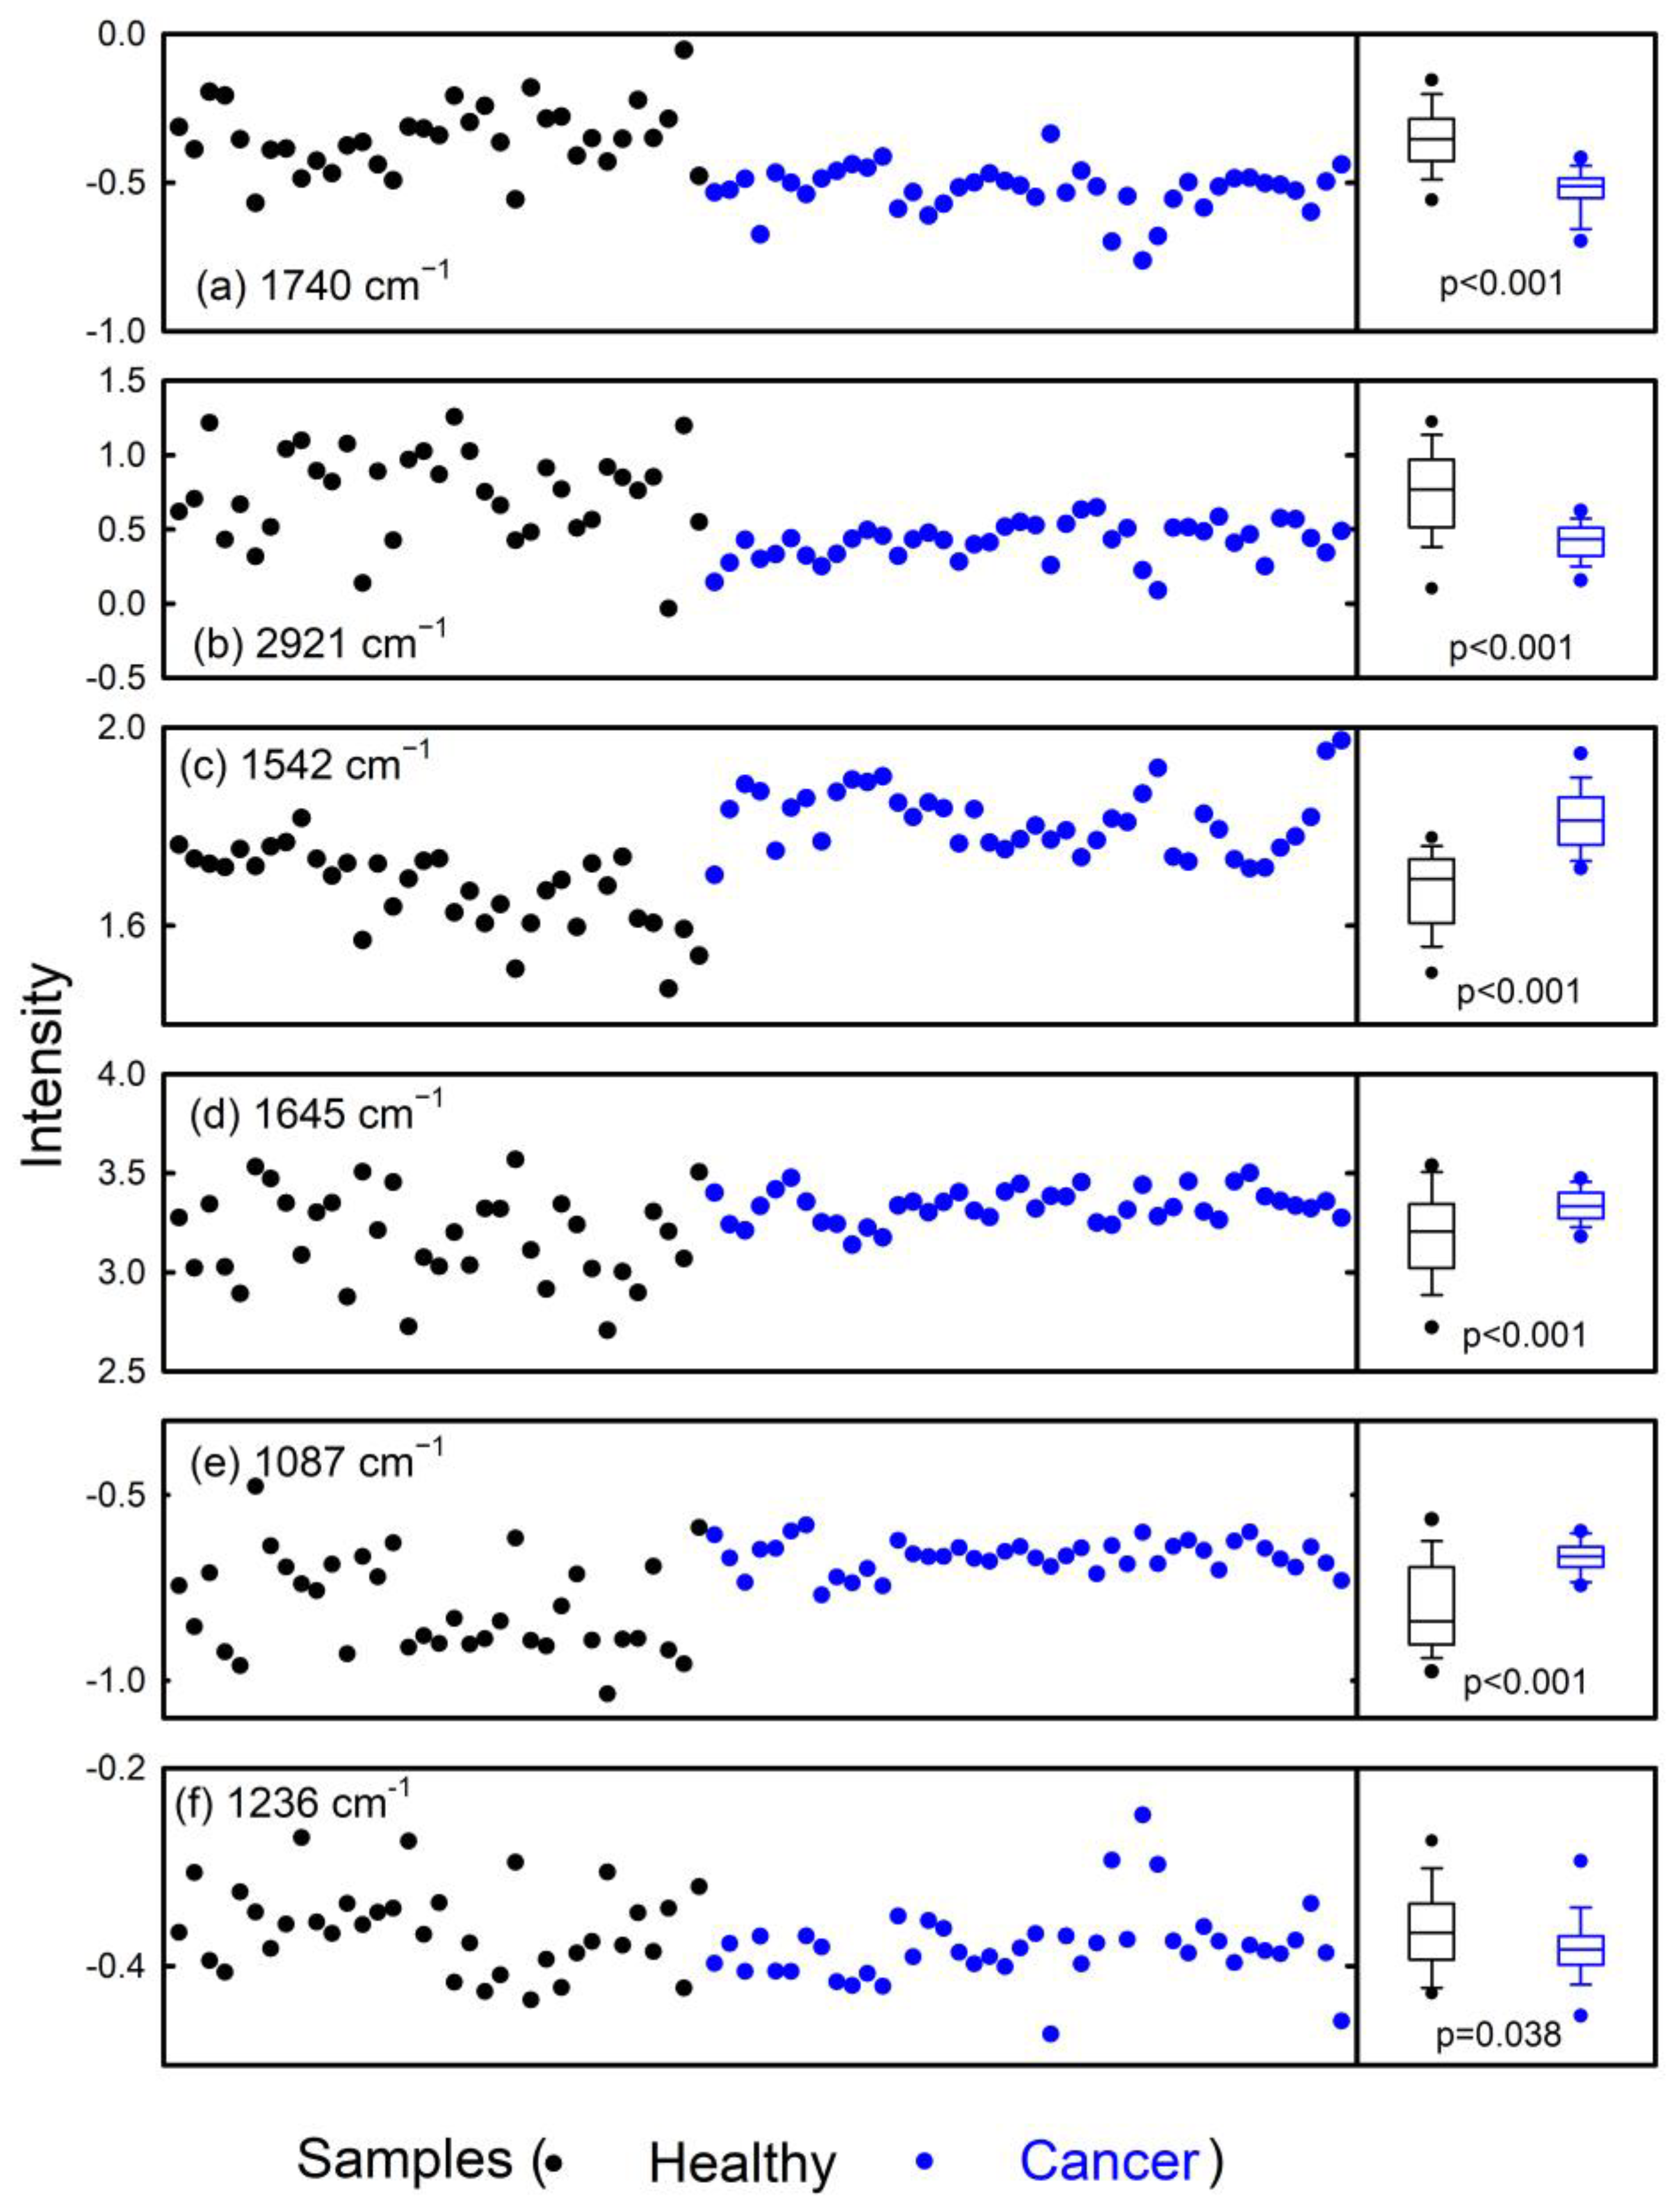
3. Results and Discussion

The comparison between the SNV-normalized spectra of FHC and CaCo-2 cells from the calibration set is shown in Figure 1. In particular, the mean (continuous lines) and standard deviation (dashed lines) spectra are displayed for both LWR and HWR. Since the two mean spectra are almost overlapping, they have been intensity-shifted in Figure 1 for clarity. These spectra are similar to those reported for colon cells and tissues by other authors [8,15]. They are characterized by several spectral peaks, which can be related to the IR radiation absorption from specific functional groups inside the main biochemical cellular components. Specifically, the most evident and resolved peaks (labelled in Figure 1) in the LWR were due to absorption from nucleic acids and from protein and lipid groups, whereas the HWR was dominated by absorption from protein and lipid components [42].
The standard deviation values in Figure 1 emphasize that the absorption signals of healthy cells are more broadly distributed with respect to those of cancerous cells, suggesting that healthy cells present larger differences in the relative content of cellular components with respect to the cancerous ones. In addition, we remark that no baseline was subtracted to the spectra during the pre-processing step, because the analytical function corresponding to the scattering signal, which is mainly responsible for the background, was unknown. Thus, the hypotheses we could make regarding this could be unreliable, and, consequently, they could influence the spectra in an arbitrary way. The increasing and decreasing trends of the spectral intensity signals in the LWR and HWR, respectively, suggest that a baseline signal was still present. Therefore, the SNV normalization failed to totally remove the scattering signal. However, the similar trends of the standard deviation curves indicate that the scattering contribution is comparable for both spectral ranges of the two cell types; therefore, we believe that the incomplete removal of the scattering signals does not drastically influence the spectral analysis.
In order to correctly identify the spectral position of the absorption peaks which mainly contribute to the FTIR spectra, the second derivative signal of the mean spectrum was calculated and is reported in Figure 2 (red line), as far as the healthy cells are concerned. In fact, second-order derivatives are characterized by negative bands with minima at the spectral position corresponding to maxima on the zero-order bands (as indicated by the dot-dashed lines). Therefore, the spectral positions of minima in the second derivative spectrum can be assumed to correspond to the spectral positions of single FTIR absorption peaks. Each of such absorption peaks is related to the contribution of specific functional groups inside the cellular components: the assignment of the absorption peaks is reported in Table 1, as was deduced in [42].
The absorption values of several selected features are partially able to differentiate healthy from cancerous cells, as shown in Figure 3. In particular, the absorption intensity values at 1740 cm−1 and 2921 cm−1 were larger in healthy cells than in cancerous ones, as evident in Figure 3a,b. This observation suggests that the healthy cells have a larger relative amount of lipids with respect to the cancerous cells. The greater intensity of lipid absorption peaks in the normal samples than in the cancerous ones was also reported by L. Dong et al., regarding colon tissue [43]. In addition, E. Kaznowska et al. found a greater intensity of lipid FTIR peaks in healthy colon tissue with respect to cancerous tissue and post-chemotherapy tissue. They proposed that the intensity values of these spectral peaks (as well as those from nucleic acids and protein components) be considered as markers in diagnostic management and treatment monitoring for colorectal cancer [9]. However, although a significant statistical difference between the distributions of absorption values in the two groups of cells can be deduced from Figure 3a,b (as indicated by the box plots on the right side), the separation was not sharp, and several absorption intensities were similar between the two cell types.
Also, the intensity values of some protein-related FTIR peaks were quite different for the two types of cells: they are shown in Figure 3c,d for the amide II and amide I peaks, respectively. In particular, the absorption values of cancerous cells were larger than those of healthy ones and the differences were statistically significant. Such a result is in good agreement with that reported by S. De Santis et al. regarding FTIR microspectroscopy of collagen from human colon specimens which was surgically removed after diagnosis of adenocarcinoma [44]: they found larger FTIR spectral signals from malignant tissue than normal tissue in the amide III spectral range [44]. Even B. Brozen-Pluska reported that protein-related peaks in the Raman spectra of Caco-2 cells were characterized by greater intensities with respect to the corresponding peaks in the Raman spectra of noncancerous colon cells [45]. However, discordant results have also been reported [9], and, in addition, in Figure 3c,d, many similar and not clearly distinct intensity values for the two cell types are evident, particularly as far as the amide I peak is concerned.
Lastly, the absorption intensity values of the DNA-related peaks, shown in Figure 3e,f, largely overlapped for the two cell types, especially as for the peak at 1236 cm−1, for which there was not a statistically significant difference between the distributions of intensity values of the group of healthy cells compared to that of cancerous cells. Therefore, in our opinion, this univariate analysis is not reliable enough to discriminate cancerous cells from healthy ones and, consequently, its use in the clinical diagnostic field remains limited. On the contrary, it is interesting to evaluate the effectiveness of multivariate analysis methods in the discrimination between the two types of cells.
Therefore, we evaluated the results obtained from several classification algorithms for each of the two wavenumber ranges. In particular, six classification algorithms (kNN, LR, CT, CN2-RI, SVM, and NN) were trained. The spectral features used for the classification were manually selected as corresponding to the spectral positions of absorption peaks, which were identified in Figure 2 according to the negative minima of second derivative signals of the mean spectra.
For each algorithm, the values of the parameters used to control the learning process were optimized, as described as follows:
CN2-RI: ordered rules, exclusive covering, entropy evaluation with beam width equal to 5 for rule searching, minimum rule coverage of one, and maximum rule length equal to 5;
LR: non-regularization type;
CT: a binary tree, with minimum two samples per leaf; subsets were not split if they contained fewer than five samples and the maximal tree depth was equal to 100;
SVM: radial basis function (RBF) kernel, SVM with cost 1.0 and regression loss epsilon 0.1, tolerance 0.001, and maximum 100 iterations;
kNN: the number of neighbours equal to four for LWR and two for HWr, by using an Euclidean metric and weights by distances;
NN: 95 neurons in the hidden layer, ReLu activation, Adam solver, and 300 maximum iterations.
The performance obtained by the mentioned models during the training step of the original calibration data is reported in Table 2. Although all machine learning techniques achieved good classification results, accuracy values greater than 95% were obtained by SVM, NN, and kNN (for the latter, as far as the HWR was concerned). In particular, these three models were characterized by accuracy values from 97.4% to 98.7% for the HWR, whereas SVM and NN showed better performances than kNN for the LWR (100% and 98.7% for the former, respectively, and 90.9% for the latter). The sensitivity and specificity values reported in Table 2 were calculated by considering that the target of machine learning techniques is to detect cancerous cells: therefore, healthy cells were considered as negative and cancerous cells as positive.
Comparative analyses of machine learning algorithms are becoming increasingly popular in the use of spectroscopic data for the purpose of classifying biological samples. In many of these comparative studies, neural-network-based techniques usually achieve excellent classification performances. JW Tang et al. compared 10 supervised machine learning methods on 2752 surface-enhanced Raman spectra (SERS) from 117 Staphylococcus strains belonging to 9 clinically important Staphylococcus species. This investigation was conducted in order to test the capacities of different machine learning methods for rapid bacterial differentiation and accurate prediction. They found that convolutional neural network (CNN) performed better with respect to other supervised machine learning methods in predicting Staphylococcus species via SERS spectra, achieving an accuracy value of 98.21% [46]. Recently, MG Fernandez-Manteca et al. applied many machine learning techniques for the classification of Candida species according to Raman spectra: they also found that the CNN algorithm achieved the greatest accuracy (91%) in the classification of a spectral dataset according to 11 classes [47]. Also, the SVM method was successfully used for the classification of spectra with good accuracy: D. Carvalho Caixeta et al. used the ATR-FTIR tool associated with the SVM classifier in order to detect modifications to salivary components to be used as biomarkers for the diagnosis of type 2 diabetes mellitus with an accuracy of 87% [48]. The SVM algorithm was also able to distinguish the Raman spectra of extracellular vesicles in the serum of cancer patients from those of healthy controls with a classification accuracy of 100% when reduced to the spectral frequency range from 1800 to 1940 cm−1, although the accuracy values significantly decreased to 67% and 57% when the complete Raman spectrum and FTIR spectrum, respectively, were used [49]. Good classification performances were also reported for the kNN model. In particular, accuracy values from 79% to 97% were reported for several kNN-based models in the classification of FTIR spectra measured for serum samples collected from healthy and ductal carcinoma patients [50]. The KNN classification model was also successfully applied to Raman spectra of tissue samples to diagnose lung cancer with an accuracy value of 97%, although it decreased to 90% for the discrimination of adenocarcinoma from squamous carcinoma samples [51]. Therefore, our results are in good agreement with those reported by other authors for similar models applied to the classification of vibrational spectra.
In fact, the SVM, NN, and kNN algorithms are characterized by high sensitivity values (from 97.6% to 100.0%) in both spectral ranges. Such values indicate a low missed diagnosis rate and, consequently, a reduced risk that the disease will not be diagnosed (and, therefore, the patient will not be treated and may progress to a more severe condition). As for specificity values, the SVM and NN methods performed better than the kNN and other models, particularly in the LWR, where specificity values of 97.1% to 100.0% were obtained, respectively. These values revealed a low misdiagnosis rate and, consequently, a low probability of patients receiving unnecessary treatments. Instead, the specificity value of the kNN algorithm was 94.3% in the HWR and even lower in the LWR (82.9%). Therefore, it can be deduced that the reduced accuracy of the kNN and other models with respect to SVM and NN in the LWR is mainly related to the specificity values. Indeed, the specificity values are slightly lower than the sensitivity values for all investigated models. By considering that, in our case, the specificity values depend on the ratio between the FTIR spectra evaluated as belonging to healthy cells with respect to those actually belonging to healthy cells, the lower specificity value is probably related to the greater dispersion of the absorption values in the healthy cell spectra compared to the cancerous spectra (see standard deviation values in Figure 1).
Overall, the values of the performance parameters reported in Table 2 suggest that the HWR can be reliably used to train classification models for colon cancer diagnosis. Nonetheless, it is characterized by a minor number of spectral features compared to the LWR. This is an interesting result, as it allows us to foresee the translation possibility of the FTIR technique and machine learning models in medical diagnostics. In fact, medical practice involves samples (cells, tissues) located on glass supports, which, from an optical point of view, are unusable in LWR due to the absorption of IR radiation by the glass in this spectral range.
To evaluate the eventual presence of overfitting and the loss of the ability to generalize the model predictions, we performed a re-training of the data after randomly varying the class labels of the spectral features from the calibration set. In this case, a good performance of the classification models would have been an index of the presence of overfitting due to spurious information unrelated to inter-class differences [47,52]. Conversely, the poor performance of the models applied to randomized class data indicate that the models applied to non-randomized original data assess differences which are actually related to different classes. The obtained results are shown in Table 3. It was reported that the obtained accuracy was close to 50% for most of the models. This low accuracy (close to chance) suggests a low degree of overfitting in the training step of the original data, and, consequently, it also suggests that the results shown in Table 2 are actually due to interclass differences. However, we noted that a relatively high sensitivity value was obtained from the SVM model. This indicates a tendency of the SVM model to overestimate the positivity of the data, i.e., the belonging of the spectral data to cancerous cells.
Therefore, after training the spectral data, it was found that the algorithm with the best performance regarding accuracy, sensitivity, and specificity values was the NN model. Hence, it is suitable for the identification of cancerous colon cells and their discrimination from healthy cells. The other models also showed good performances, even if inferior to that of the NN algorithm. The SVM model should be excluded, although it yielded an excellent performance regarding sensitivity when it was applied to randomized data.
To further assess the ability of machine learning models to classify colon cells into two types, i.e., healthy and cancerous, we tested the machine learning algorithms on a set of unknown FTIR spectra. The obtained values of the performance parameters are reported in Supplementary Materials Table S1 and Figure S1. In particular, the values of accuracy, sensitivity, and specificity obtained from the NN algorithm were excellent (100%) for both spectral ranges, and were comparable to those of Table 2. This is a further remark that rules out the presence of overfitting in the spectroscopic data and ensures that the developed NN classification model is able to generalize the results to unknown new data.

4. Conclusions

The obtained results point out that the FTIR spectra measured on cell samples are able to discriminate healthy colon cells from cancerous ones. Although the spectra are very similar, the analysis of the intensity of the absorption peaks highlights small differences mainly in the lipid content, which is greater in normal cells, and in the protein content, which is higher in cancerous cells. However, the intensity of specific absorption peaks is not a reliable parameter for spectral classification with high accuracy.
Therefore, we combined the measured FTIR spectra of healthy FHC cells and cancerous CaCo-2 cells with several machine learning algorithms in order to estimate the prediction capability of such models and possibly identify which of them is able to provide the best results regarding spectra classification, so that they can be proposed and translated in the clinical diagnostic field. The performance evaluation of the investigated algorithms was carried out in two successive steps. First, the whole FTIR spectra dataset was divided into a calibration set, including 70% of the spectra for the two cell types, and a test set, including the remaining 30% of the spectra. The first set had the role of allowing for a comparison between the various models, particularly regarding the classification accuracy. The second set served to confirm this accuracy for the models that offered the best performances during the first step.
The experimental results indicate that the classification accuracy was >87% for all of the investigated models in both LWR and HWR. In particular, the NN method was revealed to be the most effective, with an accuracy of 98.7%, a sensitivity of 100%, and a specificity of 97.1% in both spectral ranges. The SVM algorithm, which classified spectra with 100% accuracy, was not considered as a very reliable model for our data due to the high classification sensitivity of spectra whose classes were randomized. A significant result obtained from our experiments is that the classification performance was similar in the two spectral ranges. This is particularly important for the use of the FTIR technique in the diagnostic field, as the glass-based supports commonly used in medical practice are opaque to IR radiation in the LWR. Hence, FTIR reflection measurements are not possible in any range with biological samples on glass slides, whereas FTIR transmission measurements are possible only in the HWR. Nonetheless, the measurements carried out only in the latter range were sufficient for a correct classification of biological samples.
However, our investigation had some critical issues which should be overcome before considering the possibility of transferring the FTIR measurements and machine learning analysis from the research field to diagnostic practice. First, this study was based on cultured cell lines rather than cells from patients. Thus, this work can be considered as a proof of feasibility of the proposed diagnostic analysis, and further experiments should be performed involving cytological samples from hospital patients. Second, our method should be tested on samples characterized by pathologies other than colon cancer and/or characterized by different degrees of a certain pathology. Lastly, the investigation should include a classification of tissue and liquid biopsies in order to allow for a clear evaluation of how the method can be adopted in the clinical setting.

Supplementary Materials

The following supporting information can be downloaded at: https://www.mdpi.com/article/10.3390/app131810325/s1, Table S1: Performance parameters of algorithms for test set spectra; Figure S1: ROC curves and AUC parameters of algorithms for test set spectra.

Author Contributions

Conceptualization, G.P., C.G. and V.C.; methodology, G.P. and M.L.; software, C.G.; validation, G.P. and C.G.; formal analysis, G.P.; investigation, G.P. and M.L.; data curation, G.P. and C.G.; writing—original draft preparation, G.P.; writing—review and editing, G.P., C.G. and V.C.; supervision, V.C. All authors have read and agreed to the published version of the manuscript.

Funding

This research received no external funding.

Institutional Review Board Statement

Not applicable.

Informed Consent Statement

Not applicable.

Data Availability Statement

The data presented in this study are available upon request from the corresponding author.

Conflicts of Interest

The authors declare no conflict of interest.

References

  1. Available online: https://www.who.int/news-room/fact-sheets/detail/cancer (accessed on 31 July 2023).
  2. Nierengarten, M.B. Colonoscopy remains the gold standard for screening despite recent tarnish. Cancer 2023, 129, 330–331. [Google Scholar] [CrossRef] [PubMed]
  3. Rashmi, R.; Prasad, K.; Udupa, C.B.K. Breast histopathological image analysis using image processing techniques for diagnostic purposes: A methodological review. J. Med. Syst. 2022, 46, 7. [Google Scholar] [CrossRef] [PubMed]
  4. Baker, M.; Trevisan, J.; Bassan, P.; Bhargava, R.; Butler, H.J.; Dorling, K.M.; Fielden, P.R.; Fogarty, S.W.; Fullwood, N.J.; Martin, F.L.; et al. Using Fourier transform IR spectroscopy to analyze biological materials. Nat. Protoc. 2014, 9, 1771–1791. [Google Scholar] [CrossRef] [PubMed]
  5. Errico, S.; Moggio, M.; Diano, N.; Portaccio, M.; Lepore, M. Different experimental approaches for Fourier-transform infrared spectroscopy applications in biology and biotechnology: A selected choice of representative results. Biotechnol. Appl. Biochem. 2022, 70, 937–961. [Google Scholar] [CrossRef]
  6. De Bruyne, S.; Speeckaert, M.M.; Delanghe, J.R. Applications of mid-infrared spectroscopy in the clinical laboratory setting. Crit. Rev. Clin. Lab. Sci. 2018, 55, 1. [Google Scholar] [CrossRef]
  7. Gardner, P.; Lyang, F.; Gazi, E.; Moss, D. (Eds.) Preparation of Tissues and Cells for Infrared and Raman Spectroscopy and Imaging. In Synchrotron Radiation Infrared Microscopy: A Practical Approach, 1st ed.; Royal Society of Chemistry: London, UK, 2010; pp. 145–191. [Google Scholar]
  8. Song, C.L.; Kazarian, S.G. Micro ATR-FTIR spectroscopic imaging of colon biopsies with a large area Ge crystal. Spectrochim. Acta Part A Mol. Biomol. Spectrosc. 2020, 228, 117695. [Google Scholar] [CrossRef]
  9. Kaznowska, E.; Depciuch, J.; Szmuc, K.; Cebulski, J. Use of FTIR spectroscopy and PCA-LDC analysis to identify cancerous lesions within the human colon. J. Pharm. Biomed. Anal. 2017, 134, 259–268. [Google Scholar] [CrossRef]
  10. Tiwari, S.; Falahkheirkhah, K.; Cheng, G.; Bhargava, R. Colon Cancer Grading Using Infrared Spectroscopic Imaging-Based Deep Learning. Appl. Spectrosc. 2022, 76, 475–484. [Google Scholar] [CrossRef]
  11. Muniz, F.B.; de Freitas Oliveira Baffa, M.; Garcia, S.B.; Bachmann, L.; Felipe, J.C. Histopathological diagnosis of colon cancer using micro-FTIR hyperspectral imaging and deep learning. Comput. Methods Programs Biomed. 2023, 231, 107388. [Google Scholar] [CrossRef]
  12. Piva, J.A.D.A.C.; Silva, J.L.R.; Raniero, L.J.; Lima, C.S.P.; Arisawa, E.A.L.; Oliveira, C.D.; Canevari, R.D.A.; Ferreira, J.; Martin, A.A. Biochemical imaging of normal, adenoma, and colorectal adenocarcinoma tissues by fourier transform infrared spectroscopy (FTIR) and morphological correlation by histopathological analysis: Preliminary results. Rev. Bras. Eng. Biomed. 2015, 31, 10–18. [Google Scholar] [CrossRef]
  13. Khanmohammadi, M.; Garmarudi, A.B.; Ghasemi, K.; Jaliseh, H.K.; Kaviani, A. Diagnosis of colon cancer by attenuated total reflectance-Fourier transform infrared microspectroscopy and soft independent modeling of class analogy. Med Oncol. 2009, 26, 292–297. [Google Scholar] [CrossRef] [PubMed]
  14. Li, X.; Li, Q.B.; Zhang, G.J.; Xu, Y.Z.; Sun, X.J.; Shi, J.S.; Zhang, Y.F.; Wu, J.G. Identification of colitis and cancer in colon biopsies by Fourier Transform Infrared spectroscopy and chemometrics. Sci. World J. 2012, 2012, 936149. [Google Scholar] [CrossRef] [PubMed]
  15. Inan Genç, A.; Gok, S.; Banerjee, S.; Severcan, F. Valdecoxib recovers the lipid composition, order and dynamics in colon cancer cell lines independent of COX-2 expression: An ATR-FTIR spectroscopy study. Appl. Spectrosc. 2017, 71, 105–117. [Google Scholar] [CrossRef] [PubMed]
  16. Perna, G.; Capozzi, V.; Lasalvia, M. Classification of Healthy and Cancer Colon Cells Grown on Glass Coverslip by Means of Fourier Transform Infrared Spectroscopy and Multivariate Methods. Photonics 2023, 10, 481. [Google Scholar] [CrossRef]
  17. Varmuza, K.; Filzmoser, P. Introduction to Multivariate Statistical Analysis in Chemometrics; CRC Press: Boca Raton, FL, USA, 2009. [Google Scholar]
  18. Gautam, R.; Vanga, S.; Ariese, F.; Umapathy, S. Review of multidimensional data processing approaches for Raman and infrared spectroscopy. EPJ Techn. Instrum. 2015, 2, 8. [Google Scholar] [CrossRef]
  19. Morais, C.L.M.; Lima, K.M.G.; Singh, M.; Martin, F.L. Tutorial: Multivariate classification for vibrational spectroscopy in biological samples. Nat. Protoc. 2020, 15, 2143–2162. [Google Scholar] [CrossRef]
  20. Guo, S.; Popp, J.; Bocklitz, T. Chemometric analysis in Raman spectroscopy from experimental design to machine learning–based modeling. Nat Protoc. 2021, 16, 5426–5459. [Google Scholar] [CrossRef]
  21. Demsar, J.; Curk, T.; Erjavec, A.; Gorup, C.; Hocevar, T.; Milutinovic, M.; Mozina, M.; Polajnar, M.; Toplak, M.; Staric, A.; et al. Orange: Data Mining Toolbox in Python. J. Mach. Learn. Res. 2013, 14, 2349–2353. [Google Scholar]
  22. Swe, S.M.; Sett, K.M. Approaching Rules Induction: CN2 Algorithm in Categorizing of Biodiversity. Int. J. Trend Sci. Res. Dev. 2019, 3, 1581–1584. [Google Scholar]
  23. Heymann, F.; Bessa, R.; Liebensteiner, M.; Parginos, K.; Hinojar, J.C.M.; Duenas, P. Scarcity events analysis in adequacy studies using CN2 rule mining. Energy AI 2022, 8, 100154. [Google Scholar] [CrossRef]
  24. Clark, P.; Boswell, R. Rule Induction with CN2: Some Recent Improvements. In Machine Learning, Proceedings of the Fifth European Conference (EWSL-91), Porto, Portugal, 6–8 March 1991; Springer: Berlin/Heidelberg, Germany, 1991; pp. 151–163. [Google Scholar]
  25. Asaduzzaman, S.; Ahmed, M.R.; Rehana, H.; Chakraborty, S.; Islam, M.S.; Bhuiyan, T. Machine learning to reveal an astute risk predictive framework for Gynecologic Cancer and its impact on women psychology: Bangladeshi perspective. BMC Bioinform. 2021, 22, 213. [Google Scholar] [CrossRef] [PubMed]
  26. Mencar, C.; Gallo, C.; Mantero, M.; Tarsia, P.; Carpagnano, G.E.; Foschino Barbaro, M.P.; Lacedonia, D. Application of machine learning to predict obstructive sleep apnea syndrome severity. Health Inform. J. 2020, 26, 298–317. [Google Scholar] [CrossRef] [PubMed]
  27. Negoiţă, C.; Praisler, M. Logistic regression classification model identifying drugs of abuse based on their ATR-FTIR spectra: Case study on LASSO and Ridge regularization methods. In Proceedings of the 2019 6th International Symposium on Electrical and Electronics Engineering (ISEEE), Galati, Romania, 18–20 October 2019; pp. 1–4. [Google Scholar]
  28. Arévalo, L.A.; Antonova, O.; O’Brien, S.A.; Singh, G.P.; Seifert, A. Detection of Alzheimer’s by machine learning-assisted vibrational spectroscopy in human cerebrospinal fluid. J. Phys. Conf. Ser. 2022, 2407, 012026. [Google Scholar] [CrossRef]
  29. Myles, A.J.; Feudale, R.N.; Liu, Y.; Woody, N.A.; Brown, S.D. An introduction to decision tree modeling. J. Chemom. 2004, 18, 275–285. [Google Scholar] [CrossRef]
  30. Li, H.; Wang, S.; Zeng, Q.; Chen, C.; Lv, X.; Ma, M.; Su, H.; Ma, B.; Chen, C.; Fang, J. Serum Raman spectroscopy combined with multiple classification models for rapid diagnosis of breast cancer. Photodiagnosis Photodyn. Ther. 2022, 40, 103115. [Google Scholar] [CrossRef] [PubMed]
  31. Cui, G.; Peng, W.; Liu, Y. Diagnosis of hepatocellular carcinoma by FTIR spectroscopy combined with classification tree—Proc. SPIE 11566. In Proceedings of the AOPC 2020: Optical Spectroscopy and Imaging; and Biomedical Optics, Beijing, China, 5 November 2020. [Google Scholar]
  32. Chen, Y.; Su, Y.; Ou, L.; Zou, C.; Chen, Z. Classification of nasopharyngeal cell lines (C666-1, CNE2, NP69) via Raman spectroscopy and decision tree. Vib. Spectrosc. 2015, 80, 24–29. [Google Scholar] [CrossRef]
  33. Cortes, C.; Vapnik, V. Support-vector networks. Mach. Learn. 1995, 20, 273–297. [Google Scholar] [CrossRef]
  34. Dawuti, W.; Zheng, X.; Liu, H.; Zhao, H.; Dou, J.; Sun, L.; Chu, J.; Lin, R.; Lü, G. Urine surface-enhanced Raman spectroscopy combined with SVM algorithm for rapid diagnosis of liver cirrhosis and hepatocellular carcinoma. Photodiagnosis Photodyn. Ther. 2022, 38, 102811. [Google Scholar] [CrossRef]
  35. Ali, S.; Naveed, A.; Hussain, I.; Qazi, J. Use of ATR-FTIR spectroscopy to differentiate between cirrhotic/non-cirrhotic HCV patients. Photodiagnosis Photodyn. Ther. 2023, 42, 103529. [Google Scholar] [CrossRef]
  36. Parlatan, U.; Inanc, M.T.; Ozgor, B.Y.; Oral, E.; Bastu, E.; Unlu, M.B.; Basar, G. Raman spectroscopy as a non-invasive diagnostic technique for endometriosis. Sci. Rep. 2019, 9, 19795. [Google Scholar] [CrossRef]
  37. Prakisya, N.P.T.; Liantoni, F.; Hatta, P.; Aristyagama, Y.H.; Setiawan, A. Utilization of K-nearest neighbor algorithm for classification of white blood cells in AML M4, M5, and M7. Open Eng. 2021, 11, 662–668. [Google Scholar] [CrossRef]
  38. Gallo, C. Artificial neural networks tutorial. In Encyclopedia of Information Science and Technology, 3rd ed.; IGI Global: Hershey, PA, USA, 2015; pp. 6369–6378. [Google Scholar]
  39. De Souza, N.M.P.; Machado, B.H.; Padoin, L.V.; Prá, D.; Fay, A.P.; de Arruda Tomaz, M.; Corbellini, V.A.; Rieger, A. Discrimination of molecular subtypes of breast cancer with ATR-FTIR spectroscopy in blood plasma coupled with partial least square-artificial neural network discriminant analysis (PLS-ANNDA). Chemom. Intell. Lab. Syst. 2023, 237, 104826. [Google Scholar] [CrossRef]
  40. Podshyvalov, A.; Sahu, R.K.; Mark, S.; Kantarovich, K.; Guterman, H.; Goldstein, J.; Jagannathan, R.; Argov, S.; Mordechai, S. Distinction of cervical cancer biopsies by use of infrared microspectroscopy and probabilistic neural networks. Appl. Opt. 2005, 44, 3725–3734. [Google Scholar] [CrossRef] [PubMed]
  41. Zeaiter, M.; Rutledge, D. Preprocessing methods. In Comprehensive Chemometrics: Chemical and Biochemical Data Analysis; Brown, S.D., Tauler, R., Walczak, B., Eds.; Elsevier: Amsterdam, The Netherlands, 2009; Volume 3, pp. 121–231. [Google Scholar]
  42. Talari, A.C.S.; Martinez, M.A.G.; Movasaghi, Z.; Rehman, S. Advances in Fourier transform infrared (FTIR) spectroscopy of biological tissues. Appl. Spectrosc. Rev. 2017, 52, 456–506. [Google Scholar] [CrossRef]
  43. Dong, L.; Sun, X.; Chao, Z.; Zhang, S.; Zheng, J.; Gurung, R.; Du, J.; Shi, J.; Xu, Y.; Zhang, Y.; et al. Evaluation of FTIR spectroscopy as diagnostic tool for colorectal cancer using spectral analysis. Spectrochim. Acta Part A Mol. Biomol. Spectrosc. 2014, 122, 288–294. [Google Scholar] [CrossRef]
  44. De Santis, S.; Porcelli, F.; Sotgiu, G.; Crescenzi, A.; Ceccucci, A.; Verri, M.; Caricato, M.; Taffon, C.; Orsini, M. Identification of remodeled collagen fibers in tumor stroma by FTIR Micro-spectroscopy: A new approach to recognize the colon carcinoma. Biochim. Biophys. Acta (BBA) Mol. Basis Dis. 2022, 1868, 166279. [Google Scholar] [CrossRef]
  45. Brozek-Pluska, B. Statistics assisted analysis of Raman spectra and imaging of human colon cell lines—Label free, spectroscopic diagnostics of colorectal cancer. J. Mol. Struct. 2020, 1218, 128524. [Google Scholar] [CrossRef]
  46. Jia-Wei, T.; Qing-Hua, L.; Xiao-Cong, Y.; Ya-Cheng, P.; Peng-Bo, W.; Xin, L.; Xing-Xing, K.; Bing, G.; Zuo-Bin, Z.; Liang, W. Comparative Analysis of Machine Learning Algorithms on Surface Enhanced Raman Spectra of Clinical Staphylococcus Species. Front. Microbiol. 2021, 12, 696921. [Google Scholar]
  47. Fernández-Manteca, M.G.; Ocampo-Sosa, A.A.; de Alegría-Puig, C.R.; Roiz, M.P.; Rodríguez-Grande, J.; Madrazo, F.; Calvo, J.; Rodríguez-Cobo, L.; López-Higuera, J.M.; Fariñas, M.C.; et al. Automatic classification of Candida species using Raman spectroscopy and machine learning. Spectrochim. Acta Part A Mol. Biomol. Spectrosc. 2023, 290, 122270. [Google Scholar] [CrossRef]
  48. Caixeta, D.C.; Carneiro, M.G.; Rodrigues, R.; Alves, D.C.T.; Goulart, L.R.; Cunha, T.M.; Espindola, F.S.; Vitorino, R.; Sabino-Silva, R. Salivary ATR-FTIR Spectroscopy Coupled with Support Vector Machine Classification for Screening of Type 2 Diabetes Mellitus. Diagnostics 2023, 13, 1396. [Google Scholar] [CrossRef]
  49. Uthamacumaran, A.; Elouatik, S.; Abdouh, M.; Berteau-Rainville, M.; Gao, Z.H.; Arena, G. Machine learning characterization of cancer patients-derived extracellular vesicles using vibrational spectroscopies: Results from a pilot study. Appl. Intell. 2022, 52, 12737–12753. [Google Scholar] [CrossRef]
  50. Du, Y.; Xie, F.; Wu, G.; Chen, P.; Yang, Y.; Yang, L.; Yin, L.; Wang, S. A classification model for detection of ductal carcinoma in situ by Fourier transform infrared spectroscopy based on deep structured semantic model. Anal. Chim. Acta 2023, 1251, 340991. [Google Scholar] [CrossRef]
  51. Zheng, Q.; Li, J.; Yang, L.; Zheng, B.; Wang, J.; Lv, N.; Luo, J.; Martin, F.L.; Liu, D.; He, J. Raman spectroscopy as a potential diagnostic tool to analyse biochemical alterations in lung cancer. Analyst 2019, 145, 385–392. [Google Scholar] [CrossRef] [PubMed]
  52. Ojala, M.; Garriga, G.C. Permutation tests for studying classifier performance. J. Mach. Learn. Res. 2010, 11, 6. [Google Scholar]
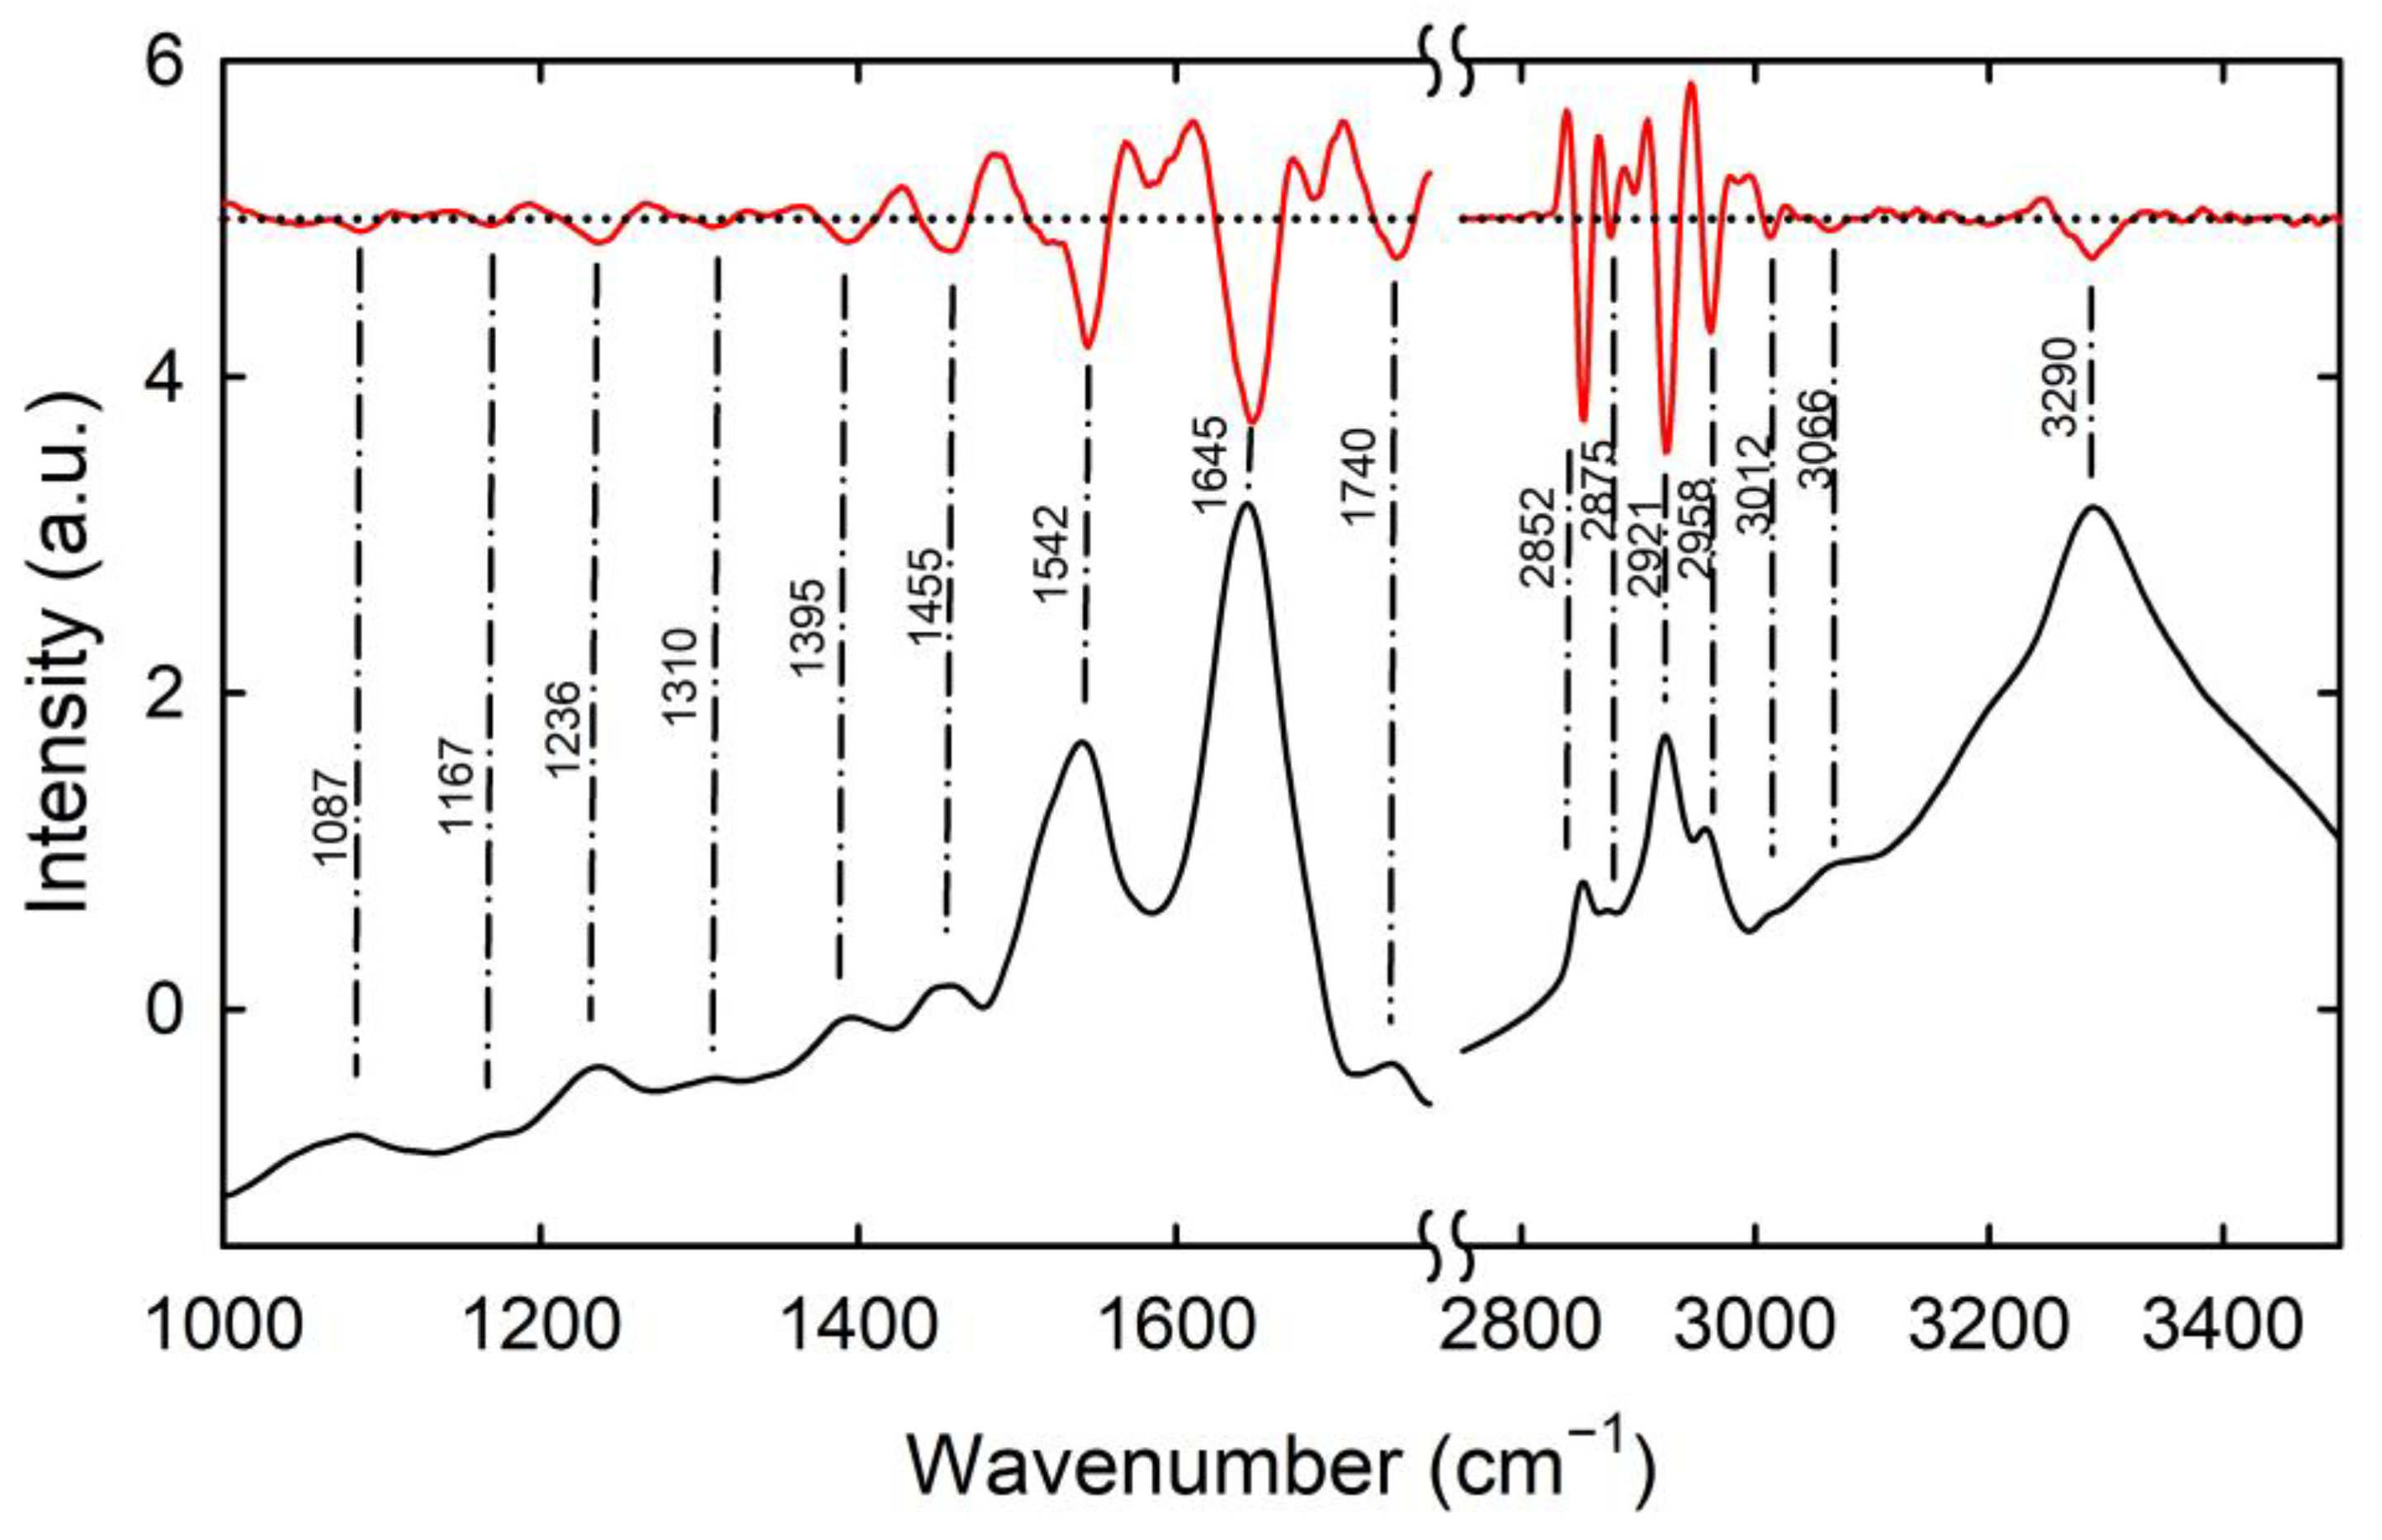
Figure 1. Mean FTIR spectra of healthy FHC (continuous black line) and cancerous CaCo-2 (continuous blue line) cells of the calibration set after SNV normalisation. Standard deviation spectra are also reported as dashed lines. The assignment of some evident vibrational peaks to cell components is also reported. The spectra have been vertically shifted for clarity.
Applsci 13 10325 g001
Figure 2. Mean FTIR spectrum of healthy FHC cells (black lines) after the SNV normalisation. The spectral position of the absorption features, as deduced by minima of the second derivative spectra (red continuous lines), is indicated by dash-dotted lines. The wavenumber position is reported for each spectral feature. The spectra have been vertically shifted for clarity purposes.
Applsci 13 10325 g002
Figure 3. Distribution of intensity values of some spectral features due to the lipid ((a) 1740 cm−1 and (b) 2921 cm−1), protein ((c) 1542 cm−1 and (d) 1645 cm−1), and DNA ((e) 1087 cm−1 and (f) 1236 cm−1) components of healthy (black dots) and cancerous (blue dots) colon cells. The corresponding box plots of each distribution are shown on the right-hand side.
Applsci 13 10325 g003
Table 1. Assignment of FTIR spectral structures, according to previous results reported in the literature [42] and in the present investigation.
Spectral Position (cm−1)Assignment
1087symmetric PO2 stretching of nucleic acids
1167C-OH stretching of proteins
1236asymmetric PO2 stretching of nucleic acids
1310amide III of proteins
1395COO stretching of proteins and lipids
1455CH3 bending of proteins and lipids
1542amide II of proteins
1645amide I of proteins
1740C=O stretching of lipids
2852symmetric CH2 stretching of lipids
2875symmetric CH3 stretching of proteins and lipids
2921asymmetric CH2 stretching of lipids
2958asymmetric CH3 stretching of proteins and lipids
3012CH stretching of lipids
3066N-H stretching of amide B
3290N-H stretching of amide A
Table 2. Performance parameters obtained by applying the investigated classification algorithms to the original calibration set of FTIR spectra of healthy and cancerous colon cells, measured in the low-wavenumber range (LWR) and high-wavenumber range (HWR).
Algorithm
(Original Data)
Accuracy LWR (%)Accuracy HWR (%)Sensitivity LWR (%)Sensitivity HWR (%)Specificity LWR (%)Specificity HWR (%)
kNN90.997.797.6100.082.994.3
LR94.893.595.295.294.391.4
CT87.094.888.195.285.794.3
CN2-RI90.989.695.295.285.782.9
SVM100.097.4100.097.6100.097.1
NN98.798.7100.0100.0100.097.1
Table 3. Performance parameters obtained by applying the investigated classification algorithms to the calibration set of FTIR spectra of healthy and cancerous colon cells, measured in the low-wavenumber range (LWR) and high-wavenumber range (HWR), after randomization of the class labels.
Algorithm
(Randomized Data)
Accuracy LWR (%)Accuracy HWR (%)Sensitivity LWR (%)Sensitivity HWR (%)Specificity LWR (%)Specificity HWR (%)
kNN45.551.957.152.431.451.4
LR54.550.664.364.342.934.3
CT51.953.261.959.540.045.7
CN2-RI49.446.854.850.042.942.9
SVM51.954.573.878.625.725.7
NN50.657.150.064.351.448.6
Disclaimer/Publisher’s Note: The statements, opinions and data contained in all publications are solely those of the individual author(s) and contributor(s) and not of MDPI and/or the editor(s). MDPI and/or the editor(s) disclaim responsibility for any injury to people or property resulting from any ideas, methods, instructions or products referred to in the content.

