Article

Study of the Relationship between Mode I Fracture Toughness and Rock Brittleness Indices

1
Department of Mining, Petroleum and Metallurgical Engineering, Faculty of Engineering, Cairo University, Giza 12613, Egypt
2
Department of Civil, Chemical, Environmental, and Materials Engineering, University of Bologna, 40136 Bologna, Italy
*
Author to whom correspondence should be addressed.
Appl. Sci. 2023, 13(18), 10378; https://doi.org/10.3390/app131810378
Submission received: 6 August 2023 / Revised: 7 September 2023 / Accepted: 12 September 2023 / Published: 16 September 2023

Abstract

:
Mode I fracture toughness (KIC) and rock brittleness are important properties that influence many rock engineering applications. Due to the difficulties in determining KIC experimentally, previous studies have investigated the relationship between KIC and rock brittleness indices. However, only rock brittleness indices (based on strength parameters) and KIC obtained from Chevron Bend and Short Rod test methods were considered. In this paper, regression analysis was carried out to investigate the relationship between KIC and rock brittleness using literature data collected from different rock types and core KIC test methods under level I and static test conditions. Rock brittleness was assessed using ten indices based on strength and pre-peak elastic parameters. The results showed that elastic-based indices were not good predictors of KIC, while strength-based indices correlated well with KIC. A comparison with previous studies revealed that the correlations between KIC and strength-based indices were significantly sensitive to the rock type, i.e., soft or hard, and the KIC test method. However, a brittleness index, based on both strength and pre-peak elastic parameters, was found to be the best index to predict KIC because of its lower sensitivity to the test method and rock type.

1. Introduction

Rock fracture toughness is an essential property in fracture mechanics [1]. It represents the rock’s resistance to fractures’ propagation. Following fracture mechanics principles, structures’ safety depends mainly on three factors: applied stresses, construction material’s fracture toughness and material flaws’ size [2]. In general, rocks are inhomogeneous, non-continuous and anisotropic, and they contain macro-scale and micro-scale flaws. Thus, studying rock fracture toughness is vital in many engineering applications, particularly where the role of natural discontinuities or generated fractures is significant. Rock fracture toughness was used to predict the power consumption of cone crushers for twelve rocks [3]. Moreover, rock fracture toughness plays an important role in the extraction of ornamental stone blocks, particularly hard stones such as granite, using Soundless Cracking Demolition Agents (SCDAs). The optimum hole spacing, in drilling patterns, was investigated in order to optimize the extraction process [4]. Compared to the empirical equations where spacing is determined in terms of hole diameter, it was concluded that additional rock properties such as Young’s modulus and fracture toughness must be considered. Moreover, the fracture growth between two holes filled with SCDAs was investigated in [5]. Considering Linear Elastic Fracture Mechanics (LEFM) principles, an algorithm was suggested to estimate the first fracture length due to the increasing expansive pressure, in terms of rock fracture toughness, in [5]. The effect of thermal cycling, up to 300 °C and 20 cycles, on the fracture characteristics of Suizhou granite (from China) located at a potential site for an Enhanced Geothermal System (EGS) was investigated in [6]. In the EGS, a fluid is injected into a fracture network artificially formed in a low-porosity and impermeable hot dry rock, such as granite. Hence, the rock is subjected to repeated heating–cooling thermal cycles. It was found that fracture toughness decreased with the number of thermal cycles and the temperature due to thermally induced micro-damages. Similarly, the variation in fracture toughness with temperature, up to 600 °C, was studied for three crystalline rocks collected from Deccan Volcanic Province, Western India where there was an interest in developing geothermal energy projects [7]. A negative effect of temperature on rock fracture toughness was reported due to the development of micro-cracks as a result of the differential stresses at the grain boundaries. As the treatment temperature increased, micro-crack density increased and pre-existing cracks became wider, resulting in irreversible thermal damages and leading to an extreme reduction in stiffness [7].
Propagation modes of fractures include mode I (opening or tension), mode II (in plane shear) and mixed mode or mode III (out of plane shear) [2]. It was believed that, in practical applications, fractures propagate under the mixed mode [8]. However, mode I fracture toughness (KIC) was the most critical parameter because rocks were more vulnerable to tensile loads compared to shear loads [9].
Many KIC test methods have been suggested in the scientific literature. They are classified into non-core and core test methods. Non-core methods include three-point and four-point bending tests. These methods, unlike core test methods, need relatively large rectangular samples that cannot be usually obtained within a usual rock testing program [10]. In this paper, only core test methods are considered, because their geometry is the easiest obtainable geometry particularly at great depths. The most commonly known core test methods are those suggested by the ISRM: Chevron Bend (CB) [11], Short Rod (SR) [11], Cracked Chevron Notched Brazilian Disc (CCNBD) [12]; and Semi-Circular Bend (SCB) [13]. For CB and SR methods, tests can be carried out while recording only maximum load, i.e., level I, or while recording the load and displacement, i.e., level II, to account for rock non-linearity [11]. Tests for KIC determination are sometimes demanding because of the absence of suitable samples in terms of number and size, challenging sample preparation procedures as well as complicated, expensive and time-consuming testing procedures. Hence, KIC prediction, in terms of rock properties, can substitute testing when needed [7,14,15]. Many researchers have suggested empirical formulas for the KIC estimation, in terms of rock properties such as Tensile Strength (TS) [9,16], Uniaxial Compressive Strength (UCS) [14,17], point Load Strength [18], Young’s modulus [17,19], Poisson’s ratio [17], P-wave velocity [14,17,20], S-wave velocity, density [14,17,21], porosity [17] and permeability [6].
Moreover, researchers have investigated the correlation between KIC and rock brittleness [22,23,24]. Rock brittleness can be defined as “Failure by fracture at or only slightly beyond the yield stress” [22] or “it is a property of materials that rupture or fracture with little or no plastic flow” [23]. Rock brittleness plays an important role in assessing the performance of several rock engineering applications. A rock brittleness index (i.e., the ratio of UCS to TS) was utilized at Sanshandao gold mine, in China, as an empirical indicator of rock burst possibility where a strong burst tendency was reported [25]. Moreover, this index was used to assess rock burst for 102 case studies from fourteen hard rock mines located in Italy, Russia and China [26]. However, it was recommended that this index cannot be solely used in rock burst tendency prediction, because it considered only the rock’s strength properties and it had low prediction accuracy [26,27]. The effect of ornamental stones’ brittleness on the production rate of circular sawing machines for seventeen different Iranian granitic and carbonate stones was investigated in [28]. The stones’ brittleness was assessed using three different strength-based indices in terms of UCS and TS. Although good correlations were found between the three indices and the production rate, it was concluded that the brittleness index (represented as 0.5*UCS*TS) was the best index to predict the production rate. Because, unlike the other indices, this brittleness index showed good correlation with the production rates of the combined data for granitic and carbonate ornamental stones, it can be used to predict the production rates for all types of Iranian ornamental stones [28]. The correlation between rock brittleness indices and the penetration rate of four different types of drilling operations, i.e., Tunnel Boring Machine (TBM), diamond, percussive and rotary, was investigated using literature data in [29]. Varying correlation significances were reported that depended on the used index and drilling methods. So, it was concluded that assessing the performance of rock excavation operations using a rock brittleness index depended on the practical application, e.g., brittleness index, that considered that impact strength parameters may be more suitable for the prediction of percussive drilling penetration rate [29]. Similarly, the effect of rock brittleness on the penetration rate for percussive, rotary and Down The Hole (DTM) drilling operations was investigated using literature data for different types of rocks having varying strength in [30]. Using multiple regression, three equations were proposed, one for each drilling type, to predict the penetration rate using three strength-based brittleness indices [30].
KIC test methods assumed that rock fractures followed LEFM principles, which applied only to brittle fracturing that has a very small Fracture Process Zone (FPZ) at the fracture tip. Rocks generally exhibit quasi-brittle fracturing (a general type of brittle fractures), which has a significant FPZ [31,32]. FPZ size is controlled by several factors such as rock petrological properties, specimen geometries, test method and loading conditions. [31,33].
Accordingly, the obtained KIC values from tests may not represent the true KIC. For Mancos shale (from the USA), the LEFM assumption was invalid due to its inelastic behavior, so level II testing was carried out to estimate a fracture toughness correction factor. A significant inelasticity was reported such that the fracture toughness correction factor varied from 1.49 to 1.83 [34]. The Mode I failure mechanism of five rock types was investigated in [35]. It was concluded that KIC measurement was more accurate for brittle rocks compared to soft rocks; therefore, two KIC—tensile strength formulas were proposed corresponding to brittle and inelastic behaviors, because a significantly large FPZ, compared to the sample size, could result in failure due to loss of strength rather than fracture propagation [36,37]. A size effect law was suggested to quantitatively represent the FPZ effect on the failure mechanism of samples, in order to obtain the true size-dependent KIC [38]. The size law effect was applied to different geo-materials in [36,39,40]. Moreover, the effect of samples’ size on the fracturing behavior of concrete was investigated in [41].
Rock brittleness can assess how brittle rock fractures would be and hence how applicable the LEFM assumption would be. Many researchers have suggested various brittleness indices for different rock engineering applications. Rock brittleness indices can be classified based on the parameters used in their estimation such as strength parameters, stress–strain curve parameters, elastic parameters, mineralogy and indentation characteristics [42,43]. Moreover, various formulas of a non-dimensional parameter called “brittleness number” were suggested in [36,37,44]. These formulas described the brittleness behavior of geo-materials quantitatively taking into account either the sample size or the FPZ size. The brittleness number suggested in [36] was independent of the sample geometrical shape unlike Carpinteri’s brittleness number proposed in [44] that was suggested for a notched beam sample under three-point bending (i.e., non-core test method) [36]. These brittleness numbers were not considered in this paper, because only core test methods were considered, and sample dimensions and peak loads were not available. Furthermore, there were not enough data available for each rock considering each test method to estimate the brittleness number suggested in [36].
In the literature, a few studies have focused on the relationship between KIC and rock brittleness indices. The correlations between KIC and two strength-based indices were investigated using two separate literature datasets [22]. In these datasets, KIC results were obtained from two different test methods, i.e., CB and SR. Significant relationships between KIC and a brittleness index represented as (0.5*UCS*TS) were reported [22]. The relationships between KIC and three strength-based rock brittleness indices were studied in [23] using the same literature data used in [22]. There were good correlations between KIC and only one brittleness index represented as (√ (0.5*UCS*TS)); however, more investigations were recommended to obtain a general relationship for other rock types. It should be noted that, in [22] and [23], the literature datasets were analyzed separately, and thus the effect of the KIC test method on the KIC-rock brittleness relationship was considered explicitly. Moreover, the correlations between KIC and four strength-based indices were investigated in [24]. Three of these strength-based indices were the same as those investigated previously in [22] and [23]. Similar to [22] and [23], literature data were used to investigate the correlations, although this was a different dataset with most of the KIC data obtained from the CB test [24]. Significant correlations with only two indices, represented as (0.5*UCS*TS) and ((UCS*TS)0.72), were reported. Using a probabilistic approach, a new brittleness index was suggested, which provided a more accurate KIC estimation [24]. The grain size effect on a strength-based rock brittleness index, i.e., (0.5*UCS*TS), was investigated for three granite types with small, medium and large grain sizes in [45]. A proportional trend between the brittleness index and the grain size was reported.
In these studies, only strength-based brittleness indices were considered in addition to the literature data used in [22,23], which were identical, and CB was the dominant KIC test method in [22,23,24]. So, it would be interesting to investigate the correlation between KIC and strength-based indices using an extended and updated dataset considering various KIC test methods and rock types (i.e., different properties) in an attempt to generalize the KIC—rock brittleness relationship as suggested in [23]. Furthermore, elastic-based brittleness indices, i.e., in terms of Young’s modulus and Poisson’s ratio, can provide a more accurate relationship when considering other, less brittle rock types, such as shale rocks [43].
This paper investigated the correlation between rock brittleness and the apparent KIC, i.e., obtained from tests, using literature data in order to obtain a general relationship between rock brittleness and KIC. Literature data were collected for different rock types and core test methods under level I and static testing conditions. Only core test methods were considered, because the core sample is the most obtainable sample geometry particularly at great depths. Rock brittleness was assessed using ten indices based on strength and pre-peak elastic parameters. The correlation between KIC and elastic-based indices has not been considered before in the literature, to the best of the authors’ knowledge. We believe that investigating the relationship between KIC and rock brittleness could be helpful in assessing the stability of rock structures and/or the performance of rock engineering operations. Furthermore, such a relationship can estimate KIC with a good accuracy, using more common rock properties, where testing is not feasible.

2. Materials and Methods

The relationships between KIC and rock brittleness indices were deduced based on regression analysis of literature data (Table 1) using exponential, linear, logarithmic and power models. Regression analysis was carried out using R [46] and R packages [47,48,49]. Literature data were collected from various references such that different rock types, i.e., soft and hard, and core KIC test methods can be represented. In the literature data, rocks from different countries were considered such as China [6,19,50,51,52,53,54], UK [18], Australia [55,56], Japan [57,58], USA [59], Canada [59] and Turkey [10,60,61]. Static and level I testing conditions were considered in this study because they are the most common and simplest conditions for KIC testing. Where weak rocks or not enough samples (in number and size) were present, test methods that require large sample sizes such as CB and SECRBB may not be a feasible choice. So, it was vital to consider additional test methods such as CCNBD and SCB that require a significantly smaller sample size. Furthermore, considering different rock types would help generalize the KIC—rock brittleness relationship.
Rock brittleness was assessed using ten indices (Table 2), which were either based on strength parameters, i.e., Equations (1)–(4) and (9), or pre-peak elastic parameters, i.e., Equations (5)–(8), or both, i.e., Equation (10).
In general, rock brittleness indices were chosen such that they can be estimated using rock properties common in most rock testing programs, i.e., UCS, TS, Young’s modulus and Poisson’s ratio. In this study, the considered brittleness indices (B1, B2, B3, B4, B9 and B10), in Table 2, were the same as those previously studied in [22,23,24]. In this way, the effect of considering additional KIC test methods, i.e., other than CB or SR, on the KIC—rock brittleness indices relationships could be investigated. Although strength-based indices B1, B2, B3 and B4 were used by many researchers due to their simplicity, they were criticized for not reflecting rock brittleness but rather the rock strength [42,43]. Nonetheless, they, particularly indices B3 and B4, were used to assess the performance of different rock operations such as ornamental stone production rate [28], rock burst tendency [25,26] and drilling operations [29,30,62]. Index B9 was proposed in [62] to assess the performance of drilling operations for thirty-two rocks from Turkey and Norway. It was concluded that B9 had good correlation with the drilling operation performance [62]. Moreover, Index B10 was proposed in [24] for KIC perdition when rocks with significant pre-fracture plastic deformation were considered. However, it was argued that it has no physical meaning in [43].
Elastic-based indices (B5, B6, B7 and B8) defined rock brittleness in terms of only pre-peak elastic parameters, i.e., Young’s modulus and Poisson’s ratio. They were mainly utilized in quantifying the brittleness of reservoirs, e.g., shale formations, in the oil and gas exploitation operations. These indices assumed that rocks with high Young’s modulus and small Poisson’s ratio would be more brittle. However, they showed contradicting results for different shale formations so it was recommended that they may not represent the brittleness of all shale rocks with the same accuracy [43].

3. Results

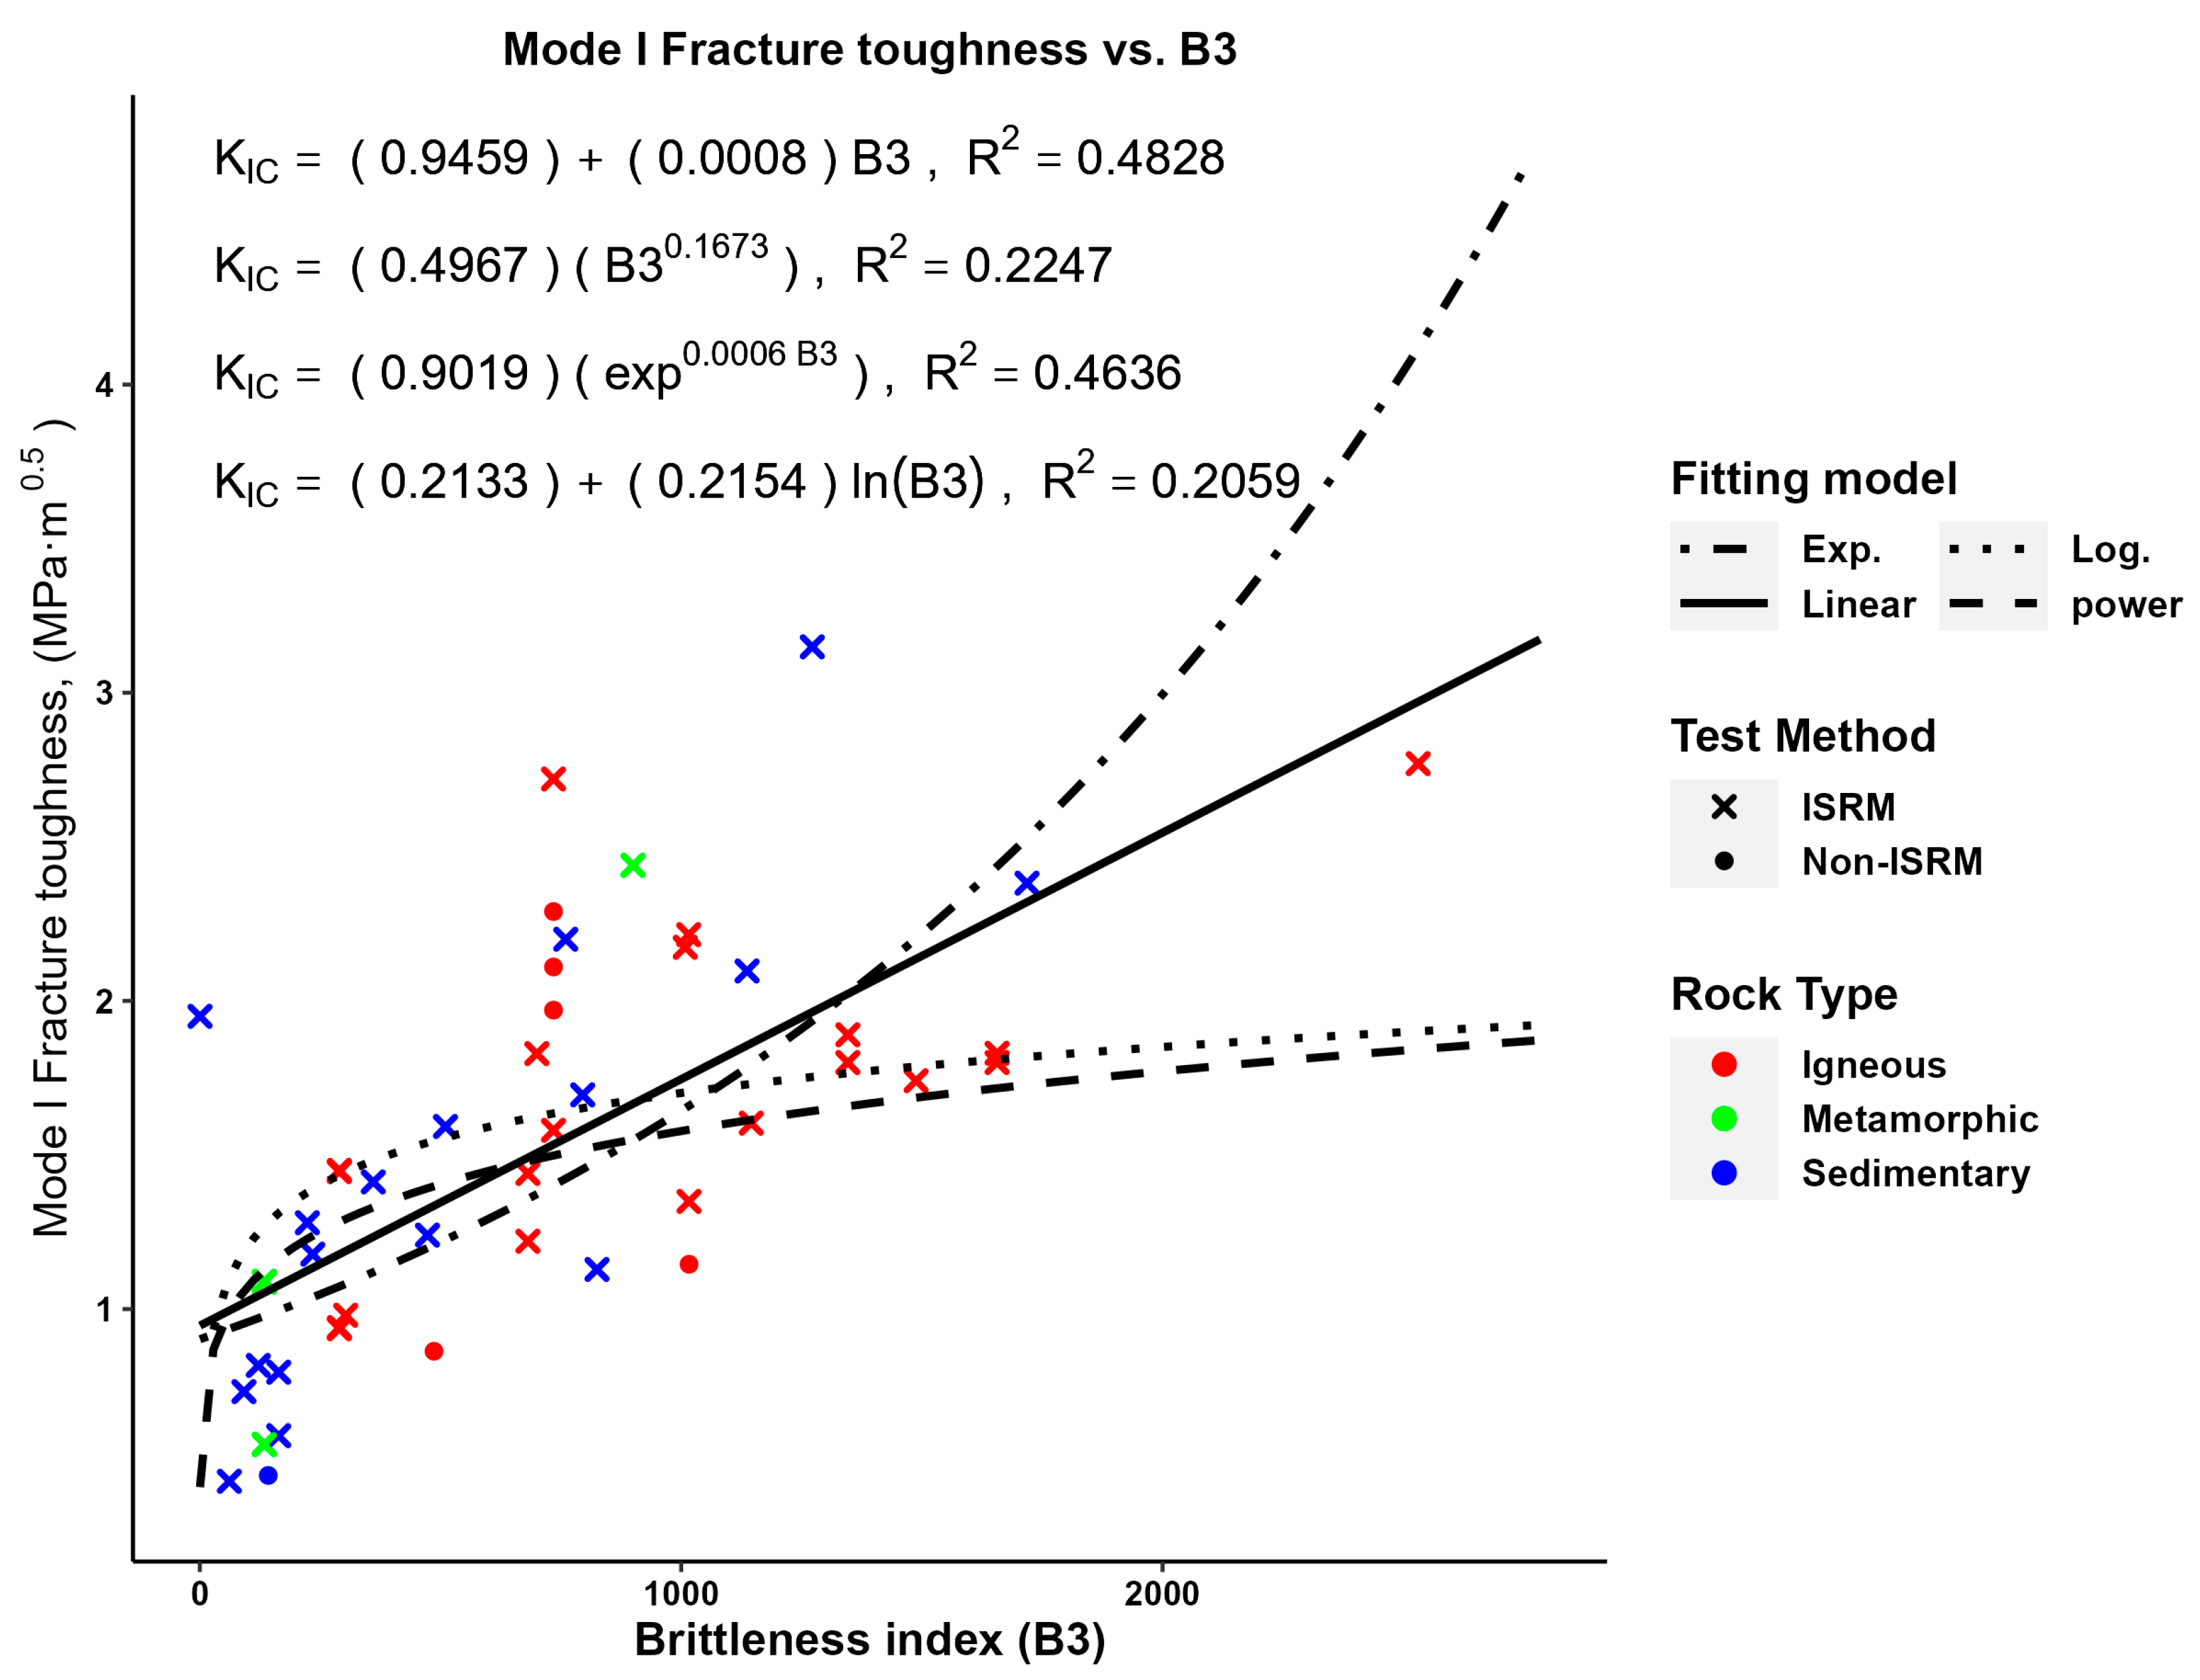
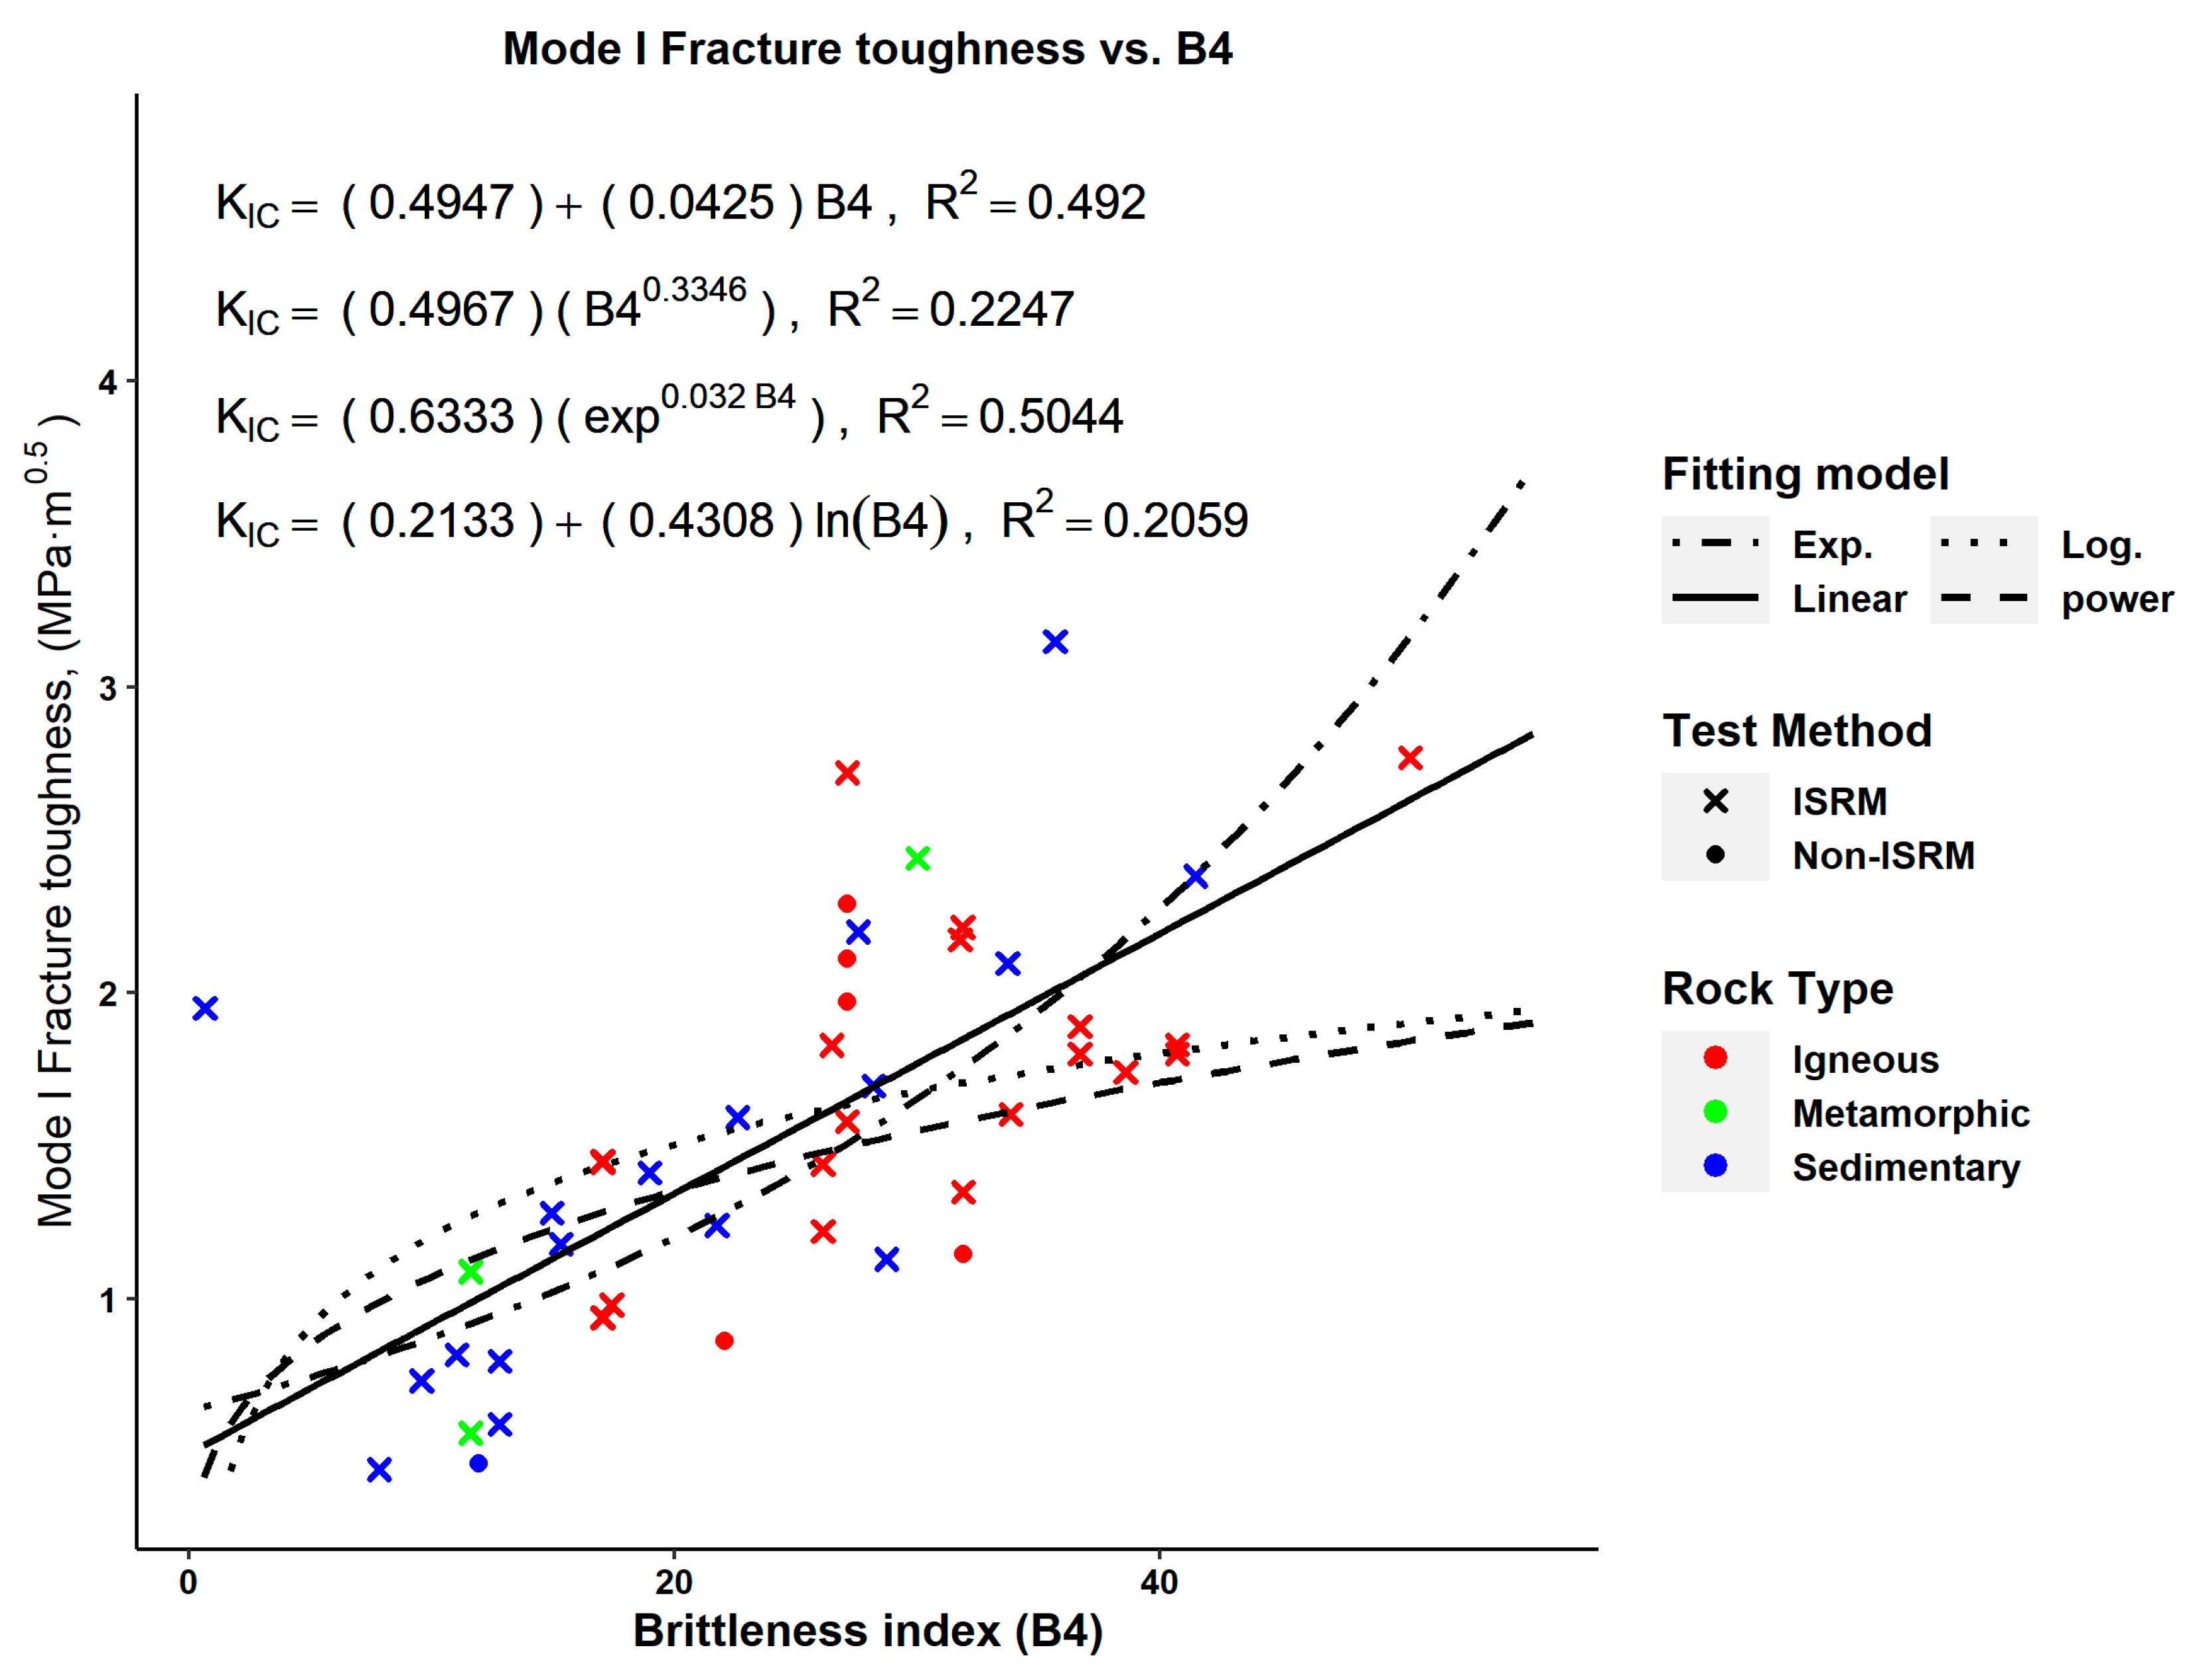
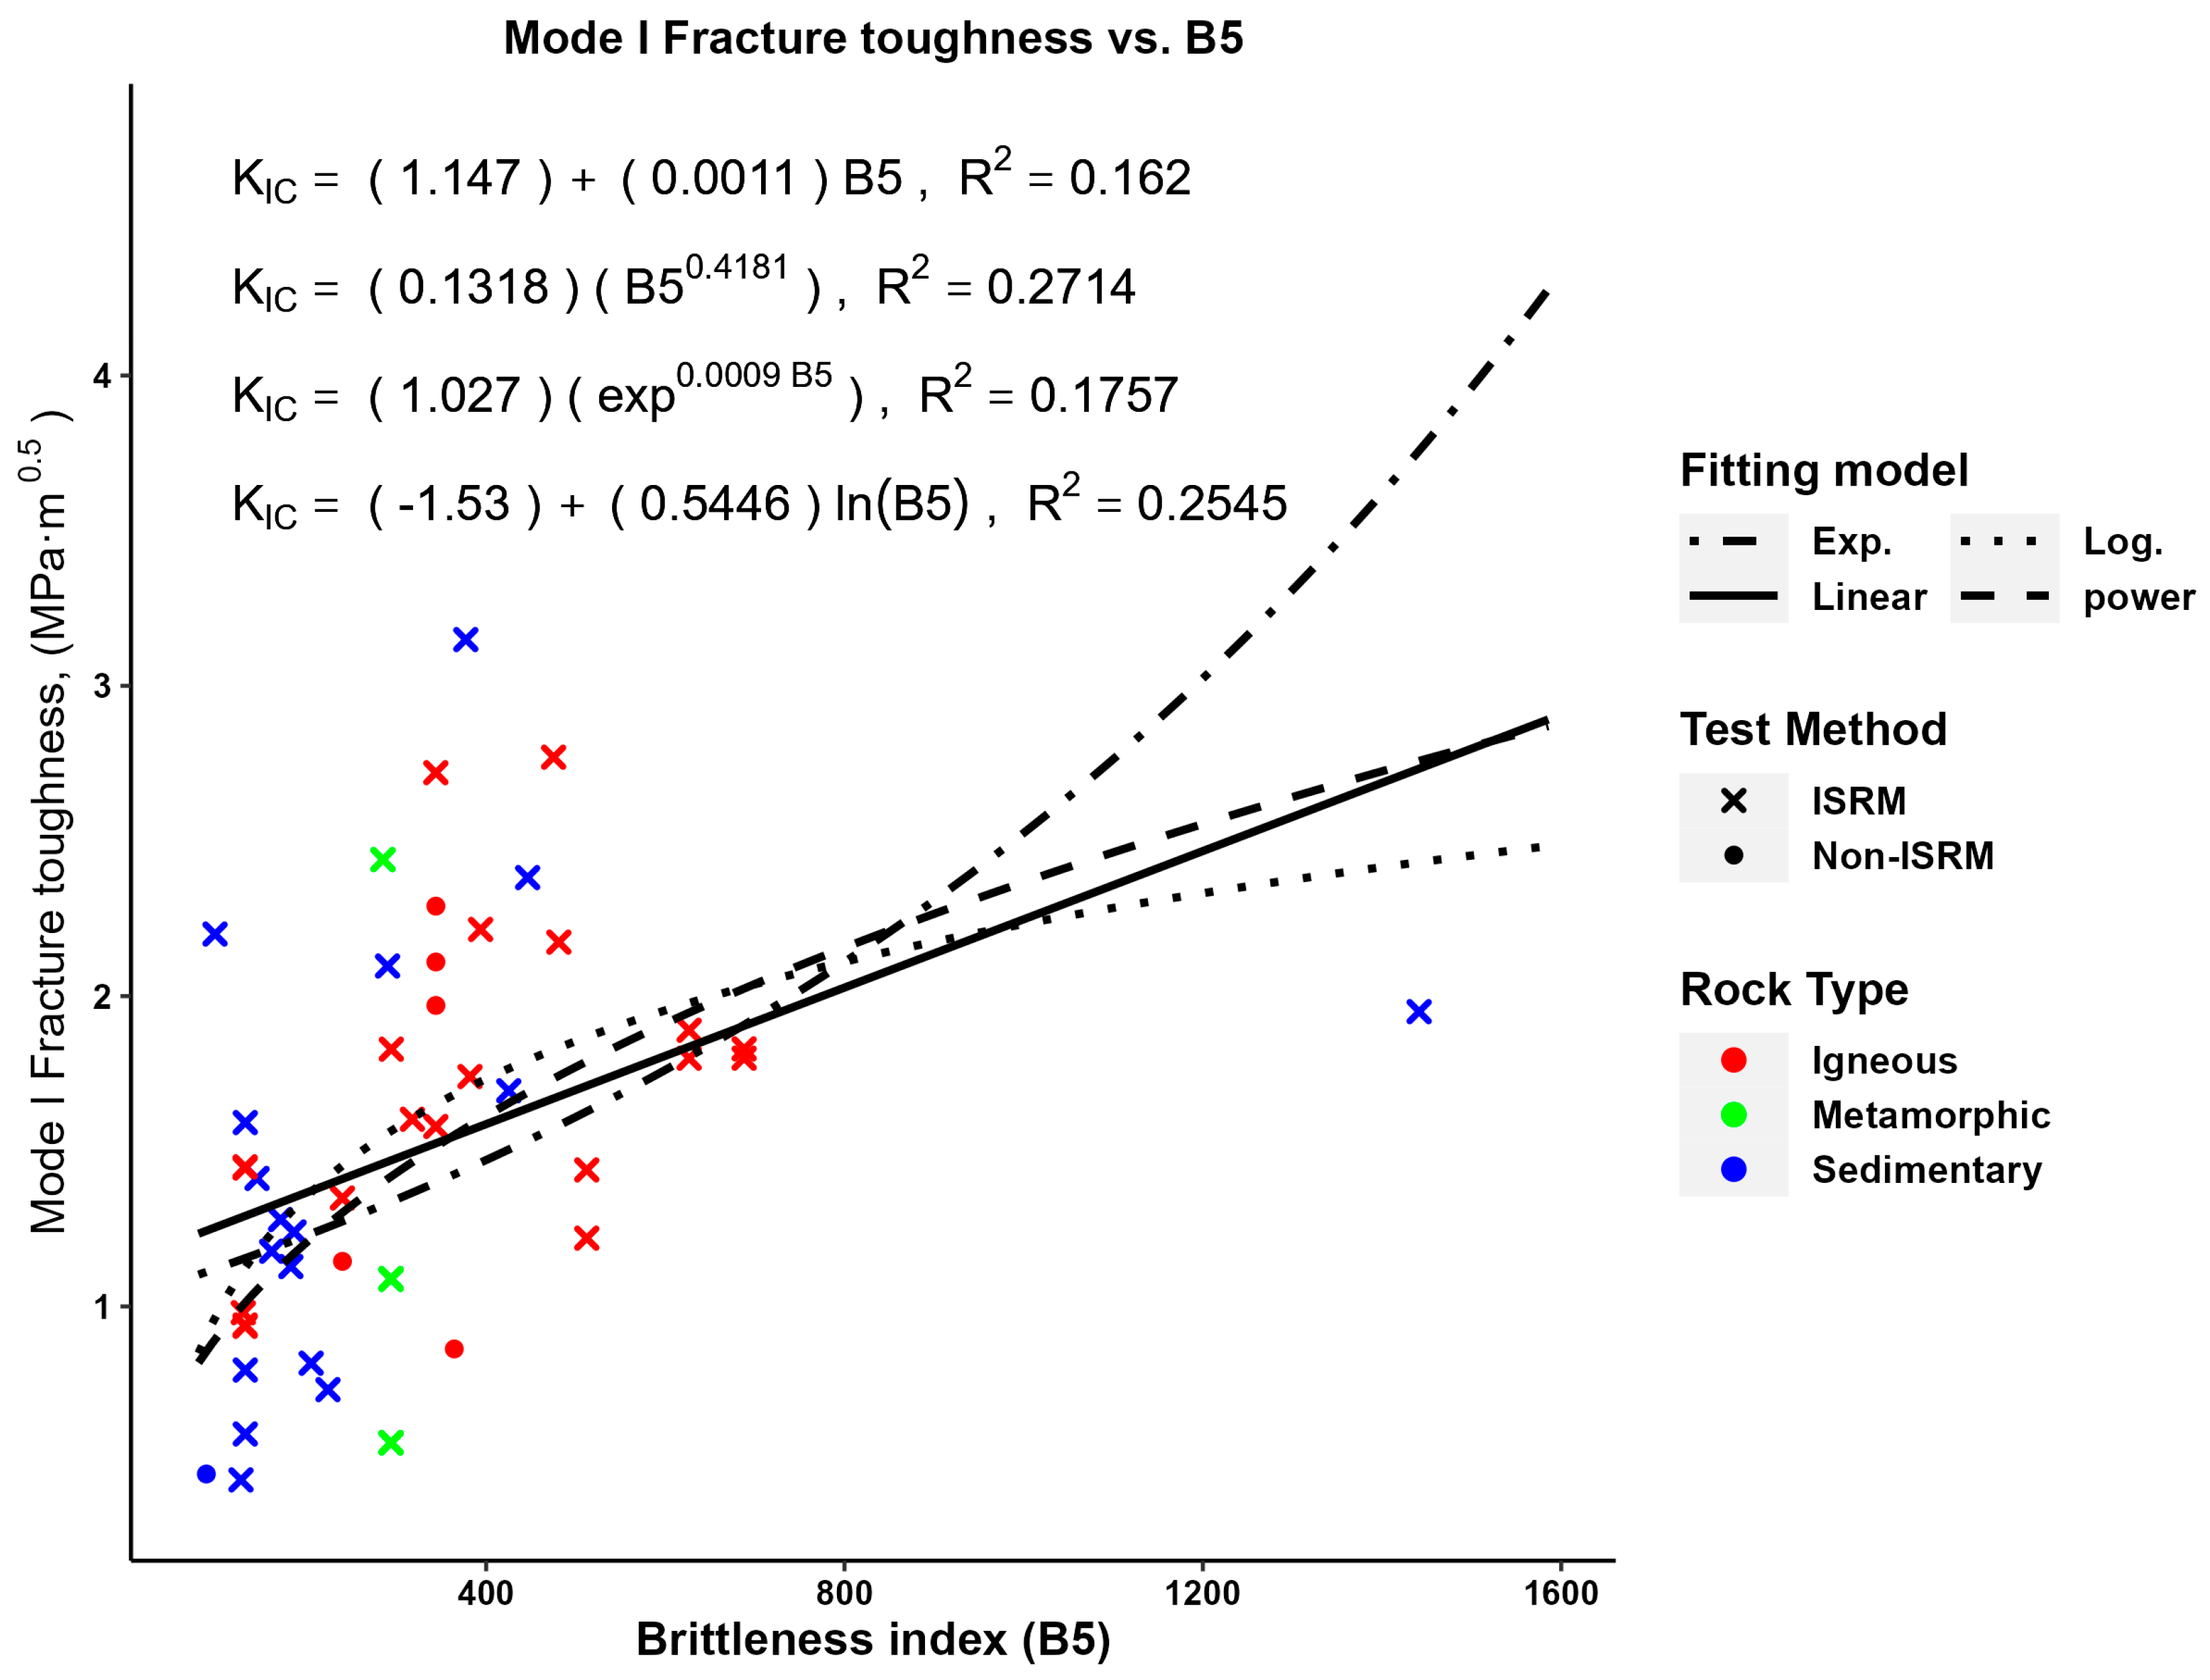
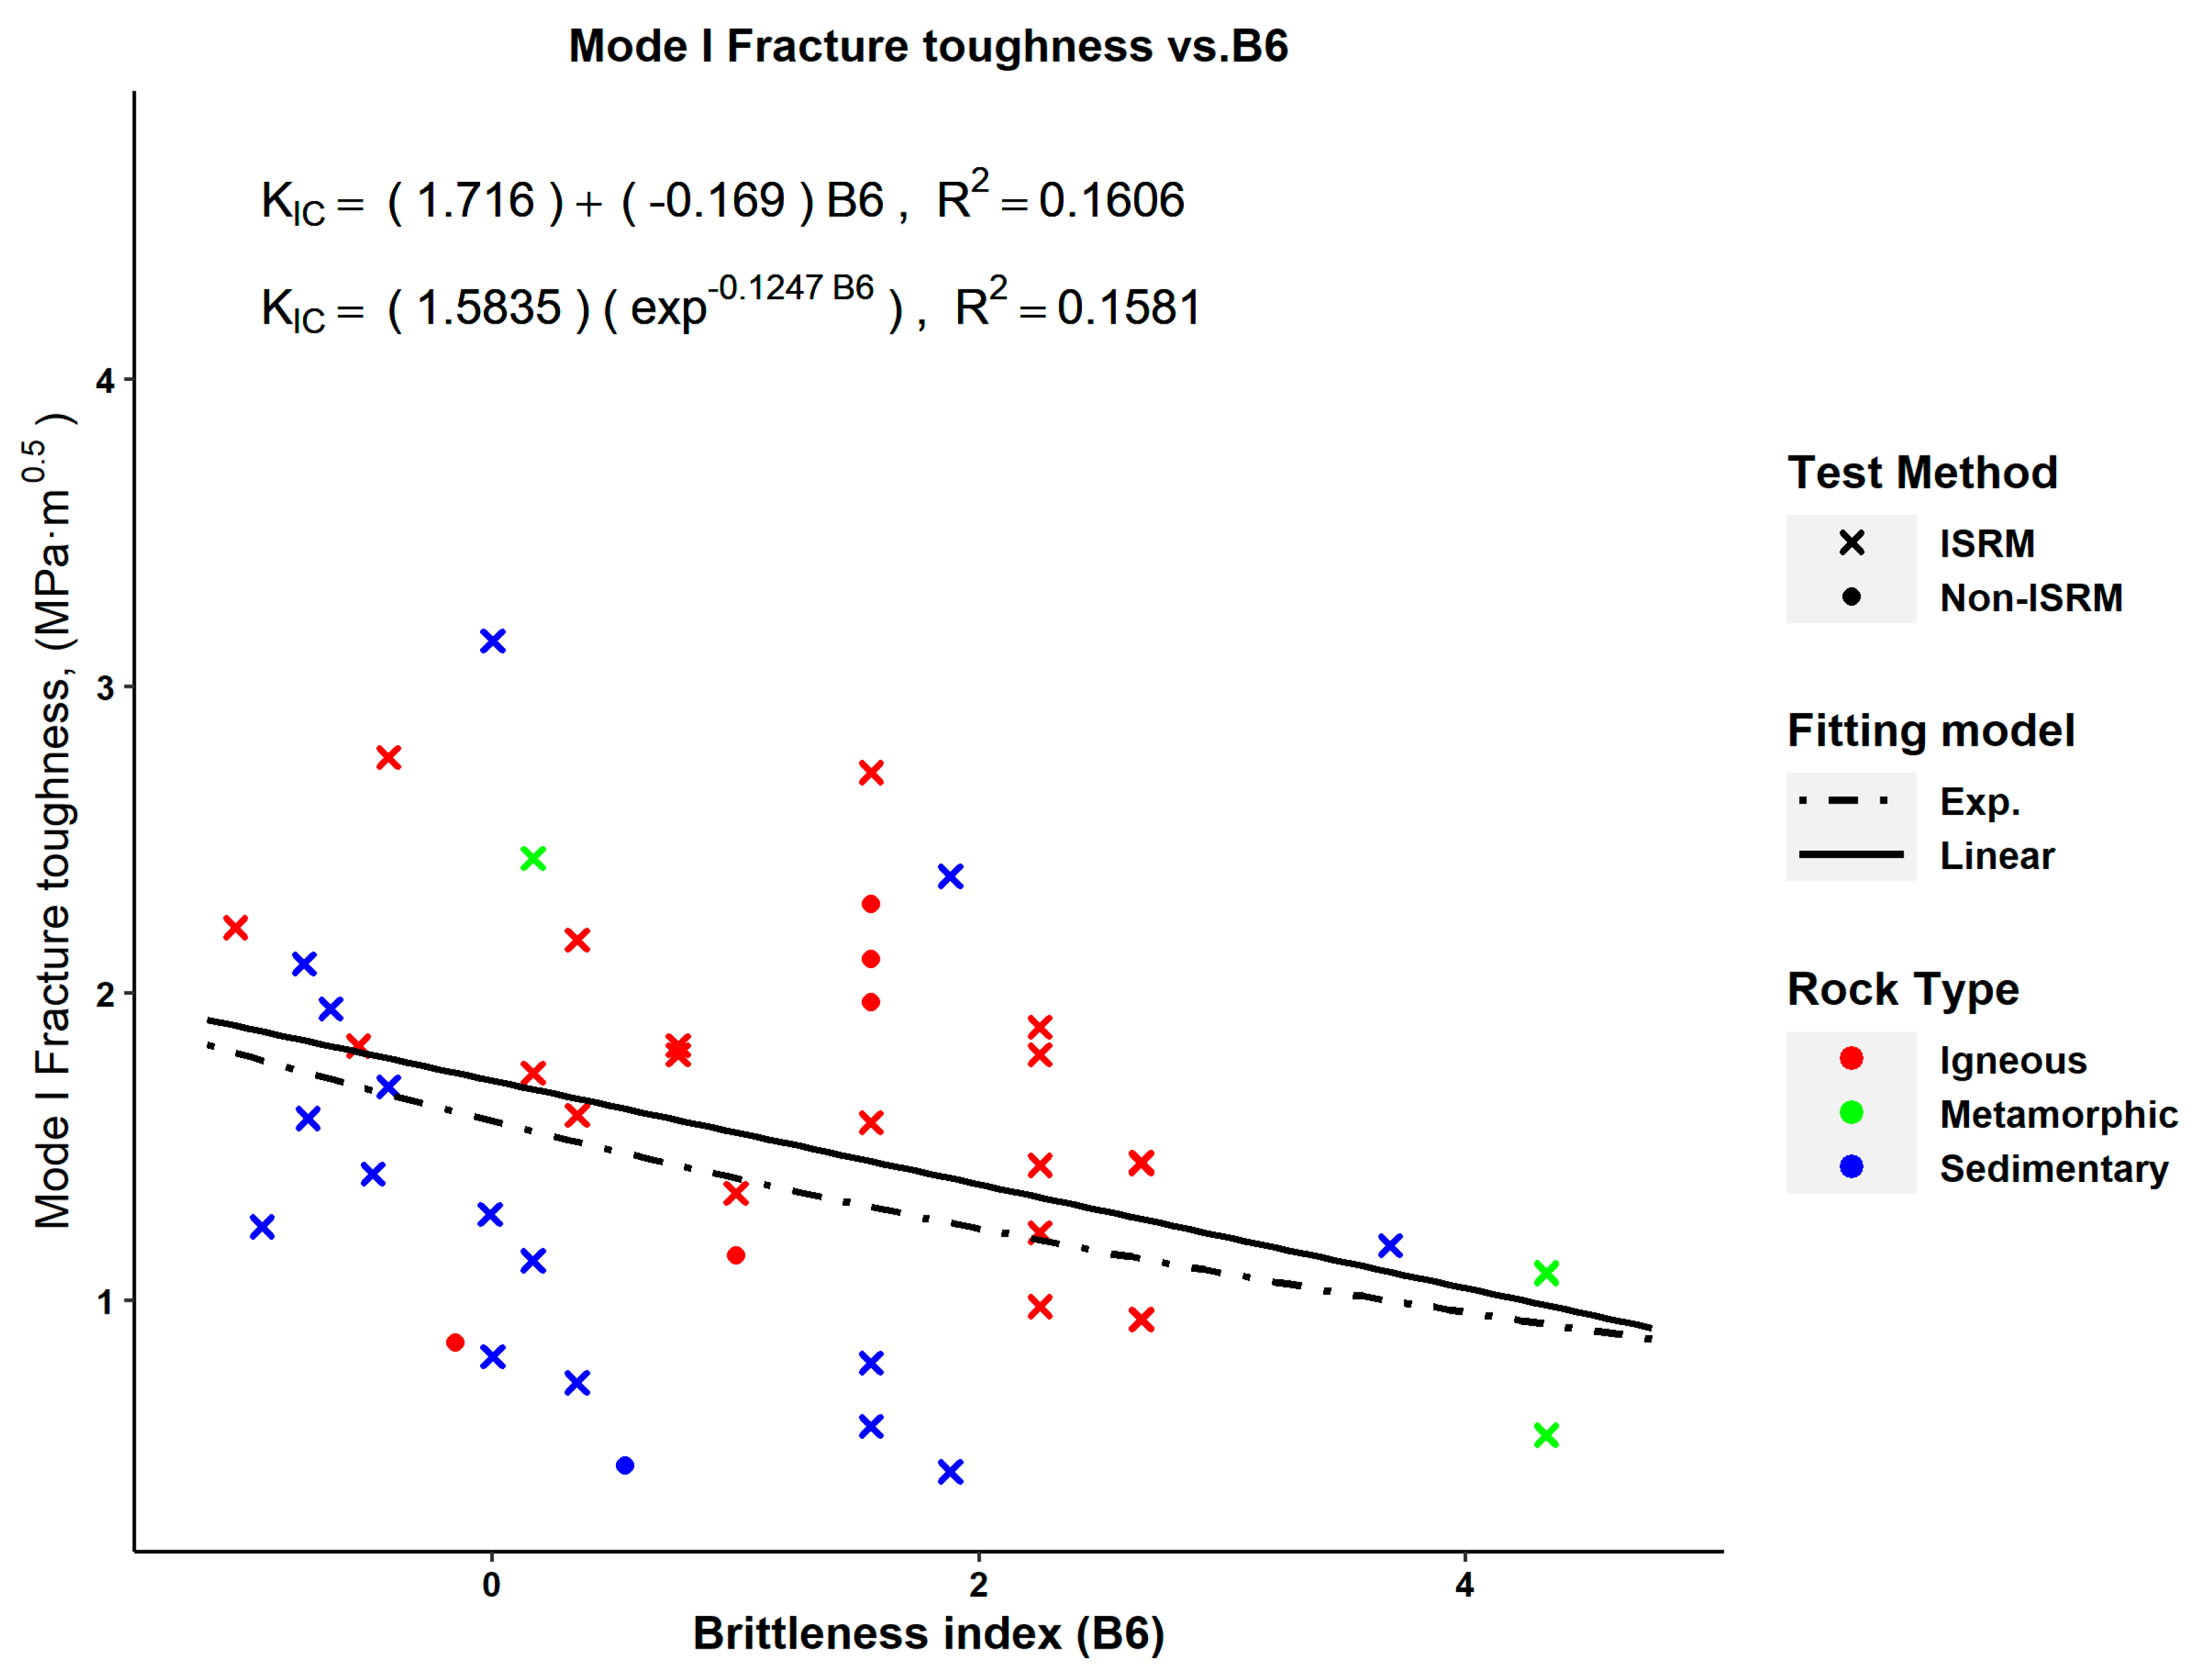
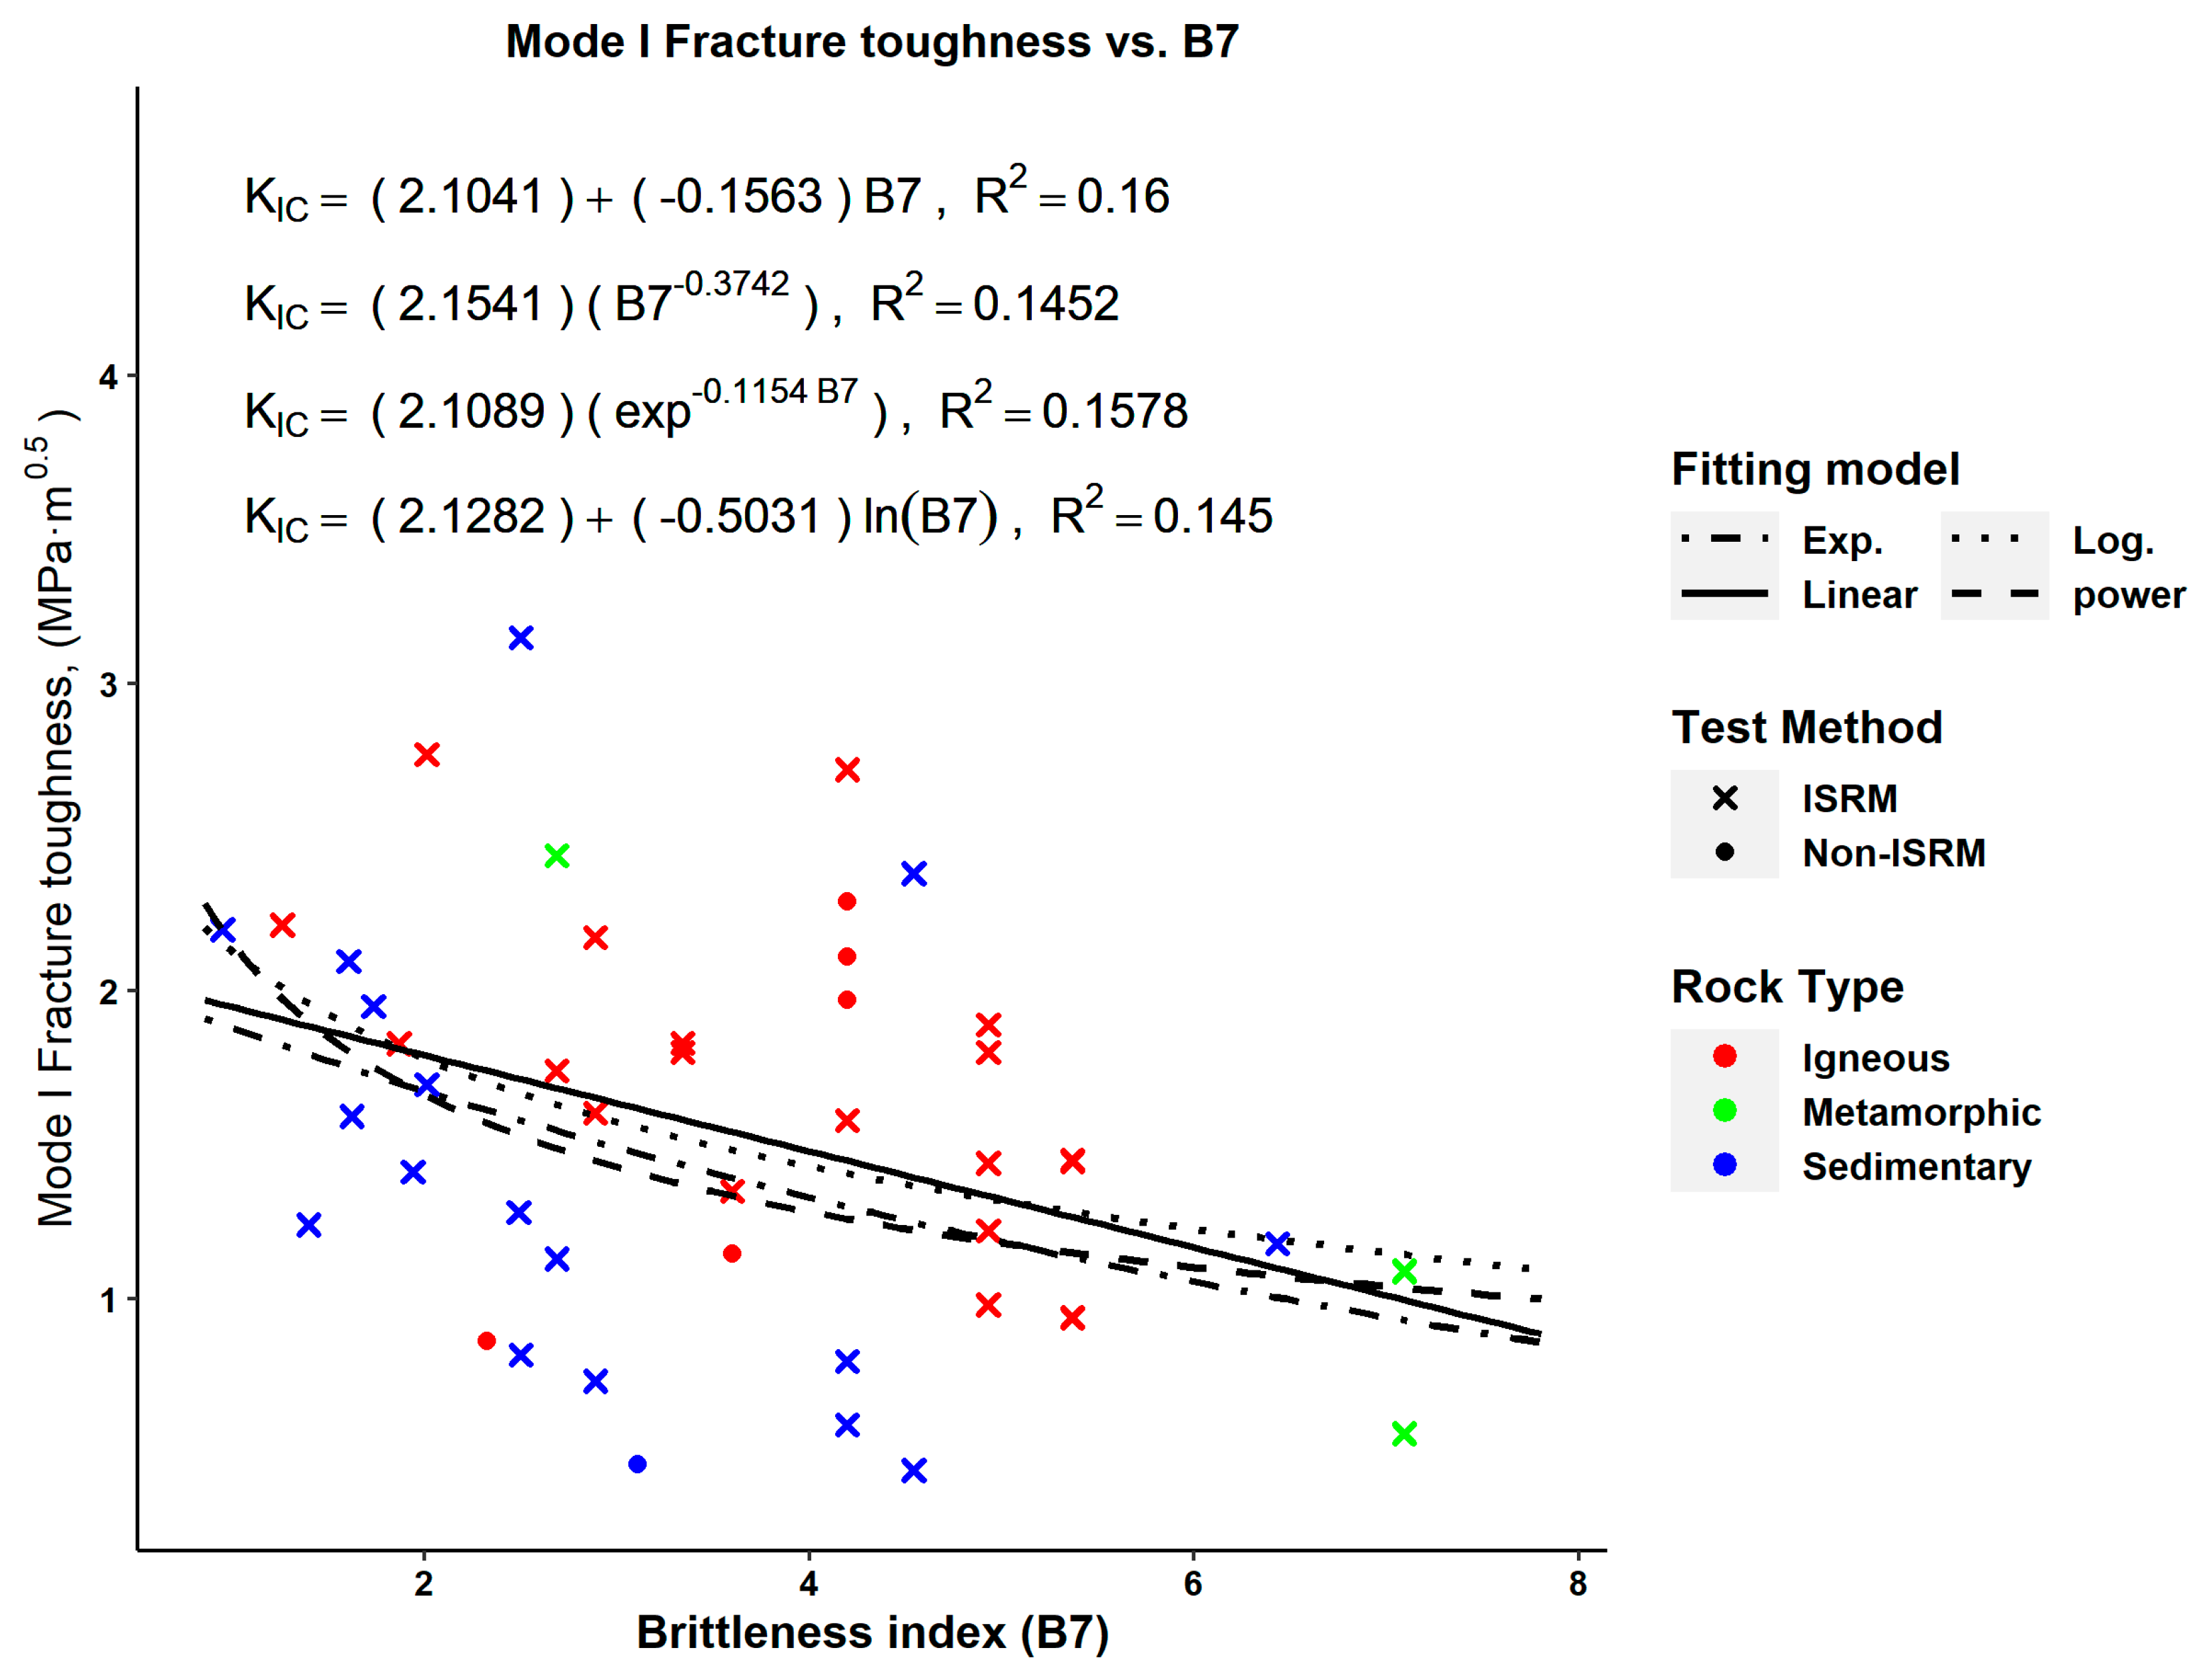
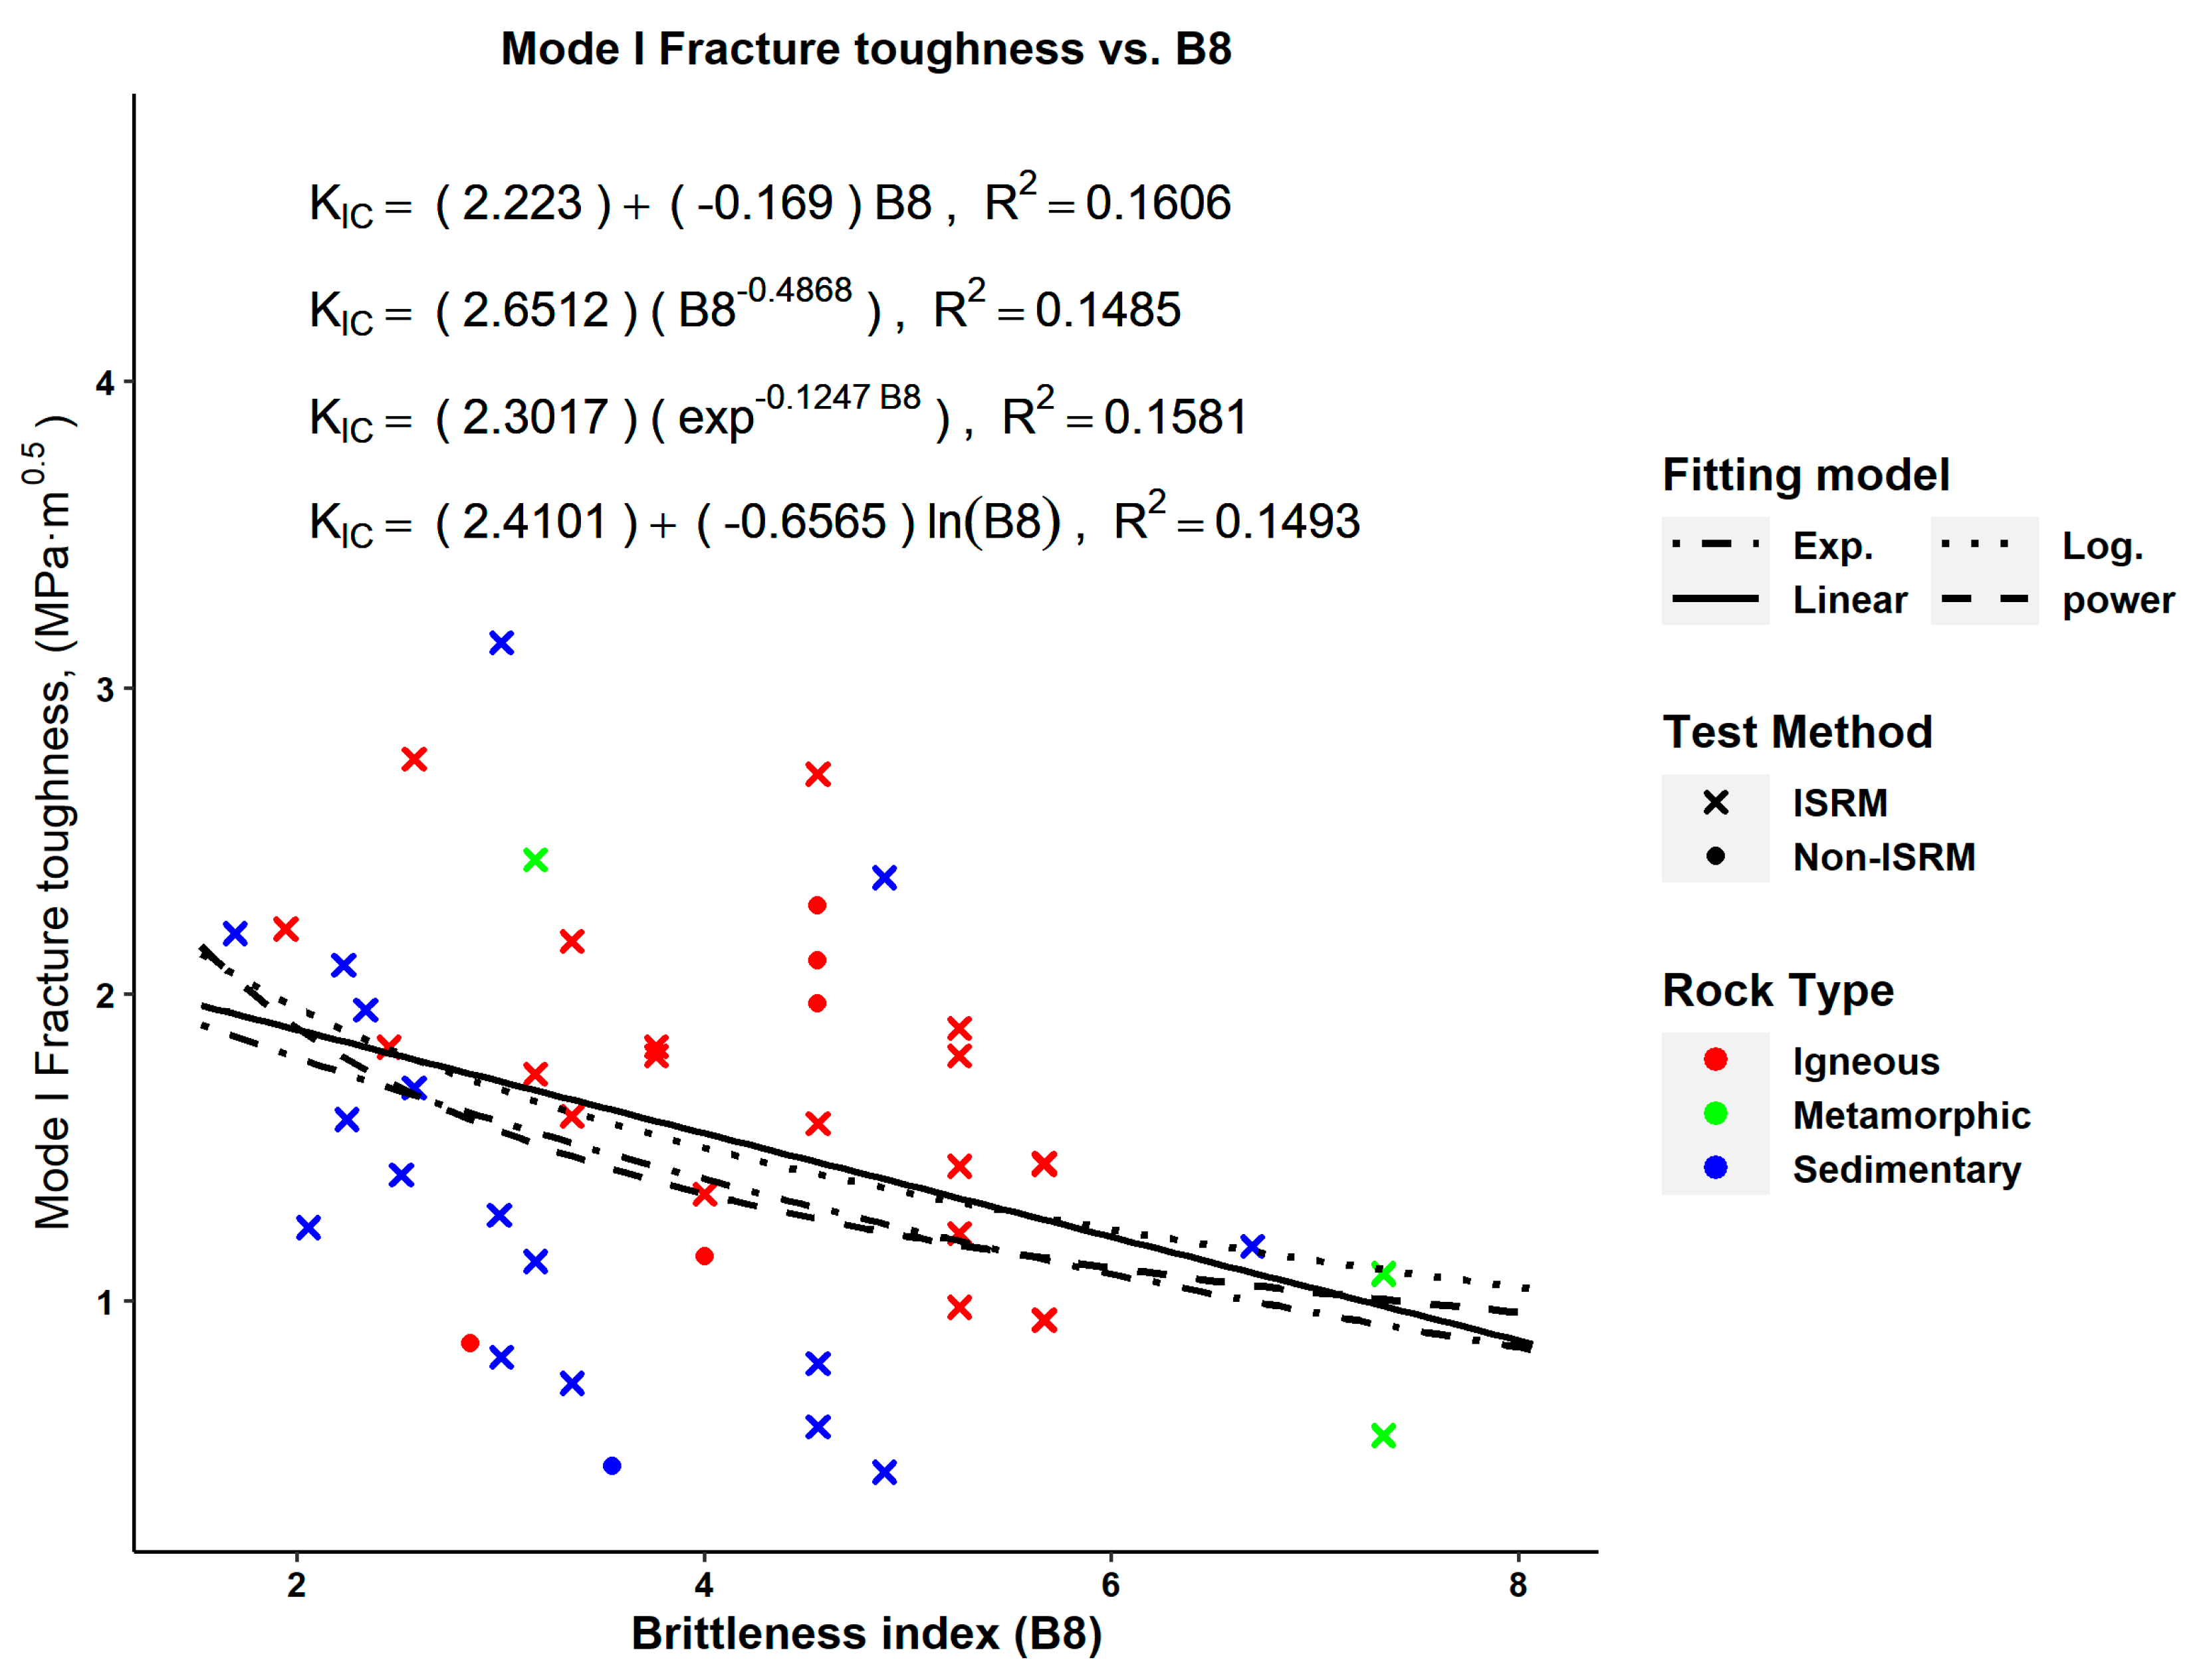
Regression results between KIC and brittleness indices B1 to B10 were shown in Figure 1, Figure 2, Figure 3, Figure 4, Figure 5, Figure 6, Figure 7, Figure 8, Figure 9 and Figure 10, respectively.
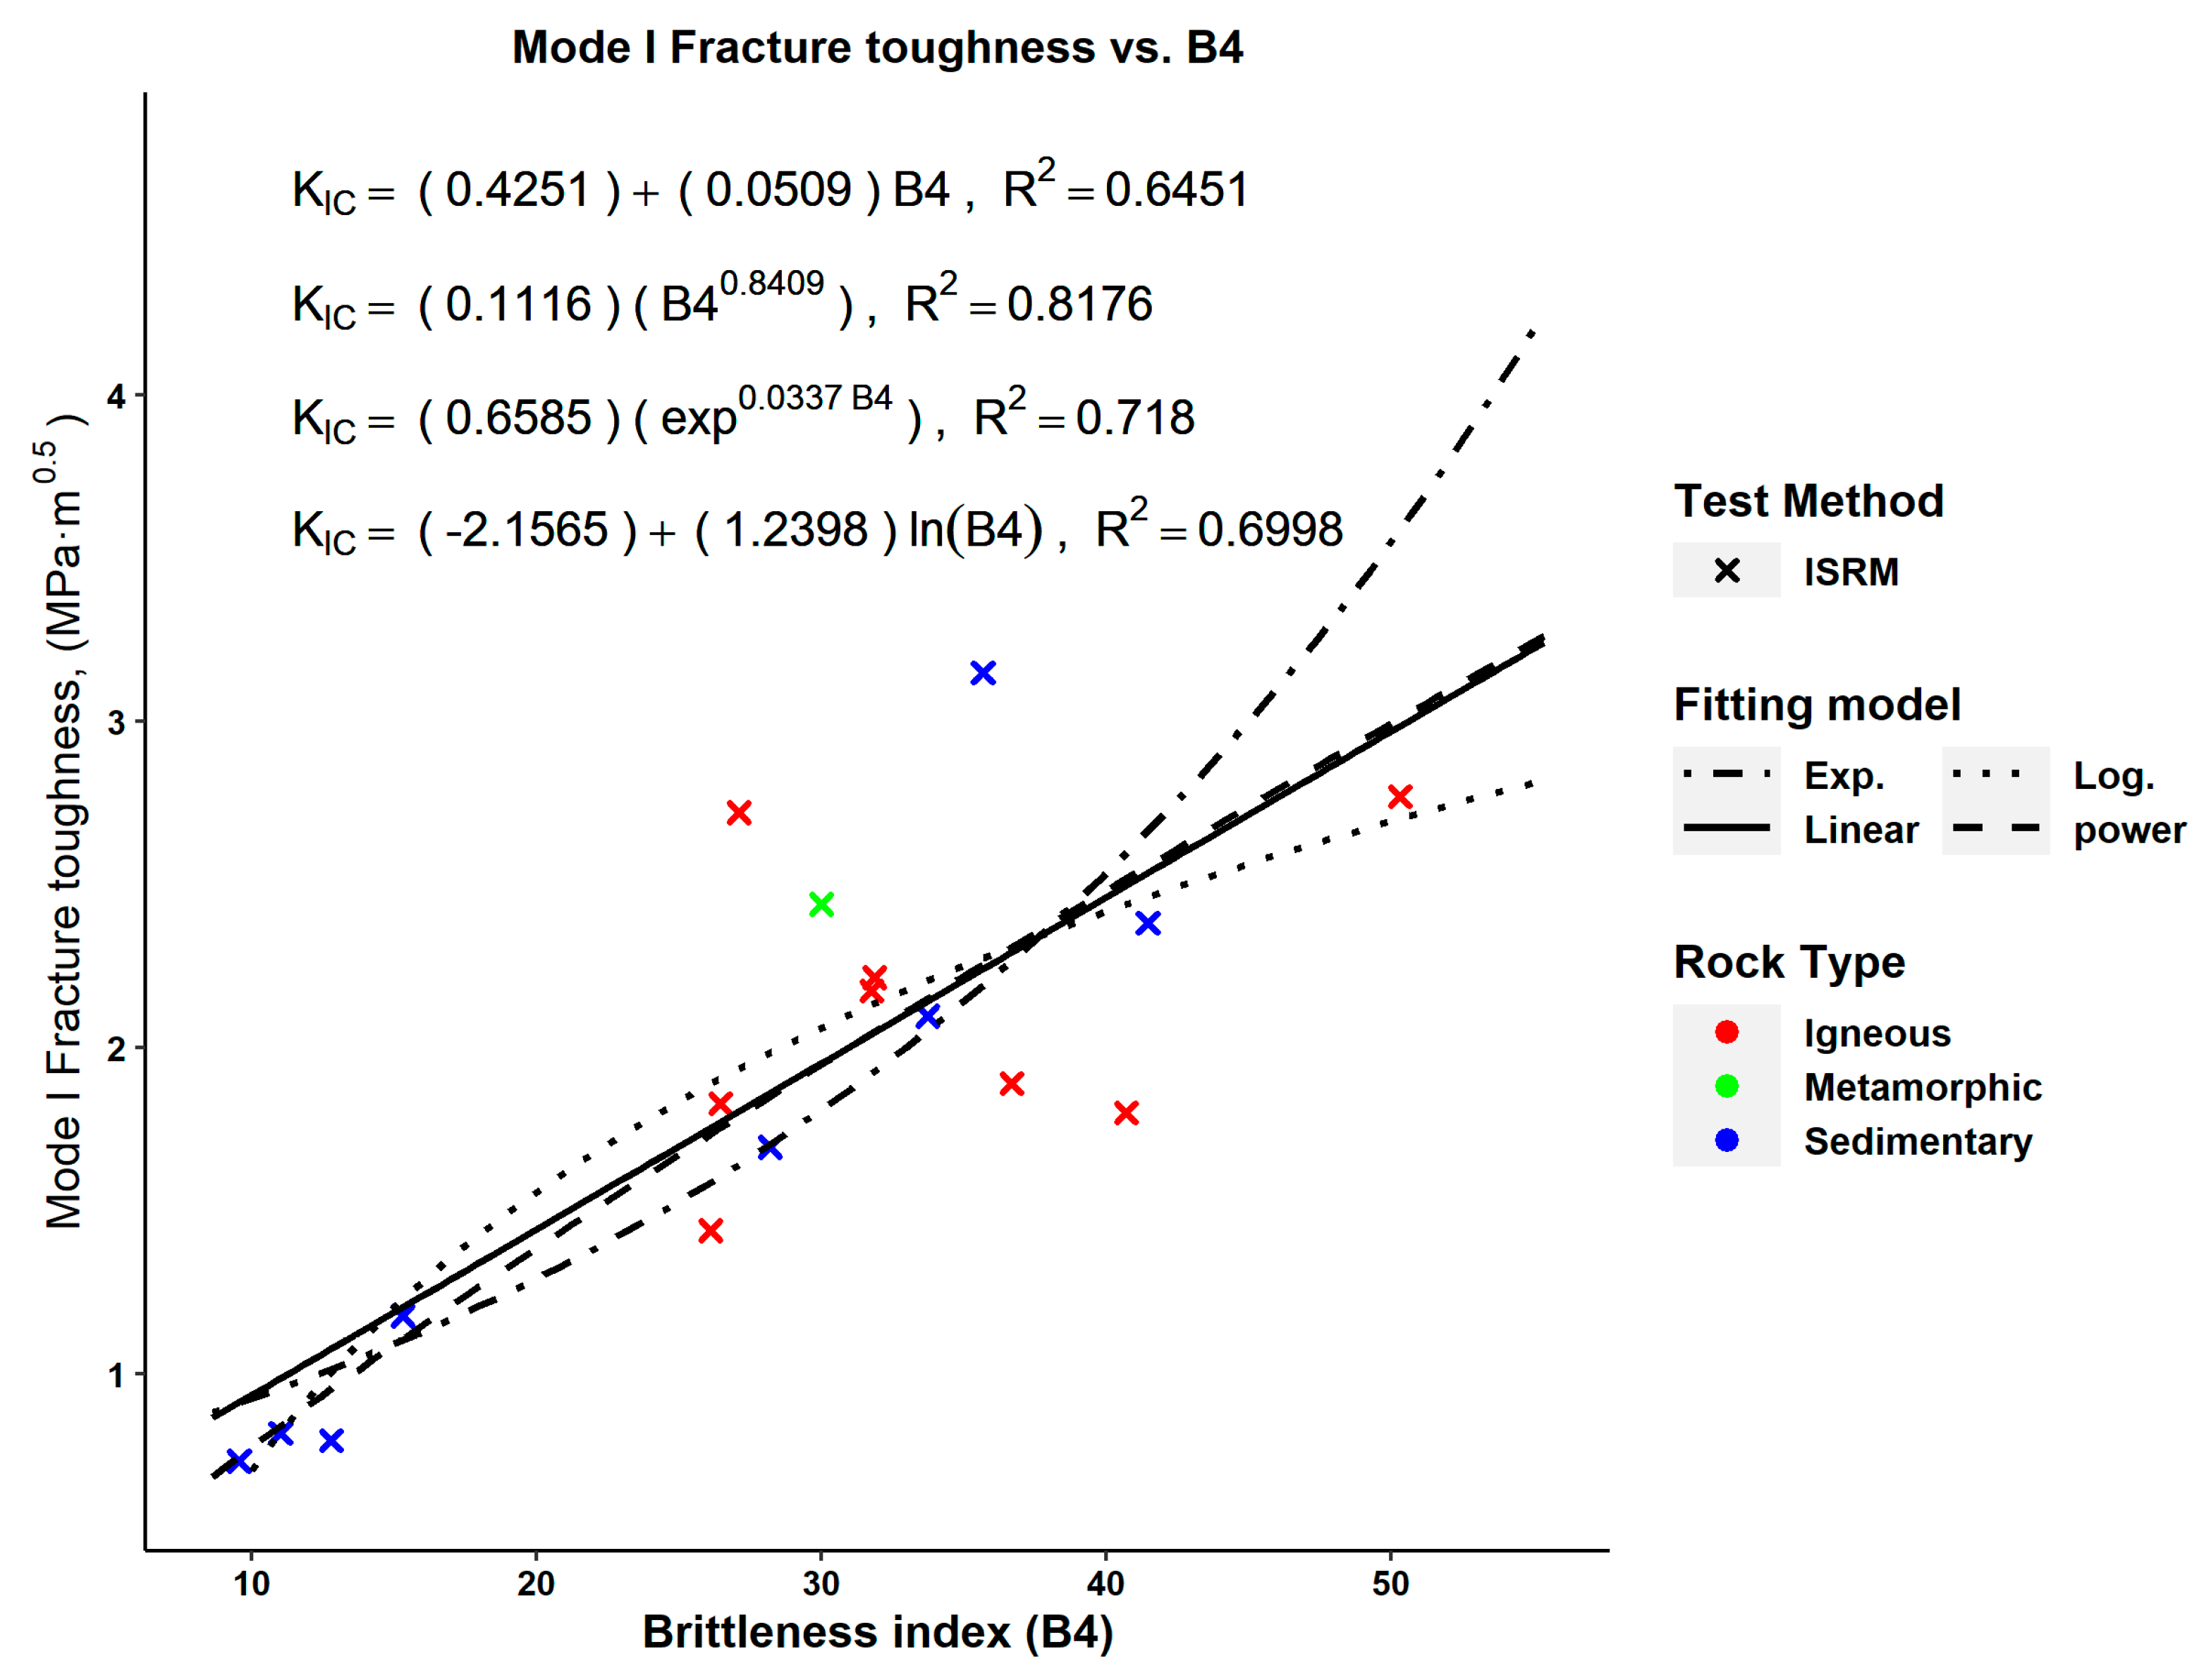
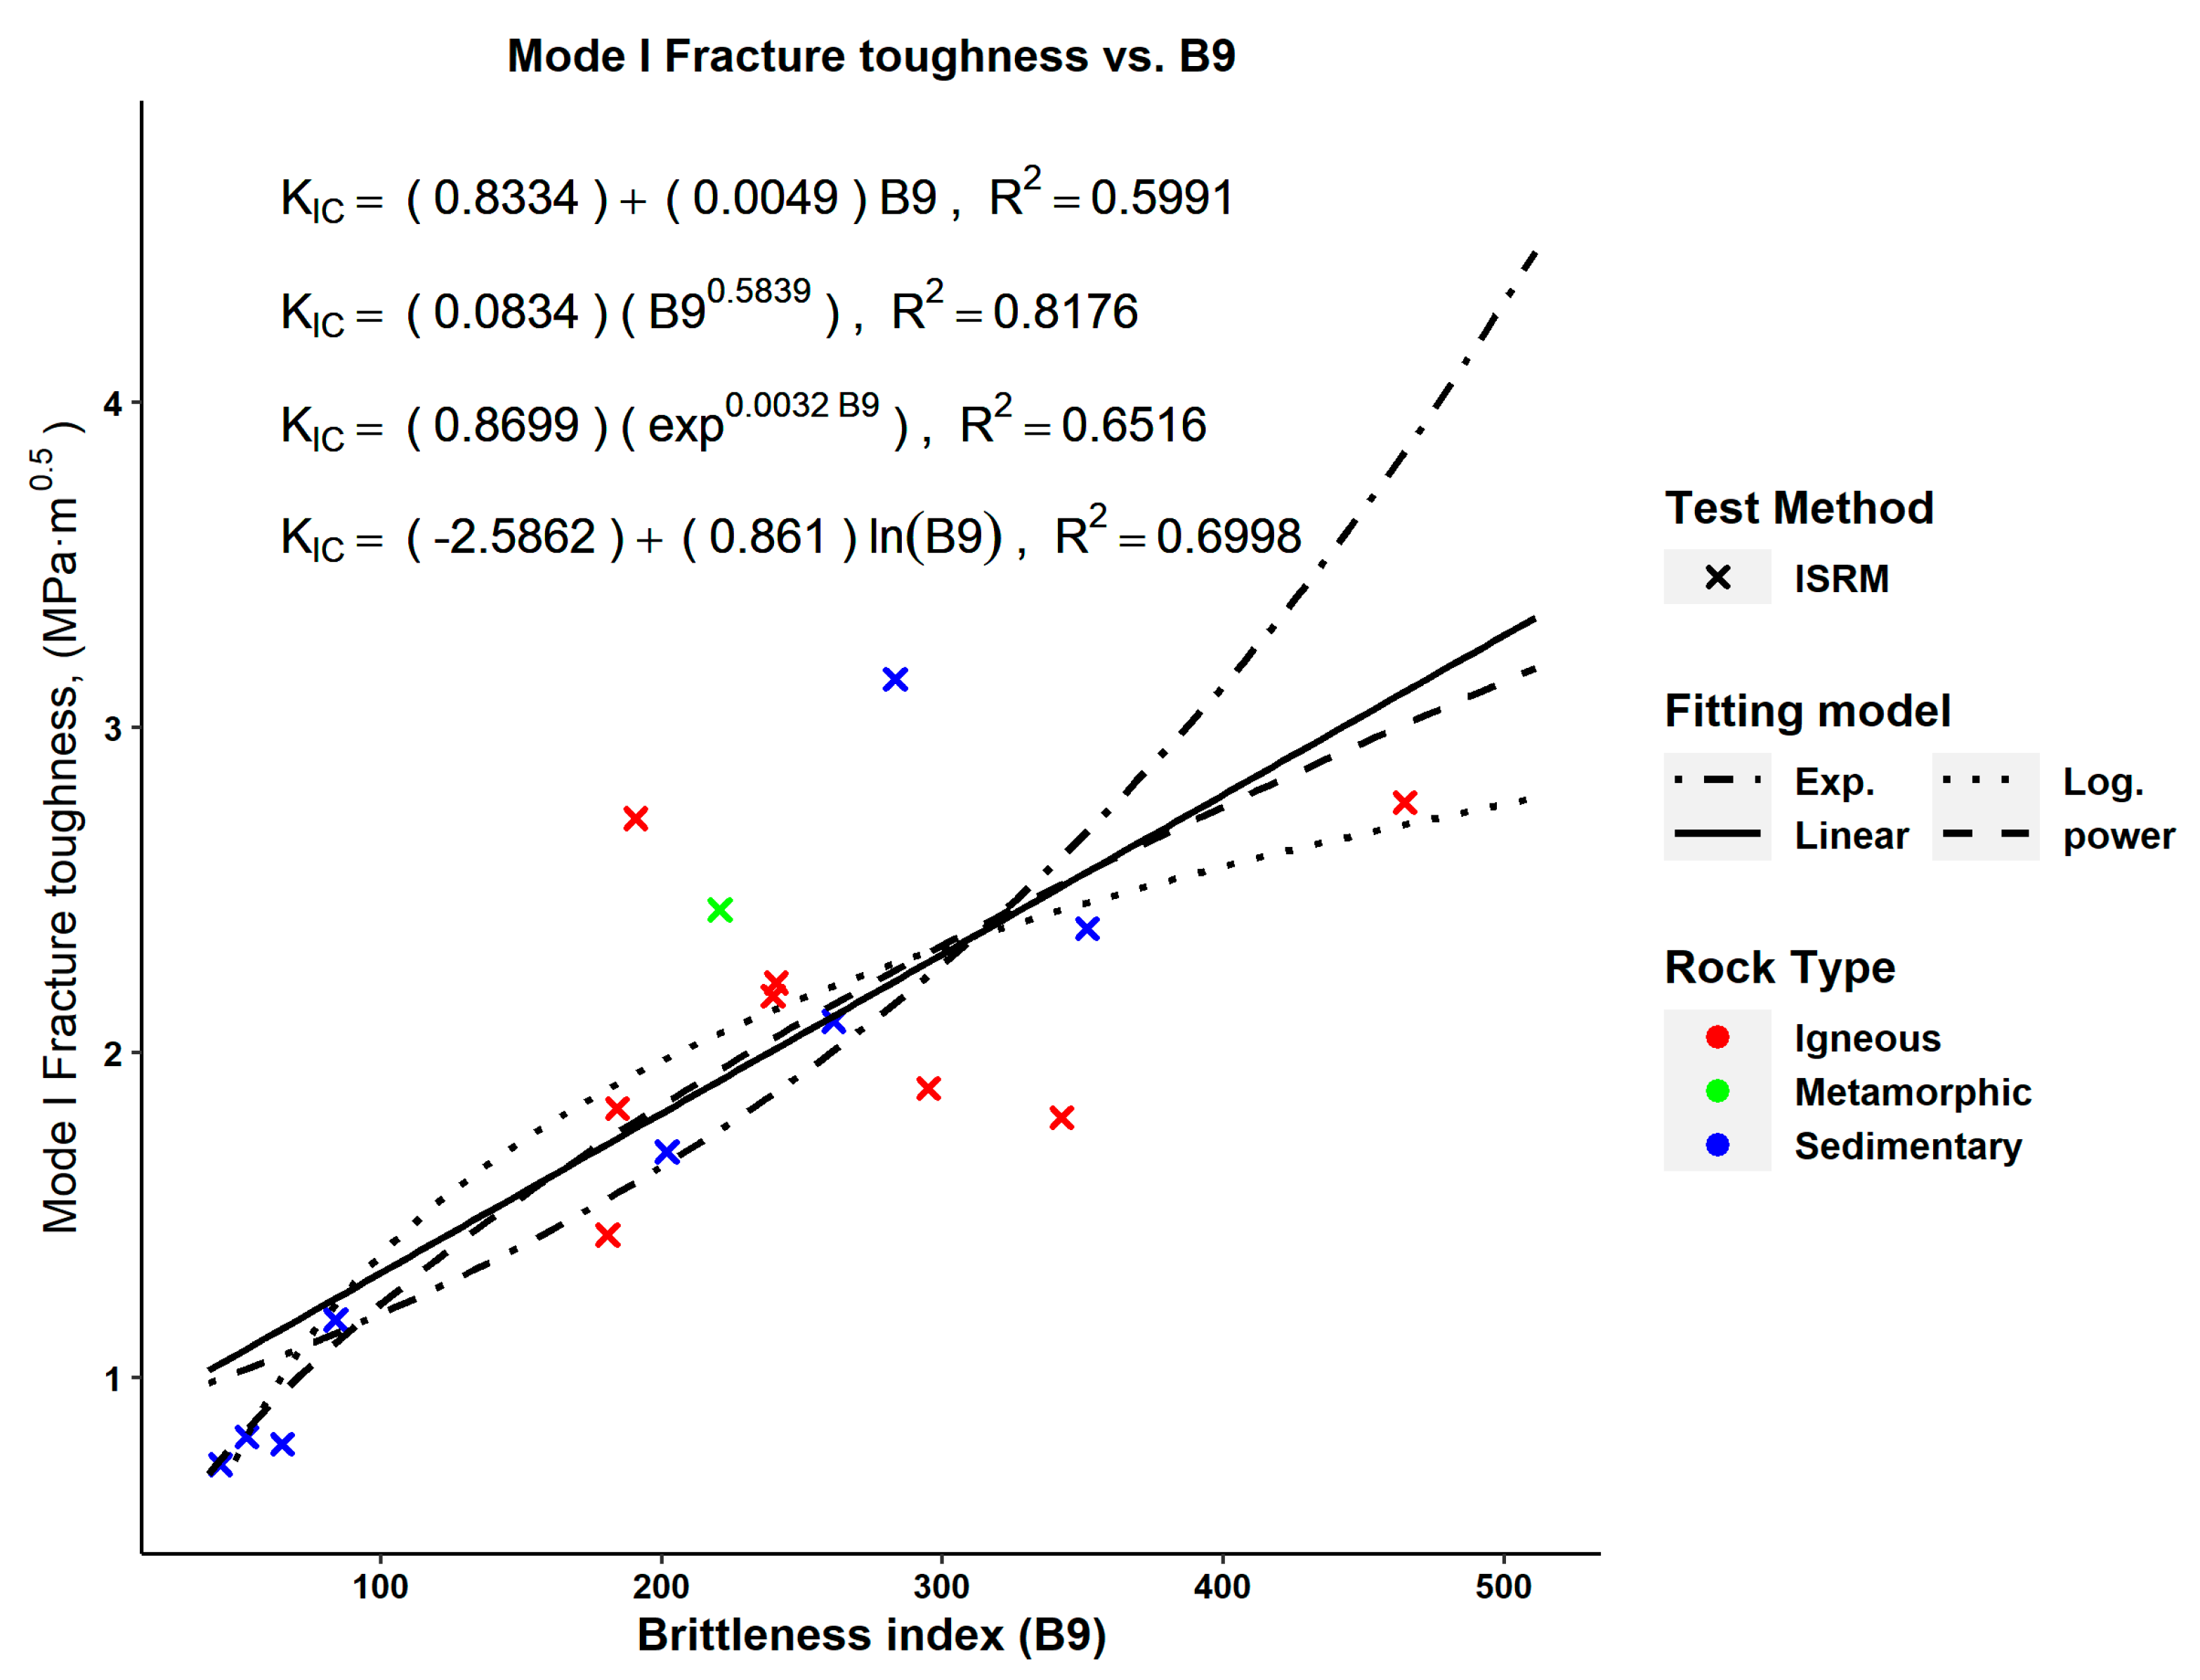
The results showed weak correlations, i.e., coefficient of correlation (R2) < 0.5, between KIC and indices B1 (Figure 1), B2 (Figure 2), B3 (Figure 3), B5 (Figure 5), B6 (Figure 6), B7 (Figure 7) and B8 (Figure 8). Moreover, the correlations between KIC and each of the indices B6 (Figure 6), B7 (Figure 7) and B8 (Figure 8) showed an inverse trend in contrast to the other indices. KIC—index B6 relationships were investigated only for exponential and linear models since index B6 had negative values that were not valid mathematically for power and logarithmic models. On the other hand, the KIC—index B4 relationship (Figure 4) was good, i.e., R2 > 0.5, for the exponential model, while their correlation was weak for linear, logarithmic and power models. KIC showed a good correlation with index B9 (Figure 9) for exponential and linear models and with index B10 (Figure 10) for all models. A summary of the relationships with R2 > 0.5 is presented in Table 3. Additionally, the Root-Mean-Square Error (RMSE) is presented in Table 3 for the relationships with (R2 > 0.5). The RMSE was lowest for the KIC—index B10 power model with a value of 0.1307, which is lower by more than 50% of the nearest RMSE values for the remaining relationships listed. In general, power and exponential models had the lowest RMSE compared to linear and logarithmic models.
The p-value can be used to determine the significance of the proposed relationships. When the variables have a normal distribution, then the p-value, obtained from Pearson’s correlation, can be used to judge the relationships’ significance; otherwise, the p-value obtained from Spearman’s correlation should be used [63,64,65]. The p-value (obtained using R) indicates the probability that the null hypothesis, i.e., the correlation is not significant, is true. For a 95% confidence level (i.e., α =0.05), a p-value lower than 0.05 indicates a significant correlation [64]. The Shapiro–Wilk test [66,67,68] was used to test the normality of brittleness indices (B4, B9 and B10) and KIC datasets. The results of the Shapiro–Wilk test, obtained using R, are shown in Table 4. The dataset of brittleness index (B10) showed evidence of non-normality; hence, the significance of KIC -index B10 relationships was assessed using the p-value from Spearman’s correlation. A summary of the significant relationships proposed in this paper is presented in Table 3.

4. Discussion

Based on coefficient of correlation (R2) and p-value, the proposed relationships (Table 3) were significant. These relationships were compared with KIC—rock brittleness relationships from the literature (Table 5).
In this paper, there were weak correlations between KIC and each of the indices B1 and B2. Similar weak correlations were reported in [23,24] between KIC and index B1 and in [22,23,24] between KIC and index B2. This indicated that indices B1 and B2 may not be good predictors of KIC.
For strength-based brittleness index B3, there was no significant correlation with KIC in this study, despite the significant KIC—index B3 relationship reported in [22], i.e., Equation (20) in Table 5.
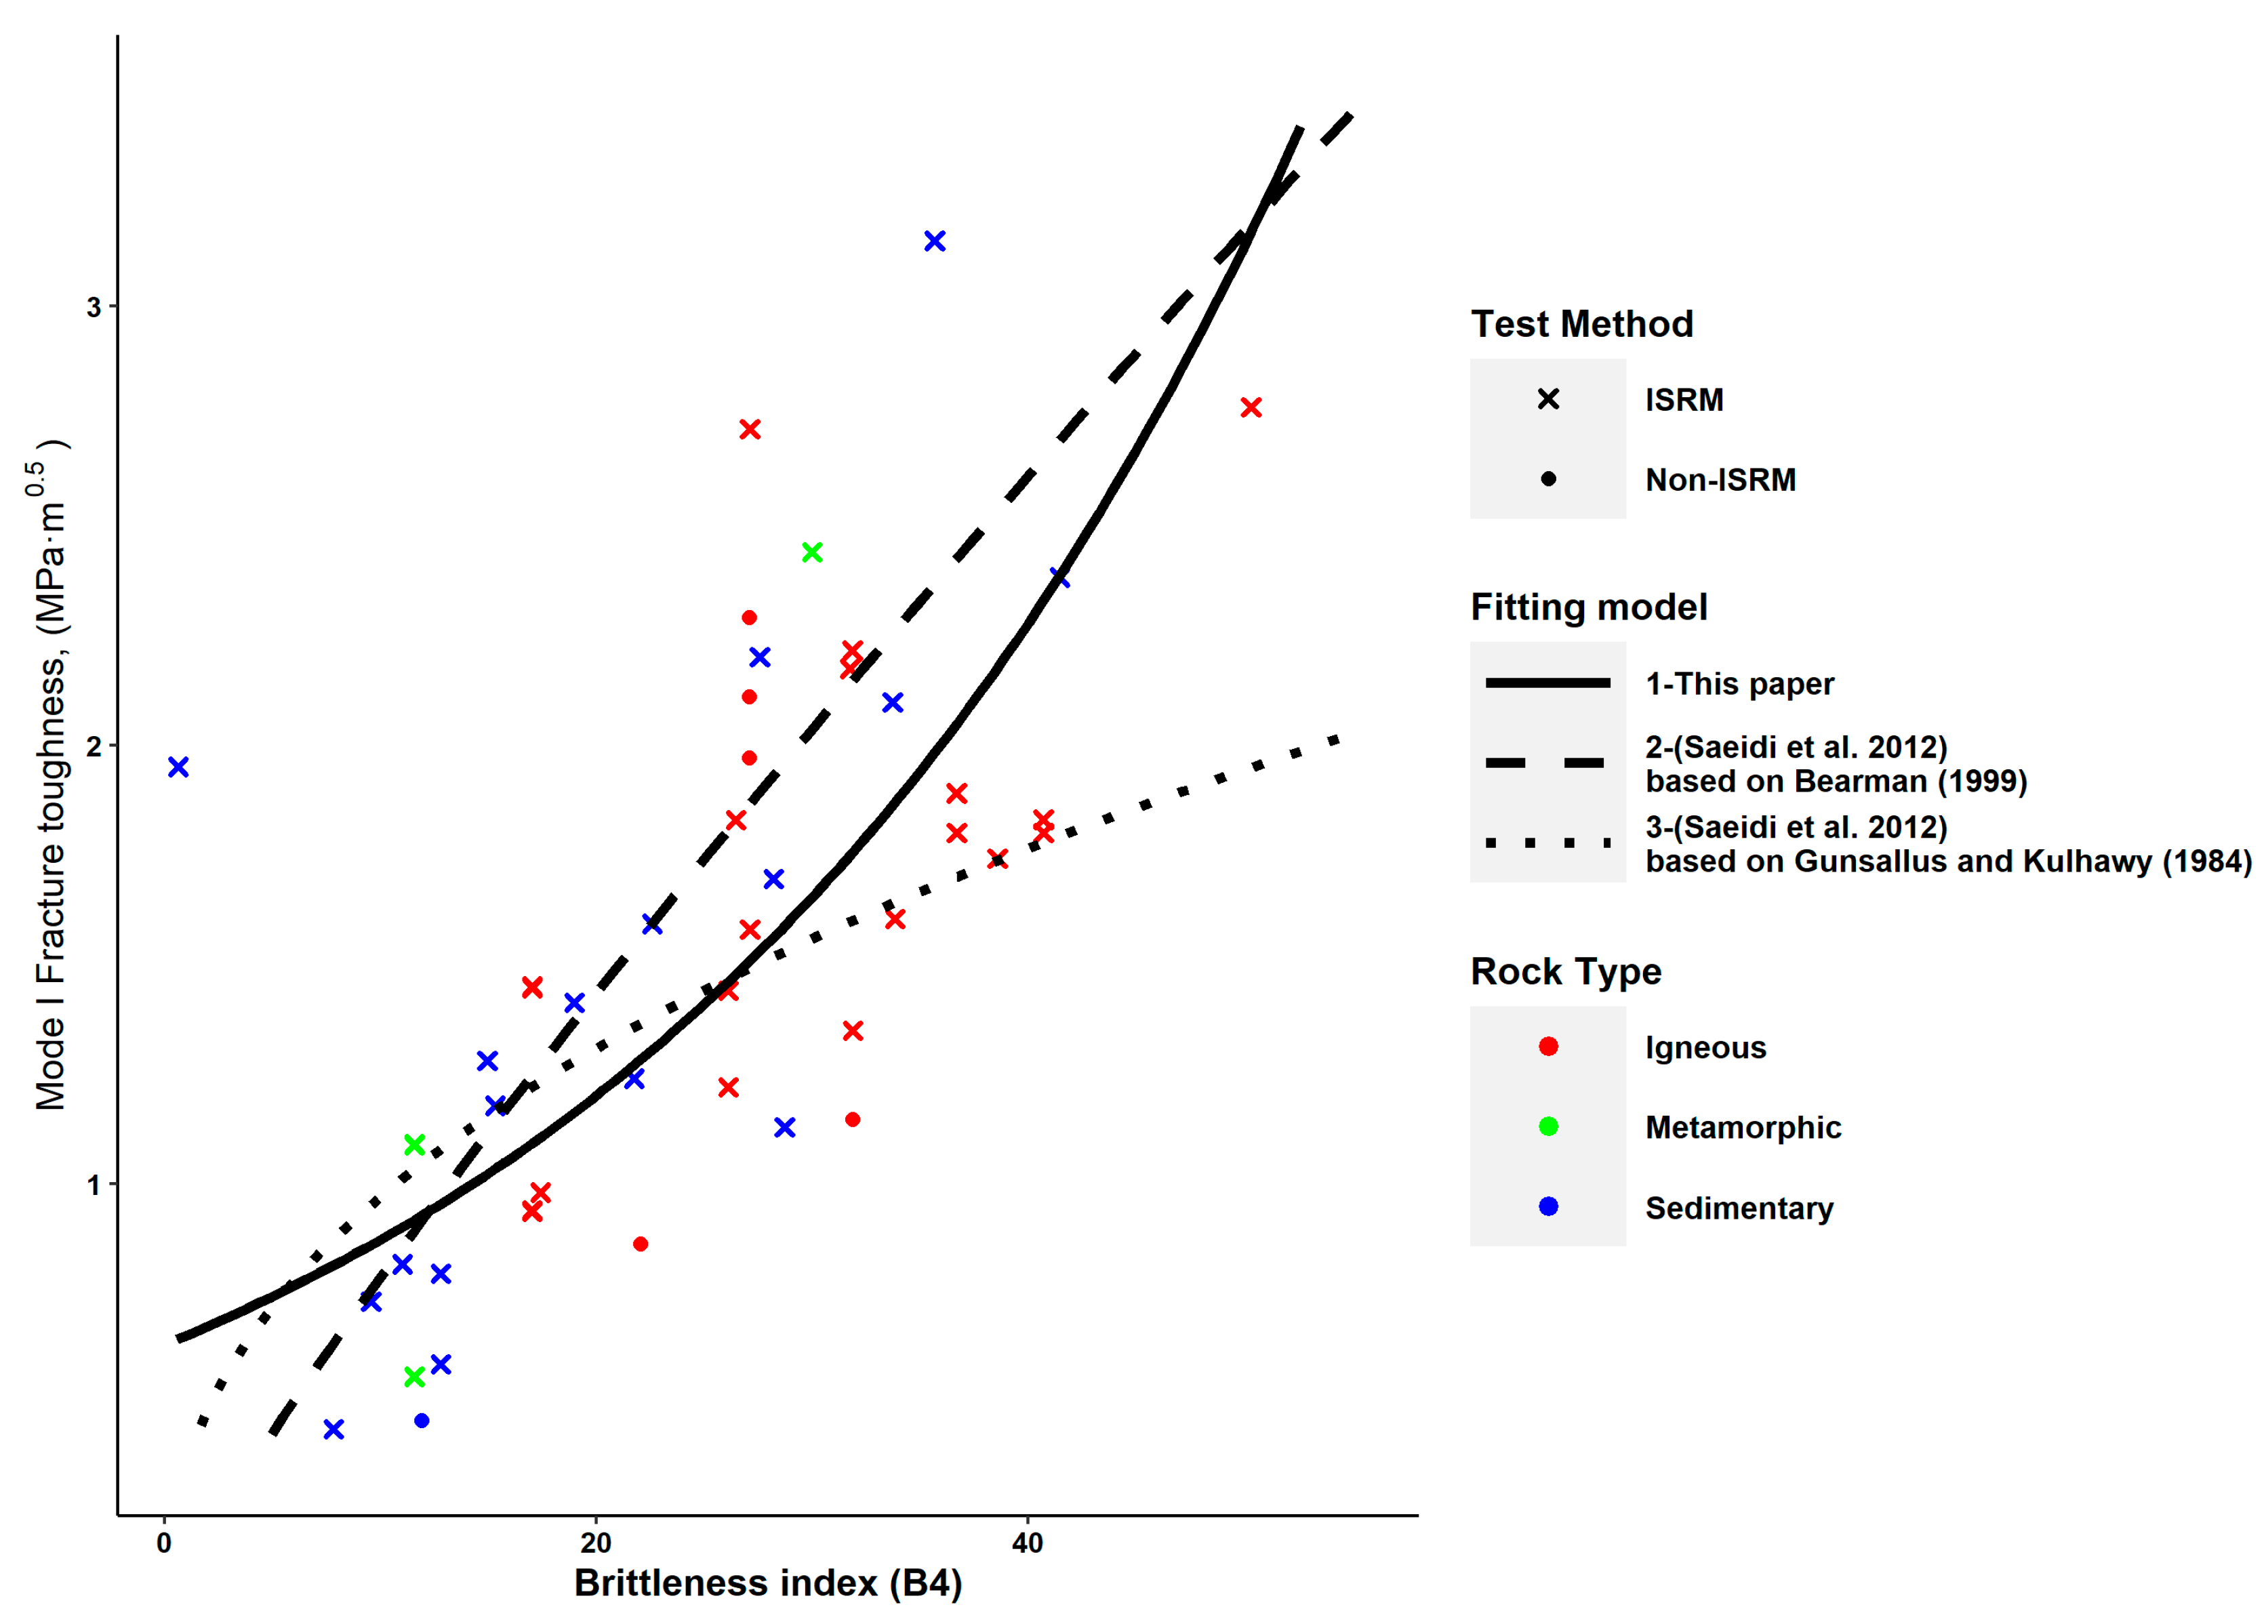
The relationship between KIC and index B4 proposed in this study, i.e., Equation (11) in Table 3, was significant but it had an R2 lower than the relationships reported in [23], i.e., Equations (21) and (22) in Table 5, that were proposed using data from [18] and [69], respectively. A comparison between the KIC—index B4 relationships is shown in Figure 11. There were significant differences between Equations (21) and (22), particularly at B4 values higher than 20, while Equation (11) showed an overall average trend between Equations (21) and (22).
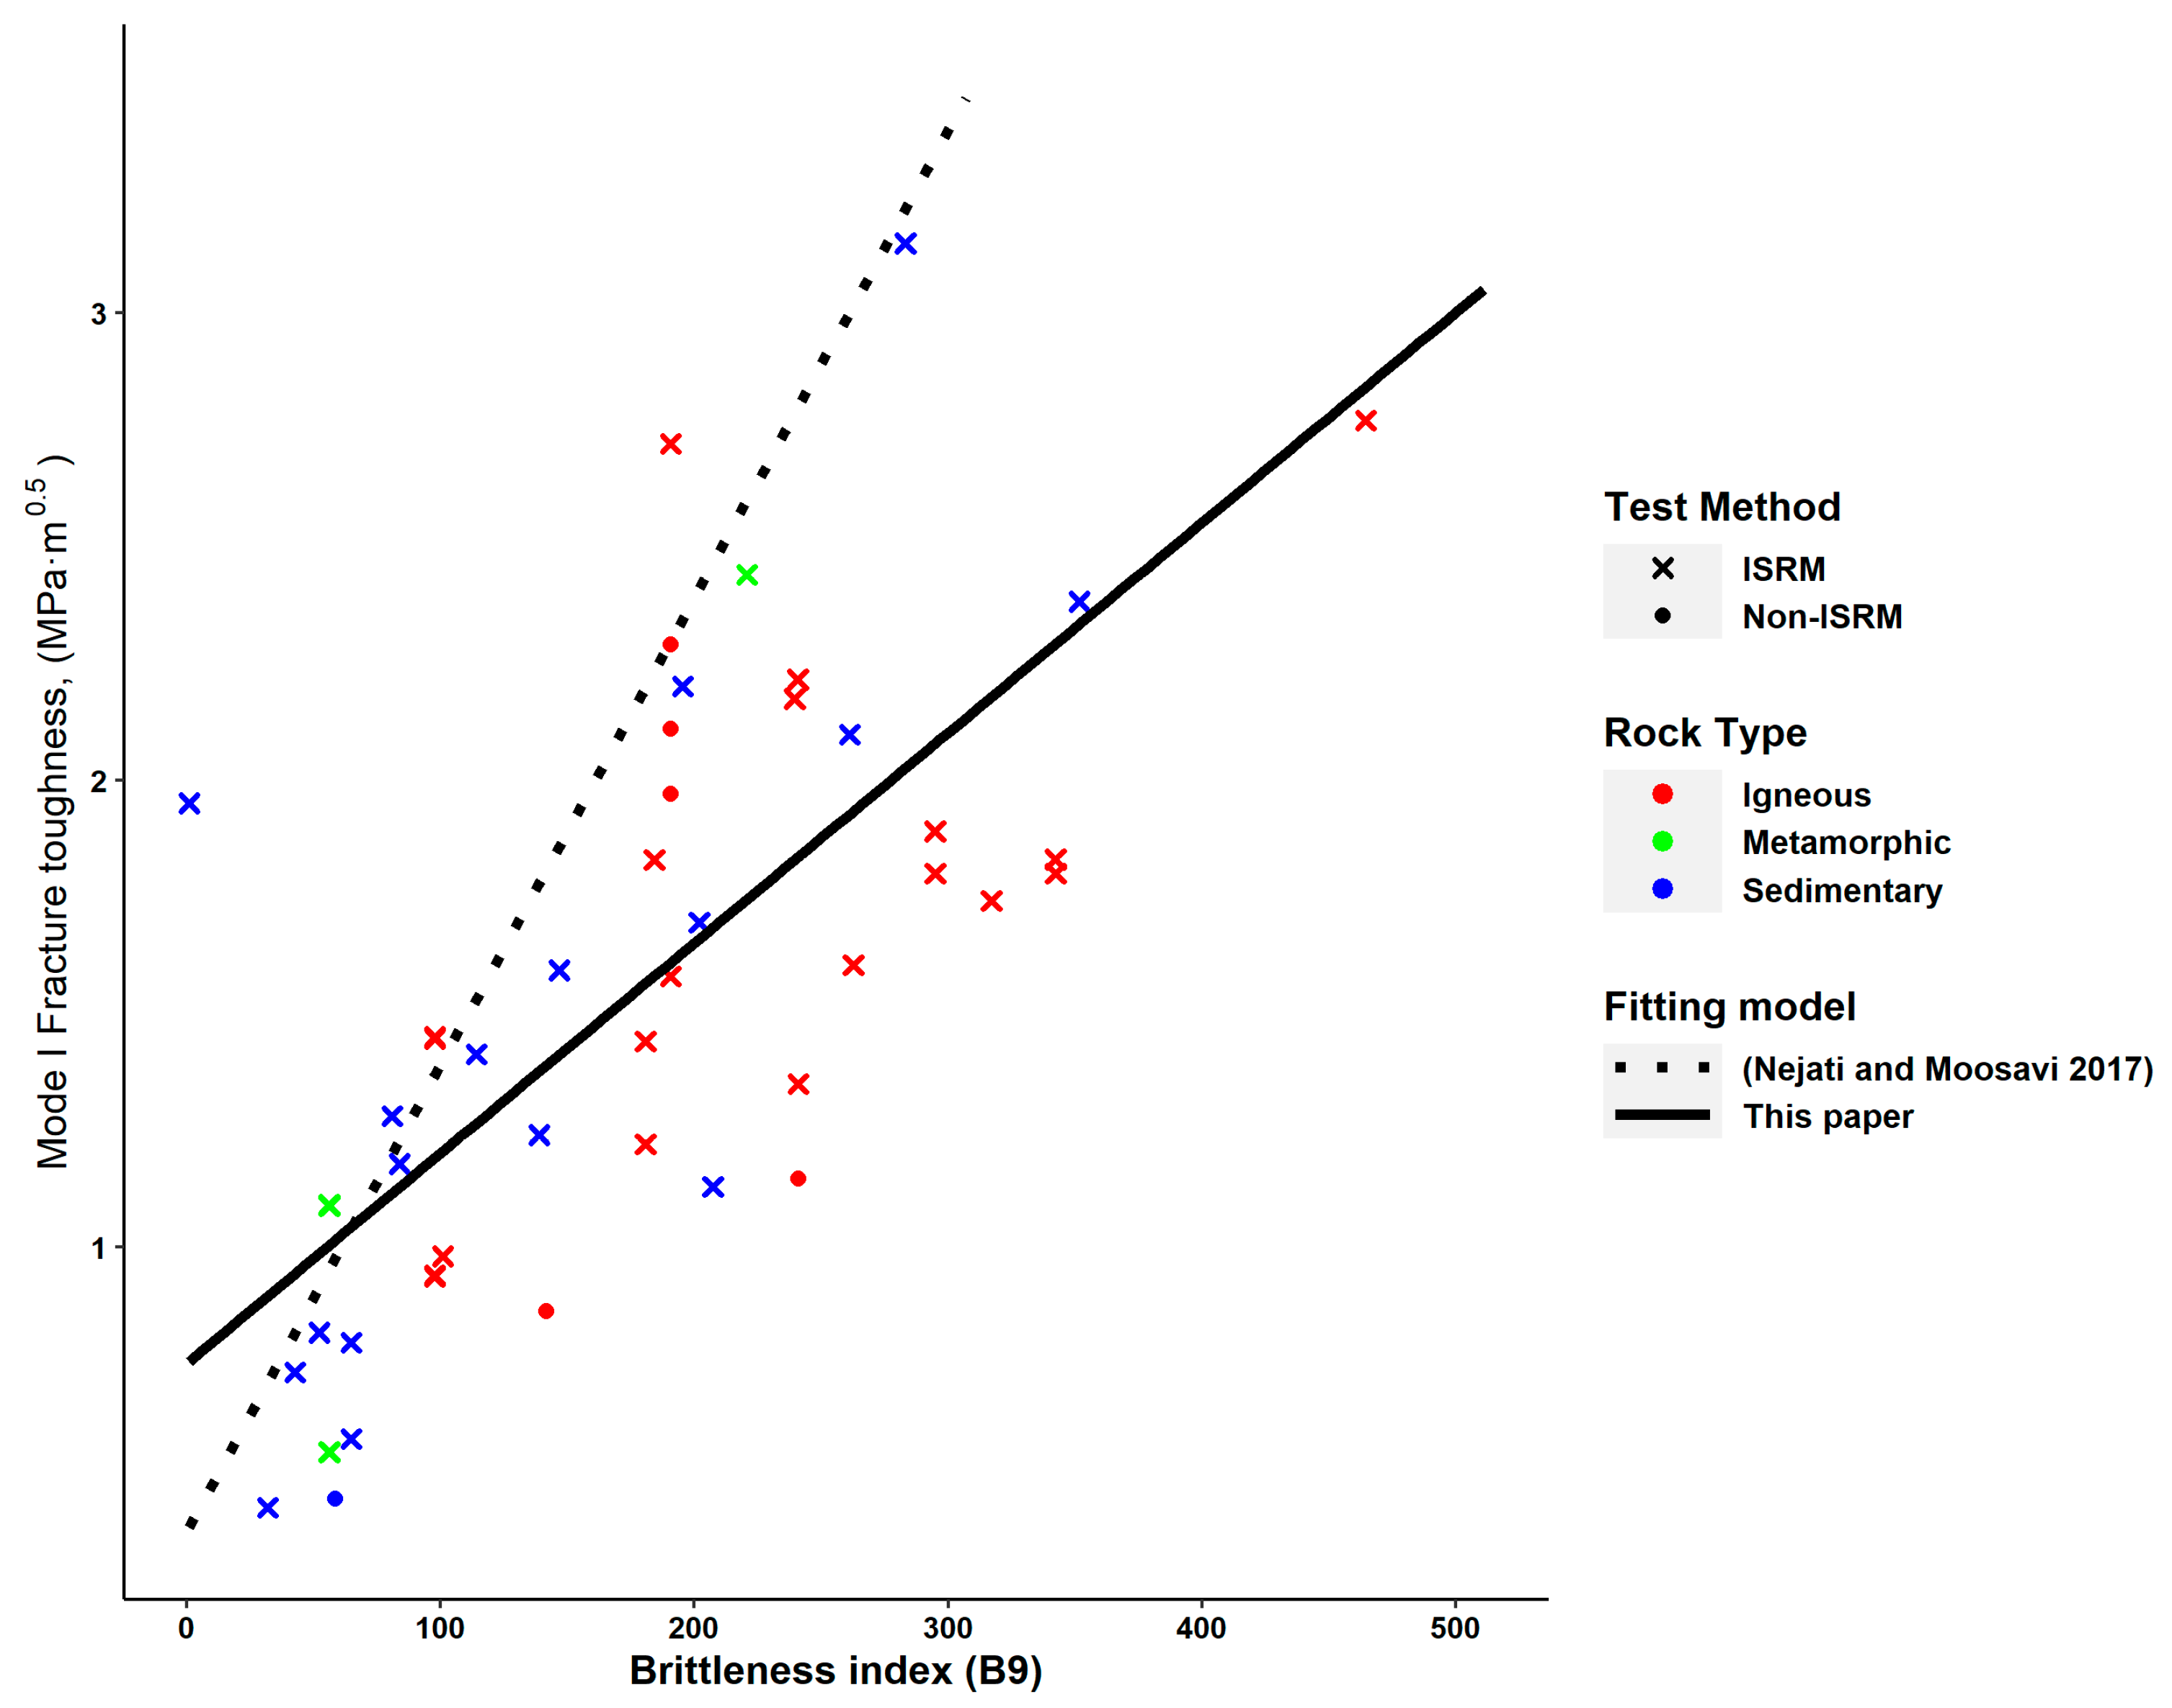
The proposed KIC—index B9 linear relationship, i.e., Equation (13) in Table 3, was compared to Equation (18) in Table 5. There were significant differences between the two relationships (Figure 12), particularly at B9 values higher than nearly 65.
These dissimilarities between the relationships proposed in this paper and the proposed ones in the literature, for indices B3, B4 and B9, may be owed to two main reasons.
The first reason may be the differences in the values of rock properties, namely σ t and σ c . Indices B3 and B4 were criticized for reflecting rock strength rather than brittleness [42,43]. Based on the formula of indices B3, B4 and B9, they would be sensitive for variations in σ t and   σ c . So, considering other types of rocks (i.e., weaker or stronger rocks) would affect the value of these indices and in turn affect their correlation significance with KIC.
A summary of descriptive statistics of the data used in this paper and [18,24,69] is shown in Table 6. The values of σ t and σ c were relatively close in general. However, the skewness (a measure of asymmetry) and the mean of σ t indicated that more rocks with lower tensile strength were considered in this paper (see Table 6). While the values of σ c were relatively close between the data in this paper and [18] and [69], rock types with higher σ c were considered in this paper compared to [24].
The second reason may be the KIC test method effect. This paper used data collected from different references, where different KIC test methods were used (Table 1). Meanwhile, Equations (18) and (20)–(22) in Table 5 were proposed using the data obtained, totally or mostly, using the CB test method, i.e., Equations (18), (20) and (21), or using the SR test method, i.e., Equation (22). In order to examine the effect of the KIC test method more closely, the relationships between KIC and each of the indices B3, B4 and B9 were examined using data in Table 1 considering only the data from the CB test. Most of these data, around 70%, were obtained from [18], i.e., the data used to obtain Equations (20) and (21). However, these data were completely different from those used to obtain Equations (18) and (22).
The results for B3, B4 and B9 are shown in Figure 13, Figure 14 and Figure 15, respectively. Considering only KIC data from CB test produced significant correlations between KIC and B3 in contrast to the weak correlations in Figure 3. Furthermore, the best correlations between KIC and each of the B4 and B9 indices had a higher R2 (0.8176 for power models) compared to R2 = 0.5044 and 0.5035 for B4 (exponential model) and B9 (linear model), respectively (see Table 3). It should be noted that there were no changes in the correlation significance between KIC and each of the B1 and B2 indices when only CB test data were considered. The increased correlation significance, particularly that between KIC and B9, indicated that there was a significant effect of the KIC test method on the correlation between KIC and strength-based indices B3, B4 and B9. Furthermore, the test method’s insignificant effect on the correlation between KIC and indices B1 and B2 confirmed that these indices were not good predictors for KIC.
Much research has reported significant differences in KIC results obtained from different test methods for the same rock. Six different KIC test methods, CB, SECRBB, SCB, SNSRB, BDT and Flattened Brazilian Disk (FBD), were investigated in [33]. It was concluded that CB was the optimum KIC test method due to its stable crack growth, which results in creating a sharp and narrow crack at the top of the notch, and the small FPZ, which satisfies the LEFM assumption. Furthermore, boundary conditions did not have any considerable effect on crack behavior [33]. Hence, CB was used, in many studies, as a reference in comparison with other test methods.
For Keochang Granite and Yeosan Marble, KIC was determined using CCNBD, SCB, BDT and chevron-notched SCB test methods. Similar values were reported between CB and CCNBD; however, the SCB results were incomparable with the remaining methods and [17]. Moreover, lower KIC values were obtained from CCNBD compared to those from CB and SR for the same rock type [31,59]. These differences may be caused by various factors such as specimen geometry and loading type [59].
The SCB test usually produced KIC values lower than those using other test methods. The KIC of Kimachi sandstone obtained from CB was 35% higher than that from SCB [58]. A 36.4% lower KIC value from SCB was reported for Dazhou sandstone compared to that using CCNBD [70]. The main causes for the conservative results from SCB are the large FPZ size, compared to other methods [33,70], and the unstable crack propagation [33]. It is believed that the notch length, in SCB samples, did not represent the critical crack length associated with the maximum load because fractures, in SCB tests, propagated before FPZ fully develops, i.e., unstable crack propagation occurred [58]. The unstable crack propagation was also reported by [54].
Furthermore, BDT results were compared with those obtained from CB for six Australian rocks. It was concluded that the results were close except for basalt, which they could not explain [71]. Similarly, it was argued that BDT was a viable KIC test method because its results were similar to CCNBD and it had simple sample preparations, i.e., no notch is needed, although a significant scatter in the BDT results was reported [17]. In contrast, BDT was found to be an improper test method in [33] due to the lack of a uniform load distribution in the sample, and the KIC calculation was based on the infinite plate assumption and the significant boundary effect on the fracture initiation and propagation.
Furthermore, the KIC obtained from the same test method and rock can vary with the sample geometry and dimensions due to their effect on the formed FPZ in samples during loading. A linear positive correlation between the FPZ size and diameter of concrete SCB samples was reported in [72]. Moreover, the notch-length-to-radius ratio was found to greatly affect KIC for SCB, CSTBD and SECRBB test methods [57,73,74]. The variations in notch type between test methods affected the crack propagation and fracturing mechanics of samples. In general, sample geometries with straight notches are characterized by the unstable crack propagation, such as in SCB samples, unlike chevron-notched specimens [33]. This may be due to the larger FPZ associated with straight notches as reported in [75] for SCB and Cracked Chevron Notched Semi-Circular Bend test methods. In fact, sample size, particularly ligament length (i.e., area above the notch), should be large enough such that the FPZ size formed under loading has an insignificant effect on the fracturing mechanism and in turn on the obtained KIC value [74,76]. Moreover, FPZ size varied between different rocks for the same test method, due to the variation in petrological properties, e.g., grain size heterogeneity and micro-crack-induced anisotropy [77,78].
Hence, we concluded that the inconsistencies in the values of rock strength properties and the different KIC test methods could explain the weaker correlations between KIC and strength-based rock brittleness indices B3, B4 and B9 reported in this paper compared to the relationships reported in the literature.
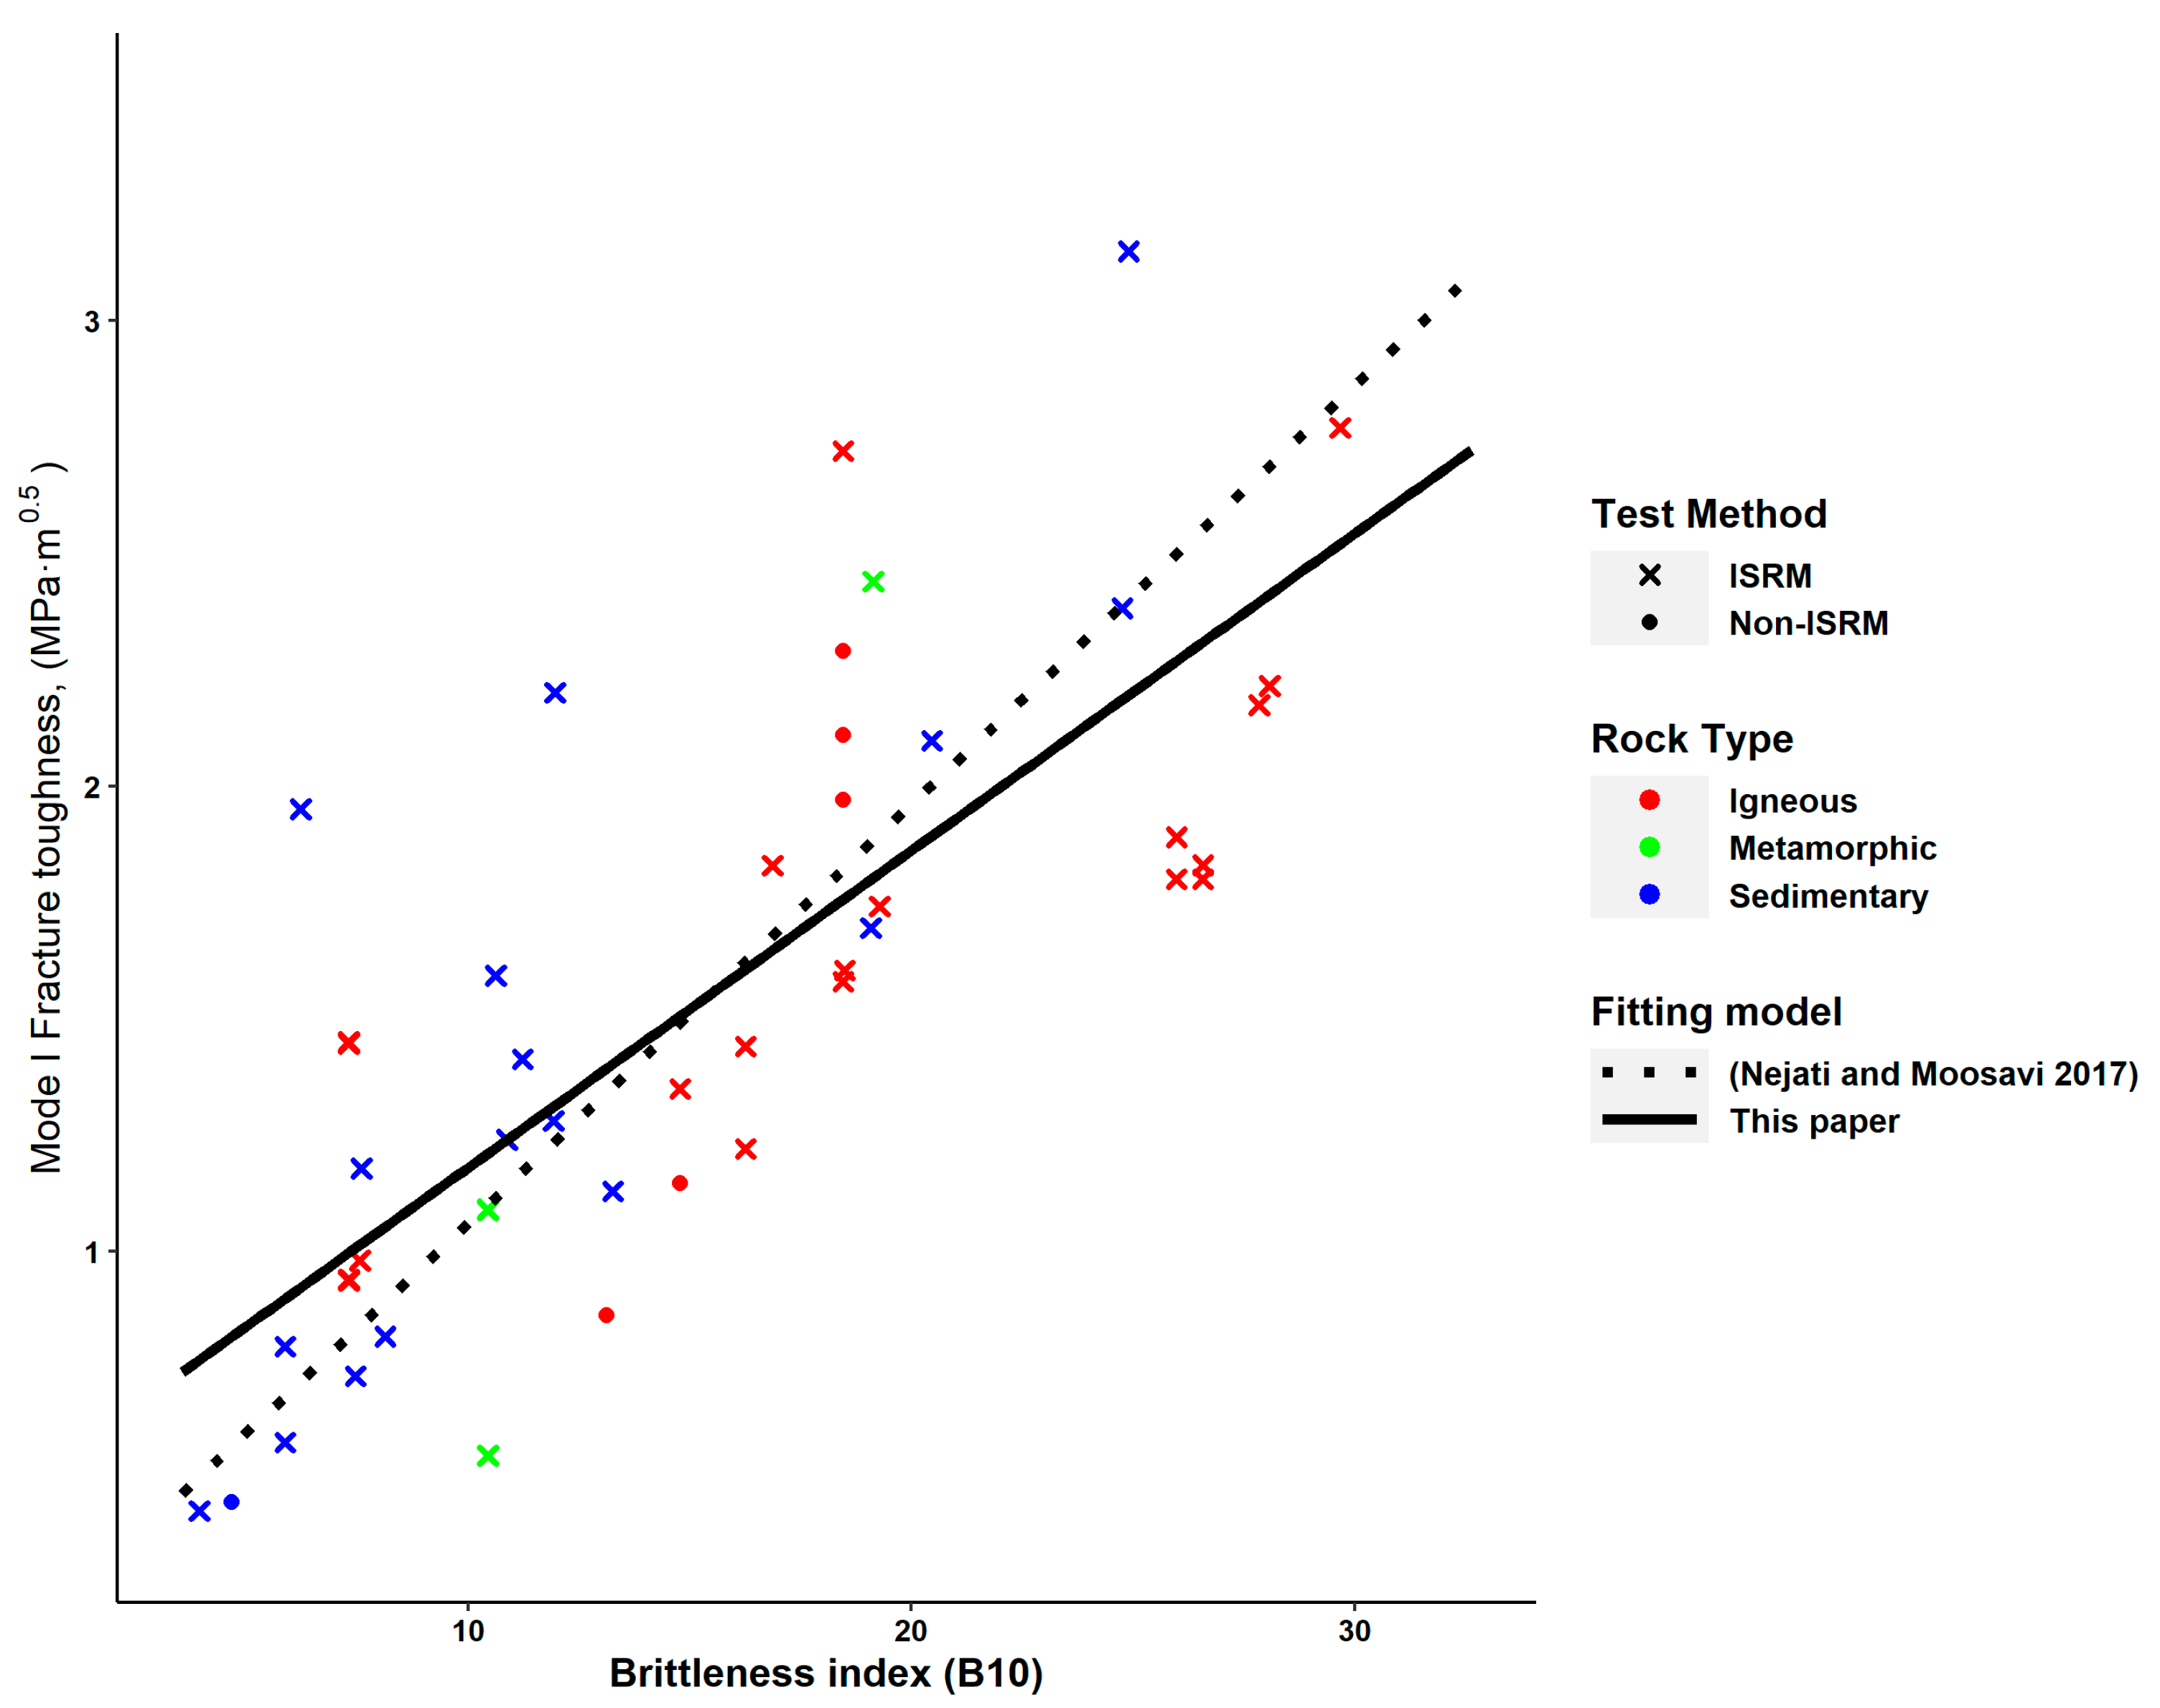
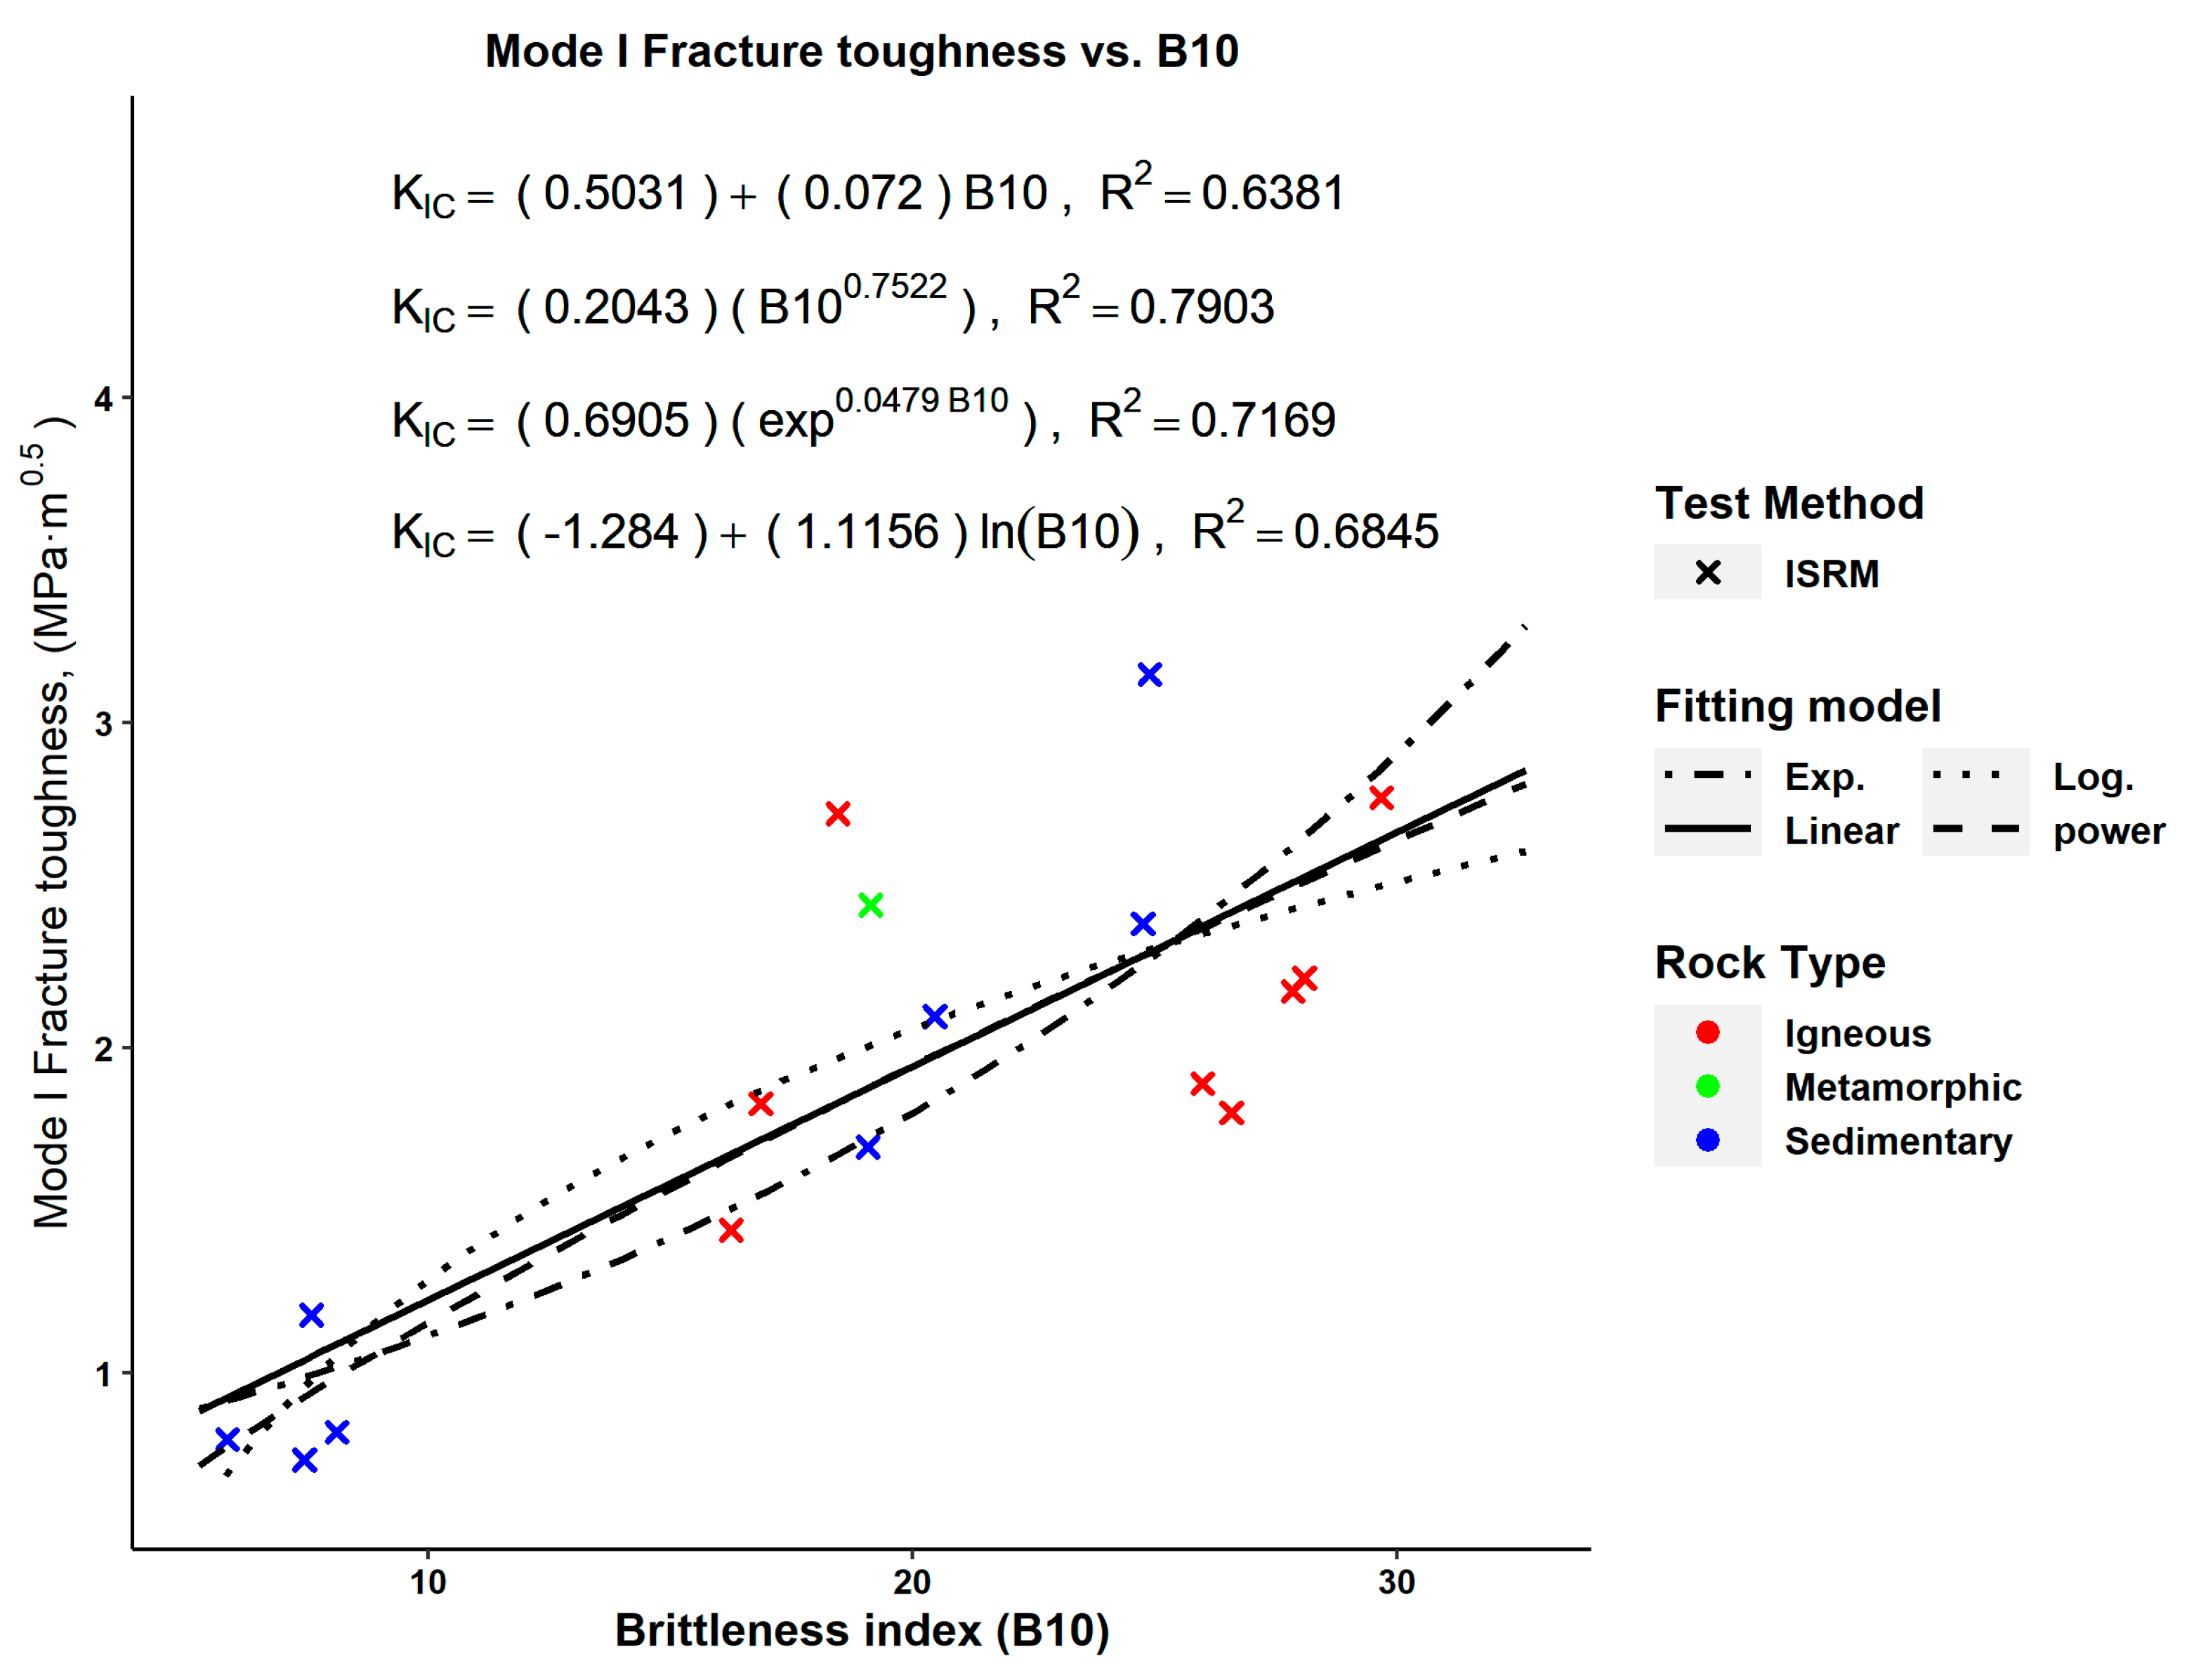
On the other hand, the KIC—index B10 relationship (Equation (16) in Table 3) showed an overall closer trend to Equation (19) in Table 5. Equation (16) overestimated KIC at values lower than nearly 15 at B10, compared to Equation (19), and underestimated KIC at values above 15 (see Figure 16). These differences were lower than those observed in Figure 11 and Figure 12 for indices B4 and B9, respectively. It should be noted that Equations (16) and (19) were proposed using two distinct datasets. Equation (19) was proposed using KIC data obtained mostly from the CB test [24], unlike this paper. This suggested that KIC—index B10 relationships were not greatly influenced by the KIC test method. However, KIC—index B10 relationships, considering only CB data from Table 1, were more significant (see Figure 17).
Moreover, less stiff rocks, i.e., rocks having lower Young’s modulus values, were considered in this paper compared to those in [24] (see the skewness of Young’s modulus in Table 6). Nonetheless, a significant correlation between KIC and index B10 was reported in this paper. For rocks that exhibit significant plastic deformation before fracturing (i.e., soft rocks), it was believed that both ultimate strength and elastic parameters must be considered in the rock brittleness index. In fact, the effect of Young’s modulus on the brittleness of such rocks was found to be more critical than σ c [24].
For the elastic-based indices, i.e., B5, B6, B7 and B8 in Table 2, there were weak correlations with KIC in contrast to the strength-based indices. The reason may be that the elastic-based brittleness indices were proposed for softer rocks, such as shale [43]. Although this paper considered more soft rock types, stiff rocks were also considered (see the skewness of Young’s modulus in Table 6). Another possible reason may be the elastic parameters’ calculation technique. Strength parameters are determined experimentally, when samples fail. Typical stress strain curves have four regions before failure, i.e., macro-cracking; 1—crack closure, 2—elastic, 3—micro-cracks initiation and 4—unstable crack propagation that ends with failure [9,79]. Elastic parameters, of the whole rock material, are estimated using data collected in the second region [9], i.e., pre-peak region with no crack propagation. In fracture mechanics, macro-cracks, i.e., failures, occurred after micro-cracks’ formation around flaws, e.g., grain boundaries, when the stress intensity exceeded fracture toughness [2]. Since elastic parameters were estimated before micro-cracks’ formation, i.e., pre-peak softening, or the propagation of any existing cracks, it can be understood why the correlation between KIC and elastic-parameter-based indices was insignificant. Compared to elastic-based indices, index B10 was proposed in terms of Young’s modulus, σ t and σ c such that the pre-fracture softening, i.e., beyond the elastic region, of rocks can be considered [24]. This may explain the significant correlation between KIC and index B10 compared to elastic-based indices. Moreover, brittleness indices based on pre-peak and post-peak strain energies were found to be more accurate in evaluating geotechnical engineering applications such as drilling operations [80]. Regarding the effect of the KIC test method, the correlations between KIC and each of the indices B5, B6, B7 and B8 were not improved when only CB data were considered.

5. Conclusions

Rock fracture toughness and rock brittleness have profound impacts on the performance of many rock engineering operations. In this paper, a general KIC—rock brittleness relationship was investigated considering different rock types and core test methods under level I and static test conditions. Rock brittleness was represented by ten indices, based on strength and pre-peak elastic parameters. It was concluded that brittleness indices based solely on pre-peak elastic parameters cannot be used for the prediction of KIC. While strength-based brittleness indices (i.e., B4 and B9) can predict KIC with reasonable accuracy, the prediction accuracy was sensitive to rock strength parameters (particularly tensile strength) and the KIC test method. For different rock types and KIC test methods, index B10 was the best brittleness index to predict KIC, because it was less sensitive to the variation in the KIC test method and rock types, in addition to considering the pre-fracture plastic deformation of weaker rock types. Taking into account that index B10 was suggested to consider pre-fracture softening and its significant correlation with KIC, it may be concluded that the LEFM assumption may not be applied for the KIC values cited in this paper and/or these values may not represent the true size-independent KIC.
In future studies, it is recommended to (i) investigate the KIC—rock brittleness relationship for each KIC test method; (ii) consider the sample size effect; and (iii) consider additional brittleness indices based on pre- and post-peak elastic parameters such as strain energy and mineralogy-based brittleness indices.

Author Contributions

Conceptualization, M.A. and A.A.; formal analysis, M.A.; investigation, M.A.; methodology, M.A.; visualization, M.A., M.E. (Mohamed Elwageeh), S.B. and M.E. (Mohamed Elkarmoty); writing—original draft, M.A.; supervision, M.E. (Mohamed Elwageeh) and A.A.; writing—review and editing, M.E. (Mohamed Elwageeh), S.B. and M.E. (Mohamed Elkarmoty). All authors have read and agreed to the published version of the manuscript.

Funding

This research received no external funding.

Institutional Review Board Statement

Not applicable.

Informed Consent Statement

Not applicable.

Data Availability Statement

Data is contained within the article.

Conflicts of Interest

The authors declare no conflict of interest.

References

  1. Feng, G.; Wang, X.C.; Kang, Y.; Luo, S.G.; Hu, Y.Q. Effects of Temperature on the Relationship between Mode-I Fracture Toughness and Tensile Strength of Rock. Appl. Sci. 2019, 9, 1326. [Google Scholar] [CrossRef]
  2. Anderson, T.L. FRACTURE MECHANICS: Fundamentals and Applications, 4th ed.; Taylor & Francis Group: Abingdon, UK, 2017; ISBN 9781420058215. [Google Scholar]
  3. Bearman, R.A.; Briggs, C.A.; Kojovic, T. The Application of Rock Mechanics Parameters to the Prediction of Comminution Behaviour. Miner. Eng. 1997, 10, 255–264. [Google Scholar] [CrossRef]
  4. Arshadnejad, S.; Goshtasbi, K.; Aghazadeh, J. A Model to Determine Hole Spacing in the Rock Fracture Process by Non-Explosive Expansion Material. Int. J. Miner. Metall. Mater. 2011, 18, 509–514. [Google Scholar] [CrossRef]
  5. Arshadnejad, S. Analysis of the First Cracks Generating Between Two Holes Under Incremental Static Loading with an Innovation Method by Numerical Modelling. Math. Comput. Sci. 2017, 2, 120. [Google Scholar] [CrossRef]
  6. Feng, G.; Wang, X.; Wang, M.; Kang, Y. Experimental Investigation of Thermal Cycling Effect on Fracture Characteristics of Granite in a Geothermal-Energy Reservoir. Eng. Fract. Mech. 2020, 235, 107180. [Google Scholar] [CrossRef]
  7. Talukdar, M.; Guha Roy, D.; Singh, T.N. Correlating Mode-I Fracture Toughness and Mechanical Properties of Heat-Treated Crystalline Rocks. J. Rock Mech. Geotech. Eng. 2018, 10, 91–101. [Google Scholar] [CrossRef]
  8. Kang, P.; Hong, L.; Fazhi, Y.; Quanle, Z.; Xiao, S.; Zhaopeng, L. Effects of Temperature on Mechanical Properties of Granite under Different Fracture Modes. Eng. Fract. Mech. 2020, 226, 106838. [Google Scholar] [CrossRef]
  9. Xu, X.; Wu, S.; Jin, A.; Gao, Y. Review of the Relationships between Crack Initiation Stress, Mode I Fracture Toughness and Tensile Strength of Geo-Materials. Int. J. Geomech. 2018, 18, 04018136. [Google Scholar] [CrossRef]
  10. Tutluoglu, L.; Keles, C. Mode I Fracture Toughness Determination with Straight Notched Disk Bending Method. Int. J. Rock Mech. Min. Sci. 2011, 48, 1248–1261. [Google Scholar] [CrossRef]
  11. Ouchterlony, F. Suggested Methods for Determining the Fracture Toughness of Rock. Int. J. Rock Mech. Min. Sci. 1988, 25, 72–96. [Google Scholar] [CrossRef]
  12. Fowell, R.J.; Hudson, J.A.; Xu, C.; Chen, J.F.; Zhao, X. Suggested Method for Determining Mode I Fracture Toughness Using Cracked Chevron Notched Brazilian Disc (CCNBD) Specimens. Int. J. Rock Mech. Min. Sci. 1995, 32, 57–64. [Google Scholar] [CrossRef]
  13. Kuruppu, M.D.; Obara, Y.; Ayatollahi, M.R.; Chong, K.P.; Funatsu, T. ISRM-Suggested Method for Determining the Mode i Static Fracture Toughness Using Semi-Circular Bend Specimen. Rock Mech. Rock Eng. 2014, 47, 267–274. [Google Scholar] [CrossRef]
  14. Guha Roy, D.; Singh, T.N.; Kodikara, J.; Talukdar, M. Correlating the Mechanical and Physical Properties with Mode-I Fracture Toughness of Rocks. Rock Mech. Rock Eng. 2017, 50, 1941–1946. [Google Scholar] [CrossRef]
  15. Afrasiabiana, B.; Eftekharib, M. Prediction of Mode I Fracture Toughness of Rock Using Linear Multiple Regression and Gene Expression Programming. J. Rock Mech. Geotech. Eng. 2022, 14, 1421–1432. [Google Scholar] [CrossRef]
  16. Zhang, Z.X. An Empirical Relation between Mode I Fracture Toughness and the Tensile Strength of Rock. Int. J. Rock Mech. Min. Sci. 2002, 39, 401–406. [Google Scholar] [CrossRef]
  17. Chang, S.H.; Lee, C.I.; Jeon, S. Measurement of Rock Fracture Toughness under Modes I and II and Mixed-Mode Conditions by Using Disc-Type Specimens. Eng. Geol. 2002, 66, 79–97. [Google Scholar] [CrossRef]
  18. Bearman, R.A. The Use of the Point Load Test for the Rapid Estimation of Mode I Fracture Toughness. Int. J. Rock Mech. Min. Sci. 1999, 36, 257–263. [Google Scholar] [CrossRef]
  19. Shi, X.; Zhao, Y.; Danesh, N.N.; Zhang, X.; Tang, T. Role of Bedding Plane in the Relationship between Mode-I Fracture Toughness and Tensile Strength of Shale. Bull. Eng. Geol. Environ. 2022, 81, 81. [Google Scholar] [CrossRef]
  20. Hu, Y.; Hu, Y.; Zhao, G.; Jin, P.; Zhao, Z.; Li, C. Experimental Investigation of the Relationships Among P-Wave Velocity, Tensile Strength, and Mode-I Fracture Toughness of Granite After High-Temperature Treatment. Nat. Resour. Res. 2022, 31, 801–816. [Google Scholar] [CrossRef]
  21. Guha Roy, D.; Singh, T.N.; Kodikara, J. Predicting Mode-I Fracture Toughness of Rocks Using Soft Computing and Multiple Regression. Meas. J. Int. Meas. Confed. 2018, 126, 231–241. [Google Scholar] [CrossRef]
  22. Kahraman, S.; Altindag, R. A Brittleness Index to Estimate Fracture Toughness. Int. J. Rock Mech. Min. Sci. 2004, 41, 343–348. [Google Scholar] [CrossRef]
  23. Saeidi, O.; Torabi, S.R.; Ataei, M.; Hoseinie, S.H. Prediction of Rock Fracture Toughness Modes I and II Utilising Brittleness Indexes. Int. J. Min. Miner. Eng. 2012, 4, 163–173. [Google Scholar] [CrossRef]
  24. Nejati, H.R.; Moosavi, S.A. A New Brittleness Index for Estimation of Rock Fracture Toughness. J. Min. Environ. 2017, 8, 83–91. [Google Scholar] [CrossRef]
  25. Cai, M. Prediction and Prevention of Rockburst in Metal Mines—A Case Study of Sanshandao Gold Mine. J. Rock Mech. Geotech. Eng. 2016, 8, 204–211. [Google Scholar] [CrossRef]
  26. Wang, S.M.; Zhou, J.; Li, C.Q.; Armaghani, D.J.; Li, X.B.; Mitri, H.S. Rockburst Prediction in Hard Rock Mines Developing Bagging and Boosting Tree-Based Ensemble Techniques. J. Cent. South Univ. 2021, 28, 527–542. [Google Scholar] [CrossRef]
  27. Sepehri, M.; Apel, D.B.; Adeeb, S.; Leveille, P.; Hall, R.A. Evaluation of Mining-Induced Energy and Rockburst Prediction at a Diamond Mine in Canada Using a Full 3D Elastoplastic Finite Element Model. Eng. Geol. 2020, 266, 105457. [Google Scholar] [CrossRef]
  28. Mikaeil, R.; Ataei, M.; Yousefi, R. Correlation of Production Rate of Ornamental Stone with Rock Brittleness Indexes. Arab. J. Geosci. 2013, 6, 115–121. [Google Scholar] [CrossRef]
  29. Kahraman, S. Correlation of TBM and Drilling Machine Performances with Rock Brittleness. Eng. Geol. 2002, 65, 269–283. [Google Scholar] [CrossRef]
  30. Jamshidi, A. Prediction of TBM Penetration Rate from Brittleness Indexes Using Multiple Regression Analysis. Model. Earth Syst. Environ. 2018, 4, 383–394. [Google Scholar] [CrossRef]
  31. Wei, M.D.; Dai, F.; Xu, N.W.; Zhao, T. Experimental and Numerical Investigation of Cracked Chevron Notched Brazilian Disc Specimen for Fracture Toughness Testing of Rock. Fatigue Fract. Eng. Mater. Struct. 2017, 41, 197–211. [Google Scholar] [CrossRef]
  32. Vavro, L.; Malíková, L.; Frantík, P.; Kubeš, P.; Keršner, Z.; Vavro, M. An Advanced Assessment of Mechanical Fracture Parameters of Sandstones Depending on the Internal Rock Texture Features. Acta Geodyn. Geomater. 2019, 16, 157–168. [Google Scholar] [CrossRef]
  33. Pakdaman, A.M.; Moosavi, M.; Mohammadi, S. Experimental and Numerical Investigation into the Methods of Determination of Mode I Static Fracture Toughness of Rocks. Theor. Appl. Fract. Mech. 2019, 100, 154–170. [Google Scholar] [CrossRef]
  34. Chandler, M.R.; Meredith, P.G.; Brantut, N.; Crawford, B.R.; Sciences, E.; Urc, E. Fracture Toughness Anisotropy in Shale. J. Geophys. Res. Solid Earth 2016, 121, 1706–1729. [Google Scholar] [CrossRef]
  35. Ghamgosar, M.; Erarslan, N.; Tehrani, K. Laboratory Investigations of Fracture Toughness and Tensile Strength for Various Rock Types. In Proceedings of the ISRM International Symposium—EUROCK 2016, Ürgüp, Turkey, 29–31 August 2016; pp. 223–228. [Google Scholar] [CrossRef]
  36. Bažant, Z.P.; Kazemi, M.T. Determination of Fracture Energy, Process Zone Length and Brittleness Number from Size Effecteffect, with Application to Rock and Concrete. Int. J. Fract. 1990, 44, 111–131. [Google Scholar] [CrossRef]
  37. Carpinteri, A. Size-Scale Transition from Ductile to Brittle Failure: Structural Response vs. Crack Growth Resistance Curve. Int. J. Fract. 1991, 51, 175–186. [Google Scholar] [CrossRef]
  38. Bažant, Z.P. Size Effect in Blunt Fracture: Concrete, Rock, Metal. J. Eng. Mech. 1984, 110, 518–535. [Google Scholar] [CrossRef]
  39. Spagnoli, A.; Carpinteri, A.; Ferretti, D.; Vantadori, S. An Experimental Investigation on the Quasi-Brittle Fracture of Marble Rocks. Fatigue Fract. Eng. Mater. Struct. 2016, 39, 956–968. [Google Scholar] [CrossRef]
  40. Gettu, R.; Bažant, Z.P.; Karr, M.E. Fracture Properties and Brittleness of High-Strength Concrete. ACI Mater. J. 1990, 87, 608–618. [Google Scholar] [CrossRef]
  41. Carpinteri, A. Size Effects in Material Strength Due to Crack Growth and Material Non-Linearity. Theor. Appl. Fract. Mech. 1984, 2, 39–45. [Google Scholar] [CrossRef]
  42. Xia, Y.; Zhou, H.; Zhang, C.; He, S.; Gao, Y.; Wang, P. The Evaluation of Rock Brittleness and Its Application: A Review Study. Eur. J. Environ. Civ. Eng. 2019, 26, 239–279. [Google Scholar] [CrossRef]
  43. Meng, F.; Wong, L.N.Y.; Zhou, H. Rock Brittleness Indices and Their Applications to Different Fields of Rock Engineering: A Review. J. Rock Mech. Geotech. Eng. 2021, 13, 221–247. [Google Scholar] [CrossRef]
  44. Carpinteri, A. Static and Energetic Fracture Parameters for Rocks and Concretes. Matér. Constr. 1981, 14, 151–162. [Google Scholar] [CrossRef]
  45. Sabri, M.; Ghazvinian, A.; Nejati, H.R. Effect of Particle Size Heterogeneity on Fracture Toughness and Failure Mechanism of Rocks. Int. J. Rock Mech. Min. Sci. 2016, 81, 79–85. [Google Scholar] [CrossRef]
  46. Team, R.C. R: A Language and Environment for Statistical Computing. 2022. Available online: https://www.scirp.org/(S(lz5mqp453ed%20snp55rrgjct55))/reference/referencespapers.aspx?referenceid=3456808 (accessed on 5 August 2023).
  47. Wickham, H.; Averick, M.; Bryan, J.; Chang, W.; McGowan, L.D.; François, R.; Grolemund, G.; Hayes, A.; Henry, L.; Hester, J.; et al. Welcome to the tidyverse. J. Open Source Softw. 2019, 4, 1686. [Google Scholar] [CrossRef]
  48. Kassambara, A. “Ggpubr: ‘Ggplot2” Based Publication Ready Plots", R Package Version 0.6.0. Available online: https://cran.rproject.org/web/packages/ggpubr/ (accessed on 5 August 2023).
  49. Wickham, H. “Modelr: Modelling Functions That Work with the Pipe”, R Package Version 0.1.10. Available online: https://CRAN.R-project.org/package=modelr/ (accessed on 5 August 2023).
  50. Li, X.; Zhang, Z.; Chen, W.; Yin, T.; Li, X. Mode I and Mode II Granite Fractures after Distinct Thermal Shock Treatments. J. Mater. Civ. Eng. 2019, 31, 06019001. [Google Scholar] [CrossRef]
  51. Xiao, P.; Li, D.; Zhao, G.; Liu, M. Experimental and Numerical Analysis of Mode i Fracture Process of Rock by Semi-Circular Bend Specimen. Mathematics 2021, 9, 1769. [Google Scholar] [CrossRef]
  52. Yin, T.; Wu, Y.; Wang, C.; Zhuang, D.; Wu, B. Mixed-Mode I + II Tensile Fracture Analysis of Thermally Treated Granite Using Straight-through Notch Brazilian Disc Specimens. Eng. Fract. Mech. 2020, 234, 107111. [Google Scholar] [CrossRef]
  53. Yin, T.; Wu, Y.; Li, Q.; Wang, C.; Wu, B. Determination of Double-K Fracture Toughness Parameters of Thermally Treated Granite Using Notched Semi-Circular Bending Specimen. Eng. Fract. Mech. 2020, 226, 106865. [Google Scholar] [CrossRef]
  54. Zuo, J.P.; Yao, M.H.; Li, Y.J.; Zhao, S.K.; Jiang, Y.Q.; Li, Z.D. Investigation on Fracture Toughness and Micro-Deformation Field of SCB Sandstone Including Different Inclination Angles Cracks. Eng. Fract. Mech. 2019, 208, 27–37. [Google Scholar] [CrossRef]
  55. Lim, I.L.; Johnston, I.W.; Choi, S.K.; Boland, J.N. Fracture Testing of a Soft Rock with Semi-Circular Specimens under Three-Point Bending. Part 1-Mode I. Int. J. Rock Mech. Min. Sci. 1994, 31, 185–197. [Google Scholar] [CrossRef]
  56. Erarslan, N.; Williams, D.J. The Damage Mechanism of Rock Fatigue and Its Relationship to the Fracture Toughness of Rocks. Int. J. Rock Mech. Min. Sci. 2012, 56, 15–26. [Google Scholar] [CrossRef]
  57. Funatsu, T.; Seto, M.; Shimada, H.; Matsui, K.; Kuruppu, M. Combined Effects of Increasing Temperature and Confining Pressure on the Fracture Toughness of Clay Bearing Rocks. Int. J. Rock Mech. Min. Sci. 2004, 41, 927–938. [Google Scholar] [CrossRef]
  58. Funatsu, T.; Shimizu, N.; Kuruppu, M.; Matsui, K. Evaluation of Mode I Fracture Toughness Assisted by the Numerical Determination of K-Resistance. Rock Mech. Rock Eng. 2015, 48, 143–157. [Google Scholar] [CrossRef]
  59. Iqbal, M.J.; Mohanty, B. Experimental Calibration of ISRM Suggested Fracture Toughness Measurement Techniques in Selected Brittle Rocks. Rock Mech. Rock Eng. 2007, 40, 453–475. [Google Scholar] [CrossRef]
  60. Alkiliçgil, Ç. Development of Specimen Geometries for Mode I Fracture Toughness Testing with Disc Type Rock Specimens; Middle East Technical University: Ankara, Turkey, 2010. [Google Scholar]
  61. Alpay, C. Investigation of Geometrical Factors for Determining Fracture Toughness with the Modified Ring Test; Middle East Technical University: Ankara, Turkey, 2008. [Google Scholar]
  62. Yarali, O.; Soyer, E. The Effect of Mechanical Rock Properties and Brittleness on Drillability. Sci. Res. Essays 2011, 6, 1077–1088. [Google Scholar] [CrossRef]
  63. Safari Farrokhad, S.; Lashkaripour, G.R.; Hafezi Moghaddas, N.; Aligholi, S.; Sabri, M.M.S. The Effect of the Petrography, Mineralogy, and Physical Properties of Limestone on Mode I Fracture Toughness under Dry and Saturated Conditions. Appl. Sci. 2022, 12, 9237. [Google Scholar] [CrossRef]
  64. Peck, R.; Olsen, C.; Devore, J. Introduction to Statistics and Data Analysis, 3rd ed.; Thomson Higher Education: Belmont, CA, USA, 2008; ISBN 9780495118732. [Google Scholar]
  65. Hauke, J.; Kossowski, T. Comparison of Values of Pearson’s and Spearman’s Correlation Coefficients on the Same Sets of Data. Quaest. Geogr. 2011, 30, 87–93. [Google Scholar] [CrossRef]
  66. Mishra, P.; Pandey, C.M.; Singh, U.; Gupta, A.; Sahu, C.; Keshri, A. Descriptive Statistics and Normality Tests for Statistical Data. Ann. Card. Anaesth. 2019, 22, 67–72. [Google Scholar] [CrossRef]
  67. Rani Das, K. A Brief Review of Tests for Normality. Am. J. Theor. Appl. Stat. 2016, 5, 5. [Google Scholar] [CrossRef]
  68. Ghasemi, A.; Zahediasl, S. Normality Tests for Statistical Analysis: A Guide for Non-Statisticians. Int. J. Endocrinol. Metab. 2012, 10, 486–489. [Google Scholar] [CrossRef]
  69. Gunsallus, K.L.; Kulhawy, F.H. A Comparative Evaluation of Rock Strength Measures. Int. J. Rock Mech. Min. Sci. 1984, 21, 233–248. [Google Scholar] [CrossRef]
  70. Wei, M.D.; Dai, F.; Xu, N.W.; Zhao, T.; Xia, K.W. Experimental and Numerical Study on the Fracture Process Zone and Fracture Toughness Determination for ISRM-Suggested Semi-Circular Bend Rock Specimen. Eng. Fract. Mech. 2016, 154, 43–56. [Google Scholar] [CrossRef]
  71. Guo, H.; Aziz, N.I.; Schmidt, L.C. Rock Fracture-Toughness Determination by the Brazilian Test. Eng. Geol. 1993, 33, 177–188. [Google Scholar] [CrossRef]
  72. Xu, S.; Malik, M.A.; Li, Q.; Wu, Y. Determination of Double-K Fracture Parameters Using Semi-Circular Bend Test Specimens. Eng. Fract. Mech. 2016, 152, 58–71. [Google Scholar] [CrossRef]
  73. Khan, K.; Al-Shayea, N.A. Effect of Specimen Geometry and Testing Method on Mixed Mode I-II Fracture Toughness of a Limestone Rock from Saudi Arabia. Rock Mech. Rock Eng. 2000, 33, 179–206. [Google Scholar] [CrossRef]
  74. Dutler, N.; Nejati, M.; Valley, B.; Amann, F.; Molinari, G. On the Link between Fracture Toughness, Tensile Strength, and Fracture Process Zone in Anisotropic Rocks. Eng. Fract. Mech. 2018, 201, 56–79. [Google Scholar] [CrossRef]
  75. Wong, L.N.Y.; Guo, T.Y. Microcracking Behavior of Two Semi-Circular Bend Specimens in Mode I Fracture Toughness Test of Granite. Eng. Fract. Mech. 2019, 221, 106565. [Google Scholar] [CrossRef]
  76. Wei, M.D.; Dai, F.; Xu, N.W.; Zhao, T.; Liu, Y. An Experimental and Theoretical Assessment of Semi-Circular Bend Specimens with Chevron and Straight-through Notches for Mode I Fracture Toughness Testing of Rocks. Int. J. Rock Mech. Min. Sci. 2017, 99, 28–38. [Google Scholar] [CrossRef]
  77. Nasseri, M.H.B.; Mohanty, B. Fracture Toughness Anisotropy in Granitic Rocks. Int. J. Rock Mech. Min. Sci. 2008, 45, 167–193. [Google Scholar] [CrossRef]
  78. Aliha, M.R.M.; Ayatollahi, M.R. Rock Fracture Toughness Study Using Cracked Chevron Notched Brazilian Disc Specimen under Pure Modes I and II Loading—A Statistical Approach. Theor. Appl. Fract. Mech. 2014, 69, 17–25. [Google Scholar] [CrossRef]
  79. Ghasemi, S.; Khamehchiyan, M.; Taheri, A.; Nikudel, M.R.; Zalooli, A. Crack Evolution in Damage Stress Thresholds in Different Minerals of Granite Rock. Rock Mech. Rock Eng. 2020, 53, 1163–1178. [Google Scholar] [CrossRef]
  80. Munoz, H.; Taheri, A.; Chanda, E.K. Fracture Energy-Based Brittleness Index Development and Brittleness Quantification by Pre-Peak Strength Parameters in Rock Uniaxial Compression. Rock Mech. Rock Eng. 2016, 49, 4587–4606. [Google Scholar] [CrossRef]
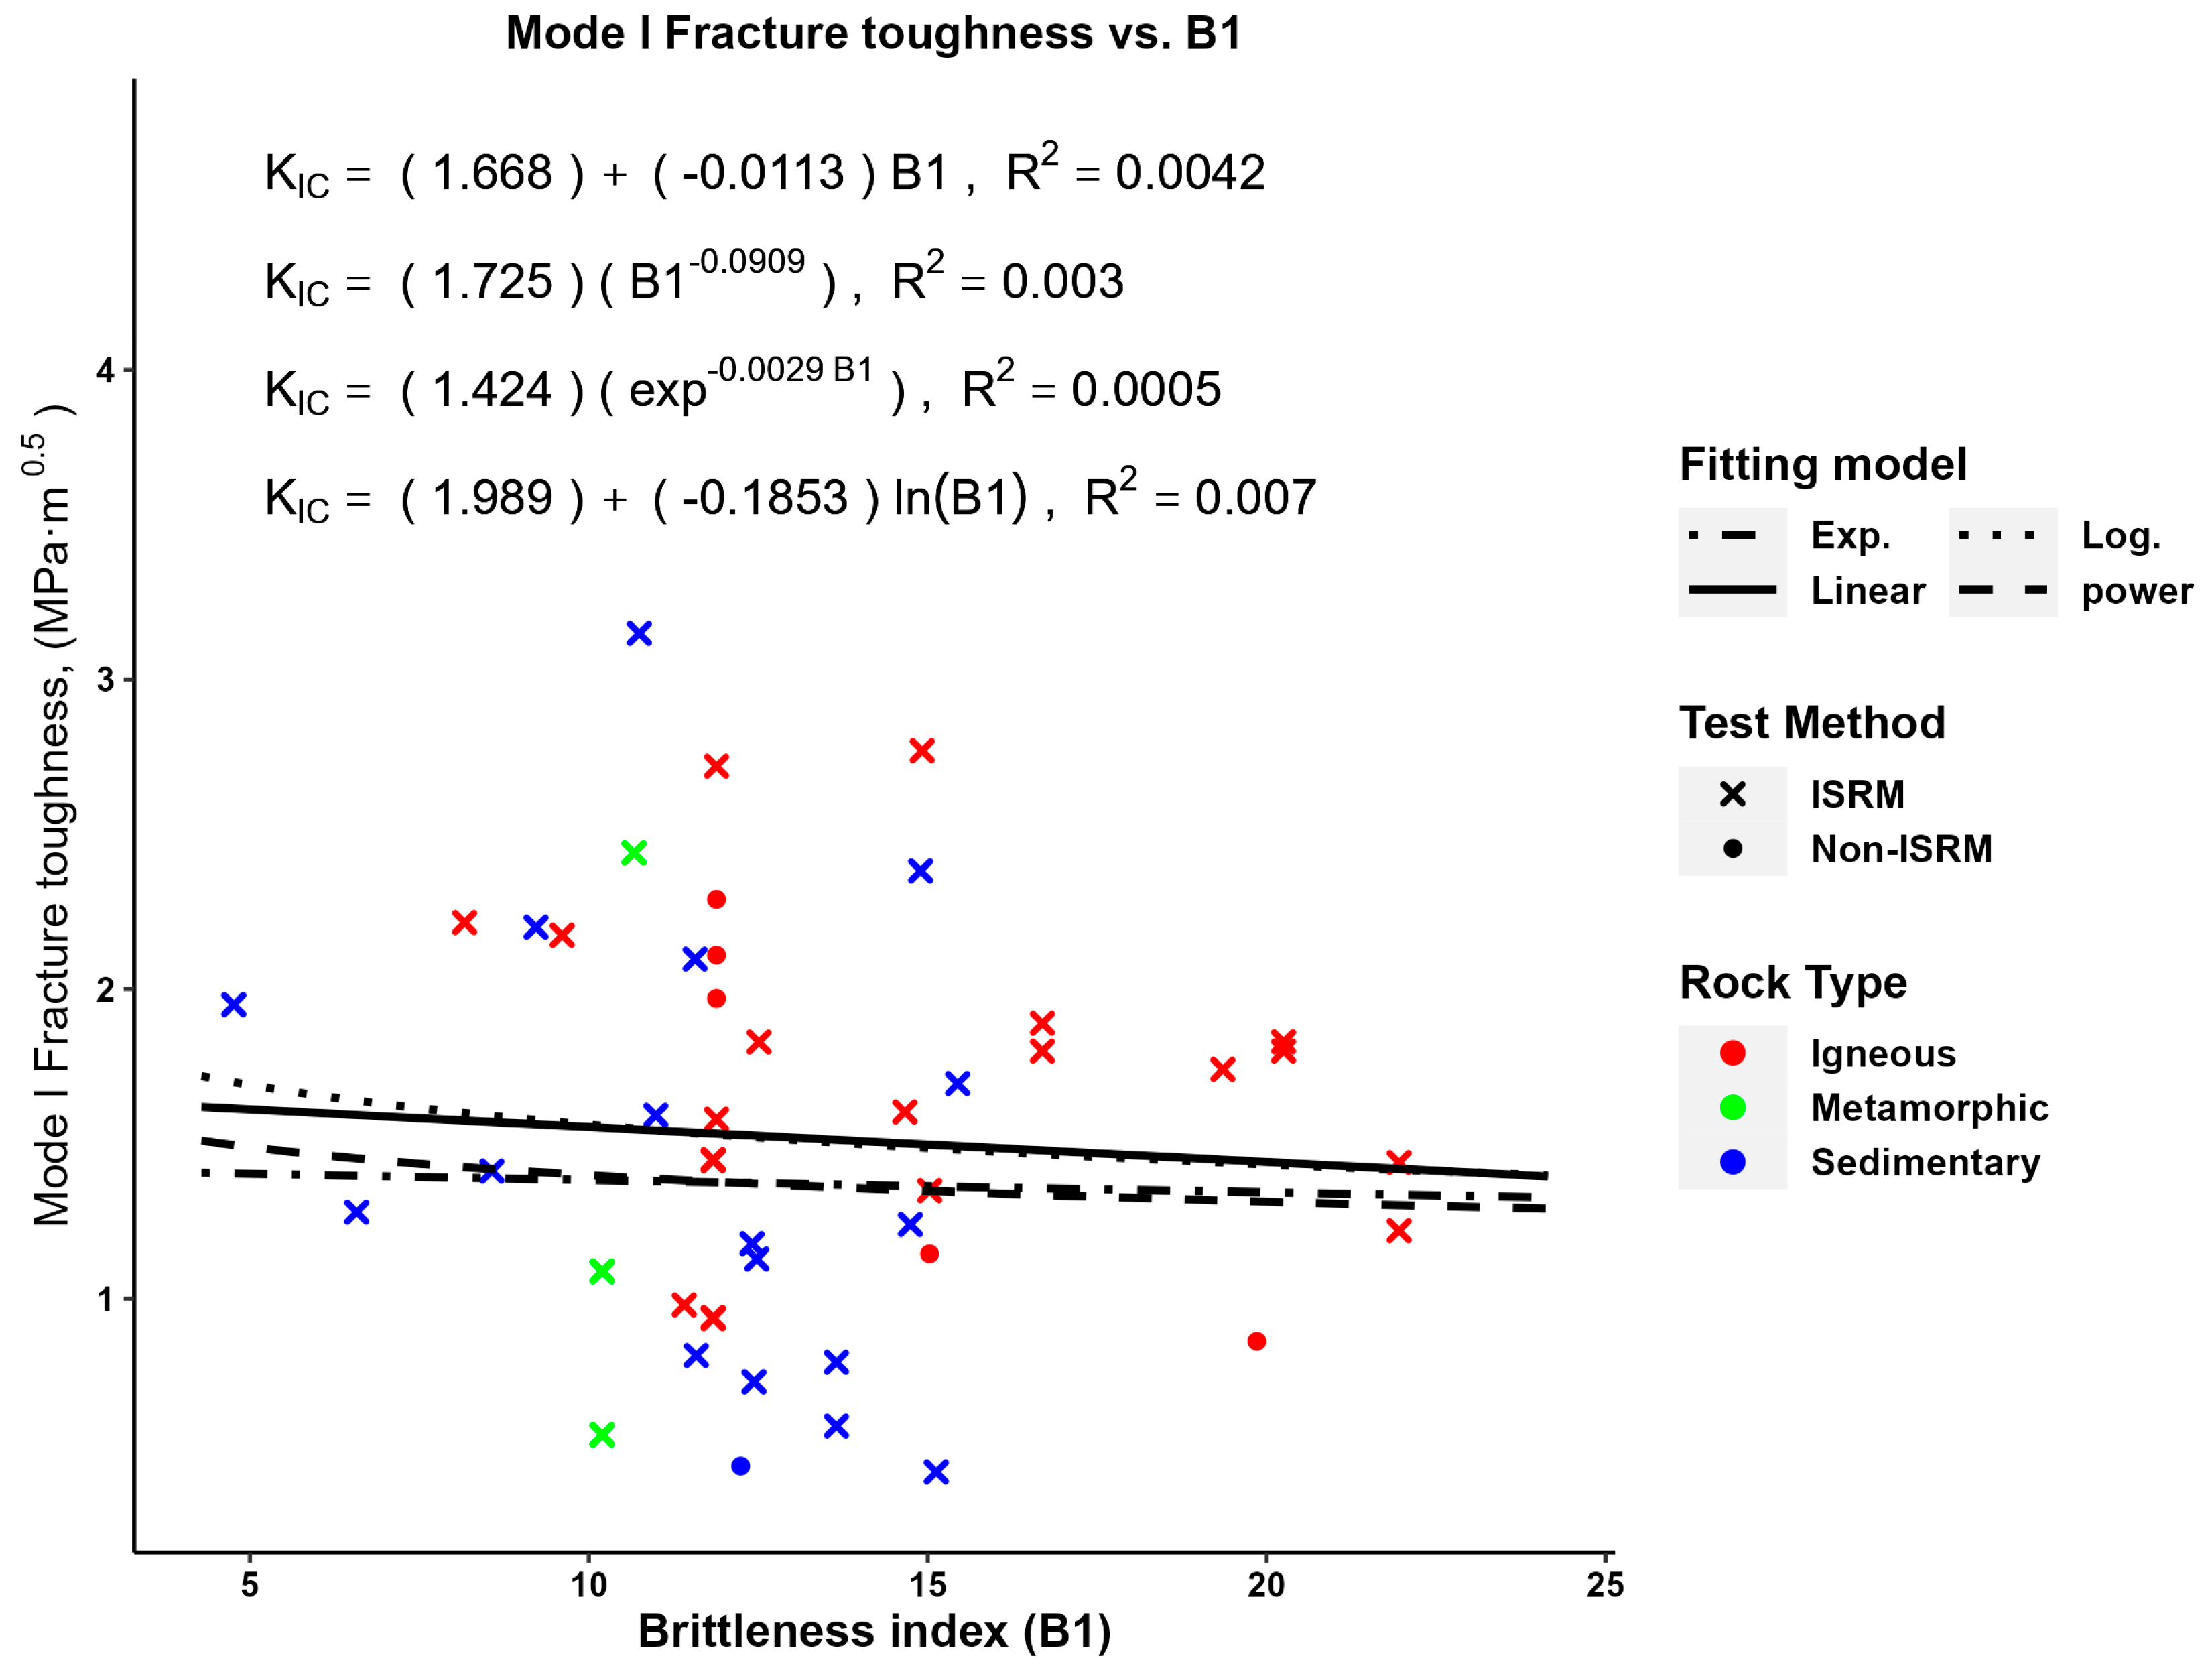
Figure 1. KIC−rock brittleness (B1) relationships.
Applsci 13 10378 g001
Figure 2. KIC−rock brittleness (B2) relationships.
Applsci 13 10378 g002
Figure 3. KIC−rock brittleness (B3) relationships.
Applsci 13 10378 g003
Figure 4. KIC−rock brittleness (B4) relationships.
Applsci 13 10378 g004
Figure 5. KIC−rock brittleness (B5) relationships.
Applsci 13 10378 g005
Figure 6. KIC−rock brittleness (B6) relationships.
Applsci 13 10378 g006
Figure 7. KIC−rock brittleness (B7) relationships.
Applsci 13 10378 g007
Figure 8. KIC−rock brittleness (B8) relationships.
Applsci 13 10378 g008
Figure 9. KIC−rock brittleness (B9) relationships.
Applsci 13 10378 g009
Figure 10. KIC−rock brittleness (B10) relationships.
Applsci 13 10378 g010
Figure 11. Comparison between the deduced KIC—rock brittleness index B4 relationships, i.e., Equation (11) in Table 3, and relationships from [23], i.e., Equations (21) and (22) in Table 5.
Applsci 13 10378 g011
Figure 12. Comparison between the deduced KIC—rock brittleness index B9 relationships, i.e., Equation (13) in Table 3, and the relationship from [24], i.e., Equation (18) in Table 5.
Applsci 13 10378 g012
Figure 13. KIC−rock brittleness (B3) relationships considering only CB test method.
Applsci 13 10378 g013
Figure 14. KIC−rock brittleness (B4) relationships considering only CB test method.
Applsci 13 10378 g014
Figure 15. KIC−rock brittleness (B9) relationships considering only CB test method.
Applsci 13 10378 g015
Figure 16. Comparison between the deduced KIC−rock brittleness index B10 relationships, i.e., Equation (16) in Table 3, and relationship from [24], i.e., Equation (19) in Table 5.
Applsci 13 10378 g016
Figure 17. KIC−rock brittleness (B10) relationships considering only CB test method.
Applsci 13 10378 g017
Table 1. Literature data used in this paper.
ReferenceRock TypeTest Method K I C
(MPa⋅m0.5)
σ t
(MPa)
σ c
(MPa)
E
(GPa)
υ
[60]Ankara andesiteSCB0.9367.00082.84012.3340.150
Ankara andesiteCCNBD1.4467.00082.84012.3340.150
white Afyon marbleSCB0.5615.13052.32034.2940.120
white Afyon marbleCCNBD1.0885.13052.32034.2940.120
[61]Pink Ankara andesiteSCB0.9807.29083.16012.3300.160
[18]Middleton limestoneCB0.7323.84047.76027.5200.230
Harrycroft limestoneCB0.8174.58053.06025.4500.250
Montclie sandstoneCB1.1786.15076.31015.9200.130
Wredon limestoneCB1.69510.150156.73057.1700.280
Penryn graniteCB1.82910.580132.36039.1000.290
Pennant sandstoneCB2.09714.020162.19039.0700.310
Whitwick andesiteCB2.17414.490139.20063.6000.230
Bolton hill dioriteCB2.21515.770128.81054.4500.340
Ingleton greywackeCB2.38215.190226.26057.0400.170
Nuneaton quartziteCB2.44012.990138.58036.4000.240
Clie hill dioriteCB2.77018.420274.82064.1800.280
Cornish greywackeCB3.14915.390165.36049.6200.250
[56]Brisbane tuffCCNBD1.12911.500143.50022.0000.240
[6]Suizhou GraniteSCB1.74112.400240.00050.0000.240
[57]Kimachi sandstoneSECRBB0.4604.82059.0008.2300.220
[58]Kimachi sandstoneSCB0.5894.90066.90013.2000.180
Kimachi sandstoneCB0.7954.90066.90013.2000.180
[59]Barre graniteCB1.89012.700212.00082.0000.160
Barre graniteCCNBD1.80012.700212.00082.0000.160
Laurentian graniteCB1.80012.790259.00092.0000.210
Laurentian graniteCCNBD1.83012.790259.00092.0000.210
Stanstead graniteCB1.4407.880173.00066.0000.160
Stanstead graniteCCNBD1.2207.880173.00066.0000.160
[50]Hunan GraniteCSTBD0.8637.000139.00048.1000.260
[55]JohnstoneSCB1.9500.4202.000200.0000.300
[33]GabbroSECRBB2.29011.120132.15042.9800.180
GabbroCB2.72011.120132.15042.9800.180
GabbroSCB1.58011.120132.15042.9800.180
GabbroSNSRB1.97011.120132.15042.9800.180
GabbroBDT2.11011.120132.15042.9800.180
[19]Shizhu ShaleCCNBD1.2408.010118.10024.9570.328
Shizhu ShaleCCNBD1.2808.24354.20020.6870.251
Shizhu ShaleCCNBD1.4139.17078.60017.9770.285
Shizhu ShaleCCNBD1.5939.638105.90016.8030.309
Shizhu ShaleCCNBD2.20012.840118.40013.8270.371
[10]Ankara andesiteSCB0.9407.00082.84012.3340.150
Ankara andesiteCCNBD1.4507.00082.84012.3340.150
Afyon marbleSCB0.5605.13052.32034.2940.120
Afyon marbleCCNBD1.0905.13052.32034.2940.120
[51]Fujian graniteSCB1.60312.500183.30040.7100.230
[52]Fujian graniteCSTBD1.14511.630174.78028.9400.200
[53]Fujian graniteSCB1.34911.630174.78028.9400.200
[54]Bayan SandstoneSCB0.4412.85043.11012.2400.170
K I C : Mode I fracture toughness; σ t : Brazilian tensile strength; σ c : Uniaxial compressive strength; E : Young’s modulus; υ : Poisson’s ratio; SECRBB: Single Edge Crack Round Bar Bending; CSTBD: Cracked Straight Through Brazilian Disc; SNSRB: Straight Notched Short Rod Bend; BDT: Brazilian Disk Test.
Table 2. The brittleness indices used in this paper.
Brittleness Index EquationNo.Reference
B 1 = σ c σ t (1)[42,43]
B 2 = σ c σ t σ c + σ t (2)[42,43]
B 3 = σ c × σ t 2 (3)[42,43]
B 4 = σ c × σ t 2 (4)[42,43]
B 5 = 0.5 × 100 × [ E 1 8 1 + υ 0.4 0.15 0.4 ] (5)[42]
B 6 = 3   K 5 λ λ = 1 υ 4 (6)[42,43]
B 7 = E λ =   1 υ 1 2 υ (7)[42,43]
B 8 = λ + 2 G λ = 1 υ 1 (8)[42,43]
B 9 = ( σ c × σ t ) 0.72 (9)[24]
B 10 = σ t 0.84   E 0.51 σ c 0.21 (10)[24]
K : bulk modulus, defined as K = E 3 ( 1 2 υ ) ;   λ : Lame’s constant, defined as λ = E   υ ( 1 + υ ) ( 1 2 υ ) ;   G : bulk modulus, defined as G = E 2 ( 1 + υ ) .
Table 3. Regression results of KIC—rock brittleness index relationships with (R2 > 0.5).
EquationNo.Figure No.RMSEp-Value
(Pearson)
p-Value
(Spearman)
K I C = 0.6333   e x p 0.032   B 4 ,   R 2 = 0.5044 (11)Figure 40.33751.57 × 10−8N.A.
K I C = 0.7745   e x p 0.0033   B 9 ,   R 2 = 0.5014 (12)Figure 90.33851.81 × 10−8N.A.
K I C = 0.751 + 0.0045 B 9 ,   R 2 = 0.5035 (13)0.45431.64 × 10−8N.A.
K I C = 0.6498 e x p 0.0498   B 10 ,   R 2 = 0.5616 (14)Figure 100.3174N.A.9.86 × 10−11
K I C = 0.8719 + 0.9278   l n ( B 10 ) ,   R 2 = 0.5739 (15)0.4209N.A.9.86 × 10−11
K I C = 0.4992 + 0.0681 B 10 ,   R 2 = 0.5813 (16)0.4173N.A.9.86 × 10−11
K I C = 0.2205   B 10 0.7087 ,   R 2 = 0.6058 (17)0.1307N.A.9.86 × 10−11
Table 4. Results of Shapiro–Wilk normality test.
K I C σ t σ c E υ B4B9B10
Statistic0.97890.975990.95420.7620.94970.97550.95440.9348
p-value0.53510.42010.05891.98 × 10−70.03890.40710.060.0103
p-value > 0.05, the null hypothesis is accepted where there is no difference between the sample distribution and a normal distribution, i.e., there is not enough evidence of non-normality. Otherwise, the alternative hypothesis is accepted.
Table 5. KIC—rock brittleness indices from the literature.
EquationNo.Reference
K I C = ( 0.01 )   B 9 + ( 0.39 )                 ,   R 2 = 0.61 (18)[24]
K I C = ( 0.09 )   B 10 + ( 0.16 )               ,     R 2 = 0.68 (19)
K I C = ( 0.11 )   B 3 0.43                 ,   R = 0.96 (20)[22]
K I C = ( 0.107 )   B 4 0.8663                 ,     R 2 = 0.9262 (21)[23]
K I C = ( 0.3952 )   B 4 0.4315             ,     R 2 = 0.5857 (22)
Table 6. Descriptive statistics of the rock properties used in this paper.
ReferenceParameter σ t (MPa) σ c (MPa)E (GPa) υ
This paperMean9.42125.8841.310.21
Range0.42 to 18.422 to 274.828.23 to 200.000.12 to 0.37
Standard deviation3.9265.1132.310.06
Skewness−0.02300.47822.72060.5499
[18]Mean11.8141.7944.130.25
Range3.84 to 18.4247.76 to 274.8215.92 to 64.180.13 to 0.34
Standard deviation4.7665.5815.910.06
Skewness−0.60260.452−0.3654−0.6731
[69]Mean12.82150.83----------
Range5.9 to 1757.2 to 264----------
Standard deviation3.6158.84----------
Skewness−0.88340.3376----------
[24]Mean9.97137.2250.22-----
Range2.3 to 17.632.3 to 2249.9 to 78-----
Standard deviation4.6156.2620.21-----
Skewness−0.1017−0.1939−0.6577-----
Disclaimer/Publisher’s Note: The statements, opinions and data contained in all publications are solely those of the individual author(s) and contributor(s) and not of MDPI and/or the editor(s). MDPI and/or the editor(s) disclaim responsibility for any injury to people or property resulting from any ideas, methods, instructions or products referred to in the content.