1. Introduction
The grouting technique is extensively applied in the fields of geotechnical reinforcement and waterproofing underground engineering. However, engineers are more likely to use empirical formulas when dealing with grouting problems due to a lack of understanding of the diffusion law of slurry and the strength characteristics of grouting soil. For economic consideration, it is significant to reveal the diffusion law of slurry and predict the increase in shear strength of grouting soil. The published literature has mainly studied the grouting mechanism and the slurry diffusion law by means of theoretical deduction [
1,
2,
3,
4,
5,
6,
7], numerical simulation [
8,
9,
10,
11,
12,
13], and model tests [
14,
15,
16,
17,
18,
19,
20,
21]. In terms of theoretical research, Maghous et al. [
22] presented a macroscopic model of cement grout flow in a porous medium based on the mass balance equations of the different components present in the grouted medium as well as on a general phenomenological filtration law. Maghous’s research focuses only on the situation of radial flow filtration. Bezuijen et al. [
23] developed an analytical model to estimate the fracture grouting process in sand. The results provided a guideline for assessing the parameters that affect the fracture process. However, the assumption that the complex shape of a fracture in sand is simplified to a plane or a tube In terms of numerical simulation, a series of numerical simulations have been conducted to assess the capability of compensation grouting modeling [
24]. Based on an orthogonal test, Xiao et al. [
25] proposed a new model for grouting simulation. It also needs to be mentioned that numerical simulation methods can be time-consuming and usually require a larger number of input variables, some of which should be estimated or assumed if they are not available at hand. A distinct advantage of the model test methods lies in the fact that the test data can provide meaningful physical insight into the governing parameters and also offer direct design data for grouting engineers.
Nevertheless, only a few studies have been conducted to study the law of grouting diffusion and diffusion radius by grouting model tests. For instance, Nichols et al. [
26] carried out a small-scale model compaction grouting test and came to the conclusion that the shape of the injected grout bulb is a function of overburden pressure. Chupin et al. [
27] conducted a grouting model test to study the slurry flow and transport with filtration in porous media, which was used to analyze large-scale grouting. In Bezuijen’s et al. [
23] study, laboratory experiments were carried out to investigate the mechanisms present during compensation grouting in sand. The results show that more cement in the grout results in a thicker filter cake and, therefore, higher injection pressures and shorter and thicker fractures. In order to study the influence of pressure filtration on tip improvement and provide insight into the influence factors of pressure filtration, Fang et al. [
28] conducted a comprehensive series of laboratory model experiments. The test results indicate that the velocity of pressure filtration is determined by the velocity of water through clay. Li et al. [
29] carried out a small-scale model compaction grouting test and obtained the conclusion that the curves of both injection pressures versus time and injection rate versus time showed a wavelike relationship.
Up until now, the diffusion law of slurry and the characteristics of grouting soil have been studied by a single analytical or numerical method. While research on grouting model tests is relatively rare, In order to gain a deeper and more thorough understanding of the diffusion law of slurry and the characteristics of grouting soil, the grouting model test was carried out in this study to investigate the distribution and diffusion law of slurry in alluvial filler. The strength characteristics of grouted soil were first studied by a soil test and a dynamic penetration test. Compared with previous studies, this study investigated the diffusion law of slurry and characteristics of grouting soil more comprehensively since it combined the methods of field experiment and theoretical analysis. Based on the Mohr-Coulomb yield criterion and Taylor series, a theoretical model to describe the shear strength growth of grouting soil was then developed. This model was verified by a laboratory soil test and a dynamic penetration test. The diffusion pattern of the grouting slurry was observed during the excavation of the grouting model container. The geological radar test and slurry shrinkage test were carried out to verify the developed theoretical method for determining the grouting volume.
2. Test Methods and Test Scheme
2.1. The Importance of Model Test
Before implementing full-scale grouting in the field, model testing is often conducted to simulate and understand the grouting behavior in a controlled environment. Physical models can be used to study how grout interacts with alluvial filler soil, how it spreads, and how it influences the soil’s properties. Model testing allows engineers to refine grouting parameters, such as injection pressure, grout mix design, and injection duration, to achieve the desired results.
Model testing is an essential step in the pre-grouting phase, as it can provide valuable data and insights that can significantly improve the success of the grouting project. Furthermore, model testing helps refine the grouting strategy, minimize uncertainties, and optimize resources before moving on to the actual field implementation.
2.2. Test Methods and Devices
In this paper, the grouting model test was conducted to study the diffusion law of slurry and strength characteristics in alluvial filler soil. The indoor soil test and dynamic penetration test were carried out to study the strength characteristics of grouted soil. The diffusion pattern of grouting slurry was observed during the excavation of the grouting container.
The container was made of red brick, the model tank size was 3.75 m × 3.75 m × 2.0 m, the wall thickness was 25 cm, and the internal dimension was about 3.25 m × 3.25 m × 2.0 m, as shown in
Figure 1.
As shown in
Figure 2, the grouting system was composed of a container for filling soil, a grouting pump, a cement slurry container, and a grouting pipe.
The grouting equipment was an XZ50/20 type piston grouting pump with a maximum working pressure of 4.0 MPa. The grouting pipe was made of a hollow steel pipe with a diameter of 25 mm. The grouting holes were set in the bottom of the pipe, with a diameter of 8 mm and a spacing of 5 cm. Grouting effect detection devices mainly included handheld drills, direct shear apparatus, consolidometers, geological radar, penetrometers, and static load test equipment. The handheld drill was adopted for soil sampling. The grouting pressure and grouting quantity automatic recording devices were installed in the grouting model test, where a camera device was adopted to record the grouting pressure and grouting quantity versus time during the grouting process.
2.3. Test Materials
The grouting model test material mainly includes grouting soil and grouting material. The soil used in the test was taken from the alluvial stratum, as shown in
Figure 3.
The soil’s physical and mechanical parameters can be seen in
Table 1. The corresponding particle grade is shown in
Figure 4. The cement slurry was adopted as a grouting material with a water-to-cement ratio (W/C) of 0.6~0.7. The cement is ordinary Portland cement.
2.4. Test Scheme
In this section, the grouting model test scheme is illustrated. The model test conducted in this work contains the following steps: (1) The grouting materials and devices were prepared for the grouting model test; (2) Subsequently, the physical and mechanical properties of the soil sample were tested by the methods of an indoor soil test, dynamic penetration test, and geological radar test, respectively; (3) Then, the cement slurry was grouted into alluvial soil by the grouting pump; (4) After grouting, the grouting effect was detected by the methods of indoor soil test, dynamic penetration test, and geological radar test, respectively; (5) Finally, the diffusion pattern of grouting slurry was observed by the excavation of the grouting model container. The detailed procedures are given as follows:
(1) Preparation of the grouting model test: as shown in
Figure 1, the model test container, which was made of bricks, was filled with alluvial soil with 30 cm per layer.
(2) Initial physical and mechanical properties tests of the alluvial soil: Three group soil samples before grouting were taken in the container by handheld drill. Then the physical and mechanical properties of soil samples were tested in a laboratory. The initial state tests of alluvial soil are shown in
Figure 5.
(3) The grouting pipe was inserted in the middle of the model container. The model grouting test was carried out with a maximum grouting pressure of 2.5 MPa. An automatic monitoring device was installed at the outlet of the grouting pump to record the grouting pressure and the amount of grouting. During the grouting process, the relationship between the grouting pressure and the grouting time was recorded by a camera device.
(4) The density distribution of grouting soil was measured by a geological radar after grouting since the geological radar can detect the location of the slurry.
(5) The static load test and light dynamic penetration test were conducted to test the bearing capacity of grouting soil.
(6) Three groups of soil samples after grouting were taken in the model test container by handheld drill, and the soil samples were tested in the laboratory to measure the shear strengths of the grouting soil.
(7) After grouting, a full-section excavation of grouting soil was carried out to study the diffusion law and the diffusion range of slurry.
3. Grouting Model Test
The secondary grouting method was adopted to conduct the grouting model test. The grouting pressure was controlled during the process of grouting. In this model test, a camera was used to record the variation of grouting pressure with time. The time-history curves of grouting pressures and grouting volumes were then obtained by analyzing the camera data. The grouting stopped when the following two conditions happened: (1) Slurry penetrated the wall of the model container; (2) The bottom of the model container was lifted by slurry. The curves of grouting pressure and grouting volume versus time can be found in
Figure 6.
In the first grouting process, the grouting time was 56 min, the weight of cement injected into the soil was 320 kg, and the maximum grouting pressure was 0.6 MPa.
In the second grouting process, the grouting time was 42 min, the weight of cement injected into the soil was 200 kg, and the maximum grouting pressure was 1.6 MPa.
4. Mechanism of Grouting Properties of Alluvial Filler Soil
The alluvial filler soil is composed of loose sediments deposited by flowing water. Hence, the main mechanism of grouting properties of alluvial filler soil involves:
(1) Filling voids: Alluvial filler soil often contains voids and gaps between the particles, making it less stable and prone to settlement. Grouting involves injecting a cementitious or chemical grout into these voids, which then fills the gaps and displaces the water present, effectively increasing the overall density and reducing permeability.
(2) Binding particles: The injected grout acts as a binding agent that bonds the soil particles together. As the grout cures and hardens, it forms a solid matrix, reinforcing the soil and increasing its strength.
(3) Increasing strength: The grout not only fills the voids but also contributes to the overall strength of the alluvial filler soil. The grout forms a cohesive mass that provides additional load-bearing capacity to the soil, reducing the risk of settlement or collapse.
(4) Improving permeability: Alluvial filler soil typically has high permeability, which can lead to seepage or instability issues. Grouting can reduce the permeability of the soil. by filling voids and creating a more compact structure.
(5) Stabilizing soil: By binding the particles together and increasing strength, grouting stabilizes the alluvial filler soil. This stabilization prevents soil erosion, slope failures, and other geotechnical problems, ensuring the overall safety and durability of the construction.
(6) Reducing settlement: Alluvial filler soil can experience settlement when subjected to heavy loads or vibrations. Grouting mitigates settlement issues by improving the soil’s load-bearing capacity and reducing compressibility.
Overall, grouting can significantly enhance the properties of alluvial filler soil, providing numerous benefits for various engineering applications.
5. Theoretical Analysis of Grouting Volume and Its Quantitative Method
5.1. Theoretical Grouting Volume
According to the definition of void ratio, it can be expressed as follows [
30]:
where,
= the void ratio of soil mass,
Ve = the void volume of soil mass.
When the surface uplift does not happen, the grouting volume will satisfy the following conditions in the grouting area:
where,
η = the injection rate;
m = the shrinkage coefficient;
Vs = the volume of injected soil masses;
Ve = the void volume of injected soil masses;
Vg = the volume of the injected slurry.
5.2. Theoretical Grouting Volume
According to the above theoretical method, the following methods are used to determine the relevant parameters at the test site:
(1) The soil was scanned by geologic radar, and the total volume V of the soil grouting zone was obtained by the data comparison analysis;
(2) The soil samples before and after grouting were sampled by way of drilling, and the porosity before and after grouting (P1, P2) in soil were obtained through laboratory tests, and then the injection rate of soil grouting was obtained (i.e., η = P2/P1).
(3) The slurry shrinkage test was carried out in the laboratory to determine the shrinkage coefficient m.
(4) The test parameters are substituted into Equation (3) to obtain the slurry injection volume:
5.2.1. Theoretical Grouting Volume
(1) According to the soil condition at the test site, the scanning route for geo-radar was drawn up, and the parameters of GPR scanning were determined. Then the geo-radar was scanned according to the proposed scanning route to the soil before grouting, as shown in
Figure 7.
(2) When the grouting was completed after seven days, the geological radar test was carried out to scan the grouted soil.
(3) By analyzing the data from the geological radar test results, the volume of the soil grouting filling area was obtained. The radar images (line 4) are before and after grouting.
The grouting zone was preliminarily determined by the comparison and analysis of geo-radar images before and after grouting by the Geo-radar test. The geological radar scanning results showed that the grouting zone was roughly a rectangular region with its depth, length, and width equaling 2 m, 3.25 m, and 3.25 m. The total volume of the grouting area was V = 21.125 m3.
5.2.2. Determination of Injection Rate of Soil Grouting
The indoor test was conducted to determine the injection rate of grouting.
(1) Before grouting, three sampling holes were set in the grouting area for drilling and sampling; the depth of drilling was the same as that of grouting.
(2) The soil samples were sent to the laboratory, and the water absorption method was carried out to determine the soil porosity P1 before grouting.
(3) After grouting, three sampling holes were also set in the grouting zone; the depth of drilling was the same as that of grouting.
(4) The water absorption experiment was performed to obtain the soil porosity P2 after the grouting.
(5) The ratio of the porosity after grouting to the porosity before grouting is the injection rate of soil, η = P2/P1.
The test results showed that the porosity of the soil masses before grouting was P1 = 0.304, and the porosity of the soil masses after grouting was P2 =0.131. The volume of pore in the injected soil can be obtained by dividing the volume V of the soil in the grouting zone by the porosity P1, that is, Vg = 6.422 m3. The injection rate of soil is η = 0.431.
5.2.3. Determination of Shrinkage Coefficient of Slurry
The shrinkage coefficient of the slurry was obtained by an indoor test (see
Figure 8). The specific steps can be expressed as follows:
(1) The volume of the slurry in the grouting was sampled by measuring cups; the volume of each sample was 100 mL, and five samples were extracted from each construction slurry;
(2) The samples were placed in the indoor moist air cabinet for 7 days.
(3) The volume of the hardening slurry was measured by the water level method after repose.
(4) The ratio of the volume of hardening slurry to the volume of slurry was the shrinkage coefficient of the slurry (m).
In this experiment, five samples were sampled in the slurry stirring pool with a single sample volume of 100 mL. The samples were placed in the indoor moist air cabinet, and the time of repose was 4 days. When solidification was completed, the average volume of the three samples was 63.6 mL, and the corresponding quality of cement was 0.0126 kg. Therefore, the shrinkage coefficient of the slurry was m = 0.636.
5.2.4. Determination of Grouting Quantity
By substituting the parameters obtained in the laboratory test into Equation (2), we can conclude that the slurry volume is Vg = 4.352 m3. Inserting the shrinkage coefficient of the slurry, the amount of cement can be calculated as Mg = 544.95 kg.
As shown in
Figure 6, the amounts of cement used in the first and second grouting were 320 kg and 200 kg, respectively. The prediction result obtained by the proposed method was consistent with the total amount of cement used in the first and second groutings, which indicates that the proposed method can effectively estimate the grouting amount.
6. Engineering Characteristic Analysis of Grouting Soil
6.1. Soil Strength Analysis
The physical and mechanical properties of the soil would be changed after grouting. The shear strength parameters, namely cohesion
c and internal friction angle
Φ which can best reflect the strength of soil mass, would be improved. If the improved values are Δ
c and, Δ
Φ respectively, the shear strengths of the grouting soil can be obtained by Taylor series, and the expression is as follows [
21]:
where
c0 and
Φ0 are the initial shear strength values of the soil before grouting. For convenience of calculation, consider only the first three items in the formula. Equation (4) can be written as follows:
Equation (4) is used to calculate the shear strengths of the grouting soil after the grouting process. It is derived from Taylor series expansion and the Mohr-Coulomb yield criterion. By analyzing the shear strength parameters of the soil before and after grouting, the incremental values of cohesion (Δc) and internal friction angle (ΔΦ) can be obtained. Equation (5) provides a more straightforward expression for calculating the incremental shear strength values (Δc and ΔΦ) of the grouting soil.
According to the Mohr-Coulomb yield criterion, the yield function of soil-rock mass can be expressed as [
31]:
where
k is the coefficient of soil pressure,
σ1 and
σ3 are the minimum and maximum principal stresses, respectively.
is the yield-critical function of the soil. Subtracting Equation (5) from Equation (6), the yield function can be expressed in the following expression:
where Δ
c, Δ
Φ are the incremental values of the cohesion force and the internal friction of the soil, respectively.
Equation (6) represents the Mohr-Coulomb yield criterion, which is a widely used model in geotechnical engineering to assess the failure of soil and rock materials. It relates the shear strength of the material to the principal stresses acting on it. The yield function is defined as zero when the material is on the verge of failure. Equation (7) incorporates the incremental shear strength values (Δc and ΔΦ) to describe the behavior of the soil with improved strength characteristics.
Because the test soil is compacted artificially, it is difficult to ensure that the soil is completely homogeneous. In the proposed model, according to the results of the geo-radar test, the area of slurry diffusion can be obtained. In order to facilitate the calculation of soil strength growth after grouting, the proposed approach is based on the following assumptions: (1) The area of slurry diffusion is uniform; (2) The hydration and hydrolysis of the slurry are neglected. The mechanical properties of the soil after grouting are shared by the slurry and the soil. Therefore, the variation in the maximum shear stress of the grouting soil depends on the volume ratio of the injected slurry to the soil and the maximum shear stress of the slurry veins. Moreover, the increasing cohesion and internal friction angle of the soil are directly related to the volume of grouting and the injection rate of the slurry (
η). When grouting is completed, the internal friction angle and cohesiveness of the soil can be expressed as follows:
where
are the cohesive forces of the slurry and the soil, respectively,
and are the internal friction angles of the slurry and the soil, respectively.
According to Equation (8), when grouting is completed, the increment of the internal friction angle and cohesion of the grouting soil can be expressed as follows:
Equation (8) defines the cohesion c and internal friction angle Φ of the grouting soil after the grouting process. The cohesion c is the sum of the initial cohesion (c0) of the soil before grouting and the incremental cohesion (Δc) due to grouting. Similarly, the internal friction angle (Φ) is the sum of the initial internal friction angle (Φ0) of the soil before grouting and the incremental internal friction angle (ΔΦ) due to grouting.
Equation (9) calculates the incremental values of cohesion (Δc) and internal friction angle (ΔΦ) of the grouting soil based on the properties of the grout (cohesion of slurry and internal friction angle of slurry) and the coefficient of variation. These coefficients account for the interaction between the soil and the grout during the grouting process.
The importance of Equations (4)–(9) lies in their ability to predict the changes in the shear strength of the soil due to grouting. By estimating the incremental shear strength values, the effectiveness of the grouting process can be assessed, and engineers can make informed decisions regarding geotechnical reinforcement and stability in underground engineering projects.
According to the mechanism of grouting, it is assumed that the coefficients of variation of cohesive force and internal friction angle are
kc,
kΦ, it is caused by the interaction between soil and grout, and the two coefficients can be obtained by means of laboratory tests. Thus, when grouting is completed, the increment value of cohesive force and the internal friction angle can be obtained as follows:
6.2. Test Verification and Analysis
In order to verify the developed model, the geotechnical tests before and after grouting were carried out in the laboratory. The moisture content of soil is determined by the drying method, the natural density of soil is measured by the ring method, and the shear strength index of soil is obtained by the direct shear test.
According to the test results, the initial cohesion of soil c0 was 28.70 kPa; the initial internal friction angle of soil Φ0 was 21.50°; the injection rate of the slurry η was 0.431; the cohesion of slurry cg was 126.10 kPa; the internal friction angle of slurry Φg was 34.60°; the coefficient of variation of cohesion kc was 0.469; and the coefficient of variation of variation of internal friction angle kΦ was 0.135. Δc and ΔΦ are the incremental values of the cohesion force and the internal friction of the soil.
By substituting the experimental data above into Equations (7) and (10), we get the following theoretical data: The value of Δc was 13.75 kPa and the value of ΔΦ was 0.532°; the cohesion of grouting soil c was 42.45 kPa; and the internal friction angle of grouting soil Φ was 22.032°.
According to the theoretical calculation and laboratory test results, the experimental values and theoretical prediction values of the shear strength parameters of the soil before and after grouting are shown in
Table 2. It can be seen from
Table 2 that the theory of this study can effectively predict the shear strength parameters of soil mass after grouting and has a certain engineering application value.
7. Engineering Characteristic Analysis of Grouting Soil
In this grouting model test, the grouting effect was detected by a geological radar test, a light dynamic penetration test, and an indoor geotechnical test.
7.1. Geological Radar Scanning
7.1.1. Role of Geological Radar
Ground-penetrating radar (GPR) is a valuable tool in geotechnical engineering, especially when dealing with alluvial soils. GPR uses electromagnetic waves to penetrate the ground and create subsurface images. It helps in identifying soil stratification, the presence of voids, and potential weak zones. By understanding the subsurface conditions, engineers can plan the grouting process more effectively. GPR surveys can aid in identifying areas where grouting is needed the most and help optimize grout injection points.
7.1.2. Scanning Method of Geological Radar
According to the soil condition at the test site, the scanning route of the geo-radar was drawn up, and the parameters of GPR scanning were determined. The geo-radar was then scanned according to the proposed scanning route to the soil before the grouting, as shown in
Figure 7a above. Test lines 1 and 7, located on both sides of the model container, and line 4 located in the middle of the container, were selected to conduct comparative analysis.
7.1.3. Test Results Analysis
The comparative analysis of the geological radar imaging before and after grouting of lines 1, 4, and 7 was as follows:
(1) The Geo-radar scanning images before and after grouting line 1 are shown in
Figure 9. The analysis shows that the soil is loose in the right 0.8~1.6 m depth range before grouting. The waveform is strongly reflected at the depth of 1.4 m, indicating the existence of a distinct interface, which may be the cause of the layer compaction or the higher water content of the soil layer. While the soil on the right 0.8~1.6 m becomes denser after grouting, the strong reflection in the deep 1.4 m is not seen. It indicates that the compactness of the soil has increased and that the uniformity has obviously improved. Therefore, it can be concluded that the grouting effect in this area is very significant. After grouting, the image of depth 1.6 m below has similar signal interference, which is caused by the improvement of dielectric uniformity, the decrease of signal reflection intensity, and the decrease of depth of penetration.
(2) The Geo-radar scanning images before and after grouting line 4 are shown in
Figure 10. The analysis shows that there is little change in the continuity and dispersion of the image before and after grouting in the range of depth 0.8~1.4 m, which indicates that the effect of soil grouting reinforcement is not obvious in this range. However, under the depth of 1.4 m, the reflection intensity of the radar detection signal decreases significantly, and the detectable depth decreases, which indicates that the grouting effect is good.
(3) The Geo-radar scanning images before and after grouting line 7 are shown in
Figure 11. The analysis shows that in the range of depth 0.6~1.4 m, the radar signal is strongly reflected before the grouting, and the signal is in a diffraction arc with the phase axis, which indicates that the soil layer is not dense. The reflection signal becomes weaker after grouting, which indicates that the compactness of the soil layer is obviously improved and the effect of grouting reinforcement is obvious.
To sum up, the geological radar detection shows that the grouting reinforcement effect is obvious in the grouting model test.
7.2. Light Dynamic Penetration Test
The technique of dynamic penetration in situ testing is effective in evaluating the quality effects of foundation reinforcement and improvement. In this experiment, a light dynamic penetration test was carried out to measure the changes in the mechanical properties of soil before and after grouting.
7.2.1. Principle of Light Dynamic Penetration Test
A certain cone is driven into the soil using a standard hammer. According to the degree of difficulty and impedance of the penetration of the cone, the variation of the soil layer is assessed, and the engineering property of the soil is evaluated.
7.2.2. Light Dynamic Penetration Test Method
(1) The position of the light dynamic penetration test is shown in
Figure 12.
(2) A cylindrical heavy hammer with a mass of 10 kg was used to strike the cone into the ground, and the drop of the hammer is 500 mm. The blow count was recorded when the cone entered the soil 300 mm, as shown in
Figure 12.
(3) In the field, the light dynamic penetration record data were preliminarily sorted and checked, and the average number of blow counts in each layer was taken as the average value of the hit number N10. Finally, the value of the bearing capacity of soil before and after grouting was calculated by an empirical formula.
7.2.3. Light Dynamic Penetration Test Results
The results of the light dynamic penetration test are shown in
Figure 13.
As shown in
Figure 13, the bearing capacity has different degrees of improvement after grouting. The strength growth of 1 and 2 points was relatively larger, respectively, at 230 kPa and 180 kPa. Before grouting, the bearing capacity of the soil in the model groove was generally larger than that of the upper soil body. After grouting, the bearing capacity of the upper soil is larger than that of the lower part, which is due to the higher coagulation rate in the upper soil.
7.3. Indoor Test
In order to compare and analyze the physical and mechanical properties of soil before and after grouting, indoor tests were carried out to determine the physical and mechanical properties of soil, such as density, water content, pore ratio, shear strength, and compressibility, before and after grouting.
7.3.1. Method of Indoor Tests
(1) Six sampling boreholes in the grouting container (3 before grouting, 3 after grouting) were arranged.
(2) The moisture content of the soil was determined by the drying method, and the natural density of the soil was measured by the ring method.
(3) The shear strength index of soil was obtained by the direct shear test. The specimens were prepared with a ring knife with a height of 20 mm and an area of 30 cm2, and then the soil samples were loaded into a shear container with a vertical pressure of 100 kPa, 200 kPa, 300 kPa, and 400 kPa, respectively, to determine the maximum deformation of the specimen during shear failure. Finally, by drawing the relationship between soil pressure and deformation, the shear strength of the soil sample was obtained.
(4) The compressive deformation test of the cohesive soil was carried out on a consolidometer. The specimens were prepared with a ring knife with a height of 20 mm and an area of 30 cm2, and then the soil samples were loaded into a consolidation instrument with a vertical pressure of 50 kPa, 100 kPa, 200 kPa, and 400 kPa, respectively, and the lower load could be applied after the load of each stage was stabilized. The vertical height change of soil samples under each load was recorded, and the stability criterion for each load was that the soil layer deformation ratio was less than 0.01 mm/h.
7.3.2. Indoor Test Results
After the test data analysis, the results of the indoor test are shown in
Table 3.
7.4. Observation and Analysis of Slurry Diffusion
7.4.1. Visual Observation of Slurry Diffusion
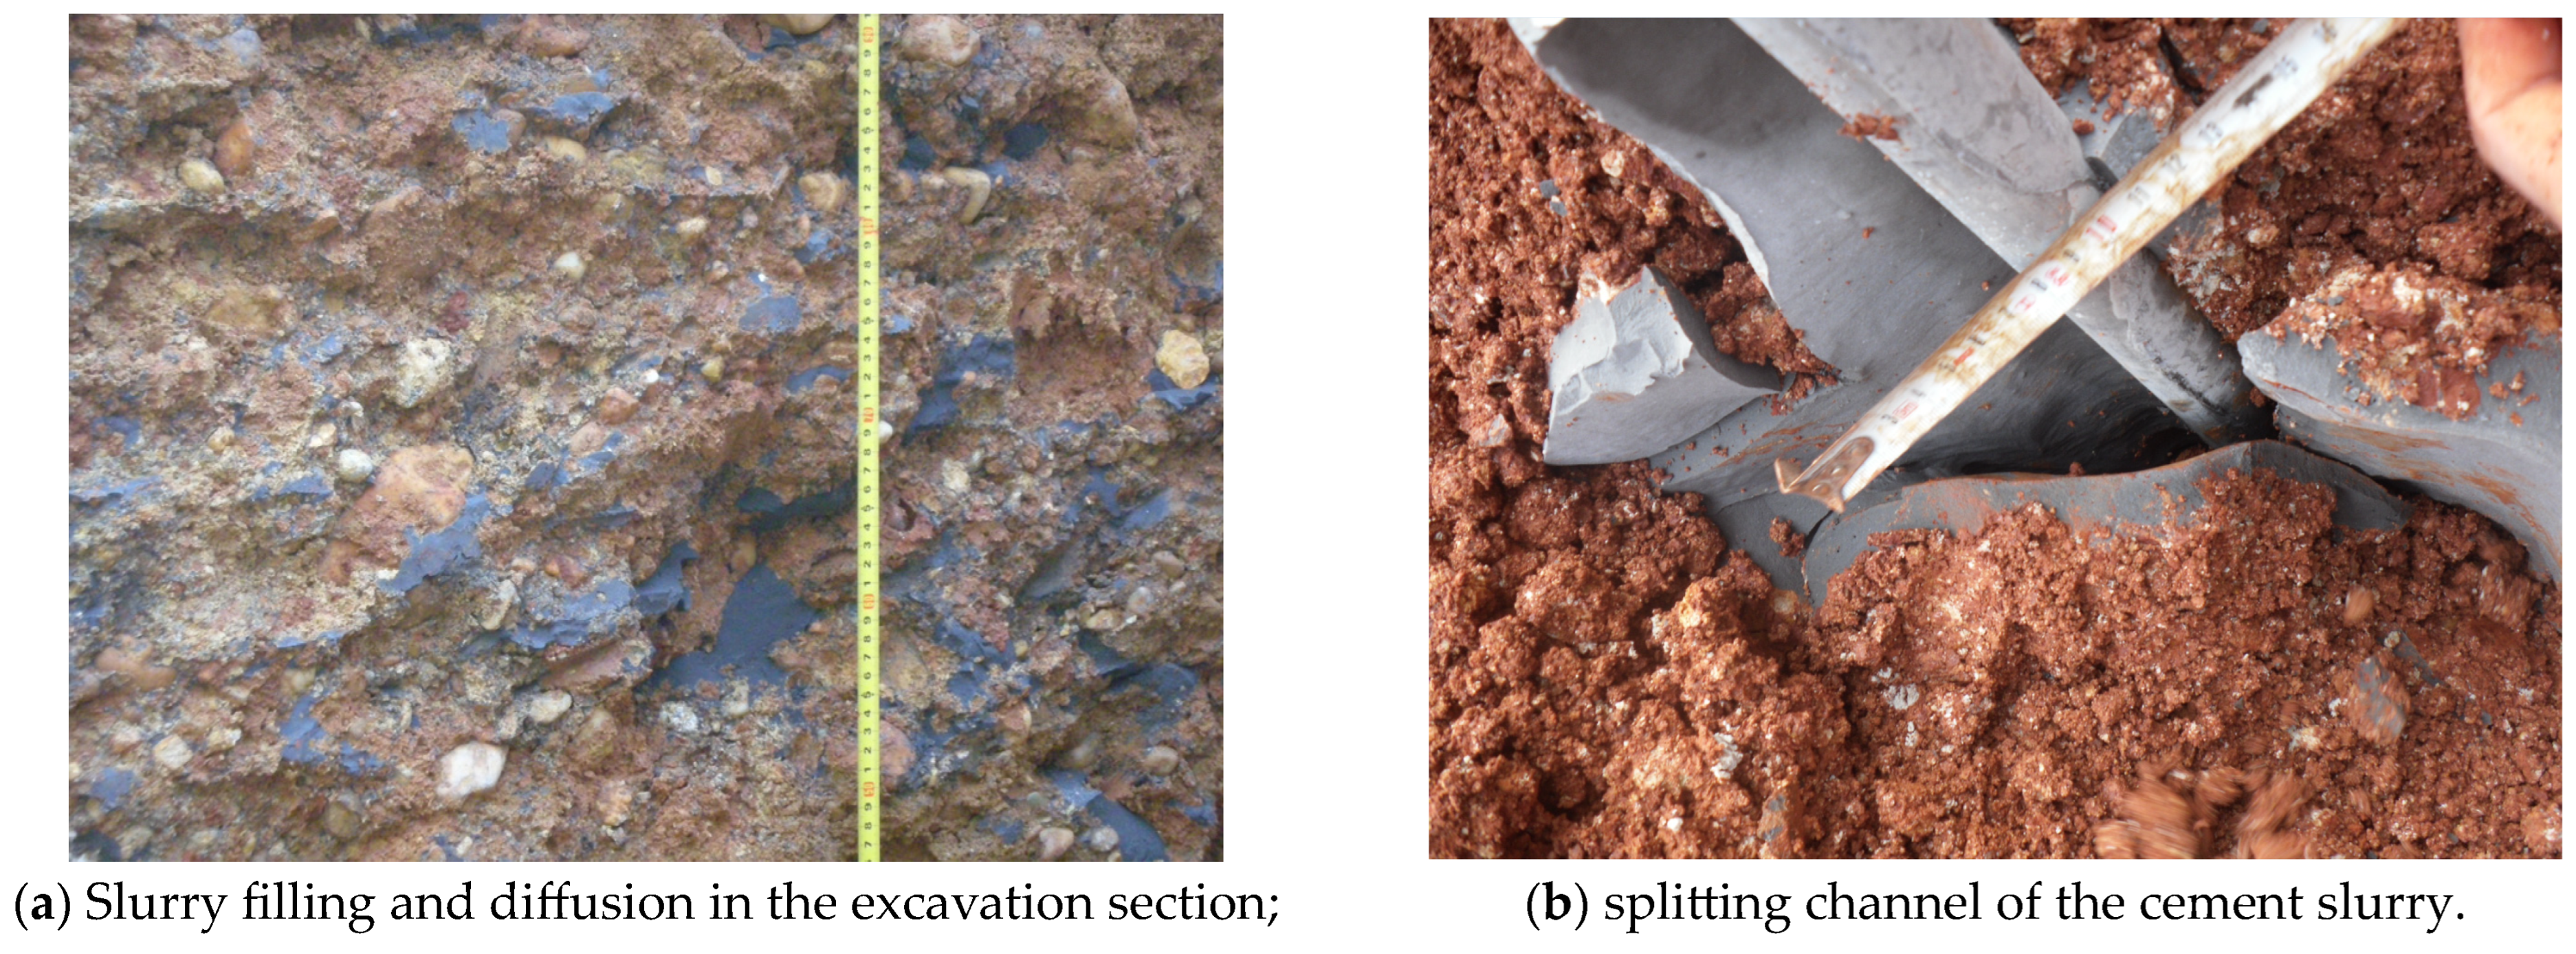
A full-section excavation of grouting soil was carried out to observe the shape, size, and distribution radius of slurry veins. The reinforcement effect of grouting and the distribution of slurry were determined by full section excavation directly and effectively, as shown in
Figure 14.
As shown in
Figure 14, the grouting reinforcement and slurry filling characteristics are given as follows:
(1) The slurry effectively filled most of the voids in the alluvial filler soil, and the splitting grouting phenomenon was produced in the clay, and the gravel voids were filled.
(2) The density of the slurry in the horizontal layer distribution was denser than that of the vertical distribution, which indicates that the horizontal splitting is easier to produce than the vertical splitting. After the slurry split the soil, there was a slurry channel crack with high intensity, so these split slurry cracks do not affect the overall strength.
(3) The slurry was diffused along the fissure spreading direction; the slurry in the fissure is packed tightly with a filling thickness of 2.0 cm and partially filled with gravel-shaped cement with a diameter of about 2.0~5.0 cm. In the loose place of gravel filling, it can be seen that the cement stone and angular gravel are condensed into lumps with a length of 3.0~5.0 cm.
(4) In the clay and silty sand filling zone, there were network-like massive cement stones with a length of 5.0~8.0 cm.
7.4.2. Analysis of Slurry Diffusion
Based on the observation of the whole section excavation and the results of the indoor test, the characteristics of slurry diffusion were obtained and illustrated as follows:
(1) In the sand-gravel and clay-filling zones, the slurry diffusion was dominated by the split-filling; In the sandy gravel zone, the slurry spread mainly by infiltration. In the clay and silty sand filling zone, the slurry diffusion was dominated by the split compaction method, as shown in
Figure 15.
(2) Slurry splitting generally occurs along the interface of different media and compacts on the interface of different media, as shown in
Figure 16a;
(3) The splitting channel of the cement slurry is unobstructed and does not close with the end of grouting; the widths of the slurry splitting channel were 2.0~6.0 cm, as shown in
Figure 16b.
(4) The slurry veins were mainly fractured horizontally, with widths between 0.3~6.0 cm. There were fewer grouting veins in the vertical direction than in the horizontal direction, as shown in
Figure 17. There are two possible reasons for this phenomenon. On the one hand, due to the shallow burial depth (only 1.6 m) of the grouting pipe, the vertical stress of the soil is small, and the slurry is easier to split on the plane perpendicular to the vertical stress (i.e., the horizontal plane). On the other hand, the soil used in the test is taken from an alluvial stratum with a layered structure, and the soil samples are layered in a model test container. Thus, the slurry is easier to split between layers (i.e., in the horizontal direction).
8. Grouting Model Test Results and Discussion
8.1. The Variations of Grouting Pressure and Grouting Volume
The secondary grouting method was adopted to conduct the grouting model test. The grouting pressure and amount versus time were obtained by the field automatic recording device. We can infer from
Figure 6 that the grouting pressure and amount increase with time. The average pressure of the second grouting is greater than that of first grouting. This indicates that in the grouting process, the stress on the soil will increase continuously. Therefore, more grouting pressure is required to inject more slurry. In the second grouting process, the splitting grouting is produced, so the grouting pressure remains slightly fluctuating. With the splitting of the slurry, the grouting pressure increases gradually.
In addition, the two-time grouting durations were 56 and 42 min, respectively. This indicates that the grouting rate decreases in the process of second grouting. The initial grouting pressure was small and the feed rate was large, which indicates that the soil grouting was mainly filled and compacted. With the pore filling and the slow fracturing of the slurry in the soil, the grouting rate decreases gradually. Until the stress of the soil reaches a certain value, the slurry cannot form a new fracturing grout but leaks from the side wall or emerges from the top of the grouting tank.
8.2. Comparative Analysis of Physical and Mechanical Properties of Grouting Soil
It can be seen from
Table 3 that the index of soil masses is improved; the average density of soil increased by 5.53%; the water content decreased by 18.11%; the cohesion of soil increased by 52.4%; the internal friction angle increased by 2.1%; the compressive coefficient decreased by 35.0% after grouting; and the compressive modulus increased by 54.6%. It indicates that grouting can effectively improve the mechanical properties of alluvium mixtures.
8.3. Discussion on Slurry Diffusion
8.3.1. Relationship between Slurry Diffusion Radius and Grouting Hole Distance
The diffusion distance of slurry veins along the laying direction of the grouting pipe was studied after excavation.
The relationship between the slurry diffusion radius and the distance from the grouting hole was obtained by analyzing excavation record data, as shown in
Figure 18 and
Figure 19. It can be seen from
Figure 18 and
Figure 19, that the horizontal and vertical average distances go through an upward phase, reach a peak, and then enter a downward phase in the first and second grouting. In addition, the horizontal average distance is always higher than the vertical average distance, and the distance values in the first grouting are higher than those in the second grouting.
(1) The relationship between the slurry diffusion distance and the distance from the grouting hole is similar in four directions. The diffusion radius first increases and then decreases with increasing distance from the grouting hole in all directions. This shows that the grouting pressure and the amount of grouting absorption decrease gradually with the increasing distance of the grouting hole. It also reflects the attenuation law of grouting pressure along the slurry diffusion.
(2) The diffusion radius of the slurry has a good agreement in the horizontal direction, while the diffusion radius of slurry varies greatly in the vertical direction. One possible reason leading to this phenomenon might be that the specimen used in the test is taken from an alluvial stratum with a layered structure (i.e., the horizontal direction), and also that the specimen is layered in a model test container, which results in a homogeneous specimen in the horizontal direction, so the diffusion radius of the slurry has good agreement in the horizontal direction. During the upward diffusion of the slurry, part of the energy is dissipated due to the power consumption overcoming gravity. Therefore, the diffusion radius of the slurry varied in two vertical directions, which was not similar to what was observed in the horizontal direction. For a certain cross section, the diffusion radius in the horizontal direction is the largest, the diffusion radius in the vertically downward direction is the second, and the diffusion radius is the smallest in the vertically upward direction. The reason why the diffusion radius in the horizontal direction is larger than that in the vertical direction is that the layered filling makes it easier to crack the weak surface in the horizontal direction.
8.3.2. Relationship between Grouting Time and Diffusion Radius
In order to obtain the relationship between slurry diffusion radius and grouting time, the Geo-radar test was carried out every five minutes during initial and second grouting.
The curve of diffusion radius with time can be obtained by comparing and analyzing the adjacent geological scanning image. The relation between grouting time and the diffusion radius is shown in
Figure 20.
It can be seen from
Figure 20 that the slope of the curve at the start stage of grouting is very small, which indicates that the diffusion radius increases rapidly with the increase in grouting time. With the increase in grouting time, the increasing rate of grouting radius is faster in the early stage of grouting and slower in the later period, which indicates that grouting is more difficult and that the limit value of grouting radius exists with the increase in slurry diffusion radius. One possible reason might be that the pore water hinders the seepage flow of the slurry.
9. Conclusions and Discussion
In this work, the diffusion law of slurry and strength characteristics in alluvial filler soil were investigated by analytical methods and grouting model tests. Based on the Mohr-Coulomb yield criterion and Taylor series, this paper proposes an approach to estimate the shear strength growth of the grouting soil. In addition, an analytical model considering the shrinkage coefficient of slurry was also developed to assess the grouting volume. The following main conclusions were drawn:
(1) The slurry is generally filled and fractured along the soil-rock interface and horizontal direction, and the width of the grouting veins is 0.3~6.0 cm. The slurry splitting channel is hollow and does not occlude during grouting. The width of the slurry splitting channel is 2.0~6.0 cm.
(2) The curves for the diffusion radius versus the distance from the grouting hole showed a wavelike relationship in all directions (i.e., horizontal, up, and down). The diffusion radius first increases with the increase in distance from the grouting hole, then decrease with the increasing distance from the grouting hole after reaching its maximum at 30 cm from the grouting hole (i.e., quarter grouting pipe length).
(3) According to the results of laboratory tests, the theoretical model for calculating the shear strength growth of grouting soil was consistent with the laboratory soil test results. It was reliable to predict the actual grouting volume by using the theoretical method, considering the slurry shrinkage coefficient.
(4) This study proposed an approach to estimate the shear strength growth of the grouting soil and developed an analytical model considering the shrinkage coefficient of slurry to assess the grouting volume. The good agreement between the test data and computed results shows that the proposed methods can effectively estimate the increase in shear strength and grouting amount.
In this study, the diffusion law of slurry and strength characteristics of alluvial filler soil were investigated by analytical methods and grouting model tests. However, the study of the laws and characteristics of other soil types is still an open question and remains challenging. To gain more insights in this regard, the work to apply the proposed approach to other soil types is currently ongoing. We will report more detailed results on this track in future submissions.


