Article

Financial Loss Assessment for Weather-Induced Railway Accidents Based on a Deep Learning Technique Using Weather Indicators

1
Department of Railroad Management, Songwon University, Gwangju 61756, Republic of Korea
2
Department of Architectural Engineering, Mokpo National University, Muan 58554, Republic of Korea
*
Author to whom correspondence should be addressed.
Appl. Sci. 2023, 13(18), 10418; https://doi.org/10.3390/app131810418
Submission received: 6 July 2023 / Revised: 13 September 2023 / Accepted: 13 September 2023 / Published: 18 September 2023

Abstract

:
The purpose of this research is to build a deep learning algorithm-based model that can use weather indicators to quantitatively predict financial losses associated with weather-related railroad accidents. Extreme weather events and weather disasters caused by global warming are happening with increasing frequency worldwide, leading to substantial economic losses. Railways, which represent one of the most important means of transportation, are also affected by such weather events. However, empirical and quantitative studies examining losses stemming from weather conditions for railways have to this point been scarce. Hence, the present study collected and analyzed weather-induced railway accident data and meteorological factors (wind, precipitation, rainfall, etc.) from 2001 to 2021 with the aim of predicting financial losses caused by weather events; the ultimate goal is to help inform long-term strategies for effective recovery from railway accidents. Objective and scientific analysis was conducted in the present study by using a deep learning algorithm. The outcomes and framework of this research will offer crucial guidelines for efficient and sustainable railway maintenance. These results will also serve as a crucial point of reference for loss quantification studies and other facility management studies.

1. Introduction

Climate change induced by global warming represents a substantial threat to humanity worldwide. For example, climate change is anticipated to affect patterns of natural disasters in the short term, while it is expected to lead to rising sea levels and the spread of disease in the long term. Many countries are already experiencing increasingly severe and frequent extreme weather events (e.g., tropical cyclones, cold or heat waves, heavy rain events, droughts, floods, lightning strikes, etc.), and the damage associated with such events is also increasing. Humanity has always suffered fatal damage due to abnormal weather and even evolved to adapt to it, but abnormal weather and climate phenomena have recently become incomparably more powerful compared to historical phenomena. Unfortunately, as global warming continues progressing, severe weather, anomalies and meteorological disasters will worsen exponentially, as will the associated damage [1]. This is expected to leave infrastructure such as railroads—which are significantly affected by terrestrial and ecological indicators—more exposed to damage.
Railroads have served as a significant means of transportation both socially and economically since the early days of industrialization. According to statistics from the Ministry of Land, Infrastructure and Transport in South Korea, railroads accounted for the transportation of about 1.1 billion people in 2020, which accounts for 3.8% of the total number of people transported in the transportation sector in 2020. Moreover, in terms of cargo transportation, railroads accounted for about 1.4% of the total in 2020, having transported 26,277 tons of cargo. Railroads are a crucial means of transportation both socially and financially, and the government continues to invest in improving the old system and building new railway tracks, as well as spending large amounts of money every year for facility maintenance. Nevertheless, 28% of Korea’s railway facilities are over 40 years old and are seriously deteriorating, and the railway facility maintenance budget increases each year, having reached a total of 549.5 billion won in 2020 [2]. Aged infrastructure can have a profound impact on both transport logistics and passenger safety, and it is necessary to enhance the proper organization and use of the substantial budget thereof. The deterioration of railroad facilities can also worsen as they become more vulnerable to severe weather and climate change caused by global warming.
It is therefore an essential aspect of the operation of railway facilities to predict financial losses stemming from railway accidents caused by weather conditions in advance and to establish top-level strategies to mitigate and transfer these losses. To establish such a strategy, sophisticated damage prediction must be prioritized; this requires extensive research into scientific and reliable models and model construction methods. Hence, to meet these needs, this study proposes a model that applies deep learning algorithms to predict the scale of railway accident losses caused by weather in an unbiased, scientific, and systematic manner that is based on actual railway accident data. The findings and overview of this study are expected to be useful for many future SOC facilities, and they could also improve risk management and budgeting practices. It is also expected that these findings will help predict economic losses of future railways and railway facilities and will thus be able to serve as a basis for mitigating losses and improving the overall financial management of railway projects. It will also be applicable to other industries and SOC facilities to contribute to the prevention and reduction of economic losses. Further, it is expected to provide useful reference data for railroad management according to weather risk, which will help prevent damage from railroad accidents and determine any additional investment needed in vulnerable areas. Altogether, these findings are expected to not only contribute to the prevention and reduction of railway accident damage, but ultimately contribute to the improvement of railway safety and the advancement of railway facility management.

2. Literature Review

2.1. Railway Resilience and Railway Accidents Related to Weather

Rail’s resilience refers to the ability of the rail system to cope with technical problems, natural disasters, and social issues and to recover flexibly. This is very important to maintain the reliability, safety, and sustainability of the railway system against various risk situations in railway facilities and operations [3]. The reason is that railways play a pivotal role among transportation infrastructures and have a great impact on economic and social activities, so the suspension or failure of the railway system can cause economic loss, traffic congestion, and social unrest. To prepare for this, railway resilience refers to the ability to continue operation even in unexpected situations and events [4]. Furthermore, rail’s resilience is also to prepare emergency response and emergency recovery capabilities so that it can flexibly respond to rapidly changing environments such as rapidly increasing risks and unexpected events and operate safely [5]. In particular, the increase in natural disasters such as heavy rains, floods, typhoons, etc., and the risk of climate change, which we are currently facing globally, are expected to have a great impact on the resilience of the railway system [6]. Accordingly, Rail resilience will be an important factor in determining the safety and sustainability of the system. In accordance with the flow of these changes, many studies have been conducted on global warming, climate change, and natural disasters regarding railway accidents and railway resilience in past studies [7,8,9,10,11,12,13]. However, in previous studies, there is a lack of compressive studies that empirically quantify the risk of railroad accidents linked to detailed weather factors. The reason is that weather can have a significant impact on railroad operations and safety, and there are several ways in which weather can contribute to railroad accidents specifically. For example, heavy rain can cause flooding, which can then damage railroad tracks and bridges as well as destabilize the ground beneath the tracks. This can lead to track failure, derailment, and other accidents [14]. As an example, an Amtrak passenger train was derailed near the town of DuPont, Washington, on 18 December 2017, killing three persons and wounding more than 60 others. The investigation by the National Transportation Safety Board (NTSB) found that the train was traveling at more than twice the posted speed limit at a curve in the track, thus causing it to derail. However, weather also played a role, as heavy rain had caused a landslide to occur, thus damaging the track, and this likely contributed to the accident [15]. Snow and ice can accumulate on tracks and bridges, making it difficult for trains to maintain traction and control. This can cause trains to either derail or collide with other trains or objects [16]. For example, two German high-speed trains crashed head-on near the city of Bad Aibling in Bavaria, Germany, on 9 February 2016, killing 12 people and injuring more than 80 others. The investigation of that crash found that, while signal failure was the primary cause of the accident, weather also played a role: Heavy snow had caused a tree to fall onto the tracks, which had disrupted the signal system and likely contributed to the collision. High winds can push railcars off tracks, especially on elevated tracks or bridges. Wind can also cause trees or other objects to fall onto tracks, thus obstructing train movement [17]. For example, a Union Pacific train carrying coal was derailed near the town of Rock Springs, Wyoming, on 15 March 2018; the accident damaged the track and caused a coal spill, but there were no injuries. The investigation by the NTSB found that high winds likely played a role in the accident by pushing the railcars off the track [18]. Moreover, studies are actively being conducted to find ways to reduce damage to railroad facilities caused by strong winds, and there have also been studies that have quantitatively evaluated wind effects or proposed additional defense facilities for railroad facilities that resist strong winds [19,20]. Extreme temperatures—both hot and cold—can also cause rails to expand or contract, thus leading to track buckling, rail breaks, or other track failures [21]. As another hazard, fog can make it difficult for train operators to see signals, track conditions, or other trains, thus increasing the risk of collision or derailment [22].
Ultimately, these prior studies show that weather conditions can cause or contribute to an extensive range of railroad accidents, ranging from track failure and derailment to collisions and other incidents. It is important for rail companies to monitor weather conditions and take appropriate measures to ensure the safety of their operations, such as by inspecting tracks and bridges after heavy rainfall or snow, reducing train speeds when operating under extreme temperatures, and ensuring that train operators have adequate visibility in fog or other low-visibility conditions. Therefore, in order to improve and advance the resilience of railways, it is necessary to scientifically and objectively investigate the risk of railway accidents according to weather conditions and, based on this, carry out quantitative comprehensive research to reduce and prevent railway accidents caused by weather.

2.2. Railroad Accidents and Estimation

Railroad infrastructure is a key social overhead capital investment, so substantial investments are made to improve and maintain facilities in attempts to reduce the occurrence and brutality of accidents. Railways should prioritize accident prevention, because accidents both direct damage, such as human casualties and facility damage, and indirect damage, such as environmental pollution, business interruptions due to delays in logistics and passenger transportation, and supply chain interruptions in other industries [23]. In this regard, many previous studies have concentrated on investigating the causes and extent of damage of fatal railroad accidents such as train fires, train derailments, and collisions [24,25,26,27]. There have also been many studies evaluating and predicting the frequency and severity of railway coincidences. Most of these have analyzed the relationship between independent variables and dependent variables while using past railroad accident data under an assumption of normality. For example, Zhang et al. evaluated derailments and freight train crashes by borrowing the negative binomial model for the relationship between annual train travel distance and qin the United States [28]. Evans assessed the train accident rate per distance for major train accidents that have arisen in Europe over the past 20 years by using a Poisson distribution [29]. Liu et al. estimated the harshness of cargo train derailments using a quantile regression model and a zero-inflated negative binomial regression model for freight train derailments that have occurred in the US over the last 20 years [30]. In another study, Miwa et al. borrowed an exponential function from Japan’s train accident data for the last 15 years to explain the relationship between train stop times and train accident casualties, and they found that the Poisson distribution was appropriate for explaining the sum of fatalities [31]. Evans explained the relationship between the accident frequency per distance and the number of fatalities using a Poisson distributed statistical model based on data on major railway accidents in the UK over the last 31 years [32]. As reviewed above, many existing studies have been limited to analyzing the causes of major railroad accidents such as train fires, train derailments, and collisions, or to evaluating and predicting the frequency and severity of railroad accidents. Therefore, as weather events are expected to increase in frequency and severity in the future due to global warming, there is a need for research aiming to reduce the risk of railroad accidents from accidents caused by weather, and for research aiming to improve railroad operation safety by establishing prediction and preparedness measures. Moreover, it is necessary to develop a framework for data collection and data analysis for an objective correlation analysis of the relationship between weather factors and railroad accidents.
Regarding the methodologies used by previous studies related to railway accidents, many studies have used generalized linear models and specific statistical distributions. For example, one study used a negative binomial distribution model to study the frequency data of railway incidents, and that study’s authors found that model to be more efficient than the Poisson distribution and the existing multiple linear regression method [33]. Many other papers have presented various generalized linear models, including gamma regression, negative binomial distribution, and multivariate Poisson distribution [34,35,36]. Moreover, numerous studies have attempted to analyze the severity of railroad accidents and classify them in terms of whether they caused no injuries, minor injuries, or fatal injuries [37,38,39]. Further, research using artificial intelligence—such as machine learning models and deep learning models—to analyze railway accidents is being actively conducted to overcome the limitations of statistical estimation models. Artificial intelligence has been recognized as a new paradigm, and its utilization is gradually increasing with the convergence of various industries [40,41,42]. Many studies have used artificial intelligence to examine railway accidents. Most of these studies have aimed to forecast the severity and frequency of railway accidents. For example, Yang et al. projected a process using the random forest algorithm, one of the machine learning approaches, to explain the correlation between the main factors of railway accidents and accident rates, and they showed that this method was superior to other commonly used methods [43]. Gao et al. utilized a Convolutional Neural Network (CNN) to investigate the relationship between the possibility of a vehicle colliding with a train during an accident and the main risk factors [44]. Zheng et al. used the ANN model to analyze the connection between accident probability and risk variables for accidents that occur at railroad crossings. This study demonstrated that the ANN model has higher predictive power than the decision tree approach that has commonly been used in the past [45]. As detailed above, although there have been many quantification studies related to railroad accidents, including studies using generalized linear models and specific statistical distributions, machine learning models, and deep learning models, there is a lack of empirical and quantitative research on losses due to weather conditions. It has also been difficult for previous studies to clearly distinguish any causal relationships between railroad accidents and weather conditions. Further, because weather conditions directly or indirectly affect railroad accidents and act in combination with other factors, it may be inaccurate to exclude weather conditions when assessing railroad accidents. Therefore, research is needed to propose a framework to derive a scientific approach to quantify railway accidents caused by weather and to discover deep learning algorithms suitable for weather conditions and railway accident data sets.

2.3. Importance of Predicting Weather-Caused Railway Accident Damage

Studies are actively being conducted in attempts to quantify railway accidents by using various analysis techniques or analyzing the causal relationship between weather and railway accidents. For instance, Lim et al. used Zero-truncated Negative Binomial Regression and Artificial Neural Network models to predict railroad accidents on South Korea’s National Railroad. That study analyzed historical accident data and presented the performance of those models in terms of accurately predicting accidents, thus providing insights into accident prevention [46]. Meng et al. proposed an ensemble learning approach for railway accident prediction that combined multiple models. That study involved both data collection and the analysis of historical accident records. The research results demonstrate the effectiveness of the ensemble strategy in enhancing prediction accuracy and its potential applicability in railway safety management [47]. In a different study, Dhingra et al. ranked the risk factors contributing to financial losses from railroad incidents using machine learning. That research analyzed incident and financial data to identify factors that significantly affect losses. The results provide valuable guidance for risk assessment and mitigation strategies in the railroad industry [48]. Manna et al. integrated Rough Set and Fuzzy Approximation Space with Deep Learning for improved precipitation prediction. That study involved preprocessing weather data and implementing the integrated model. The results showed that this approach achieved enhanced accuracy, thus contributing to more reliable precipitation forecasts [49]. Gou et al. designed a wind hazard warning system for high-speed trains that involved wind data analysis and system implementation. That research showcased the system’s effectiveness in detecting and warning against potential wind hazards, thereby contributing to safe and efficient high-speed train operations [50]. Qizhou et al. proposed a natural disaster warning system for high-speed railways that leveraged disaster prediction technologies. That study showed that the system efficiently provided timely warnings during natural disasters, thus ensuring safe operations and mitigating risks on high-speed railway routes [51]. The above review of studies shows that there has to this point been a lack of in-depth and comprehensive analyses involving the quantification of railway accidents and their causal relationship with meteorological factors. There is a dearth of concrete data-based evidence to support a causal relationship between weather conditions and accidents, while some papers have not adequately addressed the limitations and uncertainties of predictive models, thus making them less likely to be applied in practice. These research gaps must be addressed through the inclusion of more detailed data analysis, rigorous statistical methodologies, and causal inference techniques to establish strong associations between weather variables and rail accidents, which will ultimately provide valuable insights into preventing and improving safety from weather-induced accidents in rail systems.
As discussed earlier, global warming is expected to gradually increase incidents of severe weather, extreme weather, and anomalies. Notably, these phenomena are also expected to lead to increased losses associated with such weather events. Rail systems and related infrastructure are particularly vulnerable to environmental and geographic factors, as they are constantly exposed to external atmospheric conditions. Moreover, as detailed above, many studies have reported that weather conditions can cause serious and extensive damage and accidents to railroad-related facilities. Worsening weather conditions due to global warming are expected to eventually cause many accidents and losses to railways and railway-related facilities [52,53]. Sophisticated loss prediction should therefore be treated as a priority for mitigating and preventing loss to railroad-related facilities, which is expected to increase substantially in the future. There is a need for more research examining scientific and reliable models for predicting weather-related accidents and methods for building models. Therefore, this study proposes a methodology for building a deep learning algorithm-based model for the scientific prediction of railway accident loss caused by weather conditions.

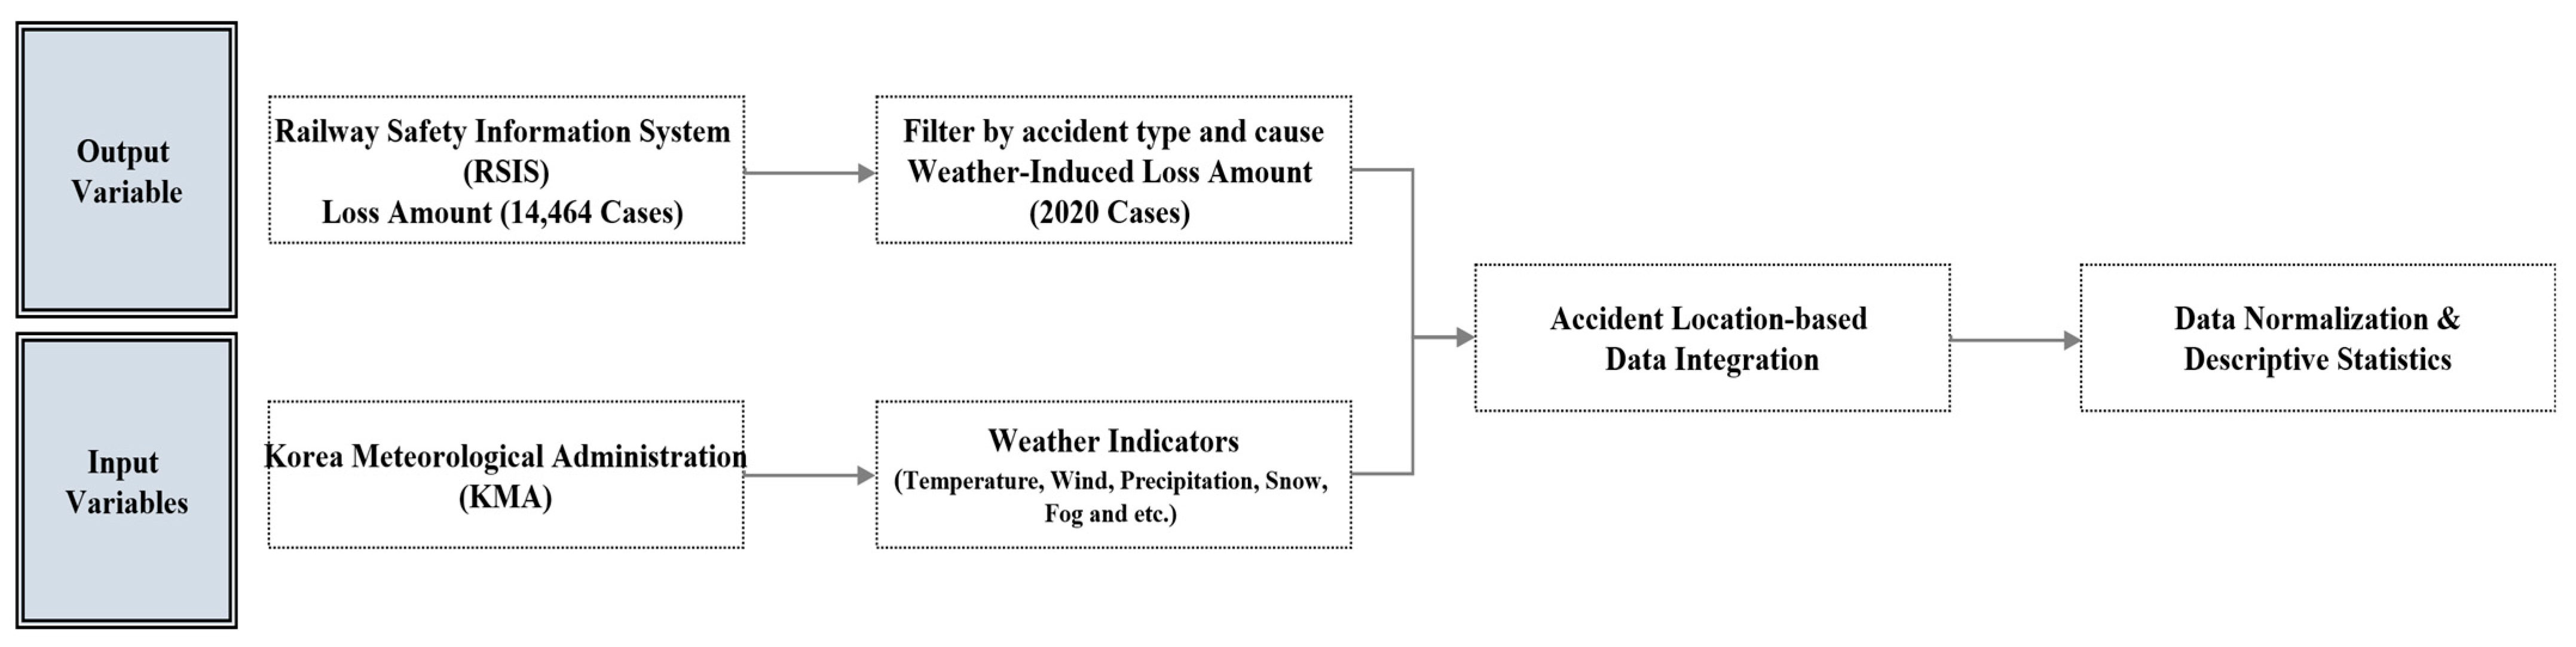
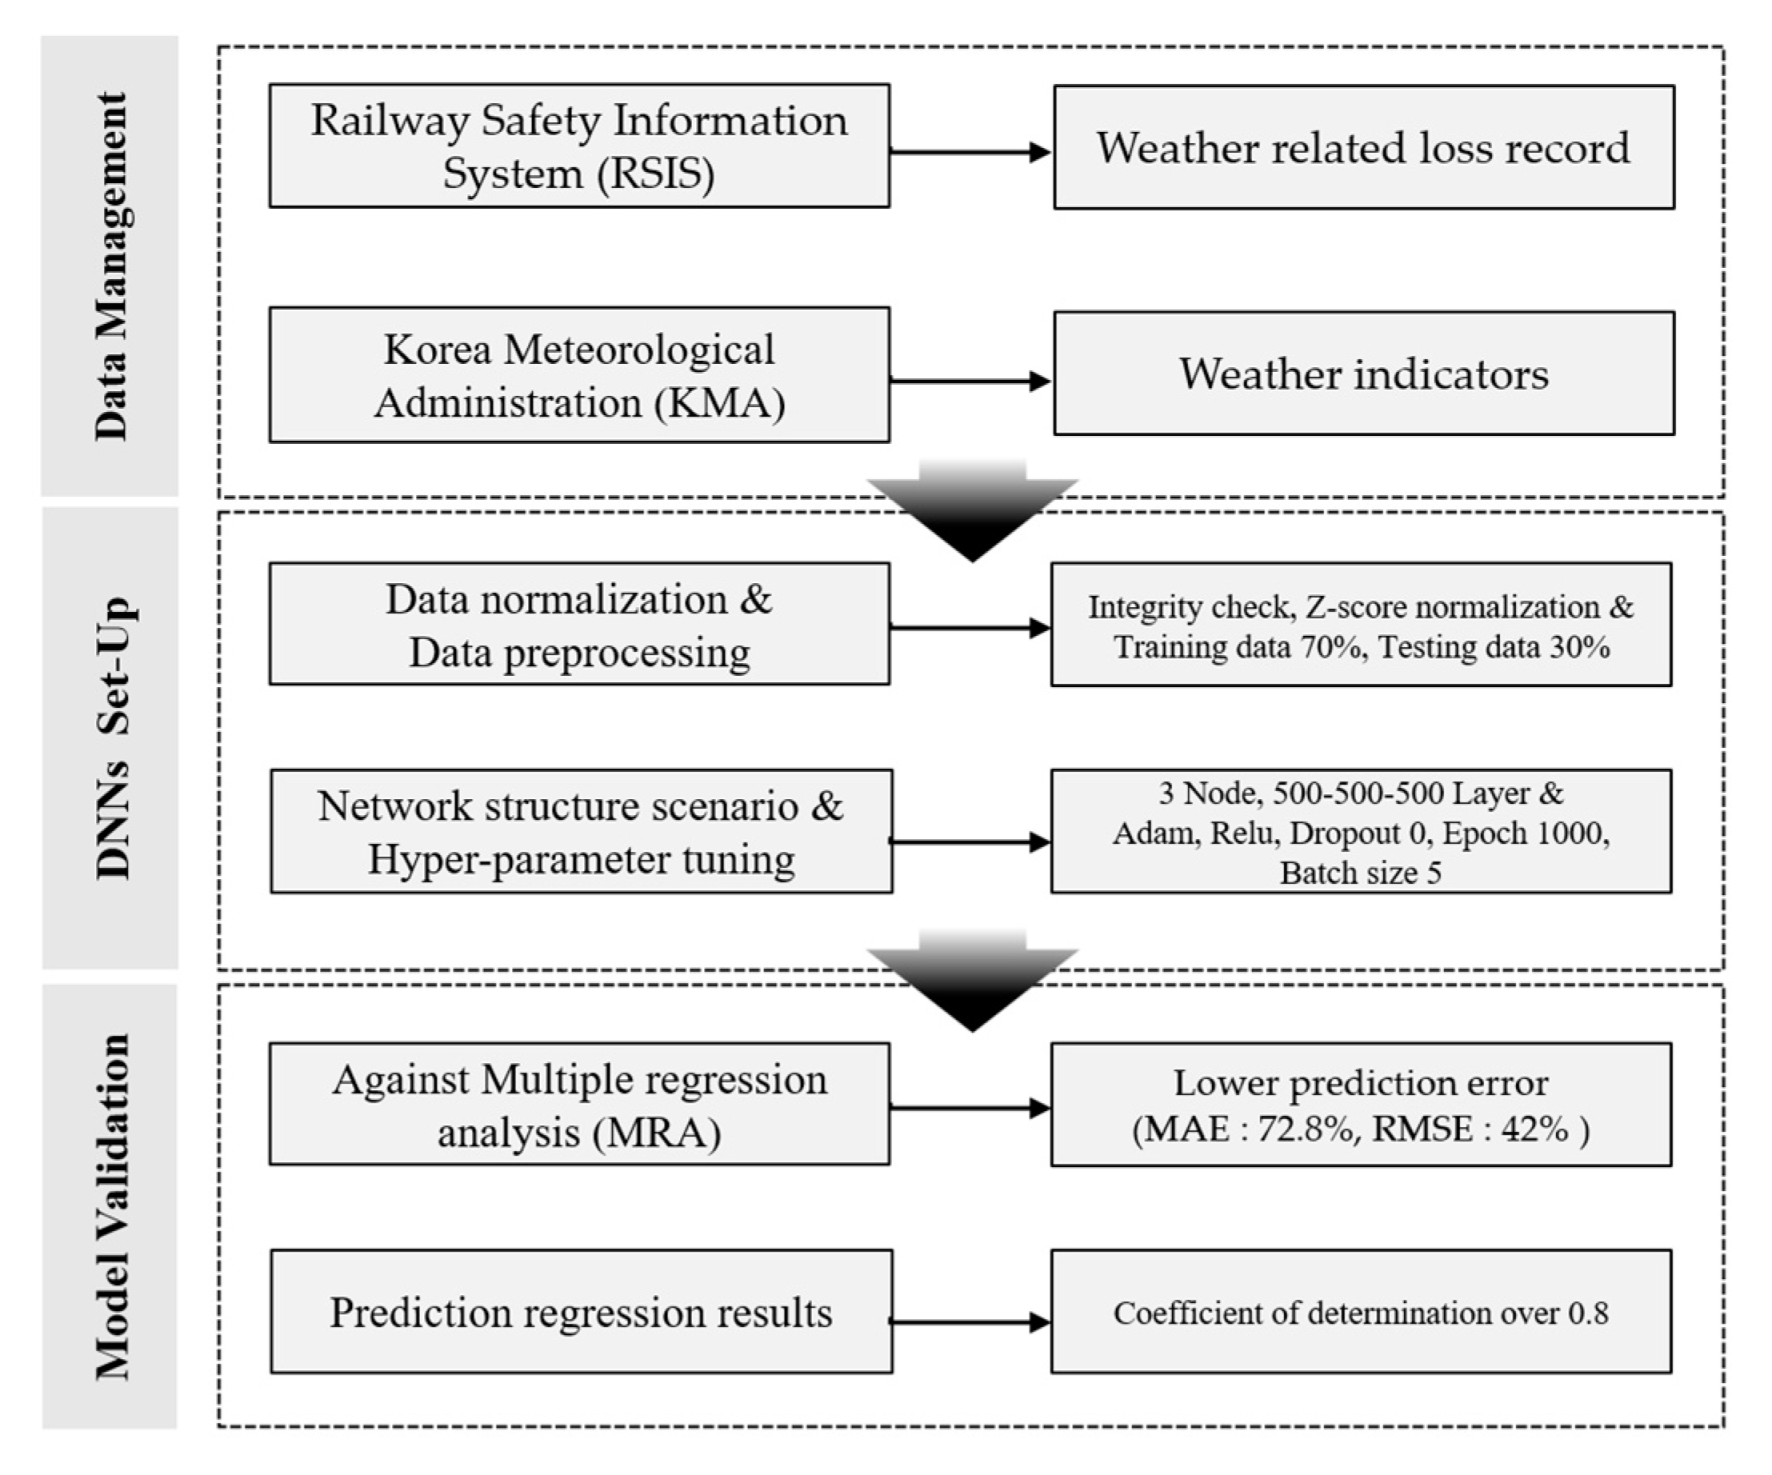
3. Research Purposes and Methodology

The specific objectives of this research are as follows: (1) Collecting data on monetary losses caused by weather-induced railroad accidents, (2) Creating a loss estimate model utilizing a deep learning algorithm built upon data gathered from railroad accidents, and (3) Validating the model by comparing the outcomes estimated by the developed model with those estimated by a multiple regression analysis model. For model verification, a separate multiple regression analysis model was established using the same data used to develop the deep learning algorithm model.
This research proceeded as follows: (1) Collection of input variables and output variables related to financial losses associated with weather-induced railroad accidents. (2) Development of a prediction model using a multiple regression analysis model and a deep learning algorithm model for the output and input variables, respectively. (3) Calculation of the root mean square error (RMSE) and mean absolute error (MAE) for the developed predictive models. (4) Verification of the predictive power of the developed deep learning algorithm model through comparison of the two values. To develop the multiple regression analysis model, IBM SPSS Statistics version 23 was applied, while the deep learning model was developed using Python 3.7.

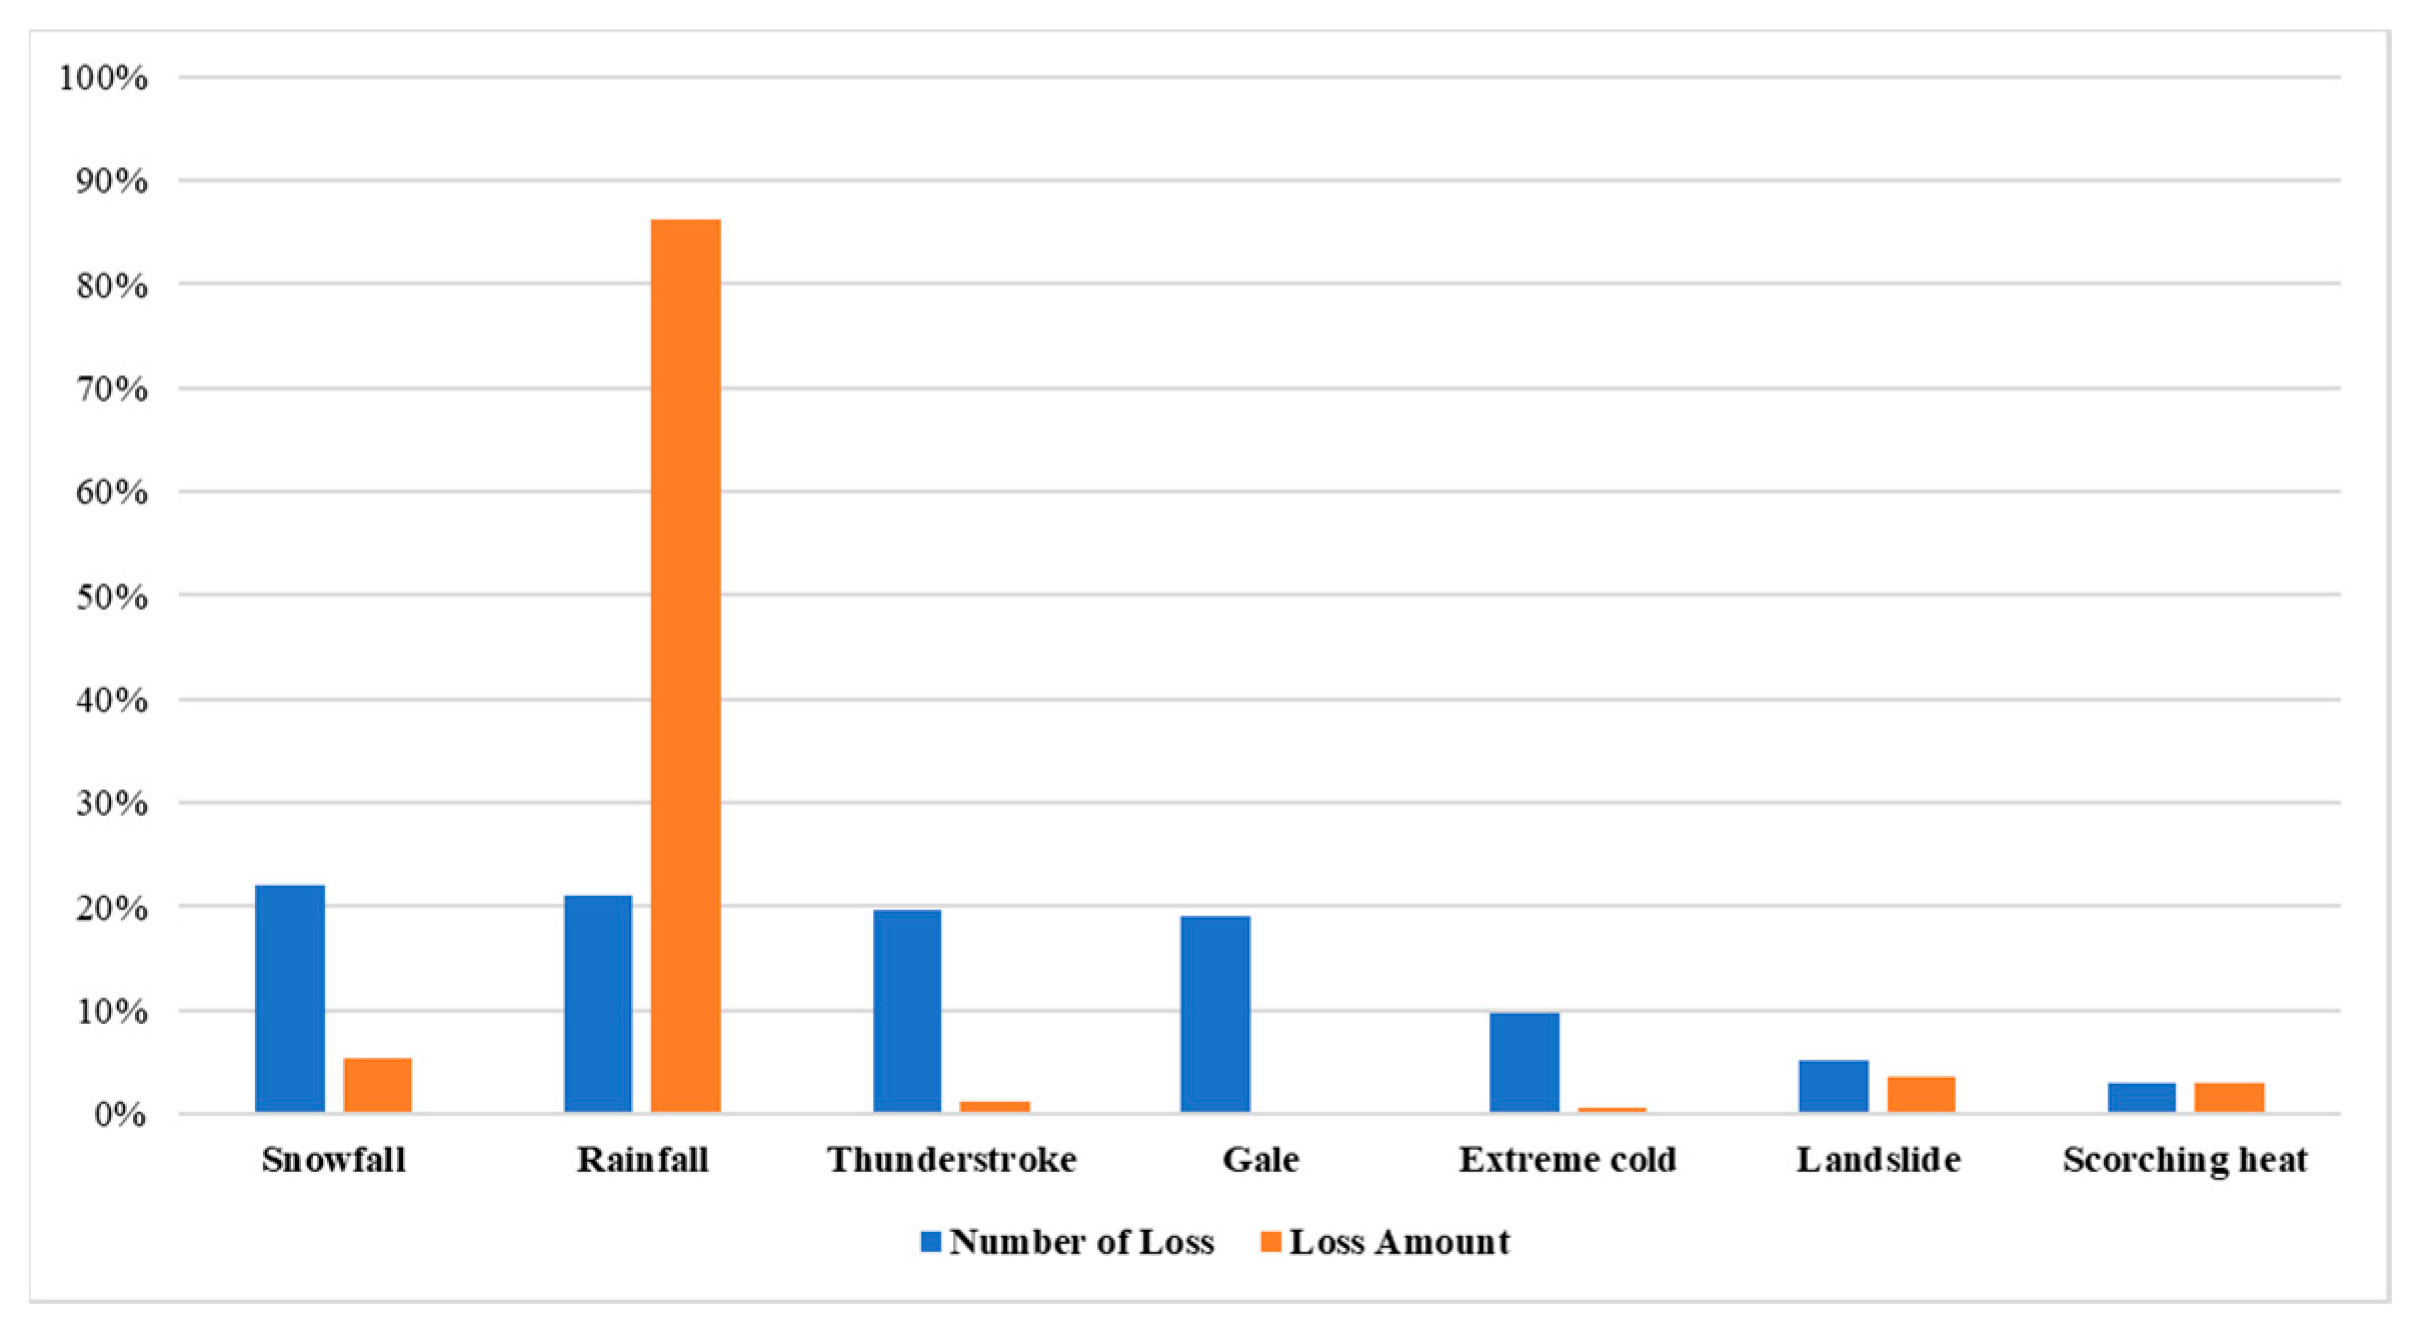
4. Data Collection and Description

Figure 1 shows the overall data collection process. This study used data on railroad accidents from 2001−2021 maintained by the Railway Safety Information System (RSIS) of the Ministry of Land, Infrastructure and Transport. The RSIS was established in 2012 as a comprehensive safety information system for railway-related organizations, and it keeps a database of railway accidents and obstacles along with railway safety and railway accident management [41]. The data collected include accident details, such as date and time, accident agency, railway classification, accident type, cause, operation failure type, train type, accident location, human casualties (dead, injured, minor injuries, etc.), loss amount, and delay time. In total, data on 14,464 accidents were collected, and 2020 accidents related to natural disasters and weather were extracted according to the accident type and cause.
To check the loss distribution and identify the cause of loss, the number (frequency) and size (severity) of loss were analyzed. Figure 2 shows the distribution of weather-related accident loss by year. There is a very large difference in the distribution of loss every year, but as can be seen from the linear trend lines, both the amount of loss and the number of loss cases are increasing every year. These demonstrate that the risk of railway accidents caused by weather is growing every year. Figure 3 displays the distribution of weather-related accidents by cause. Causes of loss included snowfall, rainfall, thunderstroke, gale, extreme cold, landslide, and scorching heat. The number of losses appeared in the order of snowfall, rainfall, thunderstroke, and gale, but the amount of loss looked in the order of rainfall, snowfall, landslide, and scorching heat. In particular, rainfall was found to account for the largest proportion of damage.
Figure 4 displays the frequency distribution of the input and output variables. Table 1 describes the variables. From the collected data, the amount of weather-induced railroad accident loss was selected as an output variable. The weather information relevant to each railway accident, which was taken from the meteorological data open portal of the Korea Meteorological Administration, was used as the input variable to collect detailed and objective weather data. Since 1904, the Korea Meteorological Administration’s meteorological data open portal has provided continuously tracked information on various weather elements (e.g., precipitation, solar radiation, snow, temperature, wind, humidity, temperature). The weather information at the time of each accident was collected based on the date and location of the accident. Weather information from the day of the accident was collected from the meteorological observation point closest to the accident location. Weather information (e.g., wind speed, temperature, rainfall, sunshine, relative humidity, snowfall, fog) on the day of the accident was collected by the Korea Meteorological Administration.
Moreover, as the collected data used various scales, the distributions of both the input and output data were standardized with a mean of 0 and a standard deviation of 1 through the z-score normalization method; this data normalization made it possible to compare data with various scales. All data are composed of numeral variables, and Table 2 provides the descriptive statistics of the collected training set and test set.

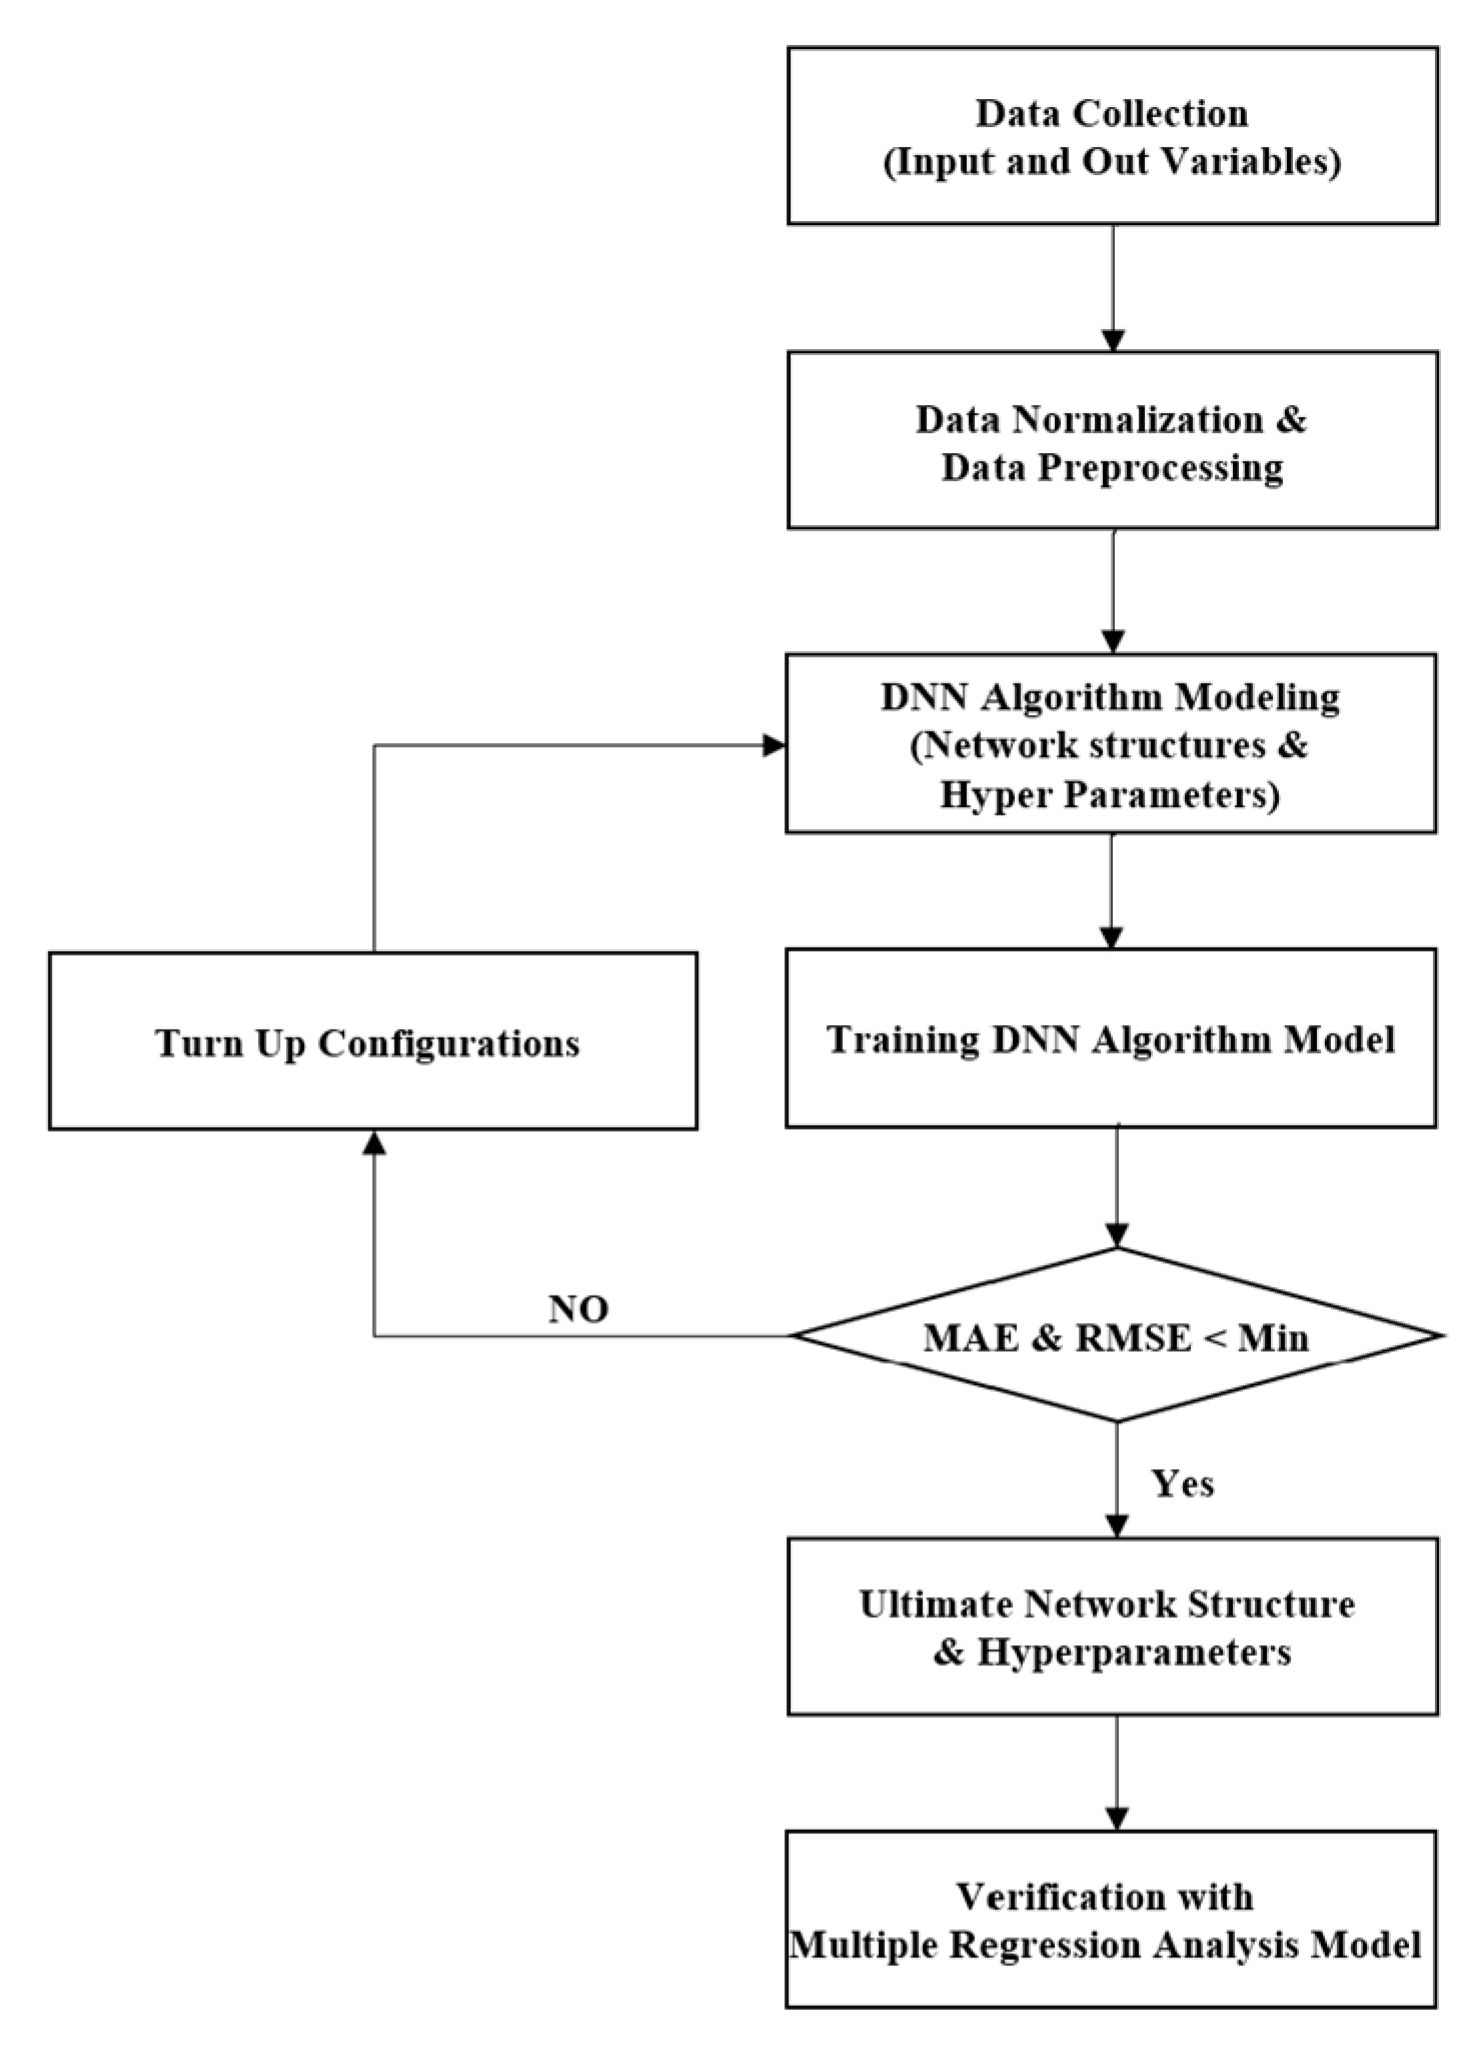
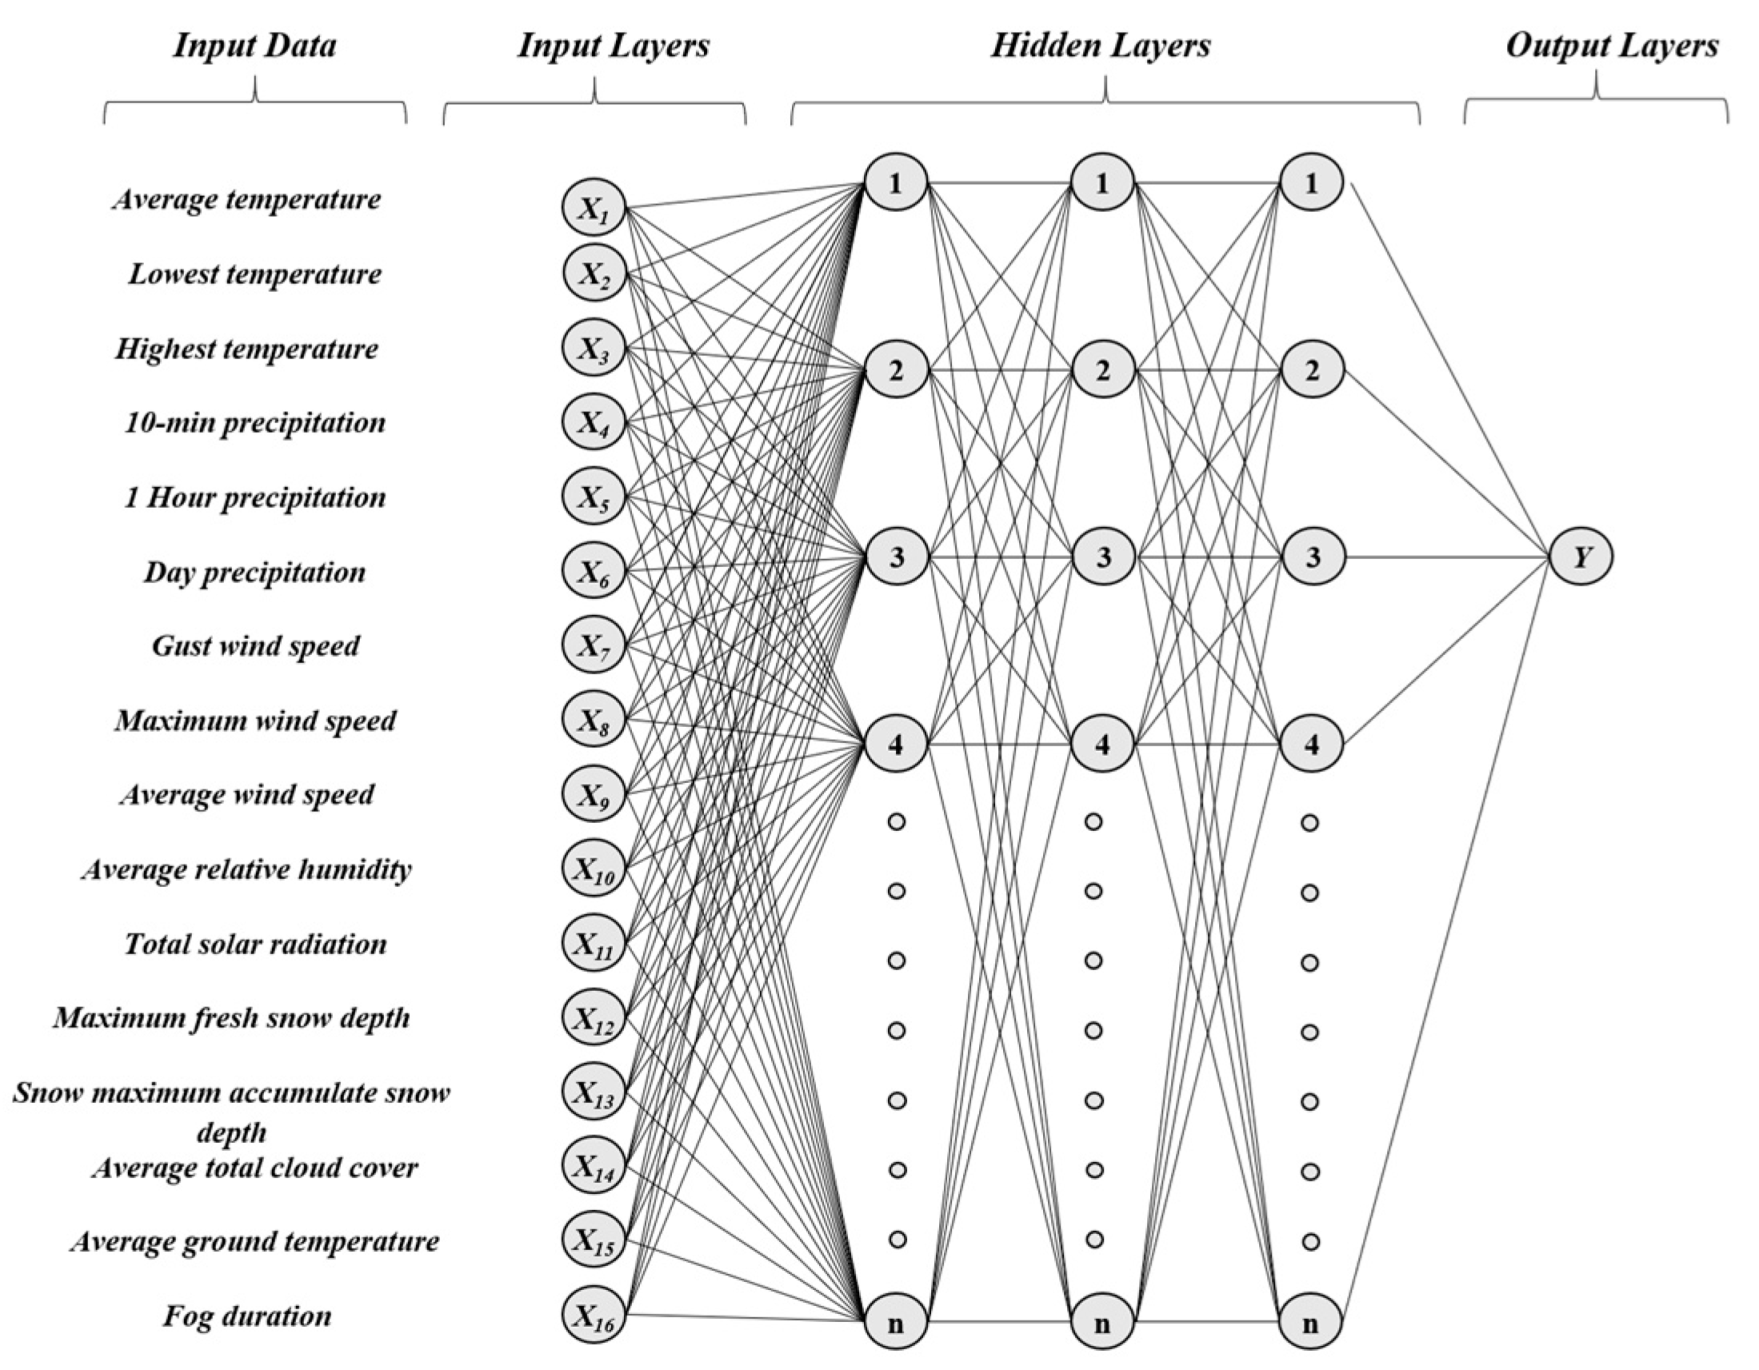
5. Deep Learning Algorithm Model Employment

Deep learning technology can be used to construct different models depending on the combination of various components (e.g., hidden layer, output layer, input layer, neurons, activation function, and weights); thus, it can be adopted to numerous types of data, industries, and research fields. It has been particularly recognized for its outstanding performance in the field of prediction and recognition [54,55]. Representatively, DNN (Deep Neural Network) algorithms can combine various structures and components, thus showing excellent performance in learning data involving high uncertainty, such as risk and accidents, as well as complex nonlinear interactions. Therefore, DNN algorithms are commonly used for accident- and risk-related prediction and classification [56,57]. Hence, while considering the characteristics of the input and output variables, this paper proposes a model framework for forecasting financial losses stemming from weather-related railway accidents using the DNN algorithm. The DNN algorithm is composed of several layers to extract various features from complex datasets, and it learns nonlinear relationships through a multi-layer structure to more effectively model complex interactions between weather factors and railroad accidents. It is also possible to exercise the optimal function of DNN algorithm selection for the collected data set. DNN algorithms can process large numbers of data, and they can also process large numbers of weather data and railroad accident records to enable more accurate predictions. Moreover, since DNN learns non-linear relationships, it can improve prediction performance by comprehensively understanding various interactions and patterns between weather factors and railroad accidents.
The developed model was evaluated using the Mean Absolute Error (MAE) and Root Mean Square Error (RMSE) values. MAE and RMSE are symbolic measures of the evaluation of artificial neural network models, and they are used to capture a model’s prediction accuracy by calculating the deviation between the predicted and actual result values [46]. For example, MAE represents the absolute value obtained by averaging the difference between the projected and actual values of the model; the lower the MAE value, the lesser the prediction error. Meanwhile, RMSE measures the difference between the predicted and actual values of a model on a scale; the lower the RMSE value, the more accurate the prediction. For data preprocessing, the accuracy and completeness of the data was maintained through a data integrity check to ensure that the model’s training and prediction are reliable. Missing values or outliers were identified and corrected, duplicate data identified, and data types and data labels checked. After the data integrity check, the input data were normalized through the z-score normalization method. The collected data were also split into three categories of training data, validation data, and test data: 70% of the data was used as training data, with 30% of that being designated as validation data. The remaining 30% of the data was used as test data.

5.1. DNN Algorithm Model Set-Up

Figure 5 shows the framework of the DNN algorithm model. To develop an optimal deep neural network (DNN) algorithm model, it is first necessary to find the ideal network structure scenarios and tune hyperparameters. The DNN algorithm model employs the backpropagation algorithm, which uses the weights of nodes that vary depending on input and output variables [58]. Different hyperparameters—such as the activation function, batch size, dropout, optimizer, and epoch—are combined to find the optimal combination. The method used to find the minimum cost function is determined by the activation function, while the data-learning unit of the model for effectual learning is determined by the batch size. To prevent overfitting, which can hinder the performance of deep learning algorithms, a regularization penalty called Dropout is used. The optimizer wheels the constancy of learning by controlling the learning rate of the model, and the epoch specifies the quantity of times the model learns the data [59]. In the present work, due to the limited volume of data, the network structure scenario was established to three layers, with dropouts of 0 and 0.2 selected. The Adaptive Moment Estimation (Adam) was selected as the optimizer because it is widely used and easy to calculate [60]. The batch unit was established at 5, and the epoch was set to 1000. The Rectified Linear Unit (ReLu) function was nominated as the activation function, which is commonly used [60]. The optimal combination was found through a simulation process focused on the network structure scenario and hyperparameters. Figure 6 shows the architecture of the DNN algorithm model.
Here, Table 3 presents the MAE and RMSE values calculated for each scenario based on different network structure scenarios and dropout values. The scenario with the lowest MAE and RMSE was ultimately selected as the final model. The results show that the scenario with a dropout value of 0.2 has a higher loss function than the scenario with a dropout value of 0.0, and with an increasing number of hidden layer nodes, the loss function value decreases. Among the scenarios tested, the 500−500−500 scenario showed the lowest MAE and RMSE values, as represented in Figure 7. Therefore, the final model was developed with a network structure scenario of 500−500−500 and zero dropout.

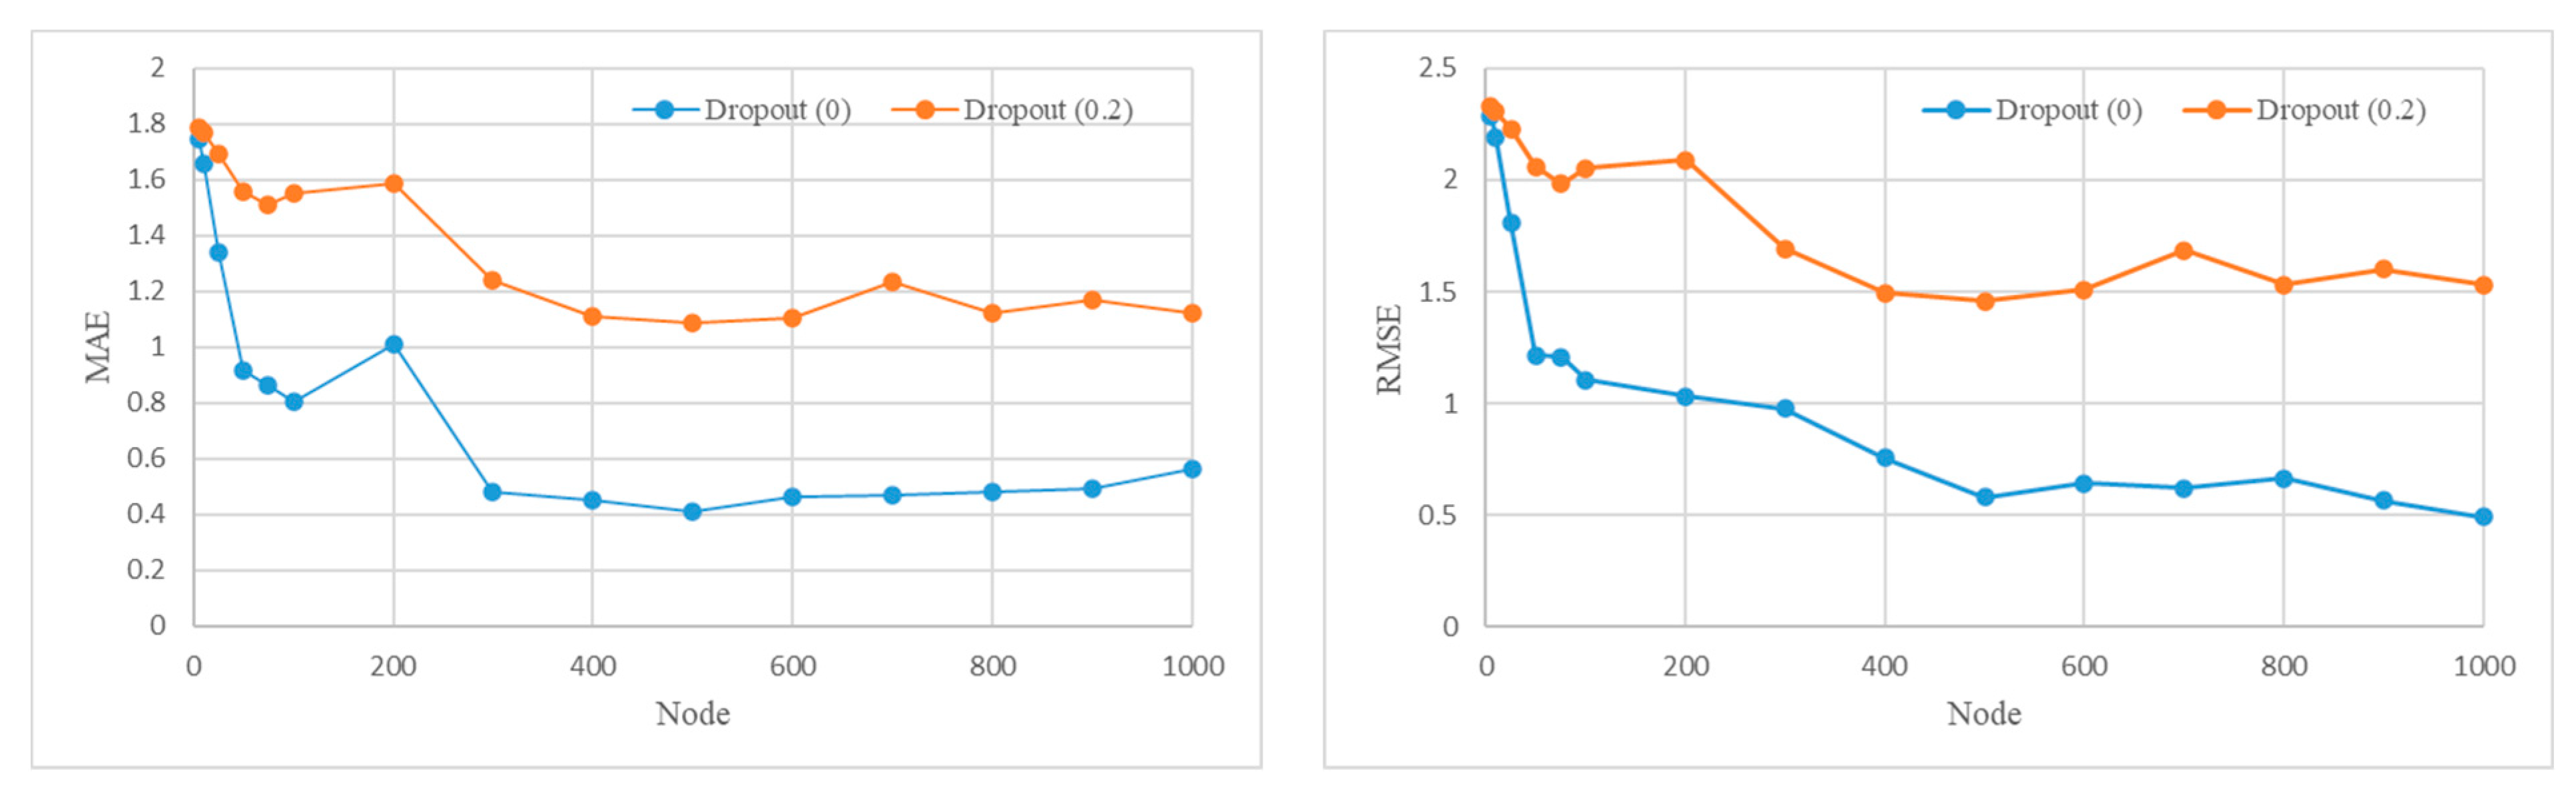
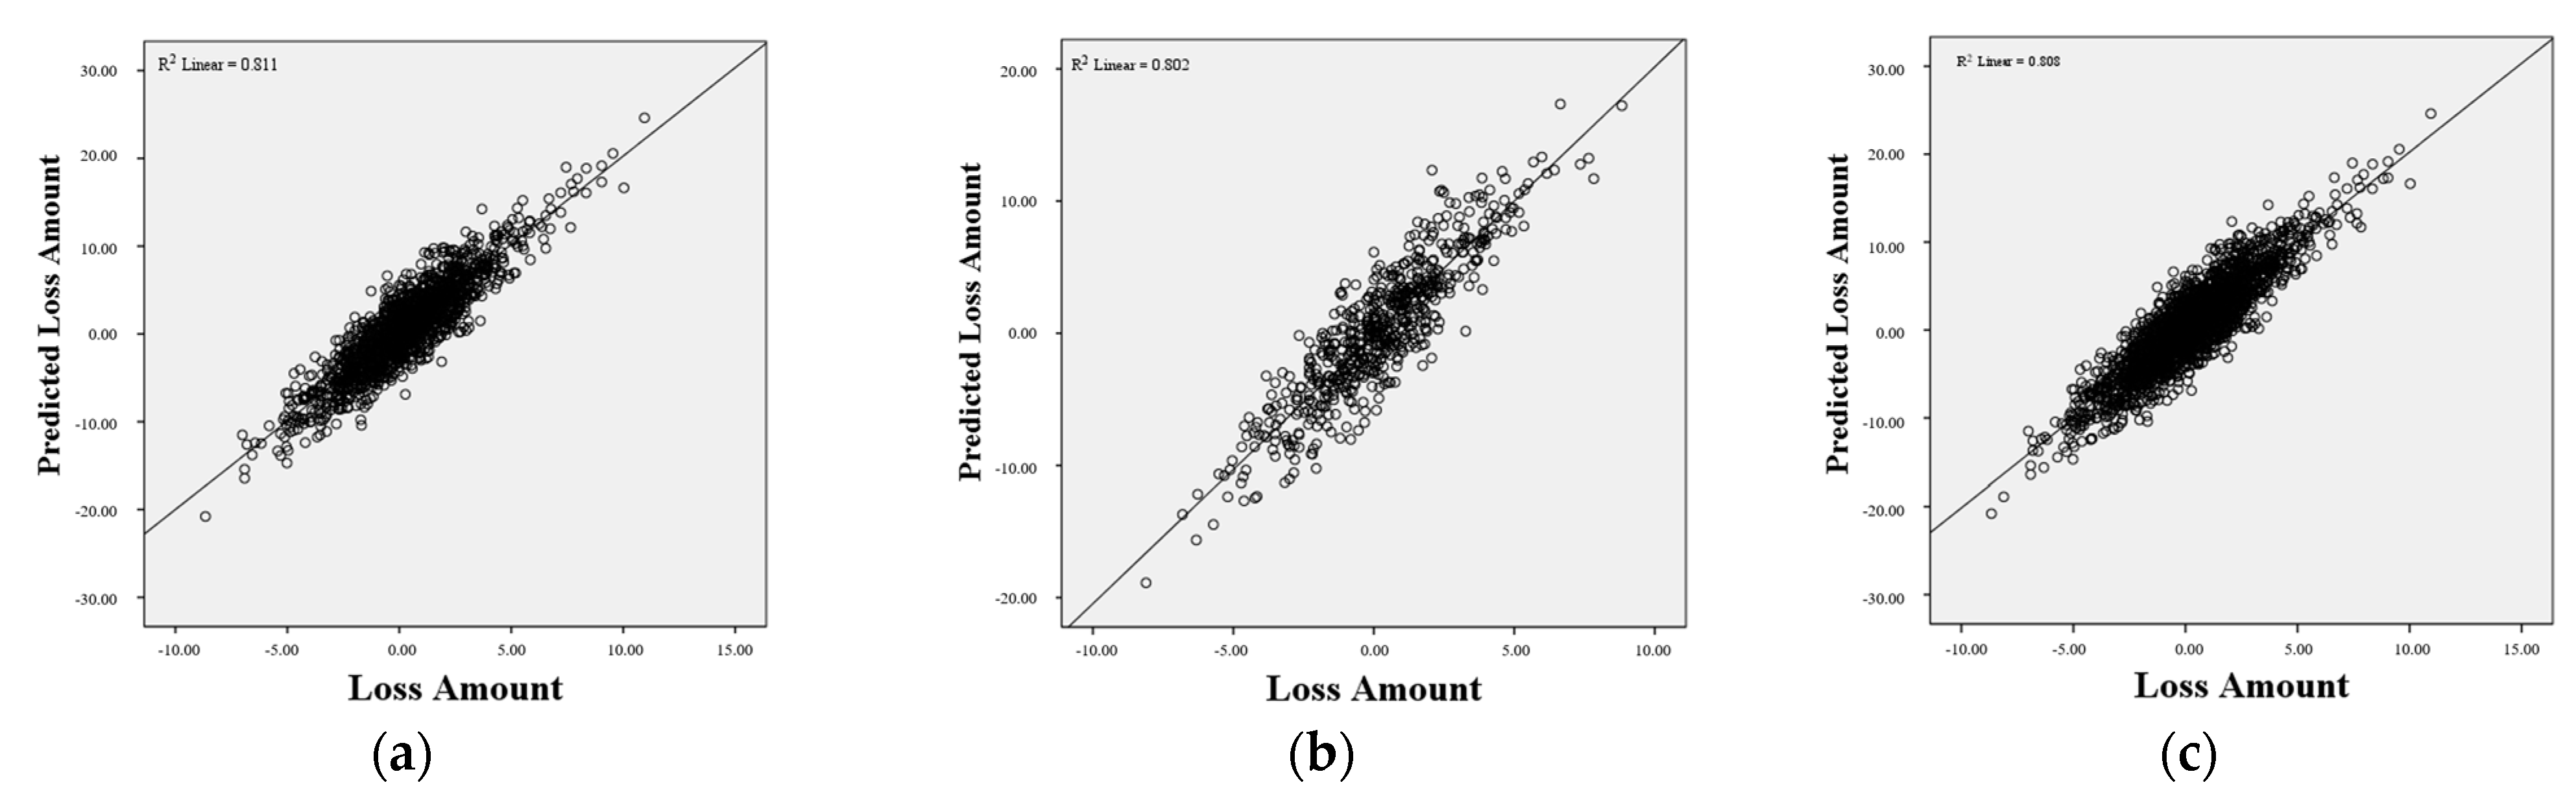
5.2. Model Verification

Table 4 lists the hyperparameters and network structure of the ultimate DNN model. The MAE and RMSE values were designed from the validation data and test data to determine the efficiency of the ultimate DNN model for new data and address the problem of model overfitting. Table 5 presents the simulation outcomes, where the MAE value of the verification data was 1.280 and the RMSE value was 1.195, while the MAE value of the test data was 0.771 and the RMSE value was 1.310. Therefore, since there is not much difference between the calculated result values of the verification data and the calculated result values of the test data, the validity of the final model for new data is confirmed, and the overfitting of the model is assessed as insignificant. Further, to verify the model, a multiple regression analysis model was constructed that applied the same data as multiple regression analysis (MRA). Multiple regression analysis is largely a statistical process that evaluates and formulates the correlation between independent variables and dependent variables, and which is widely used in predictive domains in various industries and research fields [60]. DNN algorithms can also learn complex nonlinear relationships, but they often face the risk of overfitting. On the other hand, although multiple regression analysis is a relatively simple linear model, it is resistant to overfitting and has excellent generalizability. Therefore, the generalization performance of the DNN can be evaluated by using the multiple regression analysis model to check the performance differences with the DNN model. The MAE and RMSE values of the MRA model were considered in the same way as they were in the DNN model. Table 5 compares the calculation outcomes of the DNN model and the MRA model. As a result of the comparison, the DNN model was found to show a smaller prediction error rate than the MRA model, with MAE of 72.8% and RMSE of 42%. For additional model validation, prediction results were calculated by simulating the training data set, validation data set, and all data sets. Figure 8 shows the results of the regression analysis of the prediction result values of each data set to investigate bias in the data and check the coefficient determination. Through the results of the regression analysis, it is possible to accurately understand the relationship between the actual value and the predicted result value of the final DNN model of this study. Furthermore, by visualizing the distribution of predicted results and actual values, it is possible to check data bias by checking what predictions the model is making for which classes or groups. As shown in Figure 8, it is judged that there is no problem with data bias because the distribution of prediction results and actual values has a consistent shape for the data used in this study. Moreover, since the coefficient of determination (R2) of each data set used in this study exceeds 0.8, the independent variables in this model almost completely explain the variation of the dependent variable. Furthermore, the reliability and consistency of the model of this study are well verified.

6. Discussion

This research suggests a framework that can be used to develop a model that predicts economic loss in weather-induced railway accidents by considering meteorological factors using the DNN algorithm. The output variable for data collection is the number of losses caused by railway accidents over the last 21 years as collected by the Railway Safety Information System (RSIS) of the Ministry of Land, Infrastructure and Transport, while weather information at the time of the accident was collected from the KMA based on the location of the accident as input variables. An optimal model was developed for learning the collected output variable and input variables while fine-tuning network scenarios and hyperparameters by a trial-and-error process. To verify the model, it was first confirmed that the problem of overfitting was avoided by likening the prediction outcomes of the verification data and the test data, after which the DNN model was verified through comparison and verification with the MRA model. As a consequence of the comparative verification with the two models, the DNN model showed a 72.8% lower prediction error in the MAE and a 42% lower prediction error in the RMSE than the MRA model. Moreover, it was confirmed that there was no problem with data bias by plotting the distribution of the predicted and actual values of each data set. Additionally, since the coefficient of determination (R2) of each data set is 0.802~0.811, it clearly shows that the independent variables can be explained very well through this model. Figure 9 presents the summary of the consequences classification. In this way, the model in this study proved to a have high reliability and high consistency of predictions. Consequently, it can be concluded that the DNN model using the backpropagation algorithm performs better than the MRA model using regression analysis in terms of predicting the financial losses of railway accidents caused by weather conditions. It can also be assessed that the DNN (non-parametric model) is more appropriate than the MRA (parametric model) to match the non-linearity and uncertainty of the monetary loss data in weather-induced railroad accidents. Moreover, it disclosed the predictability of railway accident damage through weather factors such as temperature, precipitation, wind speed, snow, fog, and cloud, and showed that the prediction ability was highly reliable. Therefore, the novelty of this study lies in the development of a railway accident prediction model using the DNN algorithm, and particularly in the use of meteorological factors as predictors. While there has been previous research predicting railroad accidents, the current study makes a unique contribution by using DNNs to capture the complex non-linear relationship between weather variables and accidents, thus enabling more accurate predictions. This approach strengthens our understanding of the causal relationship between weather and rail accidents, and it provides valuable insights for preventing accidents and improving rail safety measures. The innovative use of DNNs in research in this particular problem domain differentiates it from traditional predictive models while also demonstrating the potential of deep learning in traffic safety research. Management entities and managers of railways and railway facilities can use the development model and framework presented in this research to create models that can be used to predict weather-related losses. Further, because the model established in this research shows a lower rate of prediction error than the present method model, it can predict accident losses with high reliability and precision. This advanced loss estimation model will allow the main managers of railroads and railroad facilities to prepare various investment plans to prevent and limit losses caused by weather-related accidents. For example, by calculating in advance the losses caused by weather-induced accidents in railways and railroad facilities, managers can prepare by investing in various facilities to prevent and reduce these calculated losses. In terms of financial planning, this method will make it possible to establish specific financial risk plans based on the calculated loss amount, such as for the purpose of preparing emergency reserves. It is also expected to serve as guidance for avoiding or transferring financial risks through insurance, etc., while taking into account the risk preferences or asset size of the managing entity. Based on the calculated loss amount, it will be possible to assess the legitimacy of the insurance and, if necessary, to consider insurance, such as a special insurance contract, and determine the appropriate rate level when purchasing insurance. This accident loss prediction model will make it possible to improve the prediction, mitigation, forecasting, and transfer of economic losses, which will in turn contribute to the continuity and economic stability of future railroad business. Therefore, through the advanced loss estimation of this study, railway and railway facility managers and railway industry officials can establish various investment plans to prevent losses due to weather-related accidents, which ultimately contribute to preventing and reducing accident risks.
Moreover, severe weather conditions, extreme meteorological phenomena, and abnormal weather caused by global warming are all responsible for causing damage to economies and societies worldwide. Therefore, by adopting the framework and model established in this research, it is possible to forecast economic losses from weather-related accidents in other research or industrial fields. This study confirms that it is possible to predict accident losses on railways and railway facilities based on weather factors (e.g., temperature, snowfall, cloud cover, precipitation, and humidity). As global warming continues to progress, the incidence and extent of damage of natural disasters, severe weather, and weather anomalies are expected to increase, and related research is expected to become increasingly active. Consequently, the framework and consequences in this research can represent a pragmatic method to clarify the causal relationship between railway accidents and railway facilities and the weather. Moreover, as various smart systems and devices (e.g., IoT, sensors, ICT, etc.) are actively being introduced in railways and railway facilities, this can serve as an elementary study to help analyze accumulated big data.
However, since the present study considered the influence of railroads and railroad facilities that were developed based on weather indicators, further research is needed to discover additional risk factors, such as the geographical location of railroads and railroad facilities. To further advance this model, this study only targeted losses due to accidents on railroads and railroad facilities; there is therefore a need for additional research on accident risks, such as safety-related accidents, personal injury, and accident-related delays. Moreover, since this study collected the details of accidents that occurred on domestic railways and railway facilities, supplementary research is required for proportional analysis and verification through the gathering of extra data on accident cases in other countries and other SOC facilities. Moreover, since this study conducted research using only the DNN algorithm, the research results have limitations. There is therefore a substantial need for a comparative analysis through comparison and verification with other deep learning algorithms in the future.

7. Conclusions

As the harshness and occurrence of severe weather and natural tragedies are gradually increasing and expected to continue increasing due to global warming, these events have emerged as new financial risk features for railroads and railroad facilities that add to the uncertainty of railroad industry. Therefore, weather-induced financial loss management strategies, such as prevention, reduction, and loss-carry-forward based on sophisticated economic loss forecasts, are needed to manage railway projects sustainably and systematically. To establish such an advanced financial loss management strategy, priority should be given to a scientifically objective accident loss prediction model. The current research proposes an outline for developing an analytical model based on deep learning algorithms by utilizing accident loss data and weather indicators related to railroad lines and facilities.
To develop the loss cost prediction model proposed in this study, the DNN algorithm was used, and it was proved through contrast with the other general model. In predicting weather-related railway accidents, the prediction error of this model is lower than that of the general model, and it is expected that it can eventually be developed to a point where it can guarantee the estimation of loss costs due to railway accidents. Therefore, the results and framework of this paper can be used as an effective method to predict the economic losses of future railroads and railroad facilities; it can therefore be adopted as a reference point for loss risk mitigation measures or financial management in railroad projects. Moreover, the results and outline of this study can be adopted in various ways in other industries, research fields, or other SOC facilities, ultimately supporting the prevention and reduction of economic losses. It will also be possible to continuously enhance the reliability of the model by supplementing and additionally verifying the model by detecting speculative risk factors and collecting data. Moreover, the weather risk factors and results used in this study are expected to serve as a beneficial reference for the management of railway and railway facilities. For example, systems and management measures are likely to be put into place to prevent and limit weather-related damage to railroads and railroad facilities and to prepare the basis for additional investment in facilities located in vulnerable areas. However, the DNN algorithm utilized in this research has the advantage of having an inferior prediction error than the present model, but it has a fatal disadvantage in that the characteristics of the DNN algorithm mean that the interrelationship between nodes and their weight is unknown. Since this may adversely affect the credibility and reliability of future prediction results, it is necessary for future research to introduce skills such as Explainable AI (XAI) to improve user reliability and understanding and coefficient of determination for users. In future studies, it is necessary to introduce alternative AI algorithms such as recurrent neural networks (RNNs) such as Long Short-Term Memory (LSTM) or Gated Recurrent Unit (GRU). Since these RNN-based algorithms are suitable for analyzing time series data, they are judged to be more useful when analyzing time series correlations between railroad accidents and meteorological indicators. Furthermore, a comparative study on the modeling results of the DNN algorithm and other AI algorithms is needed.

Author Contributions

Conceptualization, J.-M.K. and K.-K.L.; methodology J.-M.K. and K.-K.L.; validation, J.-M.K. and K.-K.L.; formal analysis, J.-M.K.; investigation, K.-K.L.; resources, K.-K.L.; data curation, J.-M.K.; writing—original draft preparation, J.-M.K. and K.-K.L.; writing—review and editing, J.-M.K. and K.-K.L.; visualization, J.-M.K. and K.-K.L.; supervision, J.-M.K. and K.-K.L.; funding acquisition, J.-M.K. and K.-K.L.; All authors have read and agreed to the published version of the manuscript.

Funding

This research was funded by Basic Science Research Program through the National Research Foundation of Korea (NRF) funded by the Ministry of Education (NRF-2022R1F1A106314111) and also supported by research fund by Songwon University.

Institutional Review Board Statement

Not applicable.

Informed Consent Statement

Not applicable.

Data Availability Statement

The data used to support the findings of this study are available upon request from the corresponding author.

Conflicts of Interest

The authors declare that they have no conflict of interest.

References

  1. Kim, J.M.; Son, S.; Lee, S.; Son, K. Cost of Climate Change: Risk of Building Loss from Typhoon in South Korea. Sustainability 2020, 12, 7107. [Google Scholar] [CrossRef]
  2. Walker, T.J.; Pukthuanthong, K.; Barabanov, S.S. On the Stock Market’s Reaction to Major Railroad Accidents. J. Transp. Res. Forum 2010, 45, 1. [Google Scholar] [CrossRef]
  3. Bešinović, N. Resilience in railway transport systems: A literature review and research agenda. Transp. Rev. 2020, 40, 457–478. [Google Scholar] [CrossRef]
  4. Lu, Q.C. Modeling network resilience of rail transit under operational incidents. Transp. Res. Part A Policy Pract. 2018, 117, 227–237. [Google Scholar] [CrossRef]
  5. Bababeik, M.; Khademi, N.; Chen, A. Increasing the resilience level of a vulnerable rail network: The strategy of location and allocation of emergency relief trains. Transp. Res. Part E Logist. Transp. Rev. 2018, 119, 110–128. [Google Scholar] [CrossRef]
  6. Baker, C.J.; Chapman, L.; Quinn, A.; Dobney, K. Climate change and the railway industry: A review. Proc. Inst. Mech. Eng. Part C J. Mech. Eng. Sci. 2010, 224, 519–528. [Google Scholar] [CrossRef]
  7. Binti Sa’adin, S.L.; Kaewunruen, S.; Jaroszweski, D. Heavy rainfall and flood vulnerability of Singapore-Malaysia high speed rail system. Aust. J. Civ. Eng. 2016, 14, 123–131. [Google Scholar] [CrossRef]
  8. Binti Sa’adin, S.L.; Kaewunruen, S.; Jaroszweski, D. Risks of climate change with respect to the Singapore-Malaysia High Speed Rail System. Climate 2016, 4, 65. [Google Scholar] [CrossRef]
  9. Dindar, S.; Kaewunruen, S.; An, M.; Osman, M.H. Natural hazard risks on railway turnout systems. Procedia Eng. 2016, 161, 1254–1259. [Google Scholar] [CrossRef]
  10. Alawad, H.; Kaewunruen, S.; An, M. Learning from accidents: Machine learning for safety at railway stations. IEEE Access 2019, 8, 633–648. [Google Scholar] [CrossRef]
  11. Alawad, H.; Kaewunruen, S.; An, M. A deep learning approach towards railway safety risk assessment. IEEE Access 2020, 8, 102811–102832. [Google Scholar] [CrossRef]
  12. Sresakoolchai, J.; Hamarat, M.; Kaewunruen, S. Automated machine learning recognition to diagnose flood resilience of railway switches and crossings. Sci. Rep. 2023, 13, 2106. [Google Scholar] [CrossRef]
  13. Kaewunruen, S.; Sresakoolchai, J.; Yu, S. Global warming potentials due to railway tunnel construction and maintenance. Appl. Sci. 2020, 10, 6459. [Google Scholar] [CrossRef]
  14. Dindar, S.; Kaewunruen, S.; An, M.; Sussman, J.M. Bayesian Network-based probability analysis of train derailments caused by various extreme weather patterns on railway turnouts. Saf. Sci. 2018, 110, 20–30. [Google Scholar] [CrossRef]
  15. Agnihotri, A.; Bhattacharya, S. Amtrak: Lack of funding or mismanagement? In SAGE Business Cases; SAGE Publications: New York, NY, USA, 2020. [Google Scholar]
  16. Rossetti, M.A. Potential impacts of climate change on railroads. In The Potential Impacts of Climate Change on Transportation: Workshop Summary; Gouvernement du Québec: Quebec, QC, Canada, 2002. [Google Scholar]
  17. Rossetti, M.A. Analysis of Weather Events on US Railroads; U.S. Department of Transportation: Washington, DC, USA, 2007.
  18. Ahmed, M.M.; Franke, R.; Ksaibati, K.; Shinstine, D.S. Effects of truck traffic on crash injury severity on rural highways in Wyoming using Bayesian binary logit models. Accid. Anal. Prev. 2018, 117, 106–113. [Google Scholar] [CrossRef]
  19. Duan, F.; Song, Y.; Gao, S.; Liu, Y.; Chu, W.; Lu, X.; Liu, Z. Study on aerodynamic instability and galloping response of rail overhead contact line based on wind tunnel tests. IEEE Trans. Veh. Technol. 2023, 72, 7211–7220. [Google Scholar] [CrossRef]
  20. Song, Y.; Zhang, M.; Øiseth, O.; Rønnquist, A. Wind deflection analysis of railway catenary under crosswind based on nonlinear finite element model and wind tunnel test. Mech. Mach. Theory 2022, 168, 104608. [Google Scholar] [CrossRef]
  21. Aleksić, D.; Marković, M.; Vasiljević, M.; Stojić, G.; Pavlović, N.; Tanackov, I. Analysis of impact of meteorological conditions on human factors in estimating the risk of railway accidents. Transport 2018, 33, 1121–1134. [Google Scholar] [CrossRef]
  22. Hao, W.; Moghimi, B.; Yang, X.; Kamga, C.; Wang, Y.; Xiao, L.; Liu, Z. Effects of foggy conditions on driver injury levels in US highway-rail grade crossing accidents. Case Stud. Transp. Policy 2017, 5, 627–633. [Google Scholar] [CrossRef]
  23. Miller, T.R.; Douglass, J.B.; Pindus, N.M. Railroad injury: Causes, costs, and comparisons with other transport modes. J. Saf. Res. 1994, 25, 183–195. [Google Scholar] [CrossRef]
  24. Ercegovac, P.; Stojić, G.; Tanackov, I.; Sremac, S. Application of Statistical Analysis for Risk Estimate of Railway Accidents and Traffic Incidents at Level Crossings. Entren. Enterp. Res. Innov. 2022, 8, 225–238. [Google Scholar] [CrossRef]
  25. Liu, X.; Saat, M.R.; Barkan, C.P. Analysis of causes of major train derailment and their effect on accident rates. Transp. Res. Rec. 2012, 2289, 154–163. [Google Scholar] [CrossRef]
  26. Lin, C.Y. Probabilistic Risk Assessment of Railroad Train Adjacent Track Accidents. Ph.D. Thesis, University of Illinois Urbana-Champaign, Champaign, IL, USA, 2019. [Google Scholar]
  27. Bridgelall, R.; Tolliver, D.D. Railroad accident analysis using extreme gradient boosting. Accid. Anal. Prev. 2021, 156, 106126. [Google Scholar] [CrossRef]
  28. Zhang, Z.; Turla, T.; Liu, X. Analysis of human-factor-caused freight train accidents in the United States. J. Transp. Saf. Secur. 2021, 13, 1157–1186. [Google Scholar] [CrossRef]
  29. Evans, A.W. Fatal train accidents on Europe’s railways: An update to 2019. Accid. Anal. Prev. 2021, 158, 106182. [Google Scholar] [CrossRef]
  30. Liu, X.; Saat, M.R.; Qin, X.; Barkan, C. Analysis of U.S. freight-train derailment severity using zero-truncated negative binomial regression and quantile regression. Accid. Anal. Prev. 2013, 59, 87–93. [Google Scholar] [CrossRef]
  31. Miwa, M.; Gozun, B.; Oyama, T. Statistical data analyses to elucidate the causes and improve the countermeasures for preventing train accidents in Japan. Intl. Trans. Oper. Res. 2006, 13, 229–251. [Google Scholar] [CrossRef]
  32. Evans, A.W. Speed and rolling stock of trains in fatal accidents on Britain’s mainline railways: 1967–2000. Proc. Inst. Mech. Eng. 2002, 216, 81–95. [Google Scholar] [CrossRef]
  33. Austin, R.; Carson, J. An alternative accident prediction model for highway-rail interfaces. Accid. Anal. Prev. 2002, 34, 31–42. [Google Scholar] [CrossRef]
  34. Raub, R.A. Examination of highway–rail grade crossing collisions nationally from 1998 to 2007. Transp. Res. Rec. 2009, 2122, 63–71. [Google Scholar] [CrossRef]
  35. Hu, S.; Li, C.; Lee, C. Model crash frequency at highway-rail grade crossings using negative binomial regression. J. Chin. Inst. Eng. 2012, 35, 841–852. [Google Scholar] [CrossRef]
  36. Lu, P.; Tolliver, D. Accident prediction model for public highway-rail grade crossings. Accid. Anal. Prev. 2016, 90, 73–81. [Google Scholar] [CrossRef]
  37. Haleem, K.; Gan, A. Contributing factors of crash injury severity at public highway railroad grade crossings in the US. J. Saf. Res. 2015, 53, 23–29. [Google Scholar] [CrossRef] [PubMed]
  38. Ghomi, H.; Bagheri, M.; Fu, L.; Miranda-Moreno, L.F. Analyzing injury severity factors at highway railway grade crossing accidents involving vulnerable road users: A comparative study. Traffic Inj. Prev. 2016, 17, 833–841. [Google Scholar] [CrossRef] [PubMed]
  39. Kang, Y.; Khattak, A. Cluster-based approach to analyzing crash injury severity at highway–rail grade crossings. Transp. Res. Rec. 2017, 2608, 58–69. [Google Scholar] [CrossRef]
  40. Ma, C.; Hao, W.; Xiang, W.; Yan, W. The impact of aggressive driving behavior on driver-injury severity at highway-rail grade crossings accidents. J. Adv. Transp. 2018, 2018, 1–10. [Google Scholar] [CrossRef]
  41. Ajayi, A.; Oyedele, L.; Owolabi, H.; Akinade, O.; Bilal, M.; Delgado, J.M.D.; Akanbi, L. Deep Learning Models for Health and Safety Risk Prediction in Power Infrastructure Projects. Risk Anal. 2019, 40, 2019–2039. [Google Scholar] [CrossRef]
  42. Gu, J.; Wang, Z.; Kuen, J.; Ma, L.; Shahroudy, A.; Shuai, B.; Liu, T.; Wang, X.; Wang, G.; Cai, J. Recent advances in convolutional neural networks. Pattern Recognit. 2018, 77, 354–377. [Google Scholar] [CrossRef]
  43. Yang, C.; Trudel, E.; Liu, Y. Machine learning-based methods for analyzing grade crossing safety. Clust. Comput. 2017, 20, 1625–1635. [Google Scholar] [CrossRef]
  44. Gao, L.; Lu, P.; Ren, Y. A deep learning approach for imbalanced crash data in predicting highway-rail grade crossings accidents. Reliab. Eng. Syst. Saf. 2021, 216, 108019. [Google Scholar] [CrossRef]
  45. Zheng, Z.; Lu, P.; Pan, D. Predicting highway–rail grade crossing collision risk by neural network systems. J. Transp. Eng. Part A Syst. 2019, 145, 4019033. [Google Scholar] [CrossRef]
  46. Lim, K.K. Analysis of Railroad Accident Prediction using Zero-truncated Negative Binomial Regression and Artificial Neural Network Model: A Case Study of National Railroad in South Korea. KSCE J. Civ. Eng. 2023, 27, 333–344. [Google Scholar] [CrossRef]
  47. Meng, H.; Tong, X.; Zheng, Y.; Xie, G.; Ji, W.; Hei, X. Railway accident prediction strategy based on ensemble learning. Accid. Anal. Prev. 2022, 176, 106817. [Google Scholar] [CrossRef] [PubMed]
  48. Dhingra, N.; Bridgelall, R.; Lu, P.; Szmerekovsky, J.; Bhardwaj, B. Ranking risk factors in financial losses from railroad incidents: A machine learning approach. Transp. Res. Rec. 2023, 2677, 299–309. [Google Scholar] [CrossRef]
  49. Manna, T.; Anitha, A. Precipitation prediction by integrating Rough Set on Fuzzy Approximation Space with Deep Learning techniques. Appl. Soft Comput. 2023, 139, 110253. [Google Scholar] [CrossRef]
  50. Gou, H.; Chen, X.; Bao, Y. A wind hazard warning system for safe and efficient operation of high-speed trains. Autom. Constr. 2021, 132, 103952. [Google Scholar] [CrossRef]
  51. Qizhou, H.; Xin, F.; Lishuang, B. Natural disaster warning system for safe operation of a high-speed railway. Transp. Saf. Environ. 2021, 3, tdab019. [Google Scholar] [CrossRef]
  52. Ozkurtoglu, B.H.; Kaewunruen, S. Unplanned railway maintenance of highspeed railway systems exposed to extreme weather conditions. In SDGs in the European Region; Springer: Berlin/Heidelberg, Germany, 2023; pp. 1–26. [Google Scholar]
  53. Thaduri, A.; Garmabaki, A.; Kumar, U. Impact of climate change on railway operation and maintenance in Sweden: A State-of-the-art review, Maintenance 2021. Reliab. Cond. Monit. 2023, 1, 52–70. [Google Scholar] [CrossRef]
  54. Yong-Jun, L.; Jong-Wan, S.; Min-Jae, L. Development of a deep learning-based degradation prediction model for road pavement maintenance plan establishment. Korean J. Constr. Eng. Manag. 2019, 20, 34–43. [Google Scholar]
  55. Ammar, A. The Effect of Season on Construction Accidents in Saudi Arabia. Emir. J. Eng. Res. 2019, 24, 5. [Google Scholar]
  56. Bae, S.-W.; Yoo, J.-S. Apartment price estimation using machine learning: Gangnam-gu, Seoul as an example. Real Estate Stud. 2018, 24, 69–85. [Google Scholar]
  57. Ryu, J.-D.; Park, S.-M.; Park, S.-H.; Kwon, C.-W.; Yoon, I.-S. A study on the development of a model for predicting the number of highway traffic accidents using deep learning. J. Korean Soc. 2018, 17, 14–25. [Google Scholar]
  58. Kingma, D.P.; Ba, L.J. ADAM: A Method for Stochastic Optimization. Int. Conf. Learn. Represent. 2018, 9, 1–15. [Google Scholar]
  59. Krizhevsky, A.; Sutskever, I.; Hinton, G.E. ImageNet Classification with Deep Convolutional Neural Networks. Adv. Neural Inf. Process. Syst. 2012, 25, 1097–1105. [Google Scholar] [CrossRef]
  60. Carreira-Perpignan, M.A.; Hinton, G.E. On contrastive divergence learning. In Proceedings of the Tenth International Workshop on Artificial Intelligence and Statistics 2005, Bridgetown, Barbados, 6–8 January 2005. [Google Scholar]
Figure 1. Workflow of data collection.
Applsci 13 10418 g001
Figure 2. Distribution of loss by year.
Applsci 13 10418 g002
Figure 3. Distribution of loss by weather events.
Applsci 13 10418 g003
Figure 4. The distribution of the input and output variables.
Applsci 13 10418 g004
Figure 5. Framework of the model.
Applsci 13 10418 g005
Figure 6. Architecture of the model.
Applsci 13 10418 g006
Figure 7. Network architecture performance.
Applsci 13 10418 g007
Figure 8. Prediction regression results of the DNN model. (a) Training data set; (b) Validation data set; (c) All data set.
Applsci 13 10418 g008
Figure 9. Classification of consequences.
Applsci 13 10418 g009
Table 1. Description of Variables.
VariableDescriptionUnit
Loss amountTotal loss caused by the weather-induced accidentone million KRW
Average temperatureAverage temperature on the day of the accident°C
Lowest temperatureLowest temperature on the day of the accident°C
Highest temperatureHighest temperature on the day of the accident°C
10-min precipitationHighest 10-min precipitation on the day of the accidentmm
1-h precipitationHighest 1-h precipitation on the day of the accidentmm
Day precipitationDaily precipitation on the day of the accidentmm
Gust wind speedMaximum instantaneous wind speed on the day of the accidentm/s
Maximum wind speedMaximum wind speed on the day of the accidentm/s
Average wind speedAverage wind speed on the day of the accidentm/s
Average relative humidityAverage relative humidity on the day of the accident%
Total solar radiationTotal solar radiation on the day of the accidentMJ/m2
Maximum fresh snow depthMaximum fresh snow depth on the day of the accidentcm
Maximum accumulated snow depthMaximum accumulated snow depth on the day of the accidentcm
Average total cloud coverAverage total cloud cover on the day of the accident1/10
Average ground temperatureAverage ground temperature on the day of the accident°C
Fog durationFog duration on the day of the accidenth
Table 2. Descriptive statistics of the training set and test set.
VariableTraining SetTest Set
NMinMaxMeanSTDNMinMaxMeanSTD
Loss amount1414−8.6610.950.332.37606−8.118.830.222.35
Ave. temperature1414−14.8032.3013.1510.38606−14.3031.7013.4810.39
Lowest temperature1414−17.8028.809.2610.73606−18.7027.809.5110.65
Highest temperature1414−12.3038.5017.9910.51606−9.5037.2018.5010.47
10-min precipitation1414−4.4030.100.832.94606023.800.892.98
1-h precipitation14140104.201.616.74606060.001.826.60
Day precipitation14140304.005.0020.206060216.005.6420.71
Gust wind speed1414080.508.764.22606049.208.623.80
Max. wind speed14141.5026.405.212.276061.5035.905.212.37
Ave. wind speed14140.2010.602.321.276060.4013.002.311.25
Ave. relative humidity1414099.0064.0517.74606099.1063.5918.29
Total solar radiation1414090.8010.08.46606078.5010.7510.82
Max. fresh snow depth1414029.200.291.94606021.800.231.60
Max. accumulated snow depth1414042.000.372.58606024.500.281.85
Ave. total cloud cover1414013.304.173.44606010.003.893.53
Ave. ground temperature1414−9.3041.3014.7911.27606−8.0038.3015.3911.11
Fog duration1414012.670.130.90606012.170.140.93
Table 3. Learning results.
Network Structure ScenarioDropout (0)Dropout (0.2)
MAERMSEMAERMSE
5−5−51.7442.2881.7892.330
10−10−101.6592.1871.7692.307
25−25−251.3411.8051.6942.229
50−50−500.9151.2141.5552.059
75−75−750.8661.2091.5111.983
100−100−1000.8021.1061.5492.051
200−200−2001.0131.0331.5862.090
300−300−3000.4830.9781.2421.693
400−400−4000.4520.7571.1121.496
500−500−5000.4100.5811.0861.456
600−600−6000.4660.6421.1061.510
700−700−7000.4700.6221.2321.687
800−800−8000.4810.6651.1231.533
900−900−9000.4930.5671.1701.601
1000−1000−10000.5610.4911.1241.533
Table 4. Final network structure and hyperparameters.
SetConfigurationFeature
Network
structure
Node3
Layer 500−500−500
HyperparameterDropout0
Epoch1000
Batch Size5
Optimizer Adaptive Moment Estimation Method
Activation FunctionRectified Linear Unit function
Table 5. Result of model comparison.
ModelValidationTest
MAERMSEMAERMSE
DNN1.2801.1950.7711.310
MRA 2.8372.260
DNN/MRA −72.8%−42.0%
Disclaimer/Publisher’s Note: The statements, opinions and data contained in all publications are solely those of the individual author(s) and contributor(s) and not of MDPI and/or the editor(s). MDPI and/or the editor(s) disclaim responsibility for any injury to people or property resulting from any ideas, methods, instructions or products referred to in the content.

