Article

MDAU-Net: A Liver and Liver Tumor Segmentation Method Combining an Attention Mechanism and Multi-Scale Features

1
School of Computer Science and Engineering, North Minzu University, Yinchuan 750021, China
2
Key Laboratory of Images and Graphics Intelligent Processing of National Ethnic Affairs Commission, North Minzu University, Yinchuan 750021, China
3
School of Mathematics and Information Science, North Minzu University, Yinchuan 750021, China
*
Author to whom correspondence should be addressed.
Appl. Sci. 2023, 13(18), 10443; https://doi.org/10.3390/app131810443
Submission received: 15 June 2023 / Revised: 8 September 2023 / Accepted: 11 September 2023 / Published: 18 September 2023
(This article belongs to the Special Issue Advances in Biomedical Image Processing and Analysis)

Abstract

:
In recent years, U-Net and its extended variants have made remarkable progress in the realm of liver and liver tumor segmentation. However, the limitations of single-path convolutional operations have hindered the full exploitation of valuable features and restricted their mobility within networks. Moreover, the semantic gap between shallow and deep features proves that a simplistic shortcut is not enough. To address these issues and realize automatic liver and tumor area segmentation in CT images, we introduced the multi-scale feature fusion with dense connections and an attention mechanism segmentation method (MDAU-Net). This network leverages the multi-head attention (MHA) mechanism and multi-scale feature fusion. First, we introduced a double-flow linear pooling enhancement unit to optimize the fusion of deep and shallow features while mitigating the semantic gap between them. Subsequently, we proposed a cascaded adaptive feature extraction unit, combining attention mechanisms with a series of dense connections to capture valuable information and encourage feature reuse. Additionally, we designed a cross-level information interaction mechanism utilizing bidirectional residual connections to address the issue of forgetting a priori knowledge during training. Finally, we assessed MDAU-Net’s performance on the LiTS and SLiver07 datasets. The experimental results demonstrated that MDAU-Net is well-suited for liver and tumor segmentation tasks, outperforming existing widely used methods in terms of robustness and accuracy.

1. Introduction

The liver is a crucial organ in the metabolic process of the human organism, and liver tumors, as a highly prevalent disease, seriously threaten human life and health. The accurate segmentation of tumor regions from computed tomography (CT) images is an important step in the subsequent diagnostic and therapeutic phases. This process can provide doctors with more precise information about the location of lesions, enhancing diagnostic efficiency and accuracy and offering higher clinical value.
However, it is challenging to effectively and precisely distinguish tumor areas from the background due to the diversity of tumor shapes and locations. In recent years, deep learning methods have progressively taken center stage in the segmentation of liver tumors [1]. Among them, the U-Net [2] model has proven to have a high level of segmentation capabilities. To deal with difficult segmentation tasks, scientists have created numerous U-Net variant networks.
Dickson et al. [3] proposed DCMC-Unet based on two-channel multi-scale convolution for liver tumor segmentation. Meanwhile, they employed a thresholding method to eliminate extraneous tissues for noise elimination. The network can effectively extract features at multiples scales and is applicable to tumors of varying sizes and shapes. However, due to the oversimplified jump connections, the model’s ability to facilitate interaction between shallow and deep information is limited. Additionally, the presence of semantic gaps reduces the model’s capacity for extracting and combining features. To address this problem, Sabir et al. [4] designed the deep dense network ResU-Net. This replaced the convolutional layers with residual blocks, aiming to make full use of the advantages of the U-Net network and deep residual learning for liver tumor segmentation. Deng et al. [5] introduced deep jump connections into U-Net to fully extract features from the encoder for enhanced feature learning. While the bottleneck layer in the aforementioned two methods is relatively simplistic, encoder features cannot be fully utilized here. This limitation can result in the loss of useful information and the degradation of network performance.
Therefore, to solve the issues mentioned above, we introduced multi-scale feature extraction with dense connections and an attention mechanism U-Net (MDAU-Net) for liver and liver tumor segmentation. The main contributions of this work are as follows:
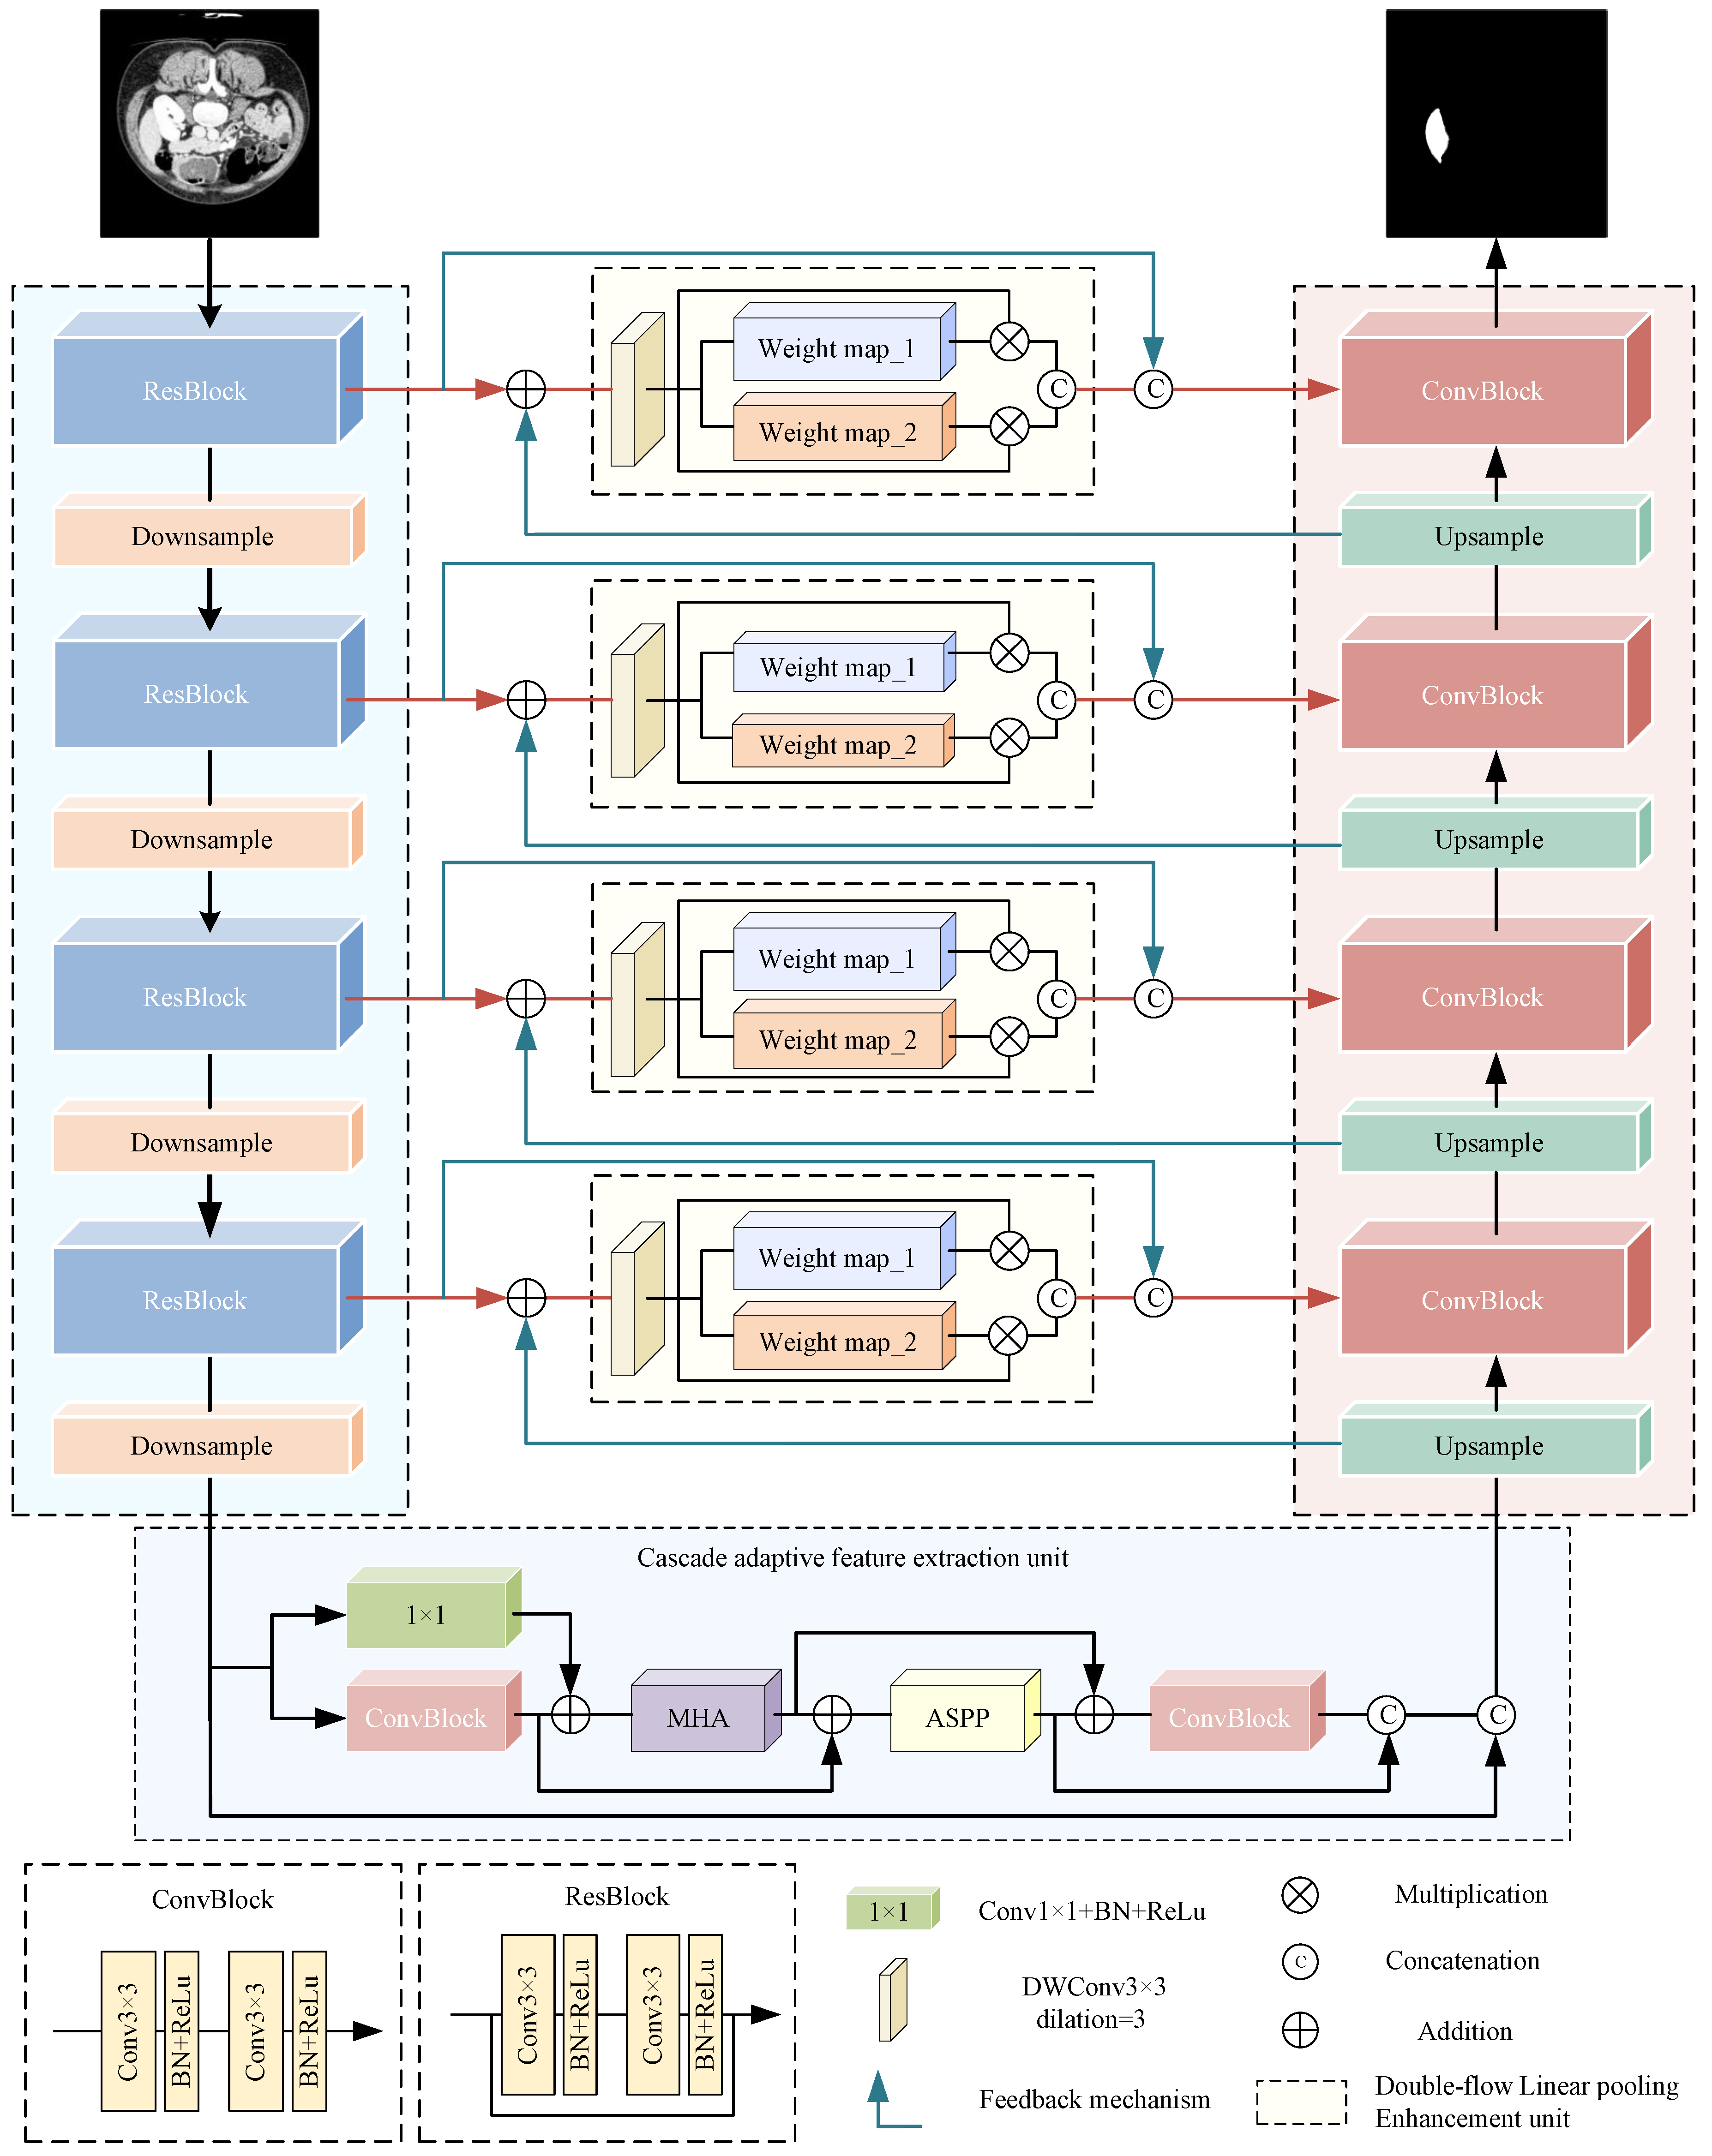
  • We redesigned the jump connection and introduced a double-flow linear pooling enhancement unit (DLE) to improve the interaction ability between deep and shallow features, which helped to narrow the semantic gap.
  • To better realize the extraction and reuse of useful features, we proposed a cascaded adaptive feature extraction unit (CAE) as a substitute for the bottleneck layer. It was based on an multi-head attention mechanism and a series of dense connections.
  • We designed a cross-level information interaction mechanism (CII). It used bidirectional residual connections and was placed in the skip connection to overcome the problem of forgetting a priori knowledge in the learning process.
  • We proposed a residual encoder to bolster the preservation of original features and supply additional initial information for the segmentation task.

2. Related Works

2.1. Medical Image Segmentation Methods

Medical image segmentation is one of the most important tasks in the field of medical image analysis, aiming to extract quantitative information about various tissue structures and lesions from complicated medical images.
The conventional manual segmentation method utilized in clinical practice entails experienced clinicians manually segmenting raw CT images. This process is characterized by its time-consuming and labor-intensive nature, and the quality of segmentation largely hinges on the operator’s experience and medical knowledge. As medical image processing technology has evolved, semi-automatic segmentation methods have gained prominence. These methods encompass thresholding, region growth, statistics, and other automatic segmentation approaches, with deep learning being a prominent representative.
The thresholding method separates the target liver region from the background by selecting the appropriate gray value as the threshold. Seong et al. [6] used a combination of adaptive thresholding and the angular line method to enhance segmentation performance. However, this method is not effective in segmentation when the gray value of the target region is much smaller than the background gray value. The region-growing method initially selects suitable pixel points (i.e., seed points) within the region as the starting point for growth. It then continually adds pixel points with similar properties to achieve segmentation. Chen et al. [7] proposed an automatic liver segmentation method based on the region-growing algorithm. They introduced center-of-mass detection and intensity analysis to ensure quick and accurate liver region segmentation. Additionally, the texture-based region growing method [8] achieves liver segmentation by automatically selecting seed points and calculating a threshold for the region-growth-stopping condition. The selection of seed point locations significantly impacts the performance of the algorithm. Statistics-based segmentation methods [9] demand extensive clinical data as support, limiting the models’ generalization ability for small-scale datasets like medical images.
The concept of deep learning was initially introduced by Hinton. In contrast to the traditional methods mentioned above, deep-learning-based methods can automatically learn feature representations from raw data. This significantly enhances the segmentation performance and generalization ability of a model. U-Net is a classic segmentation network in medical image segmentation. Along with its variants, it is widely employed in segmentation tasks due to its low parameter count and superior segmentation performance. Zhou et al. [10] introduced a series of nested dense hopping connections between the encoder and the decoder to enhance U-Net. This resulted in a 3.9% improvement in the mean intersection over union (mean IOU). Huang et al. [11] proposed UNet3+, which made more comprehensive use of the multi-scale features in the feature map. Bi et al. [12] introduced ResCEAttUnet to enhance the network’s capacity for extracting multi-scale features. This ensured that the network could effectively capture high-level semantic information while minimizing information loss. Kushnure et al. [13] developed HFRU-Net to meticulously characterize contextual information by local feature reconstruction and feature fusion mechanisms. They also adaptively recalibrated the fused features to emphasize image details. Zhou et al. [14] introduced MCFA-UNet, a multi-scale cascaded feature attention network, to address the issue of edge detail loss resulting from inadequate feature extraction.

2.2. Atrous Spatial Pyramid Pooling

As the number of network layers deepens, the resolution of the images decreases, and the generated semantic features become less effective in dense prediction tasks. To tackle this issue, various solutions have been proposed [15,16,17,18].
DeepLab V3 [18] is a semantic segmentation model based on atrous convolution, incorporating the atrous spatial pyramid pooling (ASPP) method to effectively fuse features at different scales. As depicted in Figure 1, ASPP comprises five parallel branches: a 1 × 1 convolutional branch; three atrous convolutional branches with varying expansion rates (6, 12, 18); and a global average pooling branch. The global average pooling branch downsamples the feature maps to a 1 × 1 size and subsequently upsamples them to the original size using 1 × 1 convolution and bilinear interpolation. The outputs of these five branches are concatenated to create a richer feature representation. Finally, a 1 × 1 convolution layer is employed to reduce the number of channels in the feature map to the desired level.
The inclusion of the ASPP structure during liver and liver tumor segmentation can combine the advantages of atrous convolution to expand the receptive field of the convolution kernel without losing resolution. This assists the network in learning semantic information from the multi-scale receptive field, ultimately enhancing the model’s segmentation performance.

2.3. Multi-Head Attention Mechanism

Attention mechanisms have multiple applications in computer vision as crucial components of neural networks [19,20]. When integrated into the liver tumor segmentation process, attention mechanisms enable the model to adaptively extract lesion features while suppressing irrelevant regions. This ensures that the network focuses on pertinent information for a specific segmentation task.
A generalized attention mechanism can be defined as a method for mapping a query (Q) to a set of keys (K) and values (V). In contrast, the multi-head attention mechanism (MHA) [21] implements a method for mapping a query to multiple key–value pairs. Figure 2 illustrates the structure of the multi-head attention mechanism.
In the multi-head attention mechanism, the input data consist of Q, K, and V matrices. They are mapped to different subspaces by linear transformation to obtain new matrices: Q i R m × d k , K i R m × d k , and V i R m × d V . This transformation is achieved by multiplying them with a learnable weight matrix, as shown in Equation (1).
Q i , K i , V i = Q W i Q , K W i K , V W i V
where W i Q , W i K and W i V denote the learnable weights of the corresponding Q, K, and V, respectively.
Then, scaled dot-product attention is executed for each attention head. This operation is used to compute the attention weights, as shown in Equation (2). It calculates the dot production of Q and K T to determine the degree of the relationship between Q and K. Subsequently, the outcome is rescaled, and the similarity scores undergo normalization via the softmax function. This process guarantees that the sum of attention weights across all positions equals 1. These weights are employed in a multiplication operation with V to derive the output of the respective attention head.
h e a d = A t t e n t i o n ( Q , K , V ) = s o f t m a x Q K T / d k V
where d k represents the scaling factor, which is designed to prevent gradient explosion in the similarity score matrix caused by excessive dimensionality.
Finally, the outputs of each attention head are concatenated and mapped again to obtain the final attention output, as shown in Equation (3).
M u l t i H e a d Q , K , V = C o n c a t e n a t e h e a d 1 · · · h e a d h W o
where h e a d i represents the ith attention head, and the inclusion of multiple attention heads enables the model to concurrently focus on various pieces of subspace information from distinct locations. Additionally, W o signifies the trainable weight matrix used for linear mapping.
Incorporating multi-head attention into liver and liver tumor segmentation enables the model to selectively extract pertinent features while concurrently attenuating superfluous regions. This strategy guarantees the network’s concentration on pertinent information for a given segmentation task, thereby mitigating segmentation errors induced by noisy signals. Furthermore, leveraging multi-head attention empowers the model to enhance its spatial perception, subsequently elevating segmentation accuracy.

3. Proposed Method

3.1. Overall Architecture

As shown in Figure 3, MDAU-Net maintains the U-shaped architecture and retains U-Net’s decoder path. In contrast to U-Net, MDAU-Net has four key improvements.
Firstly, we redesigned the encoder structure. In the original U-Net, the basic block utilizes the ConvBlock structure depicted in Figure 3. However, in MDAU-Net, we incorporated residual connections into the basic block, resulting in the residual encoder. This modification bolstered the preservation of original features and supplied additional initial information for the segmentation task.
Subsequently, to amplify information flow within the network and promote feature reuse, we substituted U-Net’s bottleneck layer with a cascaded adaptive feature extraction unit (CAE).
Additionally, we introduced a double-flow linear pooling enhancement unit (DLE) in the jump connection segment to narrow the semantic gap between deep and shallow features through a “progressive” feature fusion approach. This refinement aided the network in achieving more precise target area localization.
Finally, we designed a cross-level information interaction mechanism (CII) utilizing bidirectional residual connections to address the issue of forgetting a priori knowledge during the training process.
In Algorithm 1, we provide a pseudocode as an initial description of MDAU-Net, with a comprehensive exposition of the network’s structure to follow in subsequent sections.
Algorithm 1: MDAU-Net
  Data: Dataset X, mask L, module parameters
  Result: Segmentation result Y

  1 for  i = 1  to N do
  2  Preprocessing and enhancement of image X i .
  3  for  j = 1  todo
  4    Encode X i as E i j using ResBlock and MaxPooling.
  5    Obtain the feature map E i j for each encoder layer.
  6  end
  7  Adaptive feature extraction by CAE module, obtain C i .
  8  for  k = 1  todo
  9    Calculate the DLE by E i j and D i ( k 1 ) , obtain the feature map T i k .
10    Decode C i as D i k using bilinear interpolation and ConvBlock.
11    Obtain the feature map D i k for each decoder layer.
12    Obtain the segmentation result Y i of image X i as Y i = D i 4 .
13  end
14 end
15 Output the segmentation result Y = [ Y 1 , Y 2 , , Y N ] .

3.2. Residual Encoder

The residual structure [22], denoted as ResBlock and introduced as a solution to the gradient vanishing problem, is illustrated in Figure 3. In the encoder path, the repetitive downsampling operation often leads to information loss. Therefore, this study employed a sequence of consecutive residual blocks in lieu of the initial convolutional layer. This approach enhanced the network’s capacity to preserve and extract input features effectively. Furthermore, the integration of residual blocks served to mitigate to some degree the gradient vanishing challenge arising from the network’s increased depth.

3.3. Cascaded Adaptive Feature Extraction Unit

A single convolutional operation hampers the effective utilization of valuable features in deep networks. In line with the concept of dense connectivity [23], we redefined the bottleneck layer and introduced the cascaded adaptive feature extraction unit (CAE) to facilitate feature reuse and enhance the propagation of useful features throughout the network. Figure 4 illustrates the structure of the CAE unit, which consisted of two convolutional units (Conv_Unit1 and Conv_Unit2), multi-head attention, and atrous spatial pyramid pooling (ASPP). These submodules were interconnected through dense short connections, enabling each module to extract semantic information from the preceding layer or layers, thereby promoting feature reuse and transfer. Additionally, this connectivity aided in the network’s convergence.
Among these submodules, Conv_Unit1 played an essential role in initially enhancing the network’s feature representation. Multi-head attention enabled the model to adaptively extract crucial semantic features, focusing on valuable features relevant to liver tumors while reducing the impact of redundant features or background noise. This allowed the model to make more precise determinations regarding organ and lesion locations. ASPP facilitated the acquisition of multi-scale features with diverse receptive fields, enabling the network to capture a richer array of semantic information. Finally, Conv_Unit2 was utilized to further fine-tune the multi-scale features generated by ASPP.

3.4. Double-Flow Linear Pooling Enhancement Unit

U-Net utilizes jump connections to combine shallow and deep semantic features. Nonetheless, the straightforward fusion method is susceptible to generating semantic gaps due to feature disparities. In order to tackle this issue, we optimized the jump connections and introduced the double-flow linear pooling enhancement unit (DLE). As illustrated in Figure 5, the DLE unit employed double-flow paths to establish cross-channel dependencies and gather a broader range of contextual information.
For the input feature map F i n R H × W × C , we applied deep convolution with a 3 × 3 convolution kernel and an expansion ratio of 2 to process the input feature map, resulting in a new feature map F i n R H × W × . This operation, as opposed to standard convolution, captured feature map information across a larger range of sensory fields without introducing any additional parameters.
F i n = D w C o n v k = 3 r a t e = 2 F i n
where D w C o n v k = 3 r a t e = 2 denotes deep convolution with a kernel size of 3 × 3 and an expansion ratio = 2.
Subsequently, we conducted max pooling and average pooling on F i n to extract more comprehensive channel information and generate feature maps F a p R 1 × 1 × C and F m p R 1 × 1 × C , respectively.
F a p = A v g p o o l F i n F m p = M a x p o o l F i n
Finally, we employed the softmax function to normalize the weights of both F a p and F m p along the channel dimension. The outcome is two new attention views obtained by multiplying these weight matrices with F i n . These two views are concatenated along the channel dimension, resulting in a concatenated feature map with dimensions H × W × 2C. Following this, dimensionality reduction is executed using the linear function W μ , and the outcome is input into the decoder. The precise methodology is as follows:
F o u t = W μ C o n c a t e n a t e F i n × σ F a p ; F m p
where σ · signifies the s i g m o i d function, F o u t represents the output feature map resulting from channel-wise concatenation, and the linear function W μ is implemented through a 1 × 1 convolution operation. This convolution operation serves the purpose of reducing the channel dimensions of the feature map, which aids in the subsequent feature fusion process.
The double-flow linear pooling enhancement unit integrates shallow and deep features in a “progressive” manner. It simultaneously feeds the generated contextual information and the original encoder features into the decoder. In addition to diminishing the semantic information gap between different pathways, the DLE unit strengthens information exchange between the encoder and decoder pathways, leading to enhanced model stability. Moreover, the features extracted by this unit have a beneficial impact on the localization of target regions. Furthermore, the deep convolution and pooling operations partially reduce both the parameter count and computational load.

3.5. Cross-Level Information Interaction

While extracting detailed features of the liver and tumor, shallow a priori knowledge like organ boundaries and texture is often neglected. To address this concern, we introduced a cross-level information interaction mechanism based on bidirectional residual connections. This mechanism enhanced the network’s capability to learn and represent features by modeling both the encoder and decoder. As depicted by the blue arrows in Figure 6, the cross-level information interaction mechanism comprised shallow forward residuals and deep reverse residuals, detailed below.
Suppose x i R H × W × C denotes the shallow forward residual input originating from layer i of the encoder, and f i 1 R H 2 × W 2 × C 2 represents the deep reverse residual input received from layer i 1 of the decoder.
First, an upsampling operation is conducted on f i 1 to bring its resolution in line with that of x i for subsequent operations. This upsampling is achieved through bilinear interpolation.
f i 1 = u p s a m p l e f i 1
Then, x i and f i 1 are summed element-wise and directed into the DLE unit for feature extraction. The features obtained are combined with x i and subsequently reduced in dimensionality using linear mapping to produce the ultimate output y b .
y b = C o n c a t e n a t e D L E x i + f i 1 , x i G
where DLE denotes the double-flow linear pooling enhancement unit, and G denotes the linear mapping function, which is implemented by 1 × 1 convolution.
The cross-level information interaction mechanism, founded on bidirectional residuals, achieves the fusion of contextual information across various layers. It effectively addresses the problem of forgetting a priori knowledge during training and expedites feature fusion within the network, serving as an automatic learning mechanism.

4. Results

4.1. Implementation Details

MDAU-Net was implemented with the Tensorflow2.0 framework, and we used a Tesla V100 to accelerate the calculations. We employed the Adam optimizer during the training process, which is widely selected in medical image segmentation tasks. Considering the computing resources, we set the batch size to eight. The initial learning rate was set to 1 × 10 4 , and when the loss did not decrease after two epochs, we updated the next learning rate to one-tenth of the current one. All experiments and models were trained using the same parameters.

4.1.1. Dataset

The segmentation datasets used in this paper were Liver Tumour Segmentation (LiTS) and Segmentation of the Liver Competition 2007 (SLiver07).
LiTS is the public dataset of the MICCAI 2017 Liver Tumor Segmentation Challenge, which contains 131 training sets and 70 test sets. Both of them contain patients’ contrast-enhanced 3D abdominal CT scans with a resolution of 512 × 512 . The in-plane resolution is 0.55~1.0 mm. The training dataset was labeled by experienced clinicians, but the testing dataset was not. Nevertheless, due to the large scale of the dataset and the high quality of the CT scans, it is currently a wildly used dataset in liver and tumor segmentation tasks.
SLiver07 is an earlier dataset that originated from the Segmentation of the Liver Competition 2007 (SLIVER07). It contains 20 training sets and 10 testing sets, which comprise clinical CT scans. The size of the images is 512 × 512 , with an in-plane resolution of 0.56~0.8 mm. The training sets are labeled, while the 10 testing sets of CT scans are not, and both sets only contain liver information.
Since the testing sets of the two datasets were unlabeled, we only used the training set for all experiments. In detail, we used these two datasets for liver segmentation experiments, though only LiTS was selected to conduct tumor segmentation, as Sliver07 does not contain tumor information.

4.1.2. Data Preprocessing and Enhancement

For both LiTS and SLiver07, the training sets were further randomly partitioned into training and test subsets in an 8:2 ratio. This division was instrumental in evaluating the model’s performance and generalization capacity. During the experimental data preparation phase, all original CT images underwent adjustment so that the Hounsfield values (HU values) fell within the range of [−200, 200]. This ensured that the images retained maximum liver volume while mitigating the noise interference stemming from other organs and background factors. Subsequently, the images were resampled, and their resolution was downsized from 512 × 512 to 256 × 256 to reduce computational overhead. Finally, normalization, slicing, and histogram equalization operations were performed sequentially.
Figure 7 shows some comparison images randomly selected from LiTS before and after preprocessing, where (1) to (3) are the original CT images without processing, and (4) to (6) are the images after a series of preprocessing operations. Obviously, the preprocessed images provided clearer boundary contours between abdominal organs, such as the liver. The contrast with the background was significantly enhanced, accompanied by more complete local details, which helped the network to capture more adequate feature information.
Compared to other semantic segmentation datasets, our dataset was small in size and originated from a small sample pool, so the data were enhanced by panning and rotating before the experiment to improve the diversity of the dataset.

4.1.3. Loss Function

During computer-aided diagnosis or clinical processes, achieving high recall is a critical performance indicator for models. The presence of unbalanced data in medical datasets makes a network easily fall into the local optimum. This, in turn, adversely impacts segmentation performance, often leading to a high precision but low recall. In order to balance the differences between categories among the training samples, Tversky loss was experimentally selected as the loss function to calculate the similarity between the predicted labels and the ground truth, with the following equation:
T α , β = i = 1 n p 0 i g 0 i i = 1 n p 0 i g 0 i + α i = 1 n p 0 i g 1 i + β i = 1 n p 1 i g 0 i
where p 0 i denotes the probability that the ith voxel is a tumor; p 1 i denotes the probability that the ith voxel is not a tumor; g 0 i = 1 denotes a lesion voxel; g 0 i = 0 denotes a normal voxel; and g 1 i the opposite. α and β are two hyperparameters, set to α + β = 1 , reducing the effect of positive and negative sample imbalance on model performance by adjusting the values of α and β . When α = β = 0.5 , Tversky loss [24] simplifies to the Dice coefficient while equating to the balanced F score (F1 score).

4.1.4. Evaluation Metrics

To evaluate the model performance and generalization ability more objectively and comprehensively, we selected five evaluation metrics for the experiments:
  • Dice coefficient (Dice)
    D i c e = 2 × P G P + G
  • Precision
    P r e = T P T P + F P
  • Recall
    R e c a l l = T P T P + F N
  • Volumetric overlap error (VOE)
    V O E = 1 P G P G
  • Relative volume error (RVD)
    R V D = P G G
where TP is true positive, indicating that the liver region was correctly segmented; TN is true negative, which indicates that other organ regions were correctly segmented as the background; FP is false positive, which means that other organ regions were incorrectly segmented as the liver; FN is false negative, implying that the liver regions were incorrectly segmented as the background; P indicates the target pixel of the predicted label; and G represents the target pixel of the ground truth.

4.2. Loss Function Comparison Experiment

The imbalanced distribution of target and background poses a significant challenge in the domain of liver and liver tumor segmentation. This imbalance not only diminishes models’ accuracy and generalization but also tends to favor high precision at the expense of low recall. To address this issue algorithmically, experiments were conducted to refocus the model on segmenting challenging samples by rebalancing the class distribution. We evaluated multiple common binary loss functions in the segmentation field, including Tversky loss, binary cross-entropy loss (BCE loss), Dice loss [25], and focal loss [26], on the LiTS dataset. The goal was to identify a loss function that was well-suited to our segmentation task and illustrate how it could alleviate the impact of imbalanced sample distribution on model performance, showcasing its superiority in enhancing model effectiveness compared to other loss functions.
The results are presented in Table 1. When the model employed Tversky loss, it achieved the best performance in Dice, Recall, and VOE, with scores of 0.9433, 0.9451, and 0.1053, respectively. In the case of BCE loss, the RVD exhibited the most favorable effect at 0.0189. However, when focal loss was utilized, the model’s accuracy reached its highest point at 0.9662, but this came at the cost of a noticeable trade-off between precision and recall, resulting in a pronounced impact on class distribution. In comparison to the other three sets of loss functions, Tversky loss stood out with the most substantial optimization effect on model performance and a superior ability to balance positive and negative samples within the dataset. The gap between precision and recall steadily narrowed as both metrics improved, so this was selected as the experimental loss function.

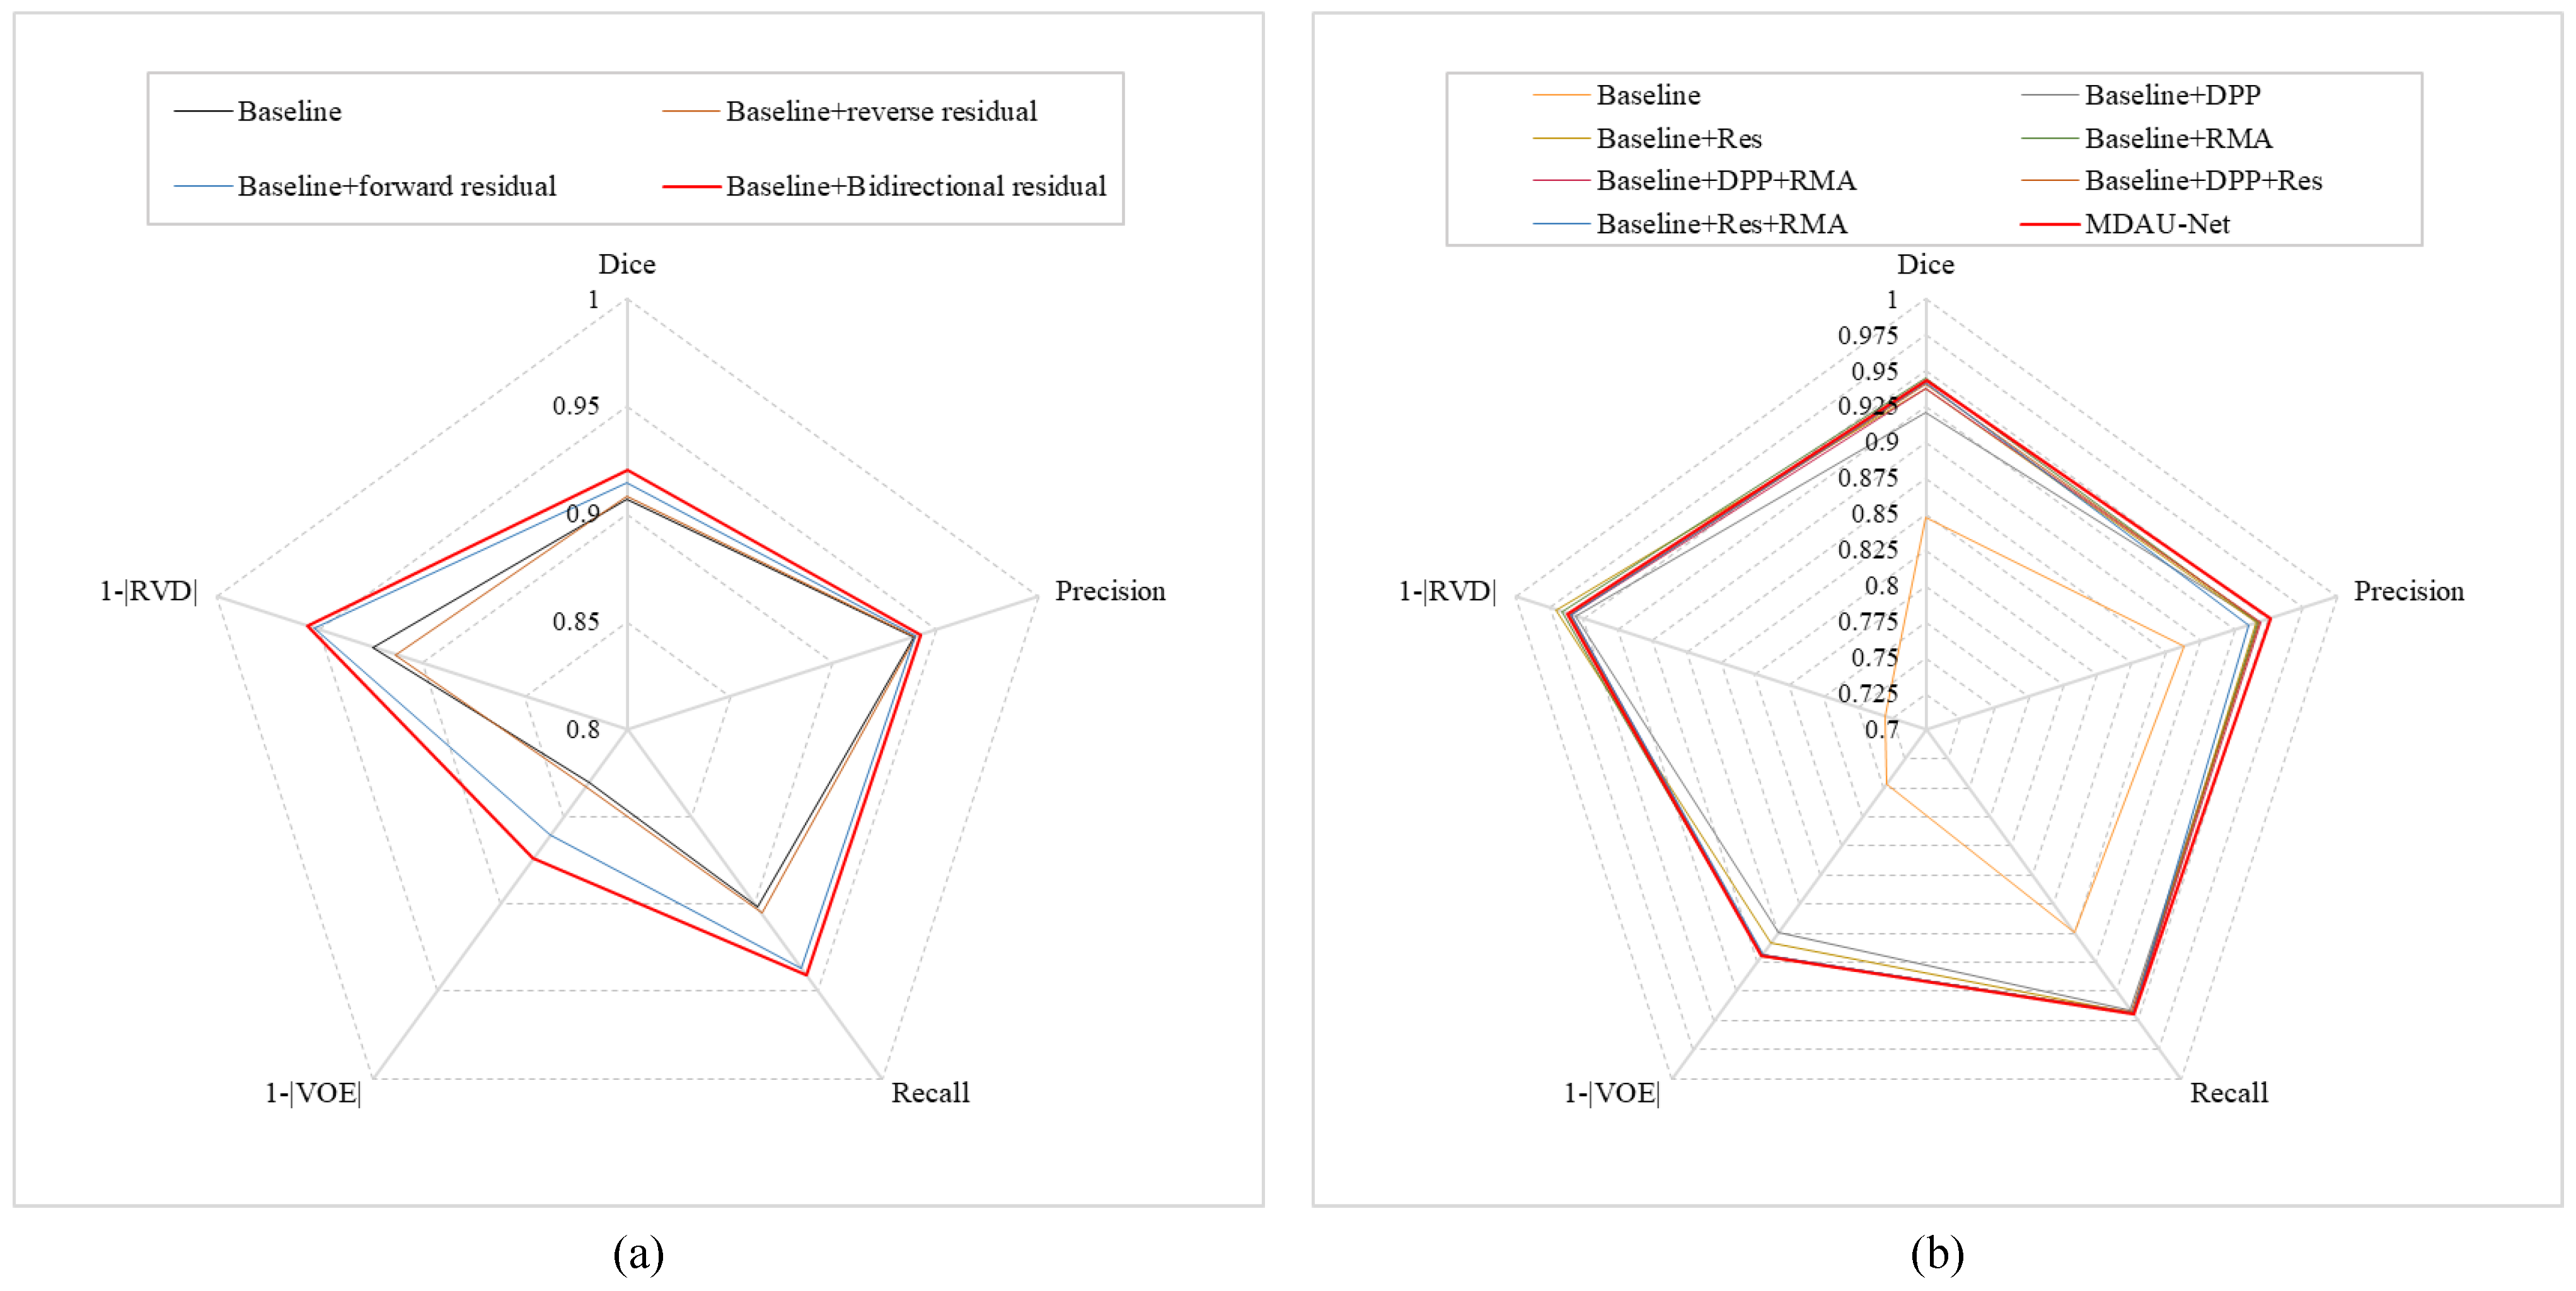
4.3. Validity Experiment of Cross-Level Information Interaction

In MDAU-Net, the cross-level information interaction mechanism, based on bidirectional residual connections, is frequently utilized in conjunction with the double-flow linear pooling enhancement unit. To demonstrate its effectiveness, we used U-Net with DLE as the baseline and assessed the segmentation performance by sequentially introducing residual pathways. We categorized the experiments into four groups. The first group served as the baseline, while the second and third groups were comparative experiments involving the addition of reverse and forward residual connections, respectively. The fourth group combined both forward and reverse residual connections. Table 2 displays the segmentation results for each group. Notably, performance was weakest when no residual connections were added. However, the introduction of either forward or reverse residuals led to varying degrees of performance improvement, with forward residuals demonstrating a more substantial positive impact on the network than reverse residuals. When both sets of residual connections were simultaneously incorporated, all evaluation metrics surpassed those of the first three groups. Compared to the baseline experiments, improvements of 0.0137, 0.0032, 0.0389, 0.0432, and 0.0313 were observed. Figure 8a presents the radar chart for this experiment, where the addition of two sets of residuals resulted in the largest coverage area on the coordinate axes, confirming that the cross-level information interaction mechanism based on bidirectional residual connections effectively mitigated knowledge forgetting issues and enhanced the network’s learning capabilities.

4.4. Ablation Results

To evaluate the effectiveness of various modules, we designed eight ablation experiments using the LiTS dataset. We chose U-Net with CII as the baseline to conduct the experiments. The first set was the baseline experiment. Sets 2 through 4 involved adding DLE, ResBlock, and CAE, respectively, on the basis of Experiment 1, which we used to verify the effect of each module on the baseline. Sets 5 to 7 added different combinations of modules onto the baseline to explore the dependencies among them. To verify the performance of the proposed method (MDAU-Net), set 8 added all modules to the first set to conduct training.
The results of the ablation experiments are displayed in Table 3 and Figure 8b. As depicted in Table 3, in the third set of experiments, the RVD attained a value of 0.0293, demonstrating that the inclusion of the residual encoder effectively preserved shallow features, thereby enhancing accuracy in organ boundary contour segmentation. In the fourth set of experiments, the Dice coefficient reached a value of 0.9447, indicating that valuable information was efficiently multiplexed within the cascaded adaptive feature extraction unit (CAE), resulting in increased similarity between the segmentation results and the ground truth. The results from other experimental sets showed that the addition of the ResBlock, CAE module, and DLE module each had a distinct positive impact on performance. Additionally, the radar plot in Figure 8b illustrates that MDAU-Net (red contour) achieved comparable Dice and RVD values while exhibiting superior accuracy, recall, and reduced error between predictions and ground truth.

5. Discussion

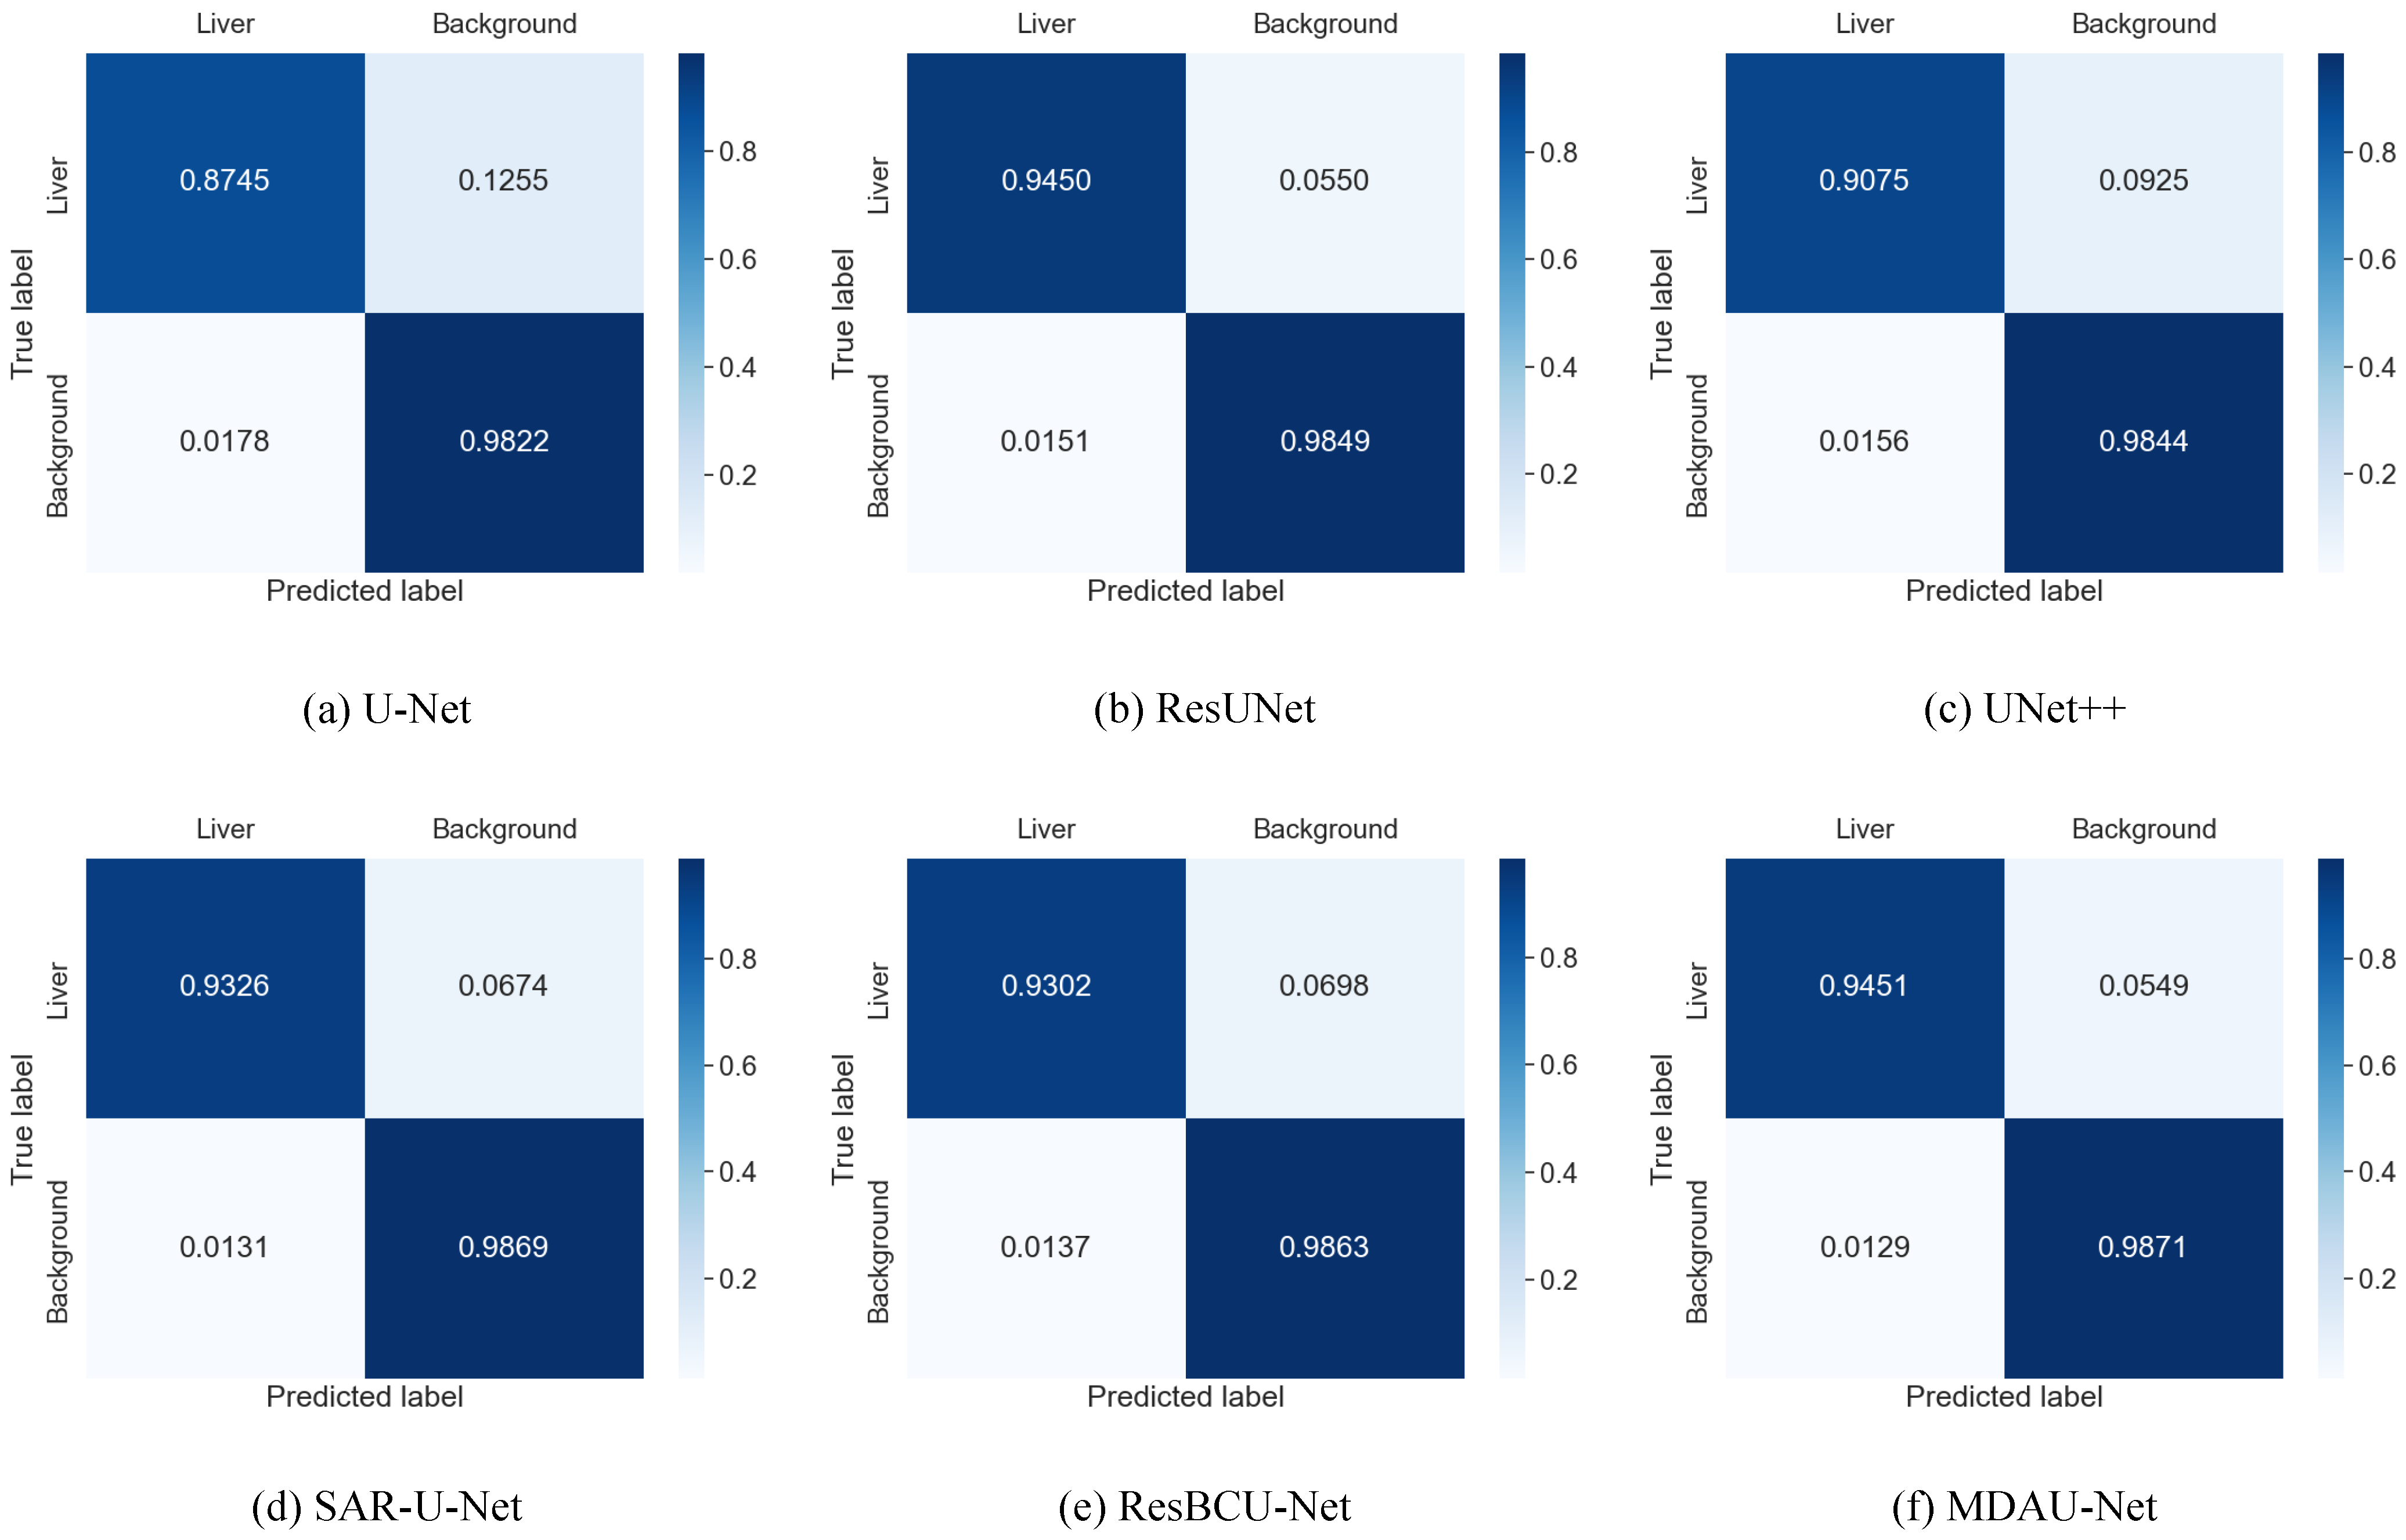
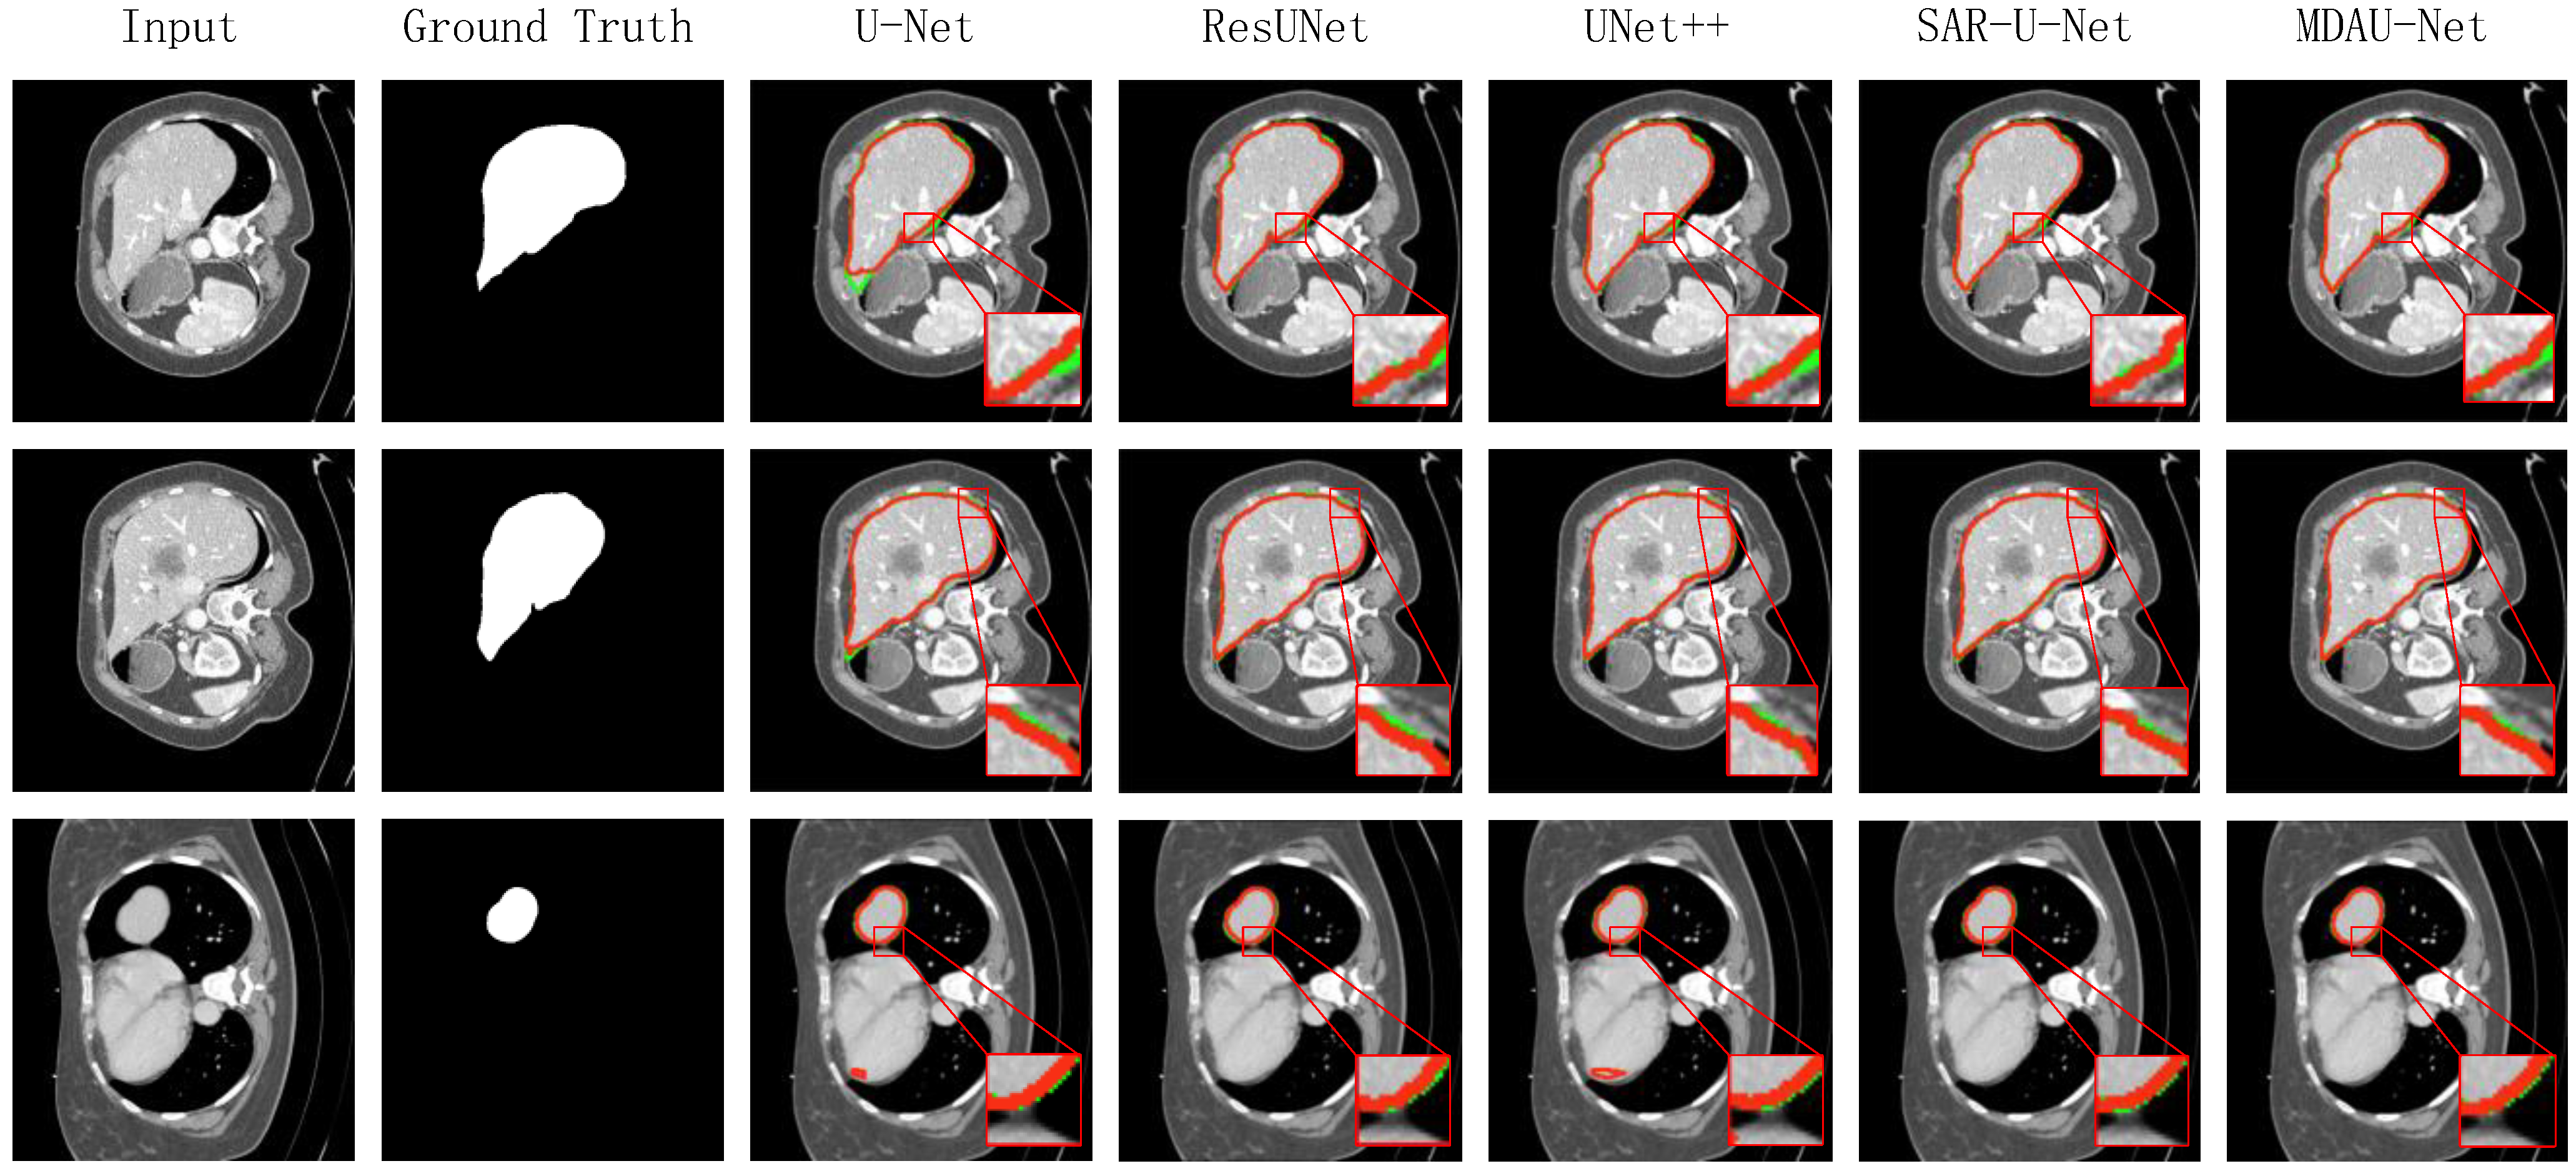
5.1. Quantitative Analysis of Liver Segmentation

To verify the effectiveness of MDAU-Net, we tested the method on the LiTS and SLiver07 datasets and compared it with other widely used segmentation methods.
Quantitative Analysis of Liver Segmentation on LiTS. The results of the liver segmentation on the LiTS dataset are shown in Table 4. The Dice, Precision, Recall, VOE, and RVD of MDAU-Net were 0.9433, 0.9515, 0.9451, 0.1053, and 0.0383, which were increased by 0.0952, 0.0636, 0.0706, 0.1483, and 0.2159, respectively, compared with the baseline U-Net values. Meanwhile, MDAU-Net had a significantly better balance between accuracy and recall, and the performance was outstanding in liver organ segmentation when compared to previous networks. Figure 9a shows the radar plots of the quantitative analysis of different models using LiTS. The red line represents MDAU-Net, which has the largest area covered by metrics on the axes, so that it can be more intuitively observed that its performance was better than the other comparison models.
Figure 10 displays the visualized results of the liver segmentation comparison test in this section. In these figures, the green lines represent the actual labels of the CT images, while the red lines indicate the prediction results. Additionally, we zoomed in on specific areas for easier observation. It can be inferred that due to the relatively simple structure of the jump connection between ResUNet and SAR-U-Net codecs, there was ineffective fusion of deep and shallow features, resulting in less precise image detail processing and a noticeable loss of edge information. Moreover, U-Net and UNet++ exhibited a limited utilization of a priori knowledge, such as shallow features, leading to difficulties in distinguishing between similar tissues and more prominent instances of mis-segmentation, where background organs were mistakenly segmented as the liver. In contrast, the visual segmentation results of MDAU-Net displayed the most complete segmentation and label curves, effectively fitting both continuous and truncated regions, with no significant instances of mis-segmentation or over-segmentation in detail processing.
To provide further insights into the test results of each model on the LiTS dataset and to assess the distinctions between the predictions of different models and the ground-truth labels, we utilized the confusion matrix. The results are presented in Figure 11, revealing that U-Net, U-Net++, and ResUNet exhibited difficulties in accurately recognizing the liver region, often misclassifying it as background. In contrast, MDAU-Net demonstrated a more balanced discrimination between the liver and background compared to other methods, with an extremely low probability of mis-segmentation and superior overall segmentation quality.
Quantitative Analysis of Liver Segmentation on SLiver07. We opted to retrain MDAU-Net using the SLiver07 dataset to further assess its model performance. The experimental outcomes are detailed in Table 5, while Figure 9b presents corresponding radar plots of the experimental data. As indicated in the table, MDAU-Net achieved evaluation scores of 0.9706, 0.9743, 0.9757, 0.0569, and −0.0095 for various metrics. These scores represent improvements of 0.1138, 0.0137, 0.0169, 0.0932, and 0.1524 compared to the baseline U-Net, and they surpassed the performance of other methods to varying degrees. In the radar plot, MDAU-Net is depicted by a red outline, clearly demonstrating that it covers a wider area, indicative of its overall superiority compared to other examined methods.
The visualized segmentation results for this set of experiments are presented in Figure 12. In these figures, the green lines represent the true labels, while the red lines depict the predicted results. To highlight the differences in segmentation outcomes, we magnified specific local areas. It is evident that U-Net and UNet++ exhibited more pronounced instances of mis-segmentation in the liver slices, with significant disparities between the segmentation results and the real labels in other slices. While ResUNet and SAR-U-Net produced improved segmentation results in the liver region compared to the former two methods, they still missed some detailed information in challenging segmentation areas. Conversely, MDAU-Net demonstrated the most complete overlap between the segmentation curves and the real labels, while also processing details such as the liver contour edge more comprehensively. This resulted in improved segmentation outcomes for liver slices of varying shapes and sizes compared to other methods.
Figure 13 presents the confusion matrix illustrating the segmentation results of each model on the SLiver07 dataset. It is evident that MDAU-Net exhibited a more balanced segmentation ability for both the liver and background regions, achieving superior segmentation results compared to other methods.

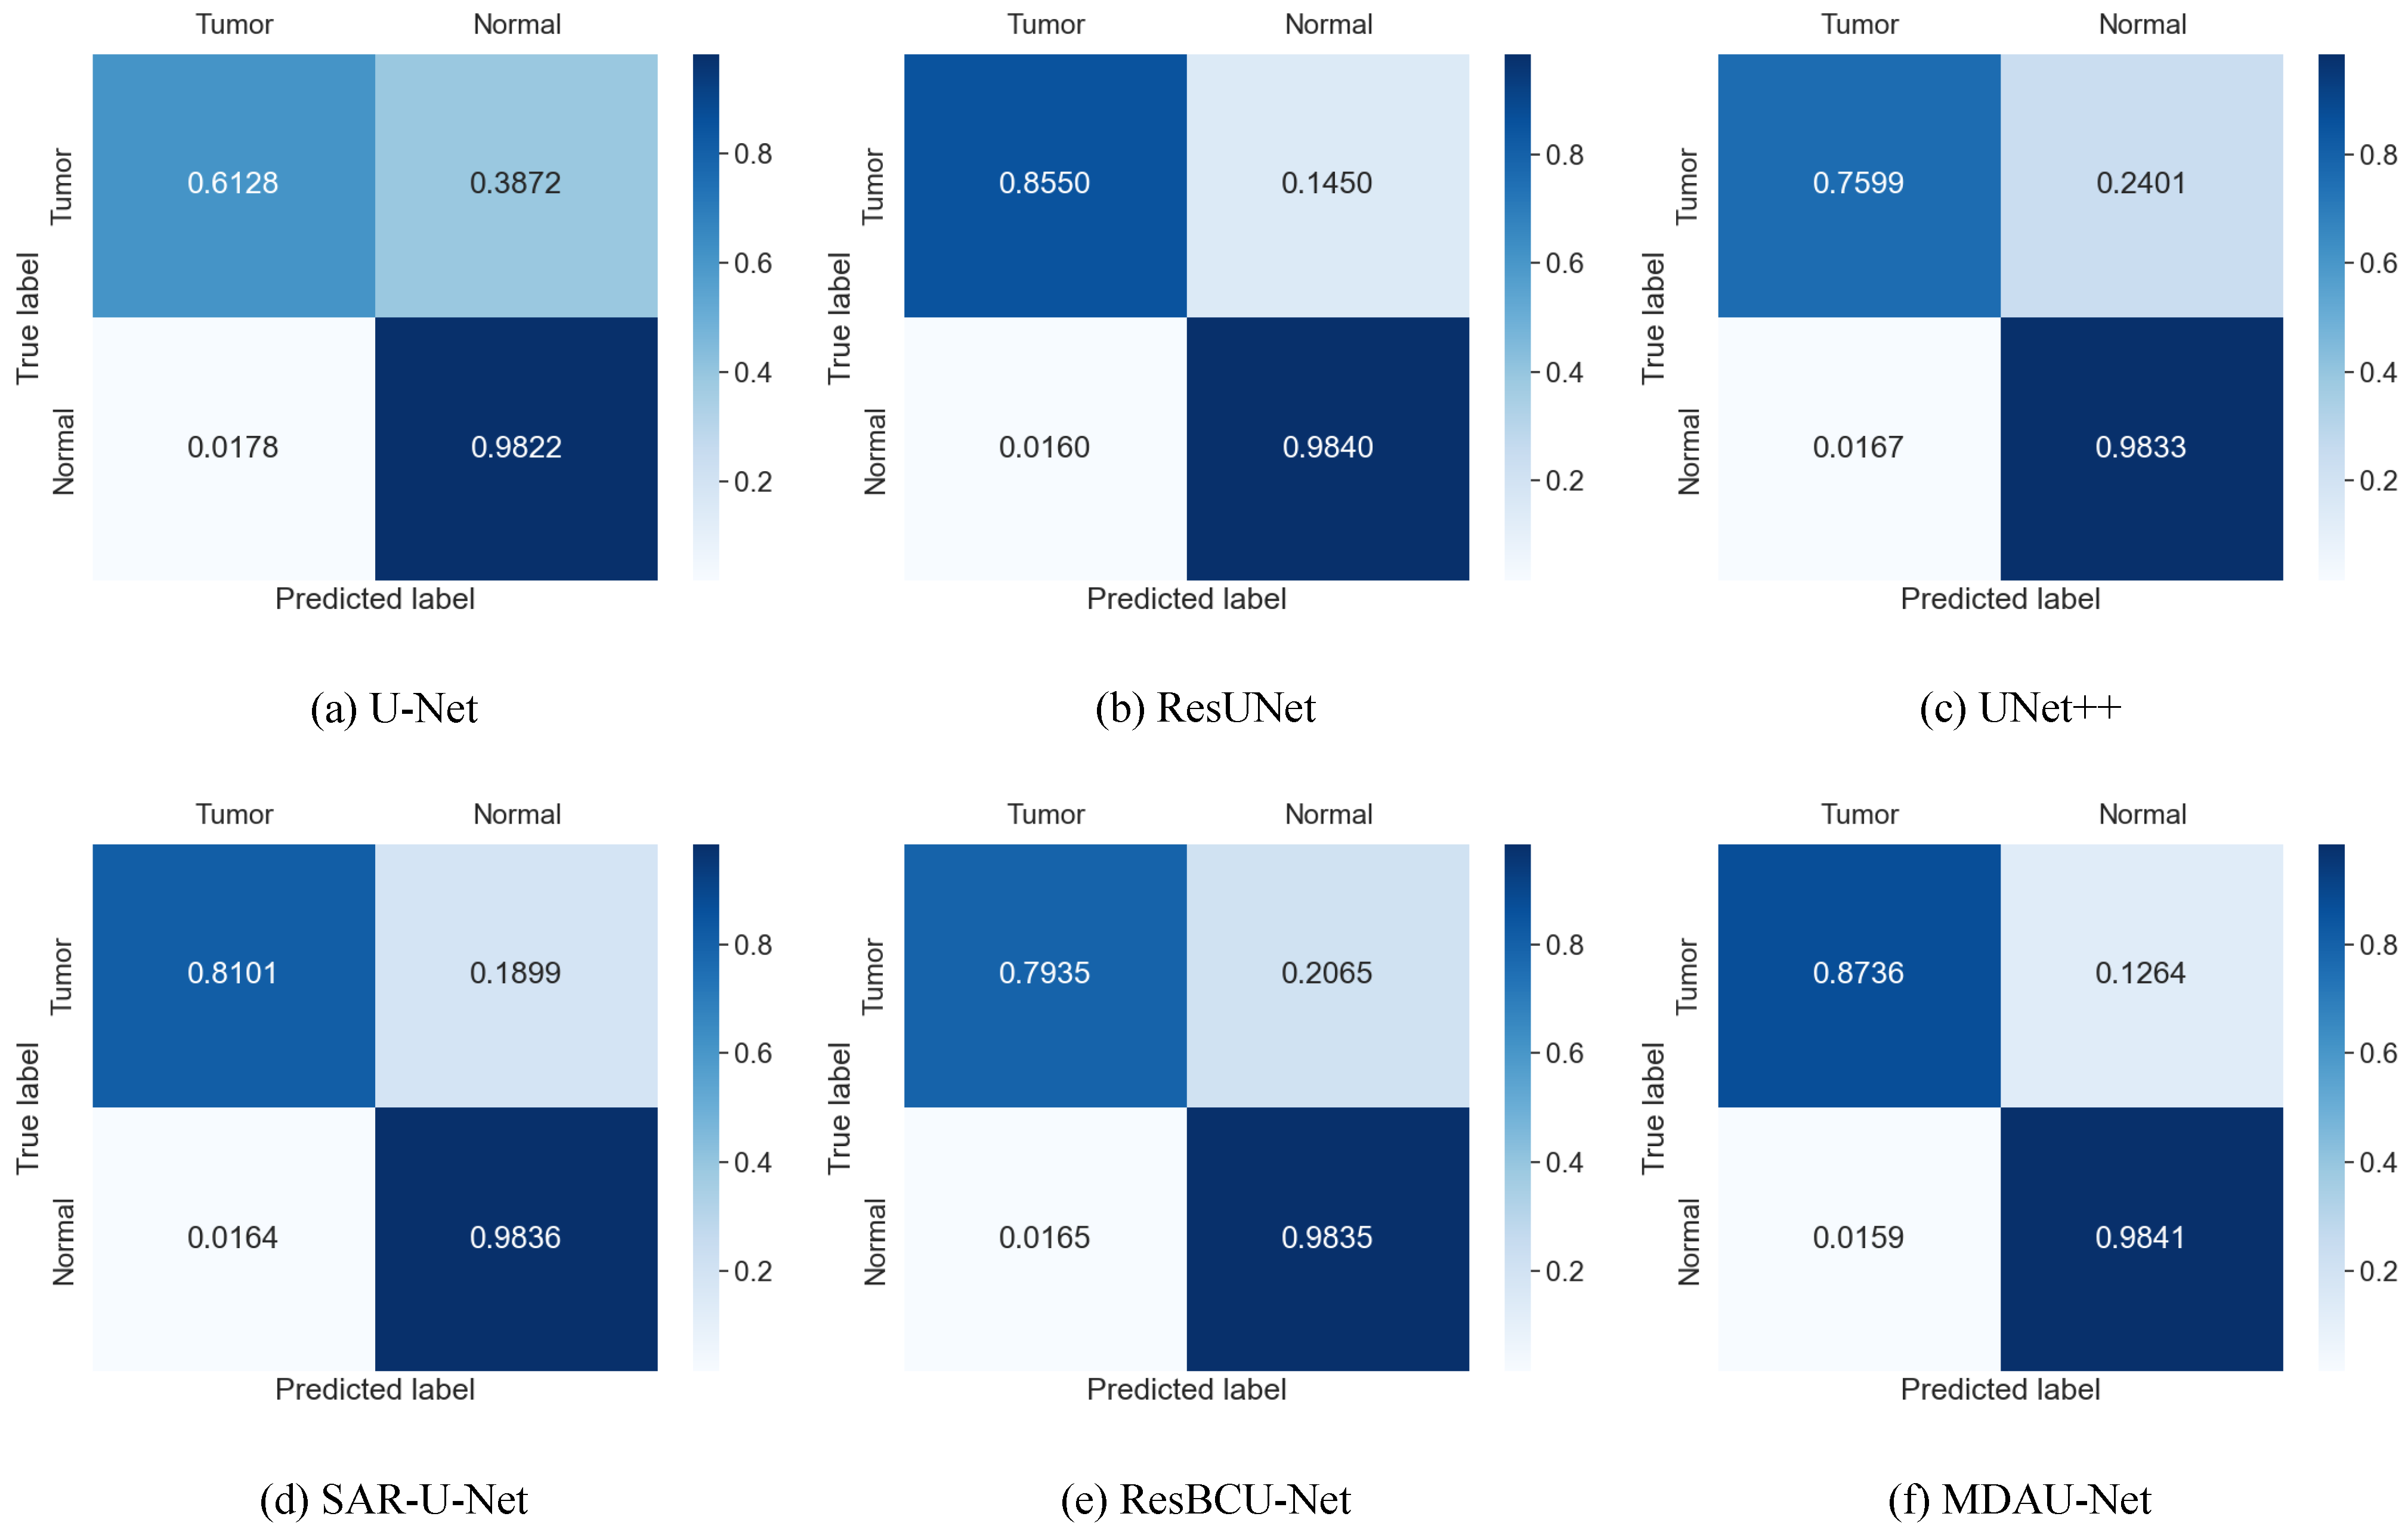
5.2. Quantitative Analysis of Liver Tumor Segmentation

On the LiTS dataset, we conducted a further comparison of MDAU-Net’s performance in tumor segmentation tasks with other methods, and the results are presented in Table 6. When combined with the radar plot depicted in Figure 14, it is evident that MDAU-Net outperformed other methods in terms of Dice, VOE, and RVD, achieving values of 0.8387, 0.2699, and −0.0743, respectively. These values were 0.213, 0.1898, and 0.1929 higher than those obtained with UNet, indicating an overall superior segmentation performance compared to the other methods.
The visualization of the tumor segmentation results is presented in Figure 15. It is apparent that UNet and UNet++ exhibited insufficient segmentation and diagnostic errors when dealing with lesions characterized by blurred boundaries and small sizes. On the other hand, ResUNet and SAR-U-Net faced challenges in distinguishing between similar tissues, leading to suboptimal segmentation results. In contrast, MDAU-Net excelled in effectively localizing lesion tissues and accurately segmenting border regions, particularly for non-contiguous and small-sized lesions, demonstrating significantly improved performance. This underscores the effectiveness of the proposed method in addressing the issue of useful information loss, reducing the semantic gap between different pathways and achieving segmentation results with clear boundaries between lesion regions and normal tissues. Consequently, the proposed method holds substantial clinical value.
The confusion matrix illustrating the results of liver tumor segmentation on the LiTS dataset is displayed in Figure 16. Overall, all of these models demonstrated a high level of segmentation accuracy for non-diseased regions. In contrast, the segmentation results obtained by MDAU-Net were notably superior, with only a very small number of samples misclassified as non-diseased regions. Consequently, the likelihood of false-negative segmentation results is minimal, leading to more balanced segmentation outcomes.

6. Conclusions

Owing to the exceptional achievements of U-Net in medical image processing, it has gained widespread adoption in liver and liver tumor segmentation tasks. Nonetheless, its straightforward network architecture hinders the comprehensive utilization of valuable features, leading to reduced feature mobility within the network. Moreover, the presence of a semantic gap impedes the effective fusion of shallow and deep features, consequently impacting the segmentation performance.
To address these issues, we proposed MDAU-Net, a novel segmentation network. MDAU-Net introduces a double-flow linear pooling enhancement unit within the jump connection segment, effectively narrowing the semantic divide and facilitating the fusion of shallow and deep features at each layer. Additionally, it incorporates a cascaded adaptive feature extraction unit as a bottleneck layer, which combines attention mechanisms with dense connectivity to enhance the network’s capacity for exploring deep semantic information and improving feature mobility. Furthermore, a cross-level information interaction mechanism, based on bidirectional residuals, was introduced in the jump connection to mitigate the problem of a priori knowledge loss during training. Finally, we redesigned the encoder to incorporate the residual structure, not only enhancing the network’s ability to retain and extract original features but also mitigating the gradient vanishing problem. Through experiments conducted on the LiTS and Sliver07 datasets, we confirmed that MDAU-Net consistently delivered outstanding performance across various datasets. It excelled not only in accurately segmenting the target region but also in handling intricate details such as edges with remarkable precision, demonstrating strong generalization capabilities.

Author Contributions

J.M., M.X., Z.M. and Z.J. designed the experiments. M.X. conducted the experiments, interpreted the data, and drafted the manuscript. J.M. and Z.M. provided professional suggestions. All authors have read and agreed to the published version of the manuscript.

Funding

This research was funded by the Natural Science Foundation of Ningxia (Nos. 2023AAC03264, 2022AAC03268); Basic Scientific Research in the Central Universities of North Minzu University (Nos. 2021KJCX09, FWNX21); Graduate Innovation Project of North Minzu University (YCX23148), and Image and Intelligent Information Processing Innovation Team of the National Ethnic Affairs Commission.

Institutional Review Board Statement

Not applicable.

Informed Consent Statement

Not applicable.

Data Availability Statement

The datasets analyzed during the current study are available in the LiTS and Sliver07 repositories: https://competitions.codalab.org; www.sliver07.org (accessed on 13 June 2023).

Conflicts of Interest

The authors declare no conflict of interest.

References

  1. Hinton, G.E.; Osindero, S.; Teh, Y.W. A fast learning algorithm for deep belief nets. Neural Comput. 2006, 18, 1527–1554. [Google Scholar] [CrossRef] [PubMed]
  2. Ronneberger, O.; Fischer, P.; Brox, T. U-net: Convolutional networks for biomedical image segmentation. In Medical Image Computing and Computer-Assisted Intervention–MICCAI 2015: 18th International Conference, Munich, Germany, 5–9 October 2015, Proceedings, Part III 18; Springer: Cham, Switzerland, 2015; pp. 234–241. [Google Scholar]
  3. Dickson, J.; Lincely, A.; Nineta, A. A Dual Channel Multiscale Convolution U-Net Methodfor Liver Tumor Segmentation from Abdomen CT Images. In Proceedings of the 2022 International Conference on Sustainable Computing and Data Communication Systems (ICSCDS), Erode, India, 7–9 April 2022; pp. 1624–1628. [Google Scholar]
  4. Sabir, M.W.; Khan, Z.; Saad, N.M.; Khan, D.M.; Al-Khasawneh, M.A.; Perveen, K.; Qayyum, A.; Azhar Ali, S.S. Segmentation of Liver Tumor in CT Scan Using ResU-Net. Appl. Sci. 2022, 12, 8650. [Google Scholar]
  5. Deng, Y.; Hou, Y.; Yan, J.; Zeng, D. ELU-net: An efficient and lightweight U-net for medical image segmentation. IEEE Access 2022, 10, 35932–35941. [Google Scholar]
  6. Seong, W.; Kim, J.H.; Kim, E.J.; Park, J.W. Segmentation of abnormal liver using adaptive threshold in abdominal CT images. In Proceedings of the IEEE Nuclear Science Symposuim & Medical Imaging Conference, Knoxville, TN, USA, 30 October–6 November 2010; pp. 2372–2375. [Google Scholar]
  7. Chen, Y.; Wang, Z.; Zhao, W.; Yang, X. Liver segmentation from CT images based on region growing method. In Proceedings of the 2009 3rd International Conference on Bioinformatics and Biomedical Engineering, Beijing, China, 11–13 June 2009; pp. 1–4. [Google Scholar]
  8. Gambino, O.; Vitabile, S.; Re, G.L.; La Tona, G.; Librizzi, S.; Pirrone, R.; Ardizzone, E.; Midiri, M. Automatic volumetric liver segmentation using texture based region growing. In Proceedings of the 2010 International Conference on Complex, Intelligent and Software Intensive Systems, Krakow, Poland, 15–18 February 2010; pp. 146–152. [Google Scholar]
  9. Okada, T.; Shimada, R.; Hori, M.; Nakamoto, M.; Chen, Y.W.; Nakamura, H.; Sato, Y. Automated segmentation of the liver from 3D CT images using probabilistic atlas and multilevel statistical shape model. Acad. Radiol. 2008, 15, 1390–1403. [Google Scholar] [CrossRef] [PubMed]
  10. Zhou, Z.; Rahman Siddiquee, M.M.; Tajbakhsh, N.; Liang, J. Unet++: A nested u-net architecture for medical image segmentation. In Deep Learning in Medical Image Analysis and Multimodal Learning for Clinical Decision Support: 4th International Workshop, DLMIA 2018, and 8th International Workshop, ML-CDS 2018, Held in Conjunction with MICCAI 2018, Granada, Spain, 20 September 2018, Proceedings 4; Springer: Cham, Switzerland, 2018; pp. 3–11. [Google Scholar]
  11. Huang, H.; Lin, L.; Tong, R.; Hu, H.; Zhang, Q.; Iwamoto, Y.; Han, X.; Chen, Y.W.; Wu, J. Unet 3+: A full-scale connected unet for medical image segmentation. In Proceedings of the ICASSP 2020-2020 IEEE International Conference on Acoustics, Speech and Signal Processing (ICASSP), Barcelona, Spain, 4–8 May 2020; pp. 1055–1059. [Google Scholar]
  12. Bi, R.; Ji, C.; Yang, Z.; Qiao, M.; Lv, P.; Wang, H. Residual based attention-Unet combing DAC and RMP modules for automatic liver tumor segmentation in CT. Math. Biosci. Eng. 2022, 19, 4703–4718. [Google Scholar] [PubMed]
  13. Kushnure, D.T.; Talbar, S.N. HFRU-Net: High-level feature fusion and recalibration unet for automatic liver and tumor segmentation in CT images. Comput. Methods Programs Biomed. 2022, 213, 106501. [Google Scholar]
  14. Zhou, Y.; Kong, Q.; Zhu, Y.; Su, Z. MCFA-UNet: Multiscale cascaded feature attention U-Net for liver segmentation. IRBM 2023, 44, 100789. [Google Scholar] [CrossRef]
  15. Chen, L.C.; Zhu, Y.; Papandreou, G.; Schroff, F.; Adam, H. Encoder-decoder with atrous separable convolution for semantic image segmentation. In Proceedings of the European Conference on Computer Vision (ECCV), Munich, Germany, 8–14 September 2018; pp. 801–818. [Google Scholar]
  16. Meng, T.; Ghiasi, G.; Mahjorian, R.; Le, Q.V.; Tan, M. Revisiting Multi-Scale Feature Fusion for Semantic Segmentation. arXiv 2022, arXiv:2203.12683. [Google Scholar]
  17. Zhang, D.; Zhang, H.; Tang, J.; Wang, M.; Hua, X.; Sun, Q. Feature pyramid transformer. In Computer Vision–ECCV 2020: 16th European Conference, Glasgow, UK, 23–28 August 2020, Proceedings, Part XXVIII 16; Springer: Cham, Switzerland, 2020; pp. 323–339. [Google Scholar]
  18. Chen, L.C.; Papandreou, G.; Schroff, F.; Adam, H. Rethinking atrous convolution for semantic image segmentation. arXiv 2017, arXiv:1706.05587. [Google Scholar]
  19. Hu, J.; Shen, L.; Sun, G. Squeeze-and-excitation networks. In Proceedings of the IEEE Conference on Computer Vision and Pattern Recognition, Salt Lake City, UT, USA, 18–22 June 2018; pp. 7132–7141. [Google Scholar]
  20. Woo, S.; Park, J.; Lee, J.Y.; Kweon, I.S. Cbam: Convolutional block attention module. In Proceedings of the European Conference on Computer Vision (ECCV), Munich, Germany, 8–14 September 2018; pp. 3–19. [Google Scholar]
  21. Vaswani, A.; Shazeer, N.; Parmar, N.; Uszkoreit, J.; Jones, L.; Gomez, A.N.; Kaiser, Ł.; Polosukhin, I. Attention is all you need. arXiv 2017, arXiv:1706.03762. [Google Scholar]
  22. He, K.; Zhang, X.; Ren, S.; Sun, J. Deep residual learning for image recognition. In Proceedings of the IEEE Conference on Computer Vision and Pattern Recognition, Las Vegas, NV, USA, 27–30 June 2016; pp. 770–778. [Google Scholar]
  23. Huang, G.; Liu, Z.; Van Der Maaten, L.; Weinberger, K.Q. Densely connected convolutional networks. In Proceedings of the IEEE Conference on Computer Vision and Pattern Recognition, Honolulu, HI, USA, 21–26 July 2017; pp. 4700–4708. [Google Scholar]
  24. Salehi, S.S.M.; Erdogmus, D.; Gholipour, A. Tversky loss function for image segmentation using 3D fully convolutional deep networks. In Machine Learning in Medical Imaging: 8th International Workshop, MLMI 2017, Held in Conjunction with MICCAI 2017, Quebec City, QC, Canada, 10 September 2017, Proceedings 8; Springer: Cham, Switzerland, 2017; pp. 379–387. [Google Scholar]
  25. Milletari, F.; Navab, N.; Ahmadi, S.A. V-net: Fully convolutional neural networks for volumetric medical image segmentation. In Proceedings of the 2016 fourth international conference on 3D vision (3DV), Stanford, CA, USA, 25–28 October 2016; pp. 565–571. [Google Scholar]
  26. Lin, T.Y.; Goyal, P.; Girshick, R.; He, K.; Dollár, P. Focal loss for dense object detection. In Proceedings of theIEEE International Conference on Computer Vision, Venice, Italy, 22–29 October 2017; pp. 2980–2988. [Google Scholar]
  27. Alom, M.Z.; Hasan, M.; Yakopcic, C.; Taha, T.M.; Asari, V.K. Recurrent residual convolutional neural network based on u-net (r2u-net) for medical image segmentation. arXiv 2018, arXiv:1802.06955. [Google Scholar]
  28. Xiao, X.; Lian, S.; Luo, Z.; Li, S. Weighted res-unet for high-quality retina vessel segmentation. In Proceedings of the 2018 9th International Conference on Information Technology in Medicine and Education (ITME), Hangzhou, China, 19–21 October 2018; pp. 327–331. [Google Scholar]
  29. Oktay, O.; Schlemper, J.; Folgoc, L.L.; Lee, M.; Heinrich, M.; Misawa, K.; Mori, K.; McDonagh, S.; Hammerla, N.Y.; Kainz, B.; et al. Attention u-net: Learning where to look for the pancreas. arXiv 2018, arXiv:1804.03999. [Google Scholar]
  30. Wang, J.; Lv, P.; Wang, H.; Shi, C. SAR-U-Net: Squeeze-and-excitation block and atrous spatial pyramid pooling based residual U-Net for automatic liver segmentation in Computed Tomography. Comput. Methods Programs Biomed. 2021, 208, 106268. [Google Scholar] [CrossRef]
  31. Badshah, N.; Ahmad, A. ResBCU-net: Deep learning approach for segmentation of skin images. Biomed. Signal Process. Control 2022, 71, 103137. [Google Scholar] [CrossRef]
  32. Khan, R.A.; Luo, Y.; Wu, F.X. RMS-UNet: Residual multi-scale UNet for liver and lesion segmentation. Artif. Intell. Med. 2022, 124, 102231. [Google Scholar] [CrossRef]
  33. Ge, R.; Cai, H.; Yuan, X.; Qin, F.; Huang, Y.; Wang, P.; Lyu, L. MD-UNET: Multi-input dilated U-shape neural network for segmentation of bladder cancer. Comput. Biol. Chem. 2021, 93, 107510. [Google Scholar] [CrossRef]
Figure 1. The structure of atrous spatial pyramid pooling.
Applsci 13 10443 g001
Figure 2. The structure of multi-head attention and scaled dot-product attention.
Applsci 13 10443 g002
Figure 3. The structure of MDAU-Net.
Applsci 13 10443 g003
Figure 4. The structure of the cascaded adaptive feature extraction unit (CAE).
Applsci 13 10443 g004
Figure 5. The structure of the double-flow linear pooling enhancement unit (DLE).
Applsci 13 10443 g005
Figure 6. The structure of the cross-level information interaction mechanism (CII).
Applsci 13 10443 g006
Figure 7. Comparison before and after data preprocessing.
Applsci 13 10443 g007
Figure 8. This image shows the radar chart results from the validity experiment in Section 4.3 and the ablation experiment in Section 4.4: (a) radar chart of validity experiments, (b) radar chart of ablation experiments.
Applsci 13 10443 g008
Figure 9. This image shows the radar chart results from the liver segmentation in Section 5.1 on LiTS/Sliver07: (a) radar chart from LiTS, (b) radar chart from Sliver07.
Applsci 13 10443 g009
Figure 10. Visualization of results of liver segmentation using different methods on LiTS.
Applsci 13 10443 g010
Figure 11. Confusion matrix from liver segmentation in Section 5.1 on LiTS.
Applsci 13 10443 g011
Figure 12. Visualization of results of liver segmentation using different methods on SLiver07.
Applsci 13 10443 g012
Figure 13. Confusion matrix from liver segmentation in Section 5.1 on SLiver07.
Applsci 13 10443 g013
Figure 14. This image shows the radar chart results from liver tumor segmentation in Section 5.2 on LiTS.
Applsci 13 10443 g014
Figure 15. Visualization of results of liver tumor segmentation using different methods on LiTS.
Applsci 13 10443 g015
Figure 16. Confusion matrix from liver tumor segmentation in Section 5.2 on LiTS.
Applsci 13 10443 g016
Table 1. Loss function comparison test on LiTS.
LossDicePrecisionRecallVOERVD
Dice loss0.94200.94900.93930.10760.0205
Focal loss0.90440.96620.91160.17450.1872
Tversky loss0.94330.95150.94510.10530.0383
BCE loss0.93280.94860.93960.12390.0189
Bold text in the table represents the optimal results.
Table 2. The performance of validity experiments on the LiTS dataset.
MethodDicePrecisionRecallVOERVD
Baseline0.90670.93920.90190.16940.0759
Baseline + reverse residual0.90800.93990.90540.16740.0872
Baseline + forward residual0.91450.94030.93660.13980.0478
Baseline + bidirectional residual0.92040.94240.94080.12620.0446
Bold text in the table represents the optimal results.
Table 3. The performance of ablation experiments on LiTS.
MethodDicePrecisionRecallVOERVD
Baseline0.84810.88790.87450.25360.2698
Baseline + DLE0.92040.94240.94080.12620.0446
Baseline + ResBlock0.93750.94090.94370.11610.0293
Baseline + CAE0.94470.94220.94450.10640.0339
Baseline + DLE + CAE0.93710.94370.94360.10620.0412
Baseline + DAE + ResBlock0.94070.94250.94310.10560.0395
Baseline + ResBlock + CAE0.94190.93540.94430.10700.0407
MDAU-Net0.94330.95150.94510.10530.0383
Bold text in the table represents the optimal results.
Table 4. Liver semantic segmentation results of different models on LiTS.
MethodDicePrecisionRecallVOERVD
U-Net0.84810.88790.87450.25360.2698
RU-Net [27]0.86140.89020.88070.24150.2501
ResUNet [28]0.92200.92630.94500.14270.0599
Attention U-net [29]0.91970.91890.92360.14630.0575
UNet++ [10]0.91060.91730.90750.15910.0818
SAR-U-Net [30]0.93780.95040.93260.11420.0736
ResBCU-Net [31]0.93590.94280.93020.18100.0587
RMS-UNet [32]0.91710.92270.91570.14920.0646
MD-UNET [33]0.93380.94330.93310.12240.0604
MDAU-Net (our model)0.94330.95150.94510.10530.0383
Bold text in the table represents the optimal results.
Table 5. Liver semantic segmentation results for different models on SLiver07.
MethodDicePrecisionRecallVOERVD
U-Net0.85680.96060.95880.15010.1619
RU-Net [27]0.90320.96170.95460.10120.0523
ResUNet [28]0.96970.96930.97400.05910.0184
Attention U-net [29]0.96170.95010.97490.0733−0.0254
UNet++ [10]0.97030.96960.95150.0574−0.0117
SAR-U-Net [30]0.96550.96720.97460.0664−0.0184
ResBCU-Net [31]0.96580.96470.97230.0610−0.0229
RMS-UNet [32]0.96730.96010.97550.0591−0.0238
MD-UNET [33]0.96790.97320.97460.0601−0.0162
MDAU-Net (our model)0.97060.97430.97570.0569−0.0095
Bold text in the table represents the optimal results.
Table 6. Tumor segmentation results of different models on LiTS.
MethodDicePrecisionRecallVOERVD
U-Net0.62570.60130.61280.4597−0.2672
RU-Net [27]0.65280.62330.66570.3926−0.2519
ResUNet [28]0.82540.80270.85500.2874−0.0798
Attention U-net [29]0.66830.66200.68070.3819−0.0818
UNet++ [10]0.73970.93400.75990.3995−0.1930
SAR-U-Net [30]0.80960.83170.81010.3495−0.0770
ResBCU-Net [31]0.68180.62430.79350.4588−0.2278
RMS-UNet [32]0.67120.62580.78290.4031−0.2517
MD-UNET [33]0.78380.72890.85930.3447−0.1596
MDAU-Net (our model)0.83870.82110.87360.2699−0.0743
Bold text in the table represents the optimal results.
Disclaimer/Publisher’s Note: The statements, opinions and data contained in all publications are solely those of the individual author(s) and contributor(s) and not of MDPI and/or the editor(s). MDPI and/or the editor(s) disclaim responsibility for any injury to people or property resulting from any ideas, methods, instructions or products referred to in the content.

