Article

Design and Analysis of a Stable Support Structure for a Near-Infrared Space-Borne Doppler Asymmetric Spatial Heterodyne Interferometer

1
Xi’an Institute of Optics and Precision Mechanics, Chinese Academy of Sciences, Xi’an 710119, China
2
University of Chinese Academy of Sciences, Beijing 100049, China
*
Authors to whom correspondence should be addressed.
Appl. Sci. 2023, 13(18), 10446; https://doi.org/10.3390/app131810446
Submission received: 30 March 2023 / Revised: 11 September 2023 / Accepted: 18 September 2023 / Published: 19 September 2023
(This article belongs to the Section Mechanical Engineering)

Abstract

:
As spectral resolution increases, the dimension of the Doppler Asymmetric Spatial Heterodyne (DASH) interferometer increases. The existing approach for stably mounting the interferometer is limited to mounting a normal-sized DASH interferometer. In this study, a novel and stable structure is proposed, with its effecti1veness exemplified for a near-infrared (NIR) DASH interferometer. The mathematical model of a flexible structure was established. The parameters of the support structure were optimized by requiring the mechanical stress of the flexible structure and shear stress at the bonding surface to be less than the strength value. The spring constants were optimally designed to adjust natural frequency and minimize stress. The finite element analysis (FEA) results show that the maximum mechanical stress was 65.56 MPa. The maximum shear stress was 3.4 MPa. All stress values had a high safety margin. The mechanical material and adhesive area were optimally designed. Therefore, the thermal resistance of the structure was improved by 7.5 times. The test results indicate that the proposed flexible support structure could satisfy the requirements of the launch environment. The results from FEA and vibration tests were consistent with the model calculation results. Compared to existing structures, the mechanical performance and thermal resistance were improved.

1. Introduction

An effective way of measuring horizontal atmospheric winds is to observe the Doppler shift of atmospheric emission lines. In order to measure winds speeds within 5 m/s precision, the instrument should measure the position of Doppler shifted lines within 10−5 nm or better. Space-borne measurements, which can provide global scale coverage, have become an important measurement means in many domains [1,2]. Space-borne DASH wind instruments, such as the High-Resolution Doppler Imager (HARDI), TIMED Doppler Interferometer (TIDI), Wind Imaging Interferometer (WINDII), and Michelson Interferometer for Global High-resolution Thermospheric Imaging (MIGHTI) [3,4,5,6,7], have measured the global distribution of upper atmospheric (60–300 km) winds. As a new wind interferometer concept proposed in recent years, DASH consists of a Michelson interferometer with the return mirrors replaced by fixed, titled diffraction gratings. Therefore, it measures many more path difference samples within a larger path difference interval without moving parts [8,9]. This feature enables the interferometer to measure multiple atmospheric lines and to simultaneously monitor an on-board calibration line to track instrumental drifts. Therefore, it has become a focus of active research. However, the mounting for the interferometer, which is a key part of the space-borne DASH wind instrument, should meet the mechanical conditions of being space-borne and minimize the impact of ambient temperature. Therefore, the design of a stable support structure with reduced heat conduction has become an urgent issue.
To achieve highly stable rugged support for the interferometer, many researchers at home and abroad have investigated the support structure of the interferometer. T. L. Killeen researched stable and rugged etalons, realizing a micro-stress mounting with low heat conduction for a Fabry–Perot interferometer (FPI) using six epoxy pads [10]. However, the construction of the FPI is limited to mounting an interferometer with a rotationally symmetric structure. The method for a mesh bonding surface micro-stress mounting of the Sagnac interferometer prism has been proposed, which could meet the requirements of the launch environment [11]. However, the bonding area is too large, and the thermal insulation installation requirements could not be met. An approach to assembling split infrared Spatial Heterodyne Spectroscopy (SHS) using three loaded plungers that provide well-controlled compression forces to the optical components and precision spacers was proposed by Englert [12]. Babcock designed a semi-kinematic clamping structure of three straight columns connecting the upper and lower plates, adding an interferometer vacuum “housing,” preferential thermal path, foam, and multi-layer insulation (MLI), which could be used to reduce the impact of ambient temperature. This could realize thermally stable mounting for a common path DASH interferometer [13]. Moreover, Y. Bai designed a micro-stress support structure with low heat conduction for the space-borne non-common path DASH interferometer. The interferometer (weighing 0.274 kg) was clamped using a combination of four bonding surfaces (the diameter of each bonding area was 10 mm) on a base made of Invar, which is a low thermal expansion metal, and four-pad elastic compression [14]. This method realized stable mounting for the DASH interferometer by improving its natural frequency (the lowest natural frequency is 1947.15 Hz). The spring constant was proportional to the natural frequency; therefore, as the dimensions of the DASH interferometer increased (because of the spectral resolution being improved), the most effective method of achieving stable support for the interferometer was through increasing the bonding area and improving the rigidity performance of the assembly, thereby minimizing the shear stress of the gluing surface. This increases the bonding area, which contrasts with the principle of adiabatic mounting and decreasing heat transfer. As an example, a space-borne NIR DASH interferometer (weighing 1 kg) was mounted in this way. It was clamped by a combination of four bonding surfaces (the diameter of each bonding area was 13 mm) and four-pad elastic compression. The (metal-to-glass) bonding surface tension broke during the vibration testing at the instrument level because of the lower natural frequency of 800 Hz. Therefore, the design was limited to mounting a normal-sized DASH interferometer. To support large optical components, an adhesive structure was mainly used on the side to support large transmission and reflection prisms [15,16,17,18]; however, this cannot be directly used to support an interferometer prism.
To overcome some of the limitations of the existing approaches, a novel and flexible structure optimization method that implemented a non-common-path NIR DASH interferometer used in a space-borne wind instrument is proposed in this study. With the mechanical stress of the flexible structure and shear stress at the bonding surface as the optimization goal, the stable rigid structural frame was optimized, and the optimization design was carried out from the parameters of the flexible structure to achieve mechanical stability and low heat conduction support in the DASH interferometer. The spring constants were optimized to minimize the stress. The results from FEA and vibration tests agreed with the model calculation results. Compared with existing methods, the proposed flexible support can reduce heat conduction and satisfy the requirements of the launch environment. Table 1 lists existing approaches and the proposed flexible structure for mounting the interferometer.

2. Principle of DASH Interferometer

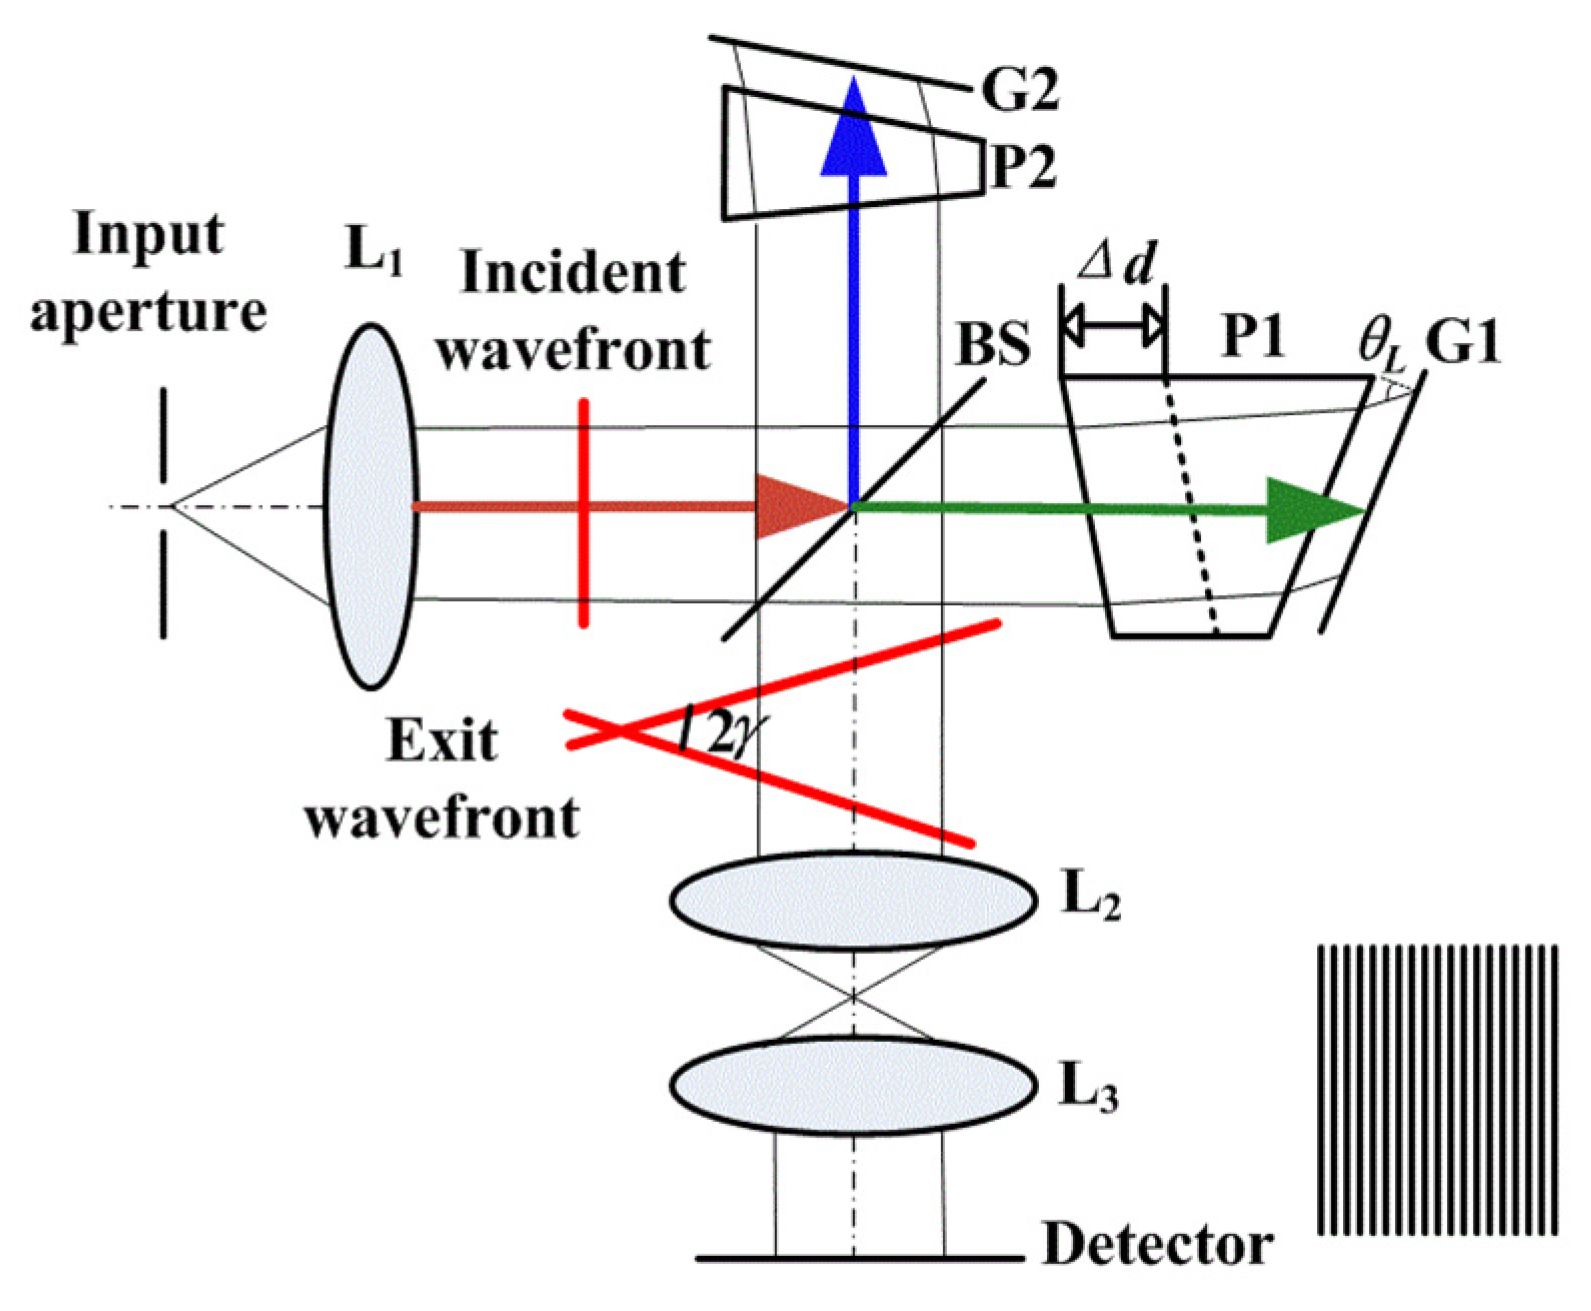
2.1. Principle of DASH

The DASH interferometer, which is based on Spatial Heterodyne Spectroscopy [19], is an asymmetric spatial heterodyne interferometer. It allows a sufficiently high spectral resolution by introducing a large additional optical path offset to passively measure the small wavelength shifts of emission lines caused by Doppler shifts from speeds, thereby measuring the line-of-sight velocity. Figure 1 shows the schematic of the DASH interferometer technique. The DASH interferometer receives a telecentric incident beam. The incident wavefront is split at the beam splitter (BS), so that the two resulting beams travel along the arms of different path lengths. The two beams illuminate the gratings (G1 and G2) at the end of the interferometer arms. After diffraction at the gratings, the wavefronts return to the beam splitter and recombine. Because one wavefront is delayed by the optical path offset, both the wavefronts are tilted by the angle with respect to the optical axis at this point. The detector array records a Fizeau parallel fringe pattern. The interferogram can be written as follows [20]:
I ( x ) = 1 2 0 B ( σ ) [ 1 + cos { 2 π [ 4 ( σ σ L ) tan θ L ] x + 2 σ Δ d } ] d σ ,
where σ is the wave number of incident light, σ L is the Littrow wavenumber, θ L is the Littrow angle, B ( σ ) is the incident spectral density, Δ d is the path difference offset, and x is the location on the detector array ( x = 0 is the center of the array).
When the Doppler shift is introduced by the Doppler velocity, the wave number of incident light is given:
σ = σ 0 + Δ σ ,
where Δ σ is the spectral resolution and σ 0 is the wavenumber of the line center.
Then, Equation (1) can be written as:
I ( x ) = 1 2 0 B ( σ ) [ 1 + cos { 2 π [ 4 ( σ 0 + Δ σ σ L ) tan θ L ] x + 2 ( σ 0 + Δ σ ) Δ d } ] d σ ,
Using Fourier transform, extracting the characteristic peaks and inverse Fourier transform, the complex interferogram can be obtained:
I D ( x ) = 1 2 S E ( x ) [ cos φ ( x ) + i sin φ ( x ) ] ,
where S is the intensity coefficient of the spectral line, E ( x ) is the spectral envelope function, and φ ( x ) is the interferogram phase.
Then, the phase can be calculated from the ratio of its imaginary   and its real part   [21].
φ ( x ) = tan 1 ( I D ) ( I D ) ,
From Equation (3), the phase φ ( x ) is given as follows:
φ ( x ) = 2 π [ 4 ( σ 0 + Δ σ σ L ) tan θ L x + 2 ( σ 0 + Δ σ ) × Δ d ] = φ 0 ( x ) + Δ φ ( x ) ,
where φ 0 ( x ) = 2 π [ 4 ( σ 0 σ L ) tan θ L x + 2 σ 0 × Δ d ] is the zero-wind phase, and Δ φ ( x ) = 2 π [ 4 tan θ L x + 2 Δ d ] Δ σ is the phase shift due to Doppler shift.
The zero-wind phase φ 0 can be removed using the phase-retrieval algorithm from Equation (6), and the Doppler phase shift Δ φ can then be obtained. The Doppler velocity υ can be calculated as follows [22]:
υ = Δ φ · c 4 π Δ d · σ 0 ,
where c is the speed of light.
As expressed in Equation (7), an increase in the optical path offset can increase the phase shift caused by the same Doppler velocity. Similarly, increasing the optical path offset can increase the size of the interferometer.
As expressed in the equation for phase shift, the spectral resolution · σ is proportional to the phase shift, and this can be expressed as follows:
Δ σ = 1 4 W sin θ L ,
where W is the beam width measured along each grating.
The grating size can be increased to improve the spectral resolution, which also increases the size of the DASH interferometer. This is exemplified using the NIR DASH interferometer in this study. Compared with the visible DASH interferometer (size of 91.5 × 85.5 × 40 mm), the NIR DASH interferometer requires a higher spectral resolution to measure the same Doppler velocity. The size of the utilized NIR DASH interferometer is 110.5 × 101.5 × 50 mm.

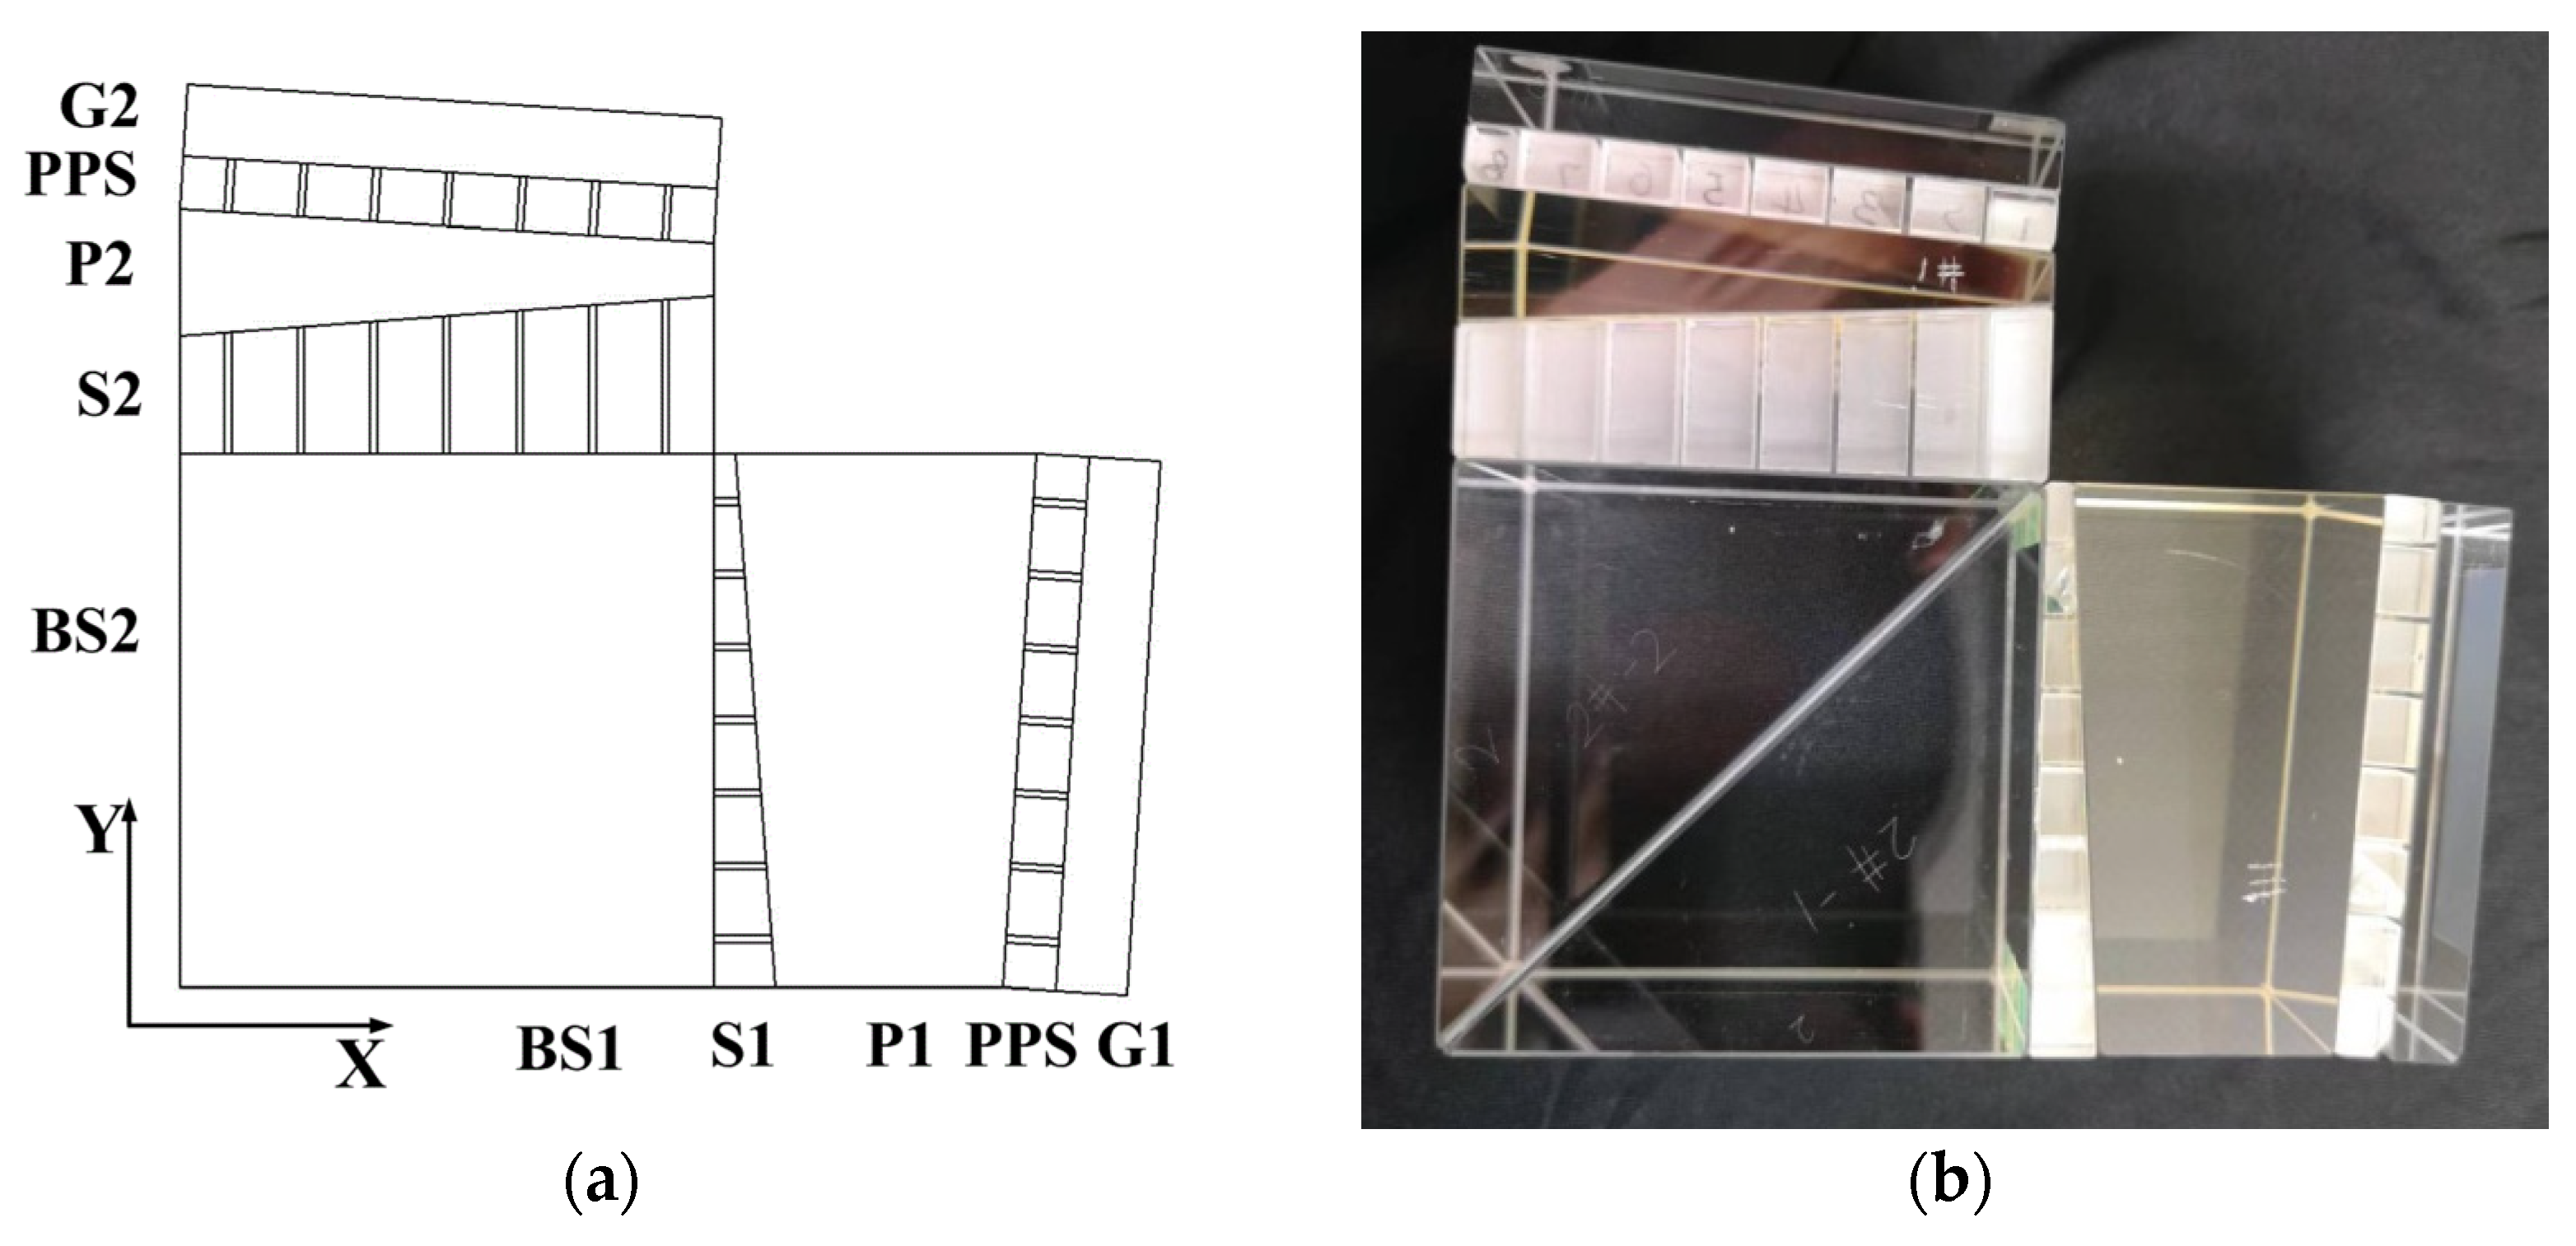
2.2. DASH Interferometer Configuration

The DASH interferometer is a monolithic interferometer consisting of cube beam splitters (BS1 and BS2), prisms (P1 and P2), wedged spacers (S1 and S2), parallel spacers (PPS), and gratings (G1 and G2), as shown in Figure 2. The material and thickness of the wedged spacers S1 and S2 are selected to compensate for the phase shift at the fringes as the arms expand with temperature [23]. The interferometer design parameters are listed in Table 2.

3. DASH Interferometer Mount

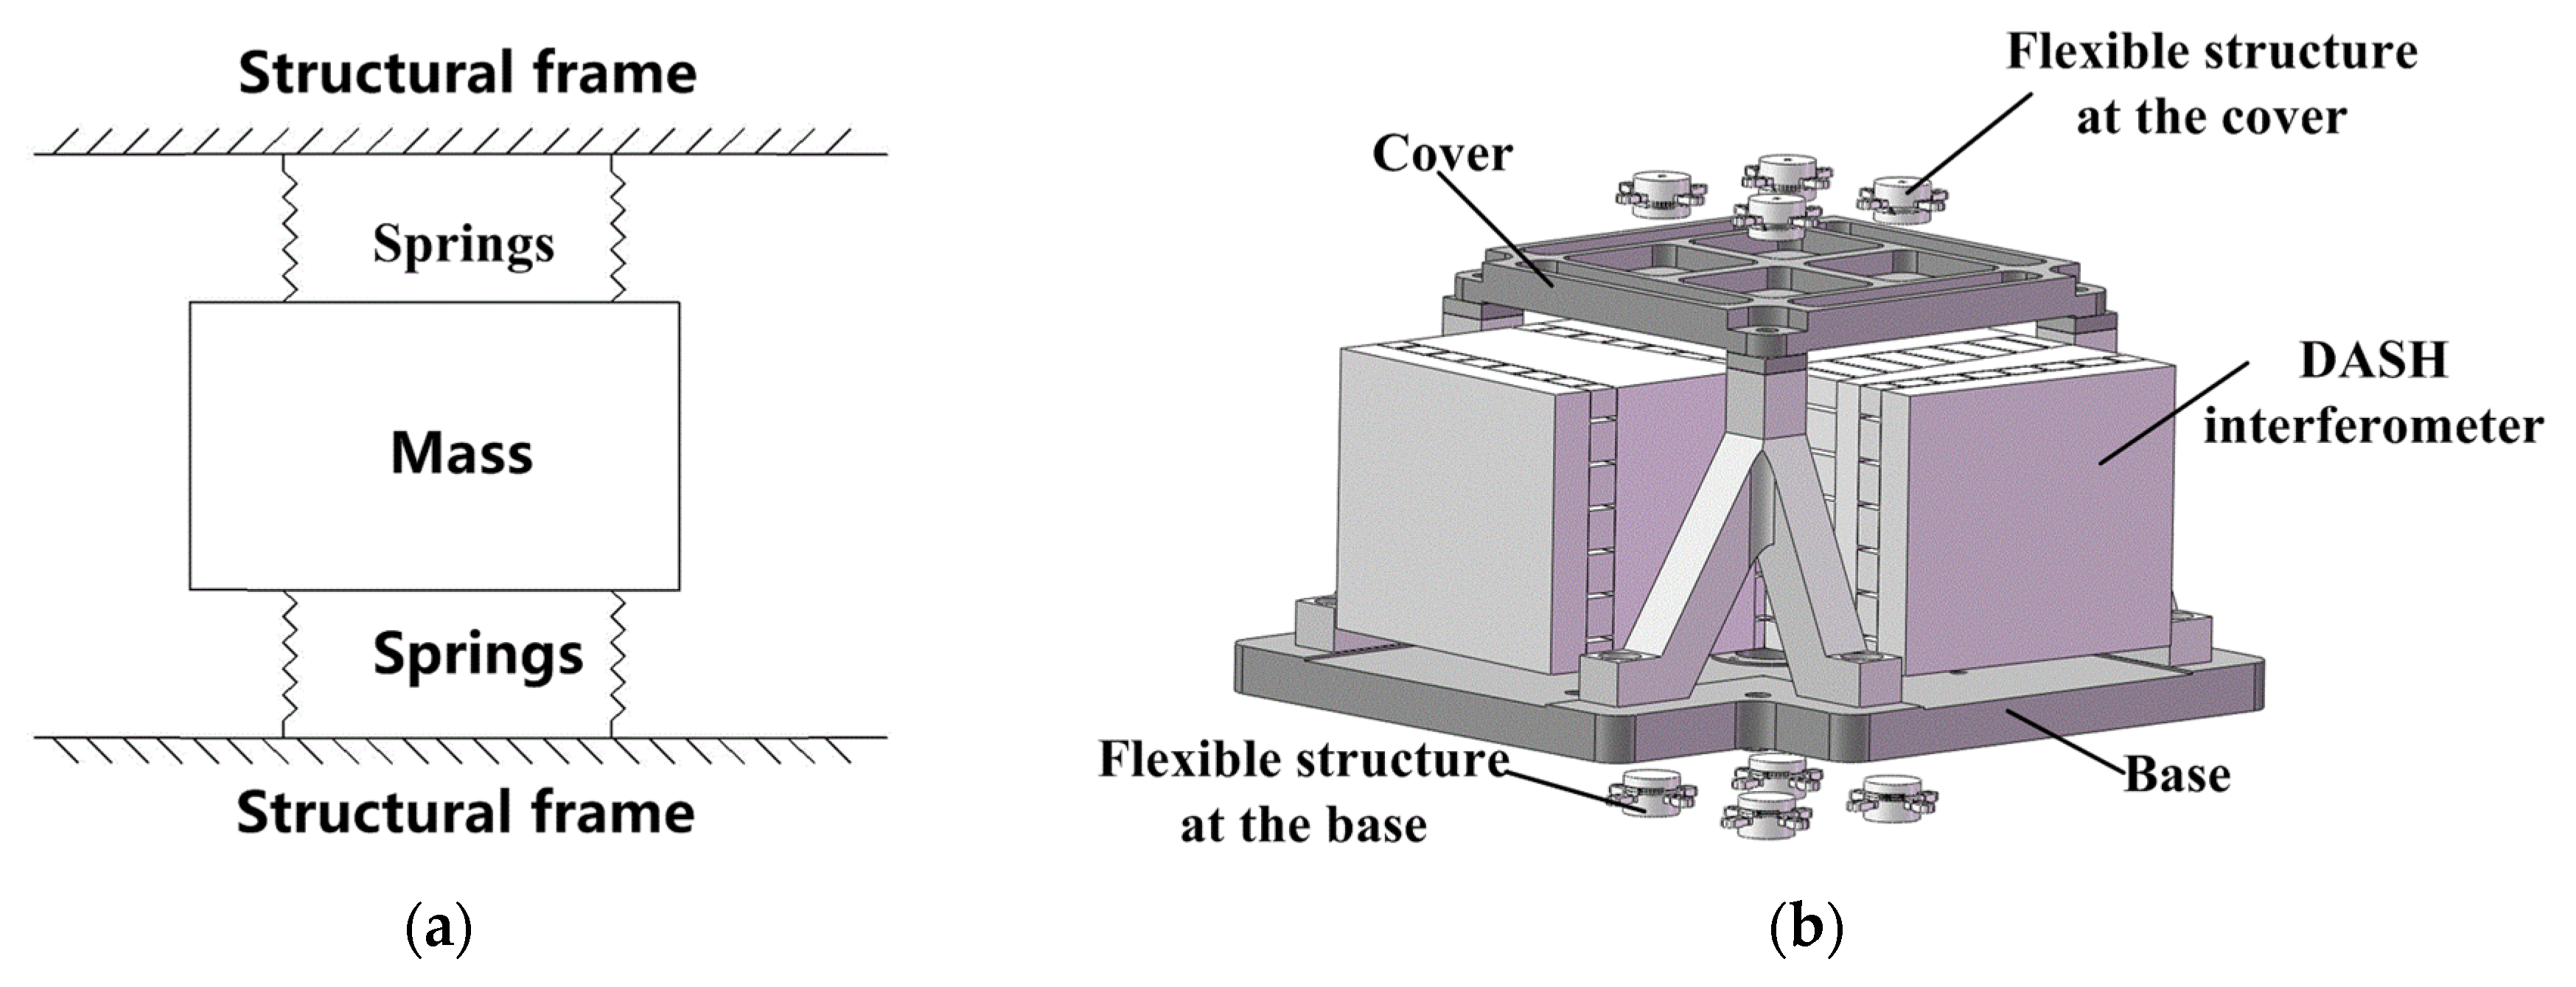
3.1. Framing System for Flexible Support

The support structure of the DASH interferometer is a “sandwich” structural framing system. The structural frame, which consists of a base, cover, and four columns, is designed to provide the support system. The DASH interferometer, which is epoxied at eight locations on the pads of the elastic flexible structure, is the Mass. The flexible structures (upper and lower) are springs, as shown in Figure 3.
Considering the maximum mechanical stress value of the flexible structure and shear stress value at the bonding surface as the optimization target, research on a flexible structure for the DASH interferometer is useful in the following aspects:
  • The structural frame is designed as a rigid structure compared to the Mass.
  • The spring constants of flexible structures are optimized to adjust the natural frequency of the DASH interferometer assembly. The lower spring, which plays a position-supporting role, is permitted to be much stiffer than the top spring, which plays a mounting role.
  • The optical elements and flexures move together during the vibration tests, and the maximum deformation is in the flexible structure. The maximum stresses on the structure are lower than the tensile strength of the materials. The gluing interface strengths at the two gluing interfaces (metal-to-glass gluing and glass-to-glass gluing) are less than the shearing strength of the epoxy adhesive bonding. Moreover, certain safety margins are incorporated.
  • Materials and configuration are selected to decrease heat conduction.
Figure 4 illustrates the flexible structure with the detailed optimization process.

3.2. Design of Structural Frame

In contrast to existing technology that uses Invar, the material used in this study is TC4 for the structural frame, consisting of the base, cover, and columns. The heat conductivity of TC4 (7.4 W·m−1·K−1) is less than that of Invar (13.9 W·m−1·K−1), which can improve the thermal resistance of the DASH interferometer and reduce heat conduction. Meanwhile, the specific stiffness of TC4 is higher than that of Invar; therefore, the natural frequency of the structural frame that satisfies the requirement of rigidity can be improved.

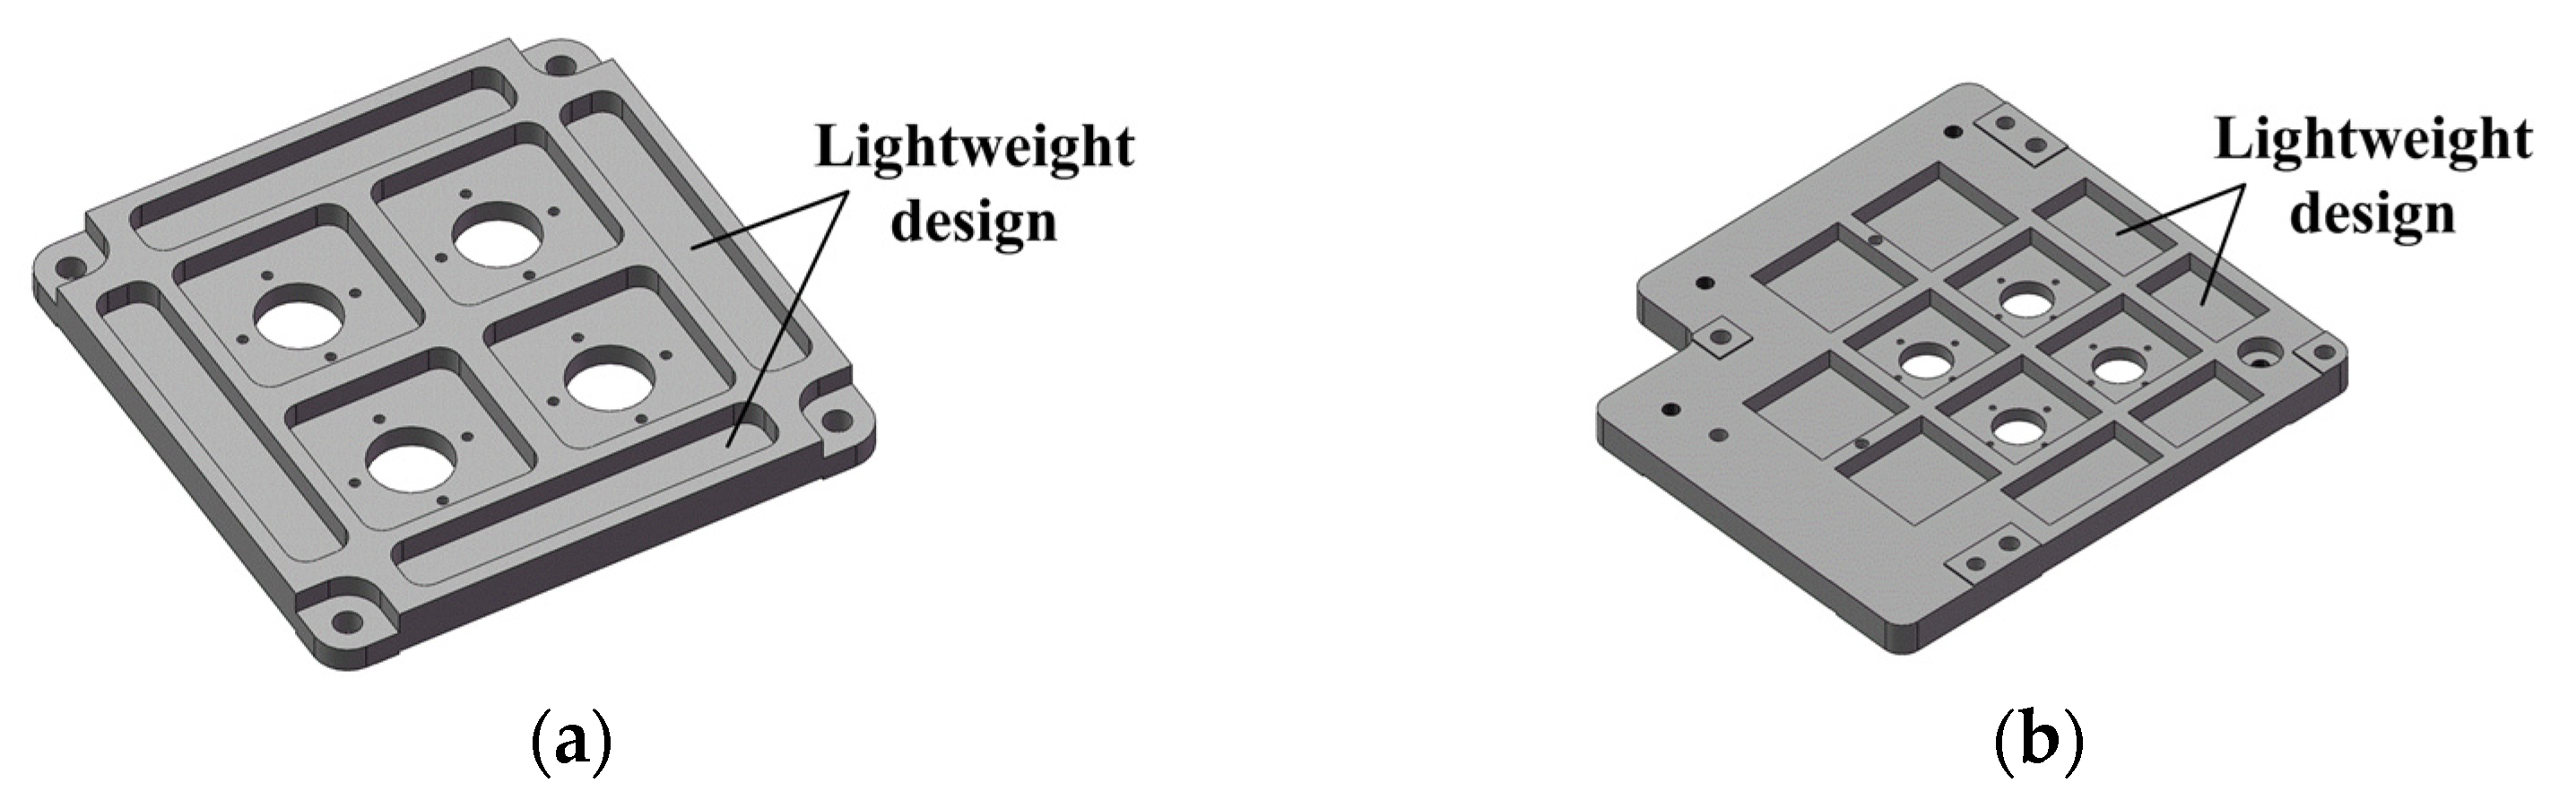
3.2.1. Design of Base and Cover

The base, which is used as the mounting base of the DASH interferometer, has a lightweight design to ensure structural stiffness, as illustrated in Figure 5. It is necessary to design the cover with a lighter weight, as it acts as the load. The weight of the cover is 0.124 kg, which is approximately 50% of the weight of the non-lightweight design. Figure 5 illustrates the structural schematics of the base and cover.

3.2.2. Design of the Column

The vibration modes of the FEA are the optical elements rotating around the Y-axis, X-axis, and Z-axis, respectively, because the optical element of the DASH interferometer assembly has an asymmetric structure. A column configuration was used to improve the stiffness of the three degrees of freedom. As shown in Figure 6, there are three types of columns: Column Ⅰ (Column Ⅲ), Column Ⅱ, and Column Ⅳ. Columns I and II are used to increase the rotational stiffness around the Y-axis, columns II and III are used to increase the rotational stiffness around the X-axis, and columns I, II, and III are used to increase the rotational stiffness around the Z-axis. Moreover, the incident and exit beams are on both sides of column IV. Therefore, column Ⅳ is straight, as illustrated in Figure 6.
In the FEA, the columns are simplified into simply supported beam structures, and the slope of each column is proportional to the force it would bear. The optimal structure is designed using FEA, i.e., by analyzing the natural frequencies of the structural frame with different column slopes. Figure 7 shows the relationship between the slope angle and natural frequencies in the three directions. It could be noted that the relative change in the natural frequency decreased when the slope was 57°, which has not been discussed in existing methods available in the literature. Therefore, the slope of Columns I, II, and III was proposed to be 57°.

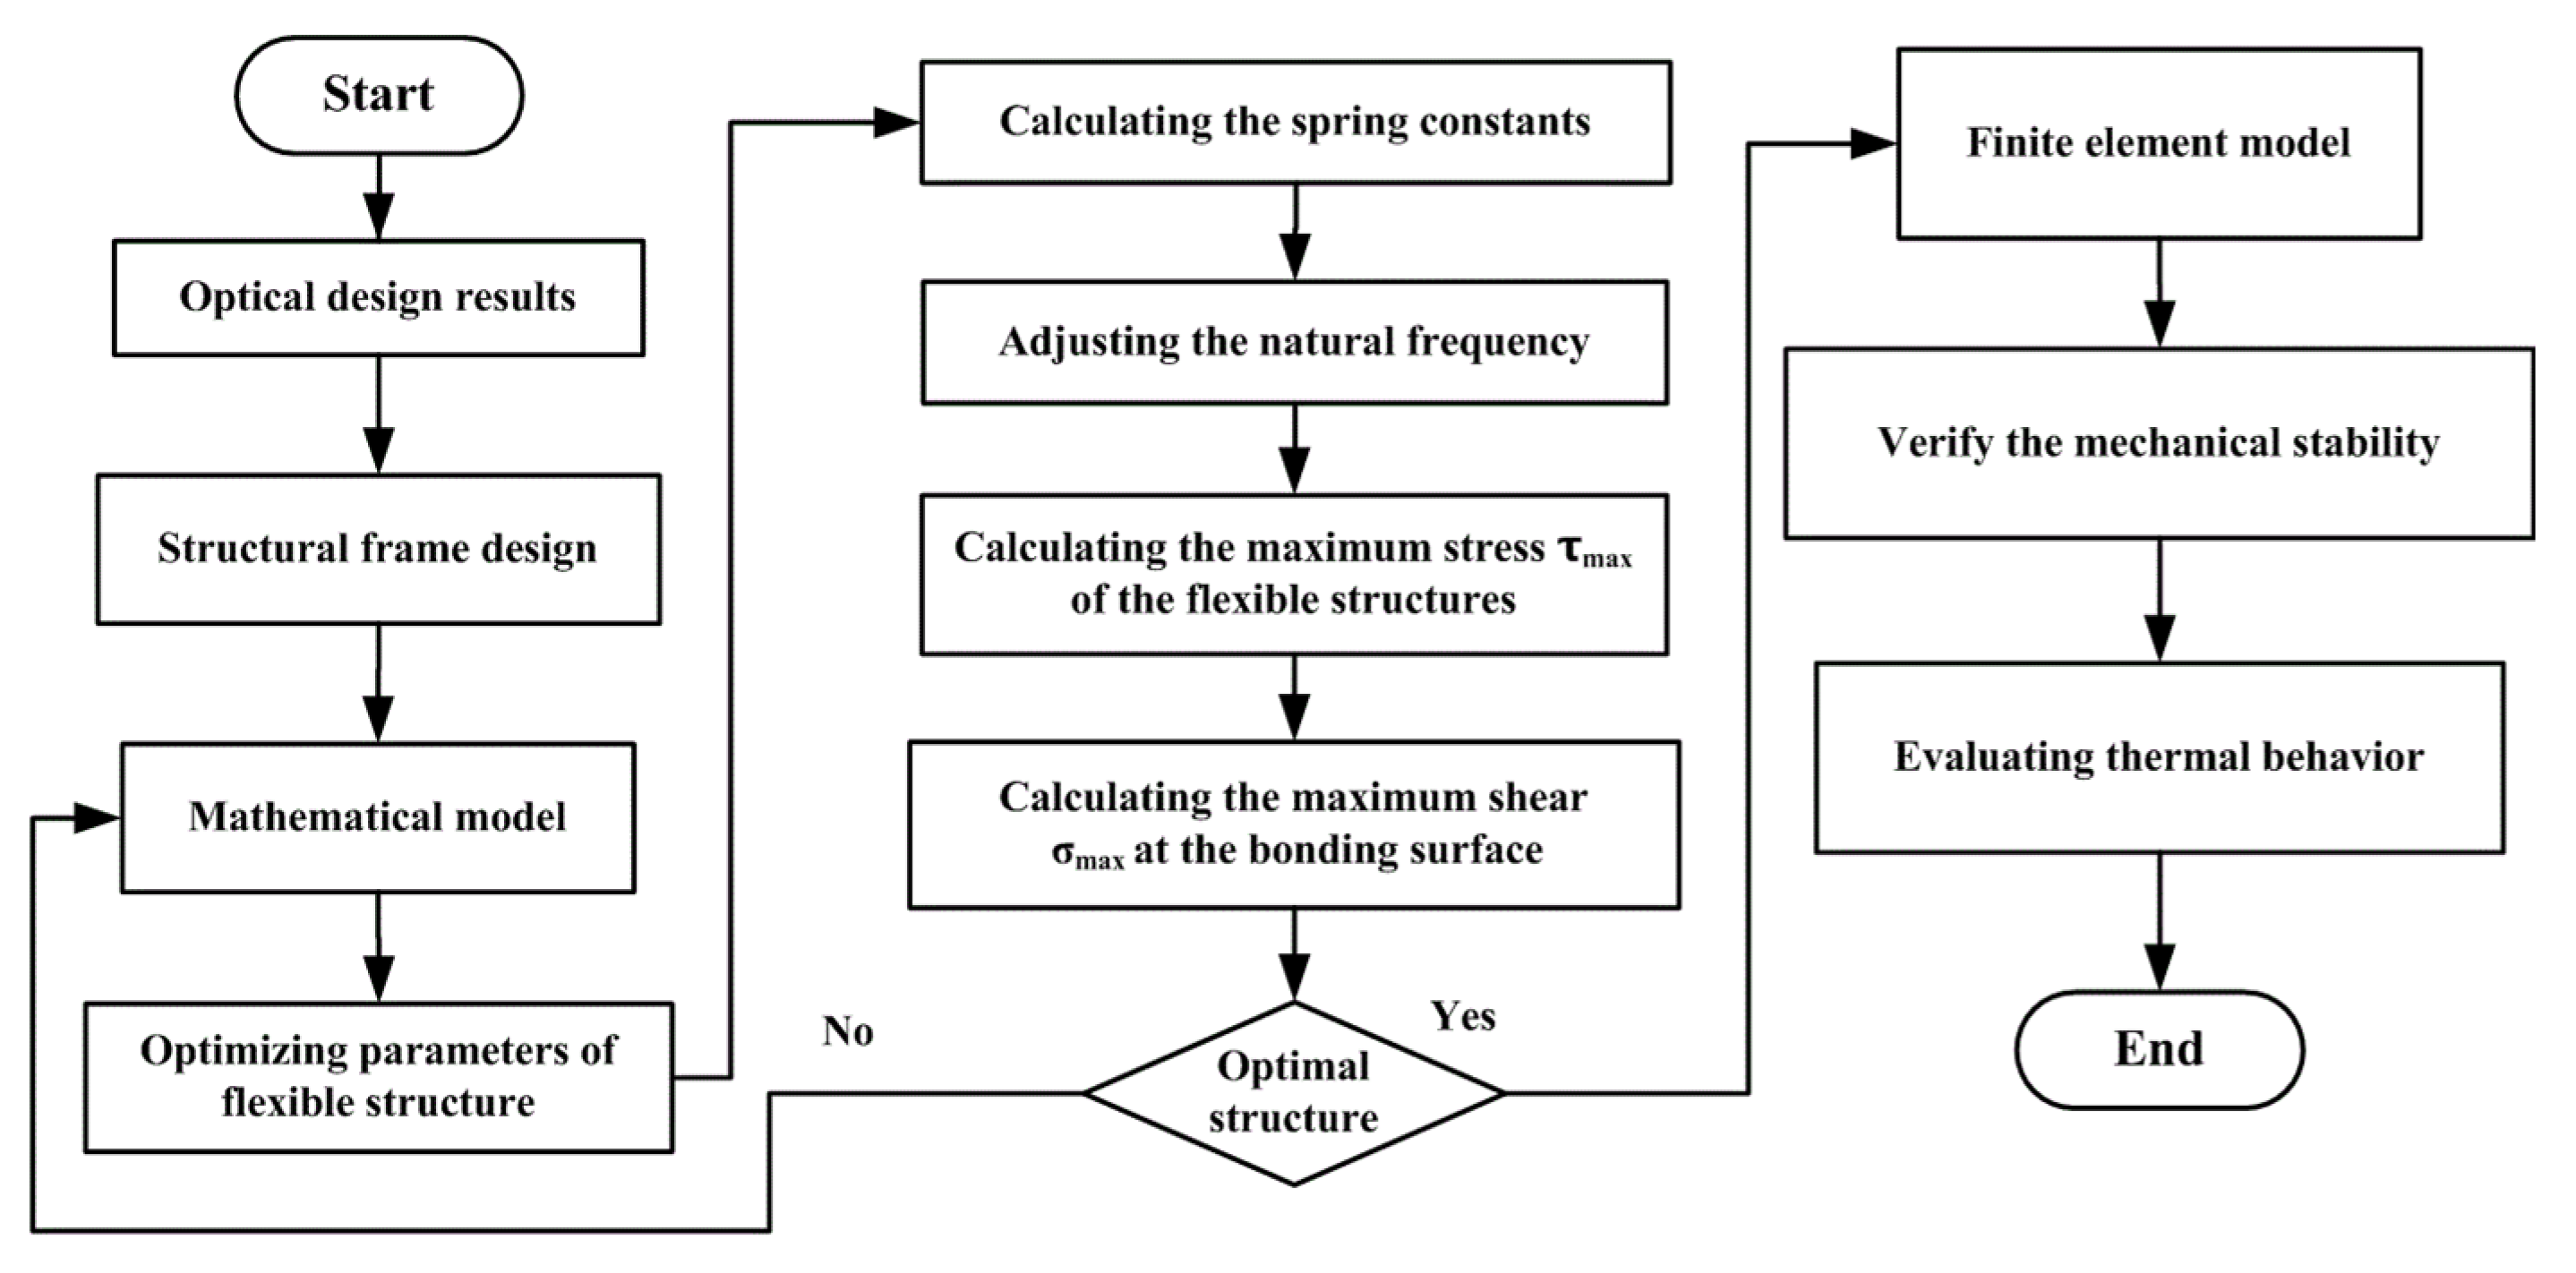
3.3. Optimizing the Flexible Structure

3.3.1. Optimal Design of Spring Constant

The flexible structure was bonded with BS using an epoxy adhesive (epoxy adhesive 8217). According to the principle of the consistent coefficient of bonding materials’ thermal expansion, the coefficient of thermal expansion (CTE) for the structural and optical materials should be the same. Here, the utilized BS material was fused silica, which has a low CTE, and the flexible structure was made of Invar, a low-thermal-expansion metal. The flexible structure consisted of two parts: the bonding surface and four wings around the surface. Therefore, the spring constant K of the flexible structure was subdivided into two parts, namely the spring constants K1 and K2 at the wing and bonding surface positions, respectively. Figure 8 shows a schematic of the geometry of the flexible structure.
The spring constant K is expressed as follows:
  1 K = 1 K 1 + 1 K 2 = 2 l 3 n Y Z b h 1 3 + 3 ( R cos θ R sin α ) 3 2 Y Z × h 2 3 × ( 2 R sin θ ) ,
where Y Z = 145 × 103 MPa is Young ’s modulus for Invar, h 1 is the thickness of the wing, b   is the width of the wing, l is the length of the wing, n   is the number of wings, α is the angle of the partition, R is the radius of the bonding surface, h 2 is the thickness of the bonding surface, and θ is the angle of the bonding surface, as defined in Figure 8.
During the random vibration test, the bending deformation of the bonding surface occurred. Figure 9 shows a deformation diagram of the bonding surface. To minimize the deformation of the bonding surface ( ω ) , which breaks the bonding surface, the thickness (h2) of the bonding surface should be optimized as follows:
h 2 3 = 3 8 × F m a x × R 2 × cos 2 θ Y Z × ω ,
where F m a x is the maximum force on a flexible structure.
Then, Equation (9) can be expressed as follows:
K = 1 l 3 Y Z b h 1 3 + 2 ω ( cos θ sin α ) 3 F m a x × cos 2 θ × sin θ ,

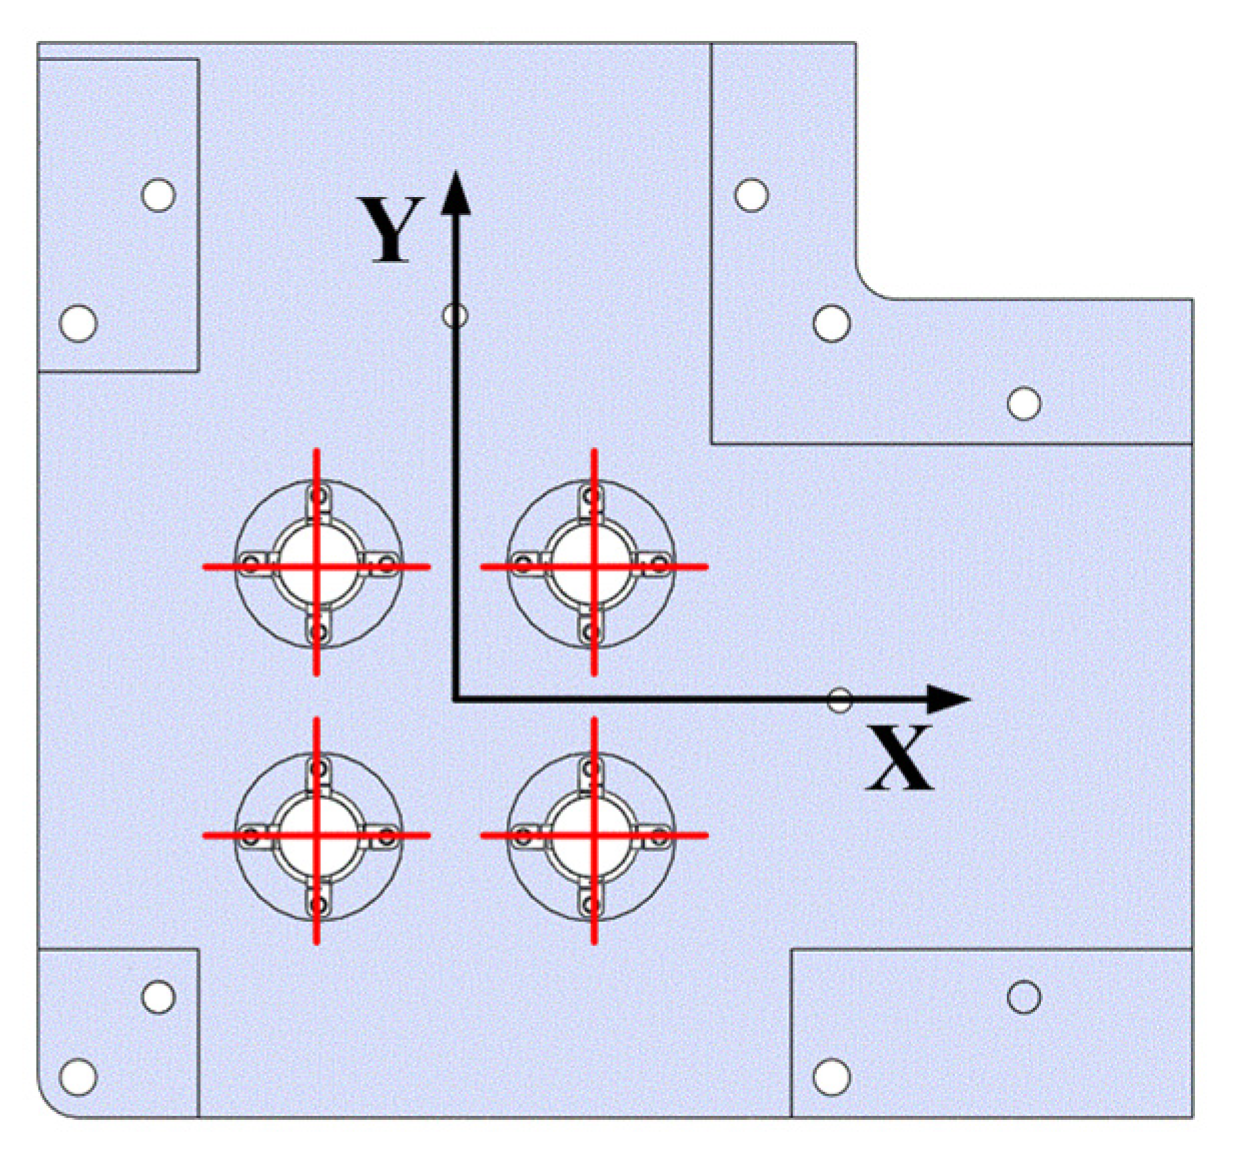
3.3.2. Optimal Phase Position for Flexible Structures

The Cartesian coordinate system was established with the cross-point of the incident and exit optical axes as the coordinate origin. Without considering the position in the Z direction for the time being, the coordinate position of the center of the mass is (X0, Y0). The coordinates of the two pairs of flexible structures on the cover (base) are (X1, Y1), (X2, Y2), (X3, Y3), and (X4, Y4), respectively.
Accordingly, the force on the four flexible structures is expressed as follows for rotating around the Y-axis:
{ F X i = m a · ( X 0 X j ) X j X i = m a · Δ X j , 0 Δ X j , i F X j = m a · ( X 0 X i ) X j X i = m a · Δ X i , 0 Δ X j , i ,
where Δ X i , 0 = X 0 X i , Δ X j , 0 = X 0 X j , Δ X j , i = X j X i , i = 1, 4, and j = 2, 3.
Similarly, in the case of rotating around the X-axis, the force is expressed as follows:
{ F Y i = m a · ( Y j Y 0 ) Y j Y i = m a · Δ Y j , 0 Δ Y j , i F Y j = m a · ( Y 0 Y i ) Y j Y i = m a · Δ Y i , 0 Δ Y j , i ,
where Δ Y i , 0 = Y 0 Y i , Δ Y j , 0 = Y j Y 0 , Δ Y j , i = Y j Y i , i = 3, 4, and j = 1, 2.
According to Equations (12) and (13), to reduce the force on the flexible structure of the four bonding surfaces, the distance between the bonding locations should be increased, and that between the bonding locations and the center of mass should be reduced in the X and Y directions.
Additionally, according to the vibration mode of the DASH interferometer, the phase of flexible structure is 90°, as shown in Figure 10.

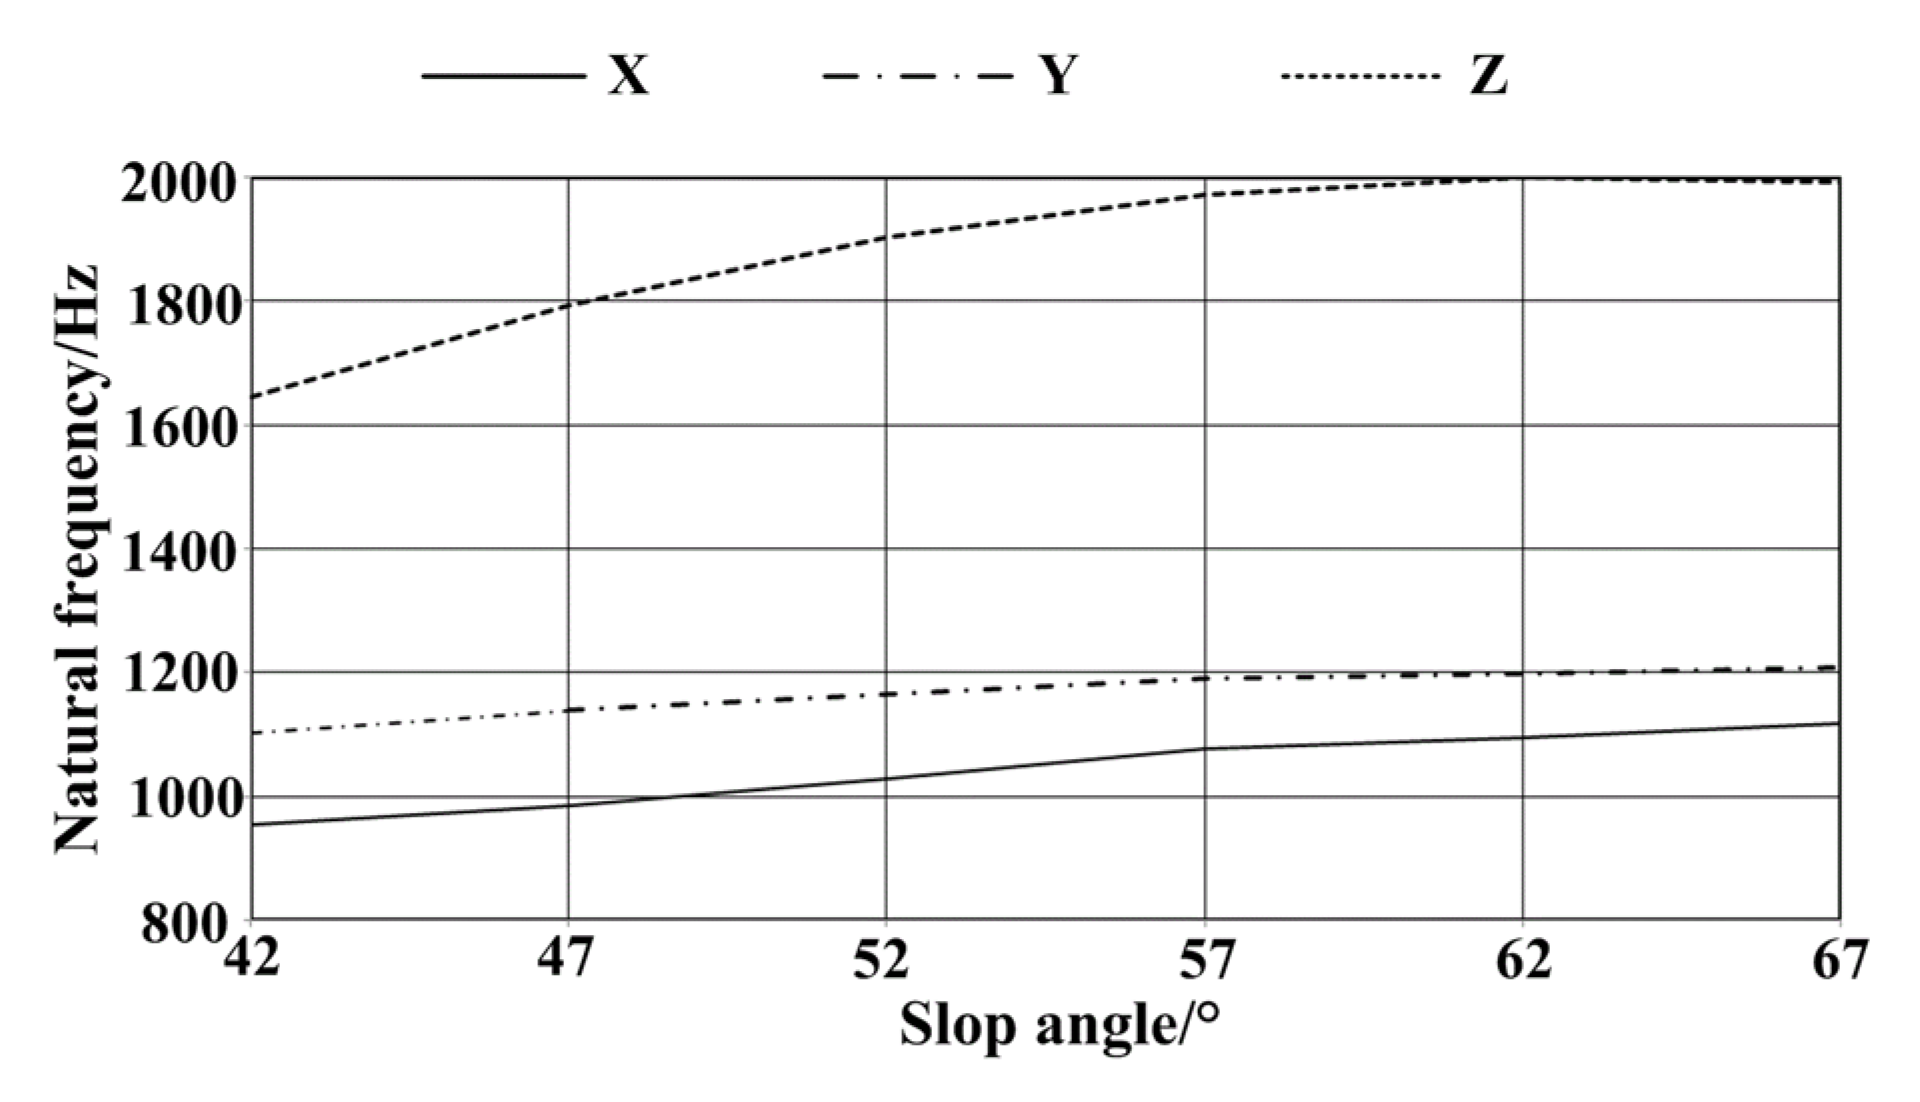
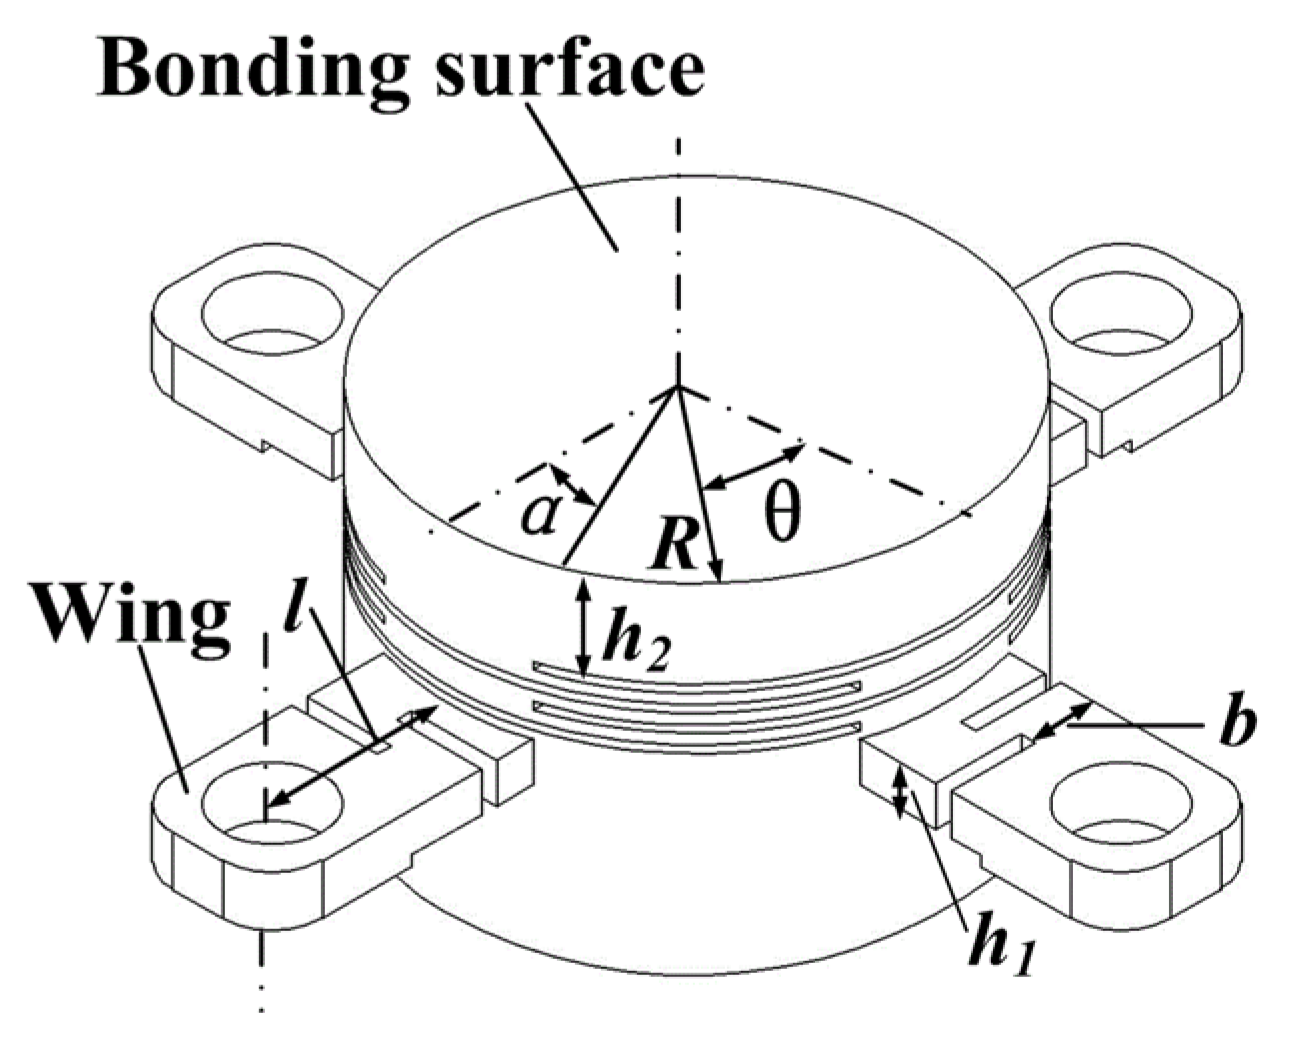
3.3.3. Optimal Parameters of Flexible Structure

The dimensions of the flexible structure and its relative phase position can be optimized with the objective that the mechanical stresses of the flexible structure should be less than the tensile strength of the material, and the shear stress at the bonding surface should be less than the shear strength of the epoxy adhesive. The process of optimal design is as follows.
The spring constant K at the wing position is inversely proportional to the length l of the wing, as expressed in Equation (11). However, the length l of the wing should be increased, according to Equations (12) and (13). Similarly, the spring constant K at the wing position is proportional to the thickness h 1 , the number n and the width b of the wings. Therefore, the parameters’ design is a comprehensive topology optimization process.
The optimal design of thickness h 2 and the angle of the bonding surface θ are related to the deformation of the bonding surface ω . Assuming that the acceleration response of the Mass is 30 g (root mean square value), as per the Pauta criterion (3 sigma guidelines), the Mass will undergo an acceleration ( a = 90 g). The deformation of the bonding surface (upper and lower) ω   should be less than 1 μm.
Therefore, the optimal values selected for the lower flexible structure are h1 = 1.5 mm, h2 = 1.75 mm, b = 1.6 mm, α = π/10, l = 2.43 mm, n = 2, and θ = π/4. The optimal values for the upper flexible structure are h1 = 1 mm, h2 = 1.5 mm, b = 1.3 mm, α = π/13, l = 2.43 mm, n = 2, and θ = π/4.
The positions (unit is mm) of the four groups of flexible structures and the coordinate position (unit is mm) for the center of mass are given as follows:
[ X 1 X 2 Y 1 Y 2 X 3 X 4 X 0 Y 3 Y 4 Y 0 ] = [ 17   17   17   17   17   17   20.2   17   17   11.5   ]
The spring constants of the lower and upper flexible structures are Klower = 52,000 N/mm and Kupper = 12,400 N/mm, respectively. The spring constant Klower is permitted to be much stiffer than the spring constant Klower in the Z direction because the lower spring plays a position-supporting role. The spring constant K T and the corresponding resonant frequency f r e f are expressed as shown:
f r e f = 1 2 π K T m ,
where K T = K l o w e r K u p p e r / ( K l o w e r + K u p p e r ) is the spring constant of the flexible structure.
Table 3 lists the spring constants and frequencies of the DASH interferometer assembly. Therefore, the spring constants of flexible structures are optimized to adjust the natural frequency of the assembly.
The Mass undergoes an acceleration ( a = 90 g), which is substituted in Equations (12) and (13). According to the effective quality factor of the vibration mode, the maximum force on the flexible structure is F m a x = 62.7 N. The maximum stress of a single flexible structure τ m a x and the shear stress σ m a x at the bonding surface between the structure and optical elements can be given below, as follows [24]:
{ τ m a x = 3 2 F m a x b h 1 σ m a x = m a S = m a 8 π R 2 ,
where S is the area of bonding surface.
The maximum shear stress of the flexible structure is 72 MPa, which is significantly lower than the tensile strength of Invar. The maximum shear stress at the bonding surface is 1.4 MPa, which is lower than the shear strength of the epoxy adhesive (8217).
Additionally, the bending deformations of the bonding surface are 0.4 μm and 0.5 μm, respectively.

3.4. Finite Element Analysis

A finite element model of the DASH interferometer assembly can then be established to analyze the modal and random vibration responses, as well as to verify the correctness of the theoretical analysis. Table 4 lists the properties of the primary materials used in the DASH interferometer assembly.
Figure 11 illustrates the deformation of the interferometer assembly. The analysis results show that the DASH interferometer moves together with the flexible structure, and the maximum deformation is located at the wing position of the flexible structure.
Modal analysis was then performed to evaluate the rigid-body performance of the structural frame in comparison to that of the DASH interferometer. Table 5 summarizes the comparative analysis values of the natural frequencies of the structural frame and DASH interferometer. Note that the natural frequencies of the structural frame are much higher than those of the DASH interferometer in all three directions. The structural frame can be defined as a rigid structure.
A finite element model of the DASH interferometer was created to analyze the response under random vibration conditions and the dynamic performance of the assembly. Table 6 lists the space-borne random vibration test conditions of assembly, derived from the response of the interferometer assembly support position when the wind measurement instrument was under the launch environment.
The maximum stress on the mechanical element was 65.56 MPa, which occurred at the wing position of the flexible structure, and the maximum stress on the optical element was 0.56 MPa. All stresses were less than the tensile strength of the material.
The maximum shear stress σ m a x at the bonding surface between the structure and optical elements was 3.4 MPa. According to the safety margin equation ( M S = σ b / ( σ m a x × 1.2 ) ), which defined the safe coefficient as 1.2, the safety margin (MS) must be higher than one. Considering the shear strength ( σ b = 14 MPa) of the epoxy adhesive (8217) as the structural adhesive, the safety margin was 3.4 , which is higher than one. The maximum shear stress of the bonding surfaces between the optical elements was 0.33 MPa. Considering the shear strength (20 MPa) of the ultraviolet photosensitive adhesive (NOA61), the safety margin was 49.5, which is also higher than one. Therefore, all values had a high safety margin.

3.5. Low Heat Conduction Behavior
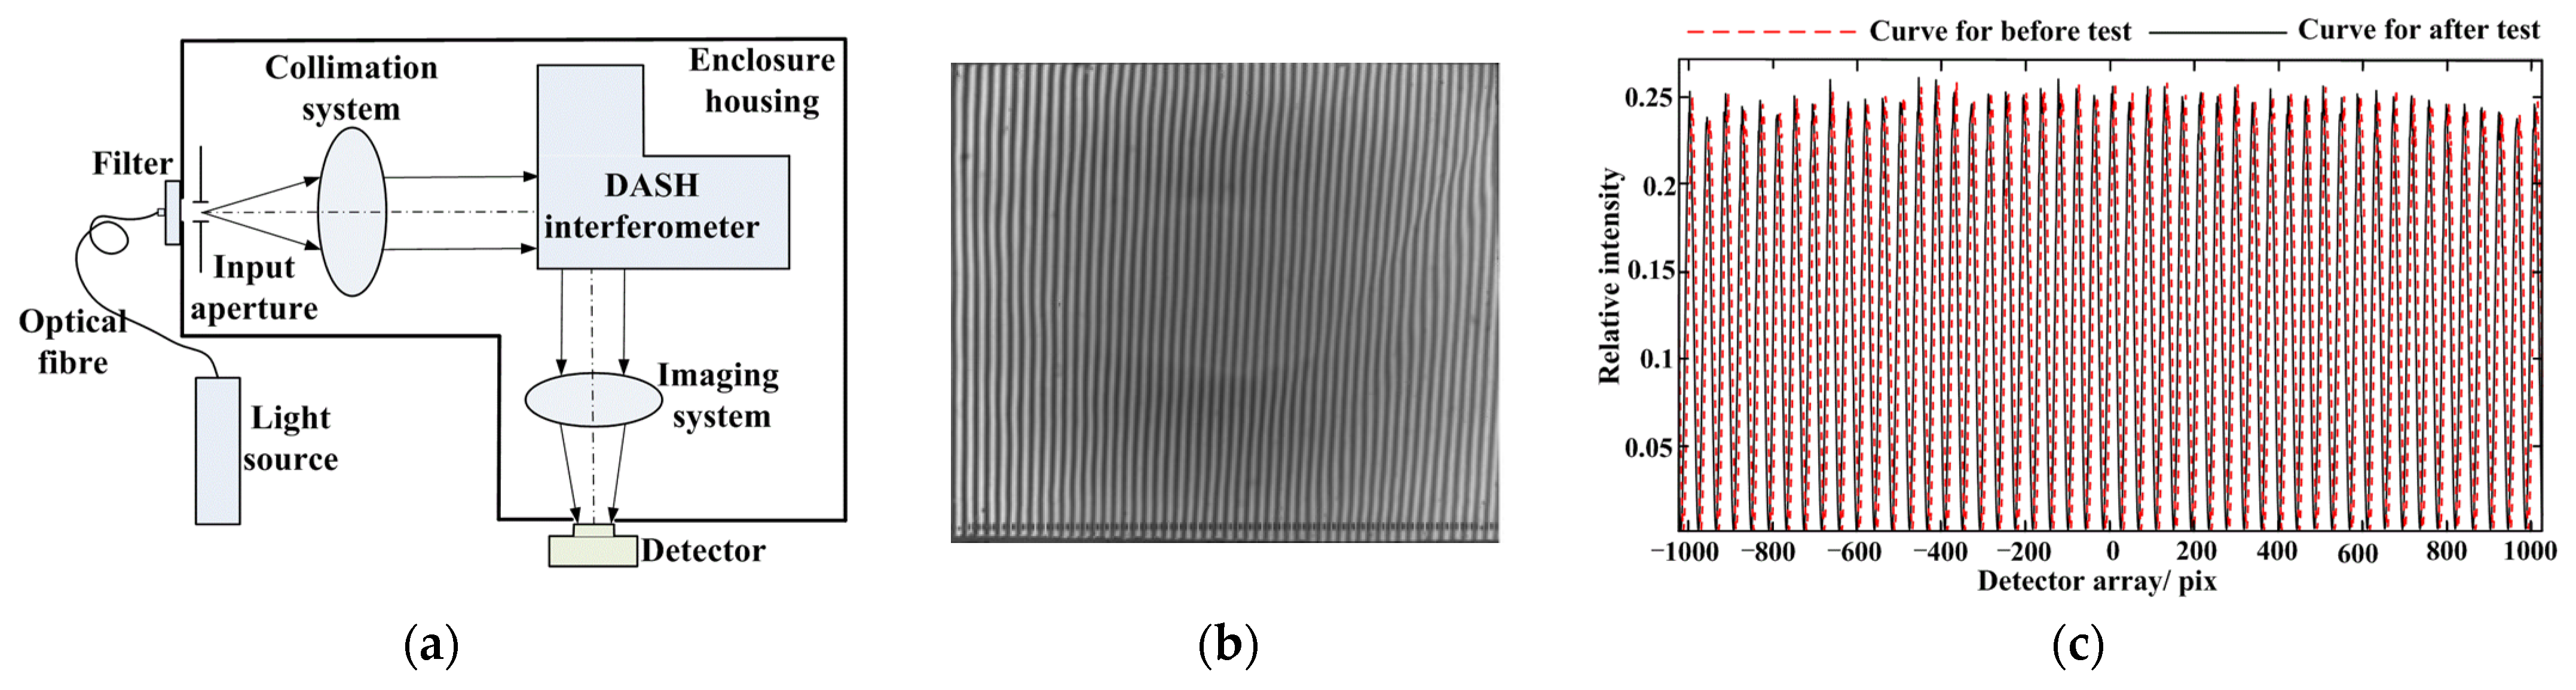
In contrast to existing support structures in the literature, the flexible structure, cover, and base were divided into different parts; therefore, different structural materials could be used. Because the flexible structure must be in direct contact with the BS, it must be made of metal with a low expansion coefficient, whereas the cover and base can be made of TC4 with a low thermal conductivity. Figure 12 shows the difference between the existing structure and the flexible structure. Additionally, the flexible structures were connected to the cover and the base through the wings, which reduced the contact area. These approaches increased the thermal resistance to heat conduction, thereby reducing heat conduction and minimizing the impact of ambient temperature.
Therefore, without considering thermal radiation, the thermal resistance of the DASH interferometer can be calculated as follows [25]:
1 A k = 1 A h + l A λ ,
where k is the heat transfer coefficient, A is the contact area, 1 A k is the thermal resistance, h is the convective heat transfer coefficient, 1 A h is the heat convective resistance, λ is the thermal conductivity, and l A λ is the thermal conductivity resistance.
Assuming that the thermal convection can be ignored in the space environment, Equation (12) indicates that by selecting TC4, a material with a lower thermal conductivity, the thermal conductivity can be reduced by nearly 50%, the contact area can be reduced by 75%, and the thermal resistance of the assembly can be increased 7.5 times.

4. Tests

To verify the accuracy of the theoretical calculation, vibration tests were performed to further test the mechanical stability of the DASH interferometer assembly, including sine sweep and random vibration tests. A sine sweep test was used to test the natural frequencies in three directions, and a random vibration test was used to test the mechanical stability of the assembly. Two acceleration sensors tied to the two arms of the interferometer were used to measure the acceleration response of the optical components. Figure 13 illustrates the positions of the acceleration sensors. As a load, the two sensors had a certain arm’s length that was relative to the flexible structure, and an additional torque was generated during random vibration. Therefore, the finite element model was modified by adding the sensor models. Taking the test values as reference values, the relative error ( δ ) of the natural frequencies in three directions between the FEM and sine sweep test results was less than 4% ( δ = ABS ( S T ) / T ), as summarized in Table 7.
During the random vibration tests, which require a test level of 3.535 g (root mean square value), the results show that the responses in three main vibration directions (X, Y, and Z) were 17.71 g, 23.4 g, and 31.91 g, respectively. Compared with the random vibration test conditions, the corresponding amplifications were 5, 6.6, and 9, respectively. The maximum acceleration response (31.91 g) was consistent with the input conditions of the mathematical model (30 g). The mathematical model results are reliable. The vibration tests indicate that the sine sweep curve was consistent before and after the vibration tests, as shown in Figure 14. The test results show that there was no breakage (metal-to-glass) of the bonding surface, and the interferometer assembly remained undamaged. The maximum mechanical stress was lower than the tensile strength of material. The shear stress at the bonding surface (metal-to-glass gluing) was less than the shear strength of the epoxy adhesive (8217).
The interference fringe frequency did not change (the number of fringes was 50) in the optical tests before and after the vibration test, which directly reveals that there was no breakage in the bonding surfaces between the optical elements, as shown in Figure 15c. Figure 15 shows the schematic of the optical test and interferometer fringe. The shear stress at the bonding surface (glass-to-glass gluing) was less than the shear strength of the epoxy adhesive (NOA61). Therefore, the proposed flexible support structure of the DASH interferometer could meet the requirement of the launch environment.

5. Conclusions

By far, the greatest part of the vibrational energy was produced at lower frequencies. Therefore, in order to improve mechanical performance, an effort can be made to ensure that all the natural frequencies of the mount springs are as high as possible. In existing approaches, as the dimensions of the DASH interferometer increase, the natural frequency of the assembly can only be increased by increasing the adhesive area. As an example, a space-borne NIR DASH interferometer assembly’s bonding surface was found to be detached during the vibration testing at the instrument level because of the lower natural frequency. Therefore, a large-sized interferometer cannot be stably mounted by improving natural frequency. In this study, by taking the mechanical stress of a flexible structure and shear stress at the bonding surface as the target, its dimensions and phase position could be optimized for an NIR DASH interferometer (as an example). Compared with the existing structure, the optical elements and flexures moved together during the vibration tests, and the maximum stress was located at the wing of the flexible structure. However, the maximum stress on the mechanical elements in the present structure was higher than that in the previous works, which was lower than the tensile strength of the material. The adhesive area and maximum shear stress at the bonding surface were decreased by adjusting natural frequencies of the assembly. In the proposed method, the mechanical material and adhesive area were optimally designed. Therefore, the thermal resistance of the assembly was improved by 7.5 times, which could help to minimize the impact of ambient temperature. The test results indicate that the DASH interferometer assembly was undamaged before and after the tests. The proposed design of flexible structures can be used in space-borne wind measurement instruments. Similarly, the approach presented can also be used to mount large-sized prisms.
Moreover, the form of a flexible structure is not limited to one type of application, where it needs to be redesigned according to the vibration mode of the interferometer. As the spectral resolution increased, the dimension of the DASH interferometer increased, which caused the shape of the wing to change. The flexible structure at the bonding surface was no longer needed, which existed in the design of a short infrared wave DASH interferometer. Similarly, as the columns in the frame structure were also related to the vibration mode of the interferometer, the columns of other interferometers or prisms need to be redesigned.

Author Contributions

Conceptualization, J.S. and Y.F.; methodology, J.S. and W.W.; simulation, J.S. and C.C.; tests, J.S., X.H., and B.H.; data curation, D.F and J.L.; writing—original draft preparation, J.S. and D.F.; writing—review and editing, J.S.; funding acquisition, Y.F. and W.W. All authors have read and agreed to the published version of the manuscript.

Funding

This research was funded by the National Natural Science Foundation of China (41005019), the West Light Foundation of the Chinese Academy of Sciences (XAB 2016A07), and the West Light Cross-Disciplinary Innovation team of the Chinese Academy of Sciences (E1294301).

Institutional Review Board Statement

Not applicable.

Informed Consent Statement

Not applicable.

Data Availability Statement

Not applicable.

Conflicts of Interest

The authors declare no conflict of interest.

References

  1. Erdogan, E.; Altunbas, I.; Kurt, G.K.; Yanikomeroglu, H. Cooperation in space: HAPS-aided optical inter-satellite connectivity with opportunistic scheduling. IEEE Commun. 2022, 26, 882–886. [Google Scholar] [CrossRef]
  2. Mirza, J.; Atieh, A.; Menhas, M.I.; Ghafoor, S.; Magam, M.; Jamal, L.; Sheikh, S.I.M.; Qureshi, K.L. Design of an efficient thulium-doped fiber amplifier for dual-hop earth to satellite optical wireless links. Ain Shams Eng. J. 2023, 14, 101983. [Google Scholar] [CrossRef]
  3. Skinner, W.R.; Hays, P.B.; Grassl, H.J.; Gell, D.A.; Burrage, M.D.; Marshall, A.R.; Ortland, D.A. High-resolution Doppler imager on the upper atmosphere research satellite. SPIE Proc. 1994, 2266, 281–293. [Google Scholar]
  4. Skinner, W.R.; Niciejewski, R.J.; Killeen, T.L.; Solomon, S.C.; Gablehouse, D.; Wu, Q.; Ortland, D.; Gell, D.A.; Marshall, A.R.; Edwin, W., Jr.; et al. Operational performance of the TIMED Doppler interferometer (TIDI). Proc. SPIE 2003, 5157, 47–51. [Google Scholar]
  5. Marr, K.D.; Thayer, A.S.; Englert, C.R.; Harlander, J.M. Determining the thermomechanical image shift for the MIGHTI instrument on the NASA-ICON satellite. Opt. Eng. 2022, 59, 013102. [Google Scholar]
  6. Shepherd, G. Application of Doppler Michelson imaging to upper atmospheric wind measurement: WINDII and beyond. Appl. Opt. 1996, 35, 2764–2773. [Google Scholar] [CrossRef]
  7. Engler, C.R.; Harlander, J.M.; Marr, K.D.; Harding, B.J.; Makela, J.J.; Fae, T.; Brown, C.M.; Ratnam, M.V.; Rao, S.V.B.; Immel, T.J. Michelson interferometer for Global High-Resolution Thermospheric Imaging (MIGHTI) on-orbit wind observations: Data analysis and instrument performance. Space Sci. Rev. 2023, 219, 27. [Google Scholar] [CrossRef]
  8. Englert, C.R.; Babcock, D.D.; Harlander, J.M. Doppler Asymmetric Spatial Heterodyne Spectroscopy (DASH): An innovative concept for measuring winds in planetary atmospheres. SPIE Proc. 2006, 6303, 272–279. [Google Scholar] [CrossRef]
  9. Olyaee, S.; Nejad, S.M. Nonlinearity and frequency-path modeling of three-longitudinal-mode nanometric displacement measurement system. IET Optoeletron. 2007, 1, 211–220. [Google Scholar] [CrossRef]
  10. Killeen, T.L.; Fuller-Rowel, T.L.; Lyons, A.; Killeen, T.L.; Hays, P.B. Stable and rugged etalon for the Dynamics Explore Fabry-Perot interferometer 1: Design and construction. Appl. Opt. 1982, 21, 3896–3902. [Google Scholar] [CrossRef]
  11. Li, X.; Yuan, Y.; Zhao, J. Microstress installation and experiment result of the interferometer. Acta Photonica Sin. 2007, 36, 918–921. [Google Scholar]
  12. Englert, C.R. Compression Assembly of Spatial Heterodyne Spectrometer (SHS). US Patent 0.7535572, 19 May 2009. [Google Scholar]
  13. Harlander, J.M.; Englert, C.R.; Babcock, D.D.; Roesler, F.L. Design and laboratory tests of a Doppler Asymmetric Spatial Heterodyne (DASH) interferometer for upper atmospheric wind and temperature observations. Opt. Express 2010, 18, 26430–26440. [Google Scholar] [CrossRef] [PubMed]
  14. Bai, Y.; Sun, J.; Hao, X.; Wu, J.; Bai, Q.; Feng, Y. Design of stable satellite-borne Doppler asymmetric spatial heterodyne interferometer support structure. Acta Photon. Sin. 2018, 47, 2–8. [Google Scholar]
  15. Reutlinger, A. Glue test results for high-precision large cryogenic lens holder. SPIE Proc. 2012, 8450, 756–767. [Google Scholar] [CrossRef]
  16. Hu, R.; Liu, S.; Li, Q. Topology-optimization-based design method of flexures for mounting the primary mirror of a large-aperture space telescope. Appl. Opt. 2017, 56, 4551–4560. [Google Scholar] [CrossRef]
  17. Yuan, L.; Xie, J.; He, Z.; Wang, Y.; Wang, J. Optical design and evaluation of airborne prism-grating imaging spectrometer. Opt. Express 2019, 27, 17686–17700. [Google Scholar] [CrossRef]
  18. Glier, M.; Mezger, A.; Bogner, S.; Erhard, M.; Altbauer, A. High precision assembling process and optomechanical characterization of the optical subassemblies for the EMAP hyper spectral imager instrument. SPIE Proc. 2017, 10562, 1056224. [Google Scholar]
  19. Zhang, W.; Liu, Z.; Wang, H.; Chen, Y.; Wang, Y.; Zhao, Z.; Sun, T. Research status of spatial Heterodyne spectroscopy-A review. Microchem. J. 2021, 166, 106228. [Google Scholar] [CrossRef]
  20. Zhang, Y.; Feng, Y.; Fu, D.; Wang, P.; Sun, J.; Bai, Q. Dependence of interferogram phase on incident wavenumber and phase stability of Doppler asymmetric spatial heterodyne spectroscopy. Chin. Phys. B. 2020, 29, 298–303. [Google Scholar] [CrossRef]
  21. Chang, C.; Fu, D.; Zhao, H.; Hao, X.; Li, J.; Wang, P.; Sun, J.; Feng, X.; Kong, L.; Feng, Y. Research on thermal stability of monolithic near-infrared Doppler asymmetric spatial heterodyne interferometer. Opt. Eng. 2023, 62, 015104. [Google Scholar] [CrossRef]
  22. Wei, D.; Zhu, Y.; Liu, J.; Gong, Q.; Kaufmann, M.; Olschewski, F.; Knieling, P.; Xu, J.; Koppmann, R.; Riese, M. Thermal stable monolithic Doppler asymmetric spatial heterodyne interferometer: Optical design and laboratory performance. Opt. Express 2020, 48, 19887–19900. [Google Scholar] [CrossRef] [PubMed]
  23. Englert, C.R.; Brown, C.M.; Bach, B.; Bach, E.; Bach, K.; Harlander, J.M.; Seely, J.F.; Marr, K.D.; Miller, I. High-efficiency echelle gratings for MIGHTI, the spatial heterodyne interferometers for ICON mission. Appl. Opt. 2017, 56, 2090–2098. [Google Scholar] [CrossRef] [PubMed]
  24. Yoder, P.R. Opto-Mechanical Systems Design, 4th ed.; China Machine Press: Beijing, China, 2008; p. 408. [Google Scholar]
  25. Yang, S.; Tao, W. Heat Transfer, 4th ed.; Higher Education: Beijing, China, 2016; p. 14. [Google Scholar]
Figure 1. Schematic of the DASH interferometer technique.
Applsci 13 10446 g001
Figure 2. DASH interferometer: (a) schematic; (b) photograph.
Applsci 13 10446 g002
Figure 3. Diagram of the flexible structure: (a) model of flexible structure; (b) schematic of DASH interferometer assembly.
Applsci 13 10446 g003
Figure 4. Optimization process of parameters.
Applsci 13 10446 g004
Figure 5. Structural schematic: (a) interferometer cover; (b) interferometer base.
Applsci 13 10446 g005
Figure 6. Diagram of columns.
Applsci 13 10446 g006
Figure 7. Relationship between the slope angle and natural frequencies in the three directions.
Applsci 13 10446 g007
Figure 8. Schematic showcasing the geometry of the flexible structure.
Applsci 13 10446 g008
Figure 9. Schematic illustration of the bonding surface bowing effect.
Applsci 13 10446 g009
Figure 10. Phase of flexible structures (90° phase).
Applsci 13 10446 g010
Figure 11. Deformation of the interferometer assembly.
Applsci 13 10446 g011
Figure 12. Structural schematic: (a) existing structure; (b) flexible structure.
Applsci 13 10446 g012
Figure 13. Photograph of the interferometer assembly in near infrared (vibration testing).
Applsci 13 10446 g013
Figure 14. Sweep sine curve before and after the test.
Applsci 13 10446 g014
Figure 15. Schematic of optical test before and after the tests: (a) schematic of optical test; (b) interference fringe; (c) fringe frequencies before and after the tests.
Applsci 13 10446 g015
Table 1. Structure for mounting the interferometer.
StructureAdvantageLimitation
Mounting an FPI with six epoxy padsMicro-stress mounting with low heat conductionMounting an interferometer with a rotationally symmetric structure
Mesh bonding surface for mounting the Sagnac interferometer prismMicro-stress mountingLarger bonding area
Three loaded plungers and precision spacers for mounting split SHSThermally stable mountingUsed in lab instrument
Combination of four bonding surfaces for mounting DASHStable mounting by improving natural frequencyUsed in mounting a normal-sized DASH interferometer
Side adhesive structureSupport large optical componentsUsed to support large transmission and reflection prisms
Proposed flexible structureMicro-stress mounting structure with low heat conduction to support a large-sized interferometer-
Table 2. DASH interferometer design parameters.
ElementMaterialDesign ParametersValue
Beam Splitter (BS1 and BS2)Fused silicaSize60 × 60 × 50 mm
Wedged Spacer (S1)Fused silicaThickness at center4.73 mm
Wedged Spacer (S2)CaF2Thickness at center15.66 mm
Prisms (P1)N-SF57Wedge angle
Thickness at center
7.84°
10.14 mm
Prisms (P2)N-SF57Wedge angle
Thickness at center
7.84°
29.72 mm
Parallel Spacers (PPS)Fused silicaThickness at center6 mm
Grating (G1 and G2)Fused silicaGroove density
Blaze angle
400 gr/mm
10°
Table 3. Spring constants and natural frequencies in three directions.
ParameterValue
KTX17,527 N/mm
KTY18,322 N/mm
KTZ40,050 N/mm
fy666.65 Hz
fy681.61 Hz
fz1007.72 Hz
Table 4. Properties of primary materials used in the DASH interferometer assembly.
ElementDensity/kg·m−3Young’s Modulus/GPaPoisson’s Ratio
TC444001090.28
Invar81001450.25
Fused silica220073.10.2
CaF2318075.80.28
N-SF573500960.26
Glue1140.2
Table 5. Natural frequencies of FEM.
DirectionNatural Frequencies (Hz)
Structural FrameDASH Interferometer
X1066634
Y1187686
Z2672939
Table 6. Space-borne random vibration test conditions of assembly.
Frequency Range (Hz)Acceleration Power Spectral Density (g2·Hz−1)
20–1900.00335
190–5000.015
500–7500.01125
750–20000.0005
Table 7. Comparison of natural frequencies of modal analysis and test.
DirectionNatural Frequencies (Hz)Error (δ)
FEM (S)Test (T)
X634649.72.4%
Y686669.82.4%
Z942979.23.8%
Disclaimer/Publisher’s Note: The statements, opinions and data contained in all publications are solely those of the individual author(s) and contributor(s) and not of MDPI and/or the editor(s). MDPI and/or the editor(s) disclaim responsibility for any injury to people or property resulting from any ideas, methods, instructions or products referred to in the content.

