Abstract
The nonlinear Kerr effect and chromatic dispersion are the fundamental causes of optical signal degradation in single-mode fiber (SMF) and erbium-doped fiber-amplification (EDFA)-based wavelength division multiplexing (WDM) transmission. Dispersion management combined with a midway optical phase conjugator among the technologies for compensating for such optical signal distortion is known to not be limited by the modulation format and multiplexing technology. Optimization of the dispersion map can partially alleviate the capacity and maximum transmission distance limitations of the SMF and EDFA system. In this paper, we propose various types of symmetric dispersion maps in which the position of zero-crossing place of the cumulative dispersion is not constant, and analyze the effect of each dispersion map configuration on 40 Gb/s × 24-channel WDM signal distortion compensation. When designed with the residual dispersion per span (RDPS) around 400 ps/nm, it is confirmed that most of the proposed dispersion maps are more effective in compensating the distorted WDM signal than conventional dispersion map. In particular, we confirm that, among the proposed dispersion maps, the dispersion map in which the RDPS is designed uniformly for all fiber spans can increase the power margin of WDM channel and expand the range of the total residual dispersion in the dispersion-managed link.
1. Introduction
With the help of multiplexing technologies such as wavelength division multiplexing (WDM), polarization division multiplexing (PDM), space division multiplexing (SDM), orbital angular momentum multiplexing (OAMM), most Internet traffic is handled through an optical network [1]. In order to increase the multiplexing efficiency of high data rate optical channels in a long-haul optical network, a transmission medium that minimizes temporal broadening of optical signals during transmission must be used.
Dispersion that affects the temporal broadening of optical pulses is largely divided into inter-modal dispersion and intra-modal dispersion. When there are several modes propagating in an optical fiber core, the spread of pulses caused by the time difference between each arriving at the receiving end is called inter-mode dispersion. Thus, in order to suppress this, a single-mode fiber (SMF) is mainly used as a transmission medium of long-haul optical networks. However, even an optical network comprising a transmission link using only SMF cannot avoid the temporal spread due to intra-mode dispersion, also called chromatic dispersion. Moreover, since different wavelengths are used for each channel in the WDM system, signal distortion due to chromatic dispersion inevitably increases as the number of transmission channels within the same SMF increases [2]. Therefore, in order to implement an SMF-based WDM transmission network, a technique for minimizing signal distortion due to chromatic dispersion must be applied.
The application of an erbium-doped fiber amplifier (EDFA) in optical transmission links has also made a great contribution to the long distance of super-multiplexed optical signals. That is, the EDFA dramatically increased the transmission distance without requiring a repeater, and eventually made it possible to use the SMF-based WDM network more simply, compactly, and economically [2]. Unfortunately, the EDFAs in an optical link amplify the intensity of the transmitted optical signal, and consequently induce the intensity-dependent nonlinear impairment of optical signals [3]. In an optically amplified and SMF-based transmission system, optical signal distortion due to nonlinear effects and chromatic dispersion effects may increase as the transmission distance increases, since the accumulated impacts of nonlinear effect interplaying with chromatic dispersion of SMF are not reset at the repeaters [2].
Optical phase conjugation (OPC), proposed by Yariv et al., was initially widely known as a method for compensating for chromatic dispersion [4]. It uses the principle of compensating for the signal distortion by inverting the spectrum of the transmission signal in the middle of the transmission link. That is, the signal distortion experienced in the front part of the link before the optical phase conjugator (OPC) is offset with damage caused in the rear part after the OPC, so that the original signal can be closely restored. It has been experimentally shown that OPC can compensate not only chromatic dispersion but also distortions caused by self-phase modulation (SPM), intra-channel nonlinear effect and nonlinear phase noise [5,6,7,8,9].
Dispersion management (DM) is method of mitigating signal distortion due to chromatic dispersion using only optical fibers [10]. When SMF is adopted as an optical transmission medium, since its dispersion coefficient is positive (typically +17 ps/nm/km), the optical pulse width increases as the transmission distance increases, ultimately resulting in inter-symbol interference (ISI). In order to eliminate or reduce the ISI, dispersion compensation fibers (DCFs) having the negative dispersion coefficient must be added at regular intervals or concentrated at a specific location in the transmission link so that the total cumulative dispersion is close to 0 ps/nm. In the DM link, the cumulative dispersion profile according to the entire transmission distance can be designed considering the positions, dispersion coefficient, and length of the SMF and DCF. This profile is called the dispersion map [11]. It has been reported that nonlinear impact in EDFA-based can be well suppressed through the dispersion map optimization [3].
Through previous studies, the authors also confirmed that the dispersion map optimization has significant effect on signal distortion compensation in SMF-based WDM systems [12,13]. Furthermore, even in the system where the OPC is not located in the middle of the entire transmission line (i.e., non-midway OPC system), we have confirmed that the improved compensation for the entire WDM signal can be obtained by applying a properly designed dispersion map considering the WDM channel data-rate, modulation format, and OPC location [13].
In this study, in the SMF-based WDM system with midway-OPC, the distortion compensation effect of the WDM signal is numerically analyzed through the application of the new-conceptual dispersion map, which the authors know has not been tried before. Unlike previously proposed methods, the dispersion maps evaluated in this study have the non-uniform structure where the zero-crossing place of cumulative dispersion is not constant. More specifically, we aim to examine the effect of various dispersion maps designed so that the cumulative dispersion is zero-crossing only at the 2nd, 4th, 8th, and 16th fiber span in each half transmission link (i.e., transmission link before or after midway-OPC) consisting of 30 fiber spans, on the distortion compensation of WDM channels.
2. Dispersion-Managed Link and WDM System Modelling
2.1. Dispersion-Managed Link
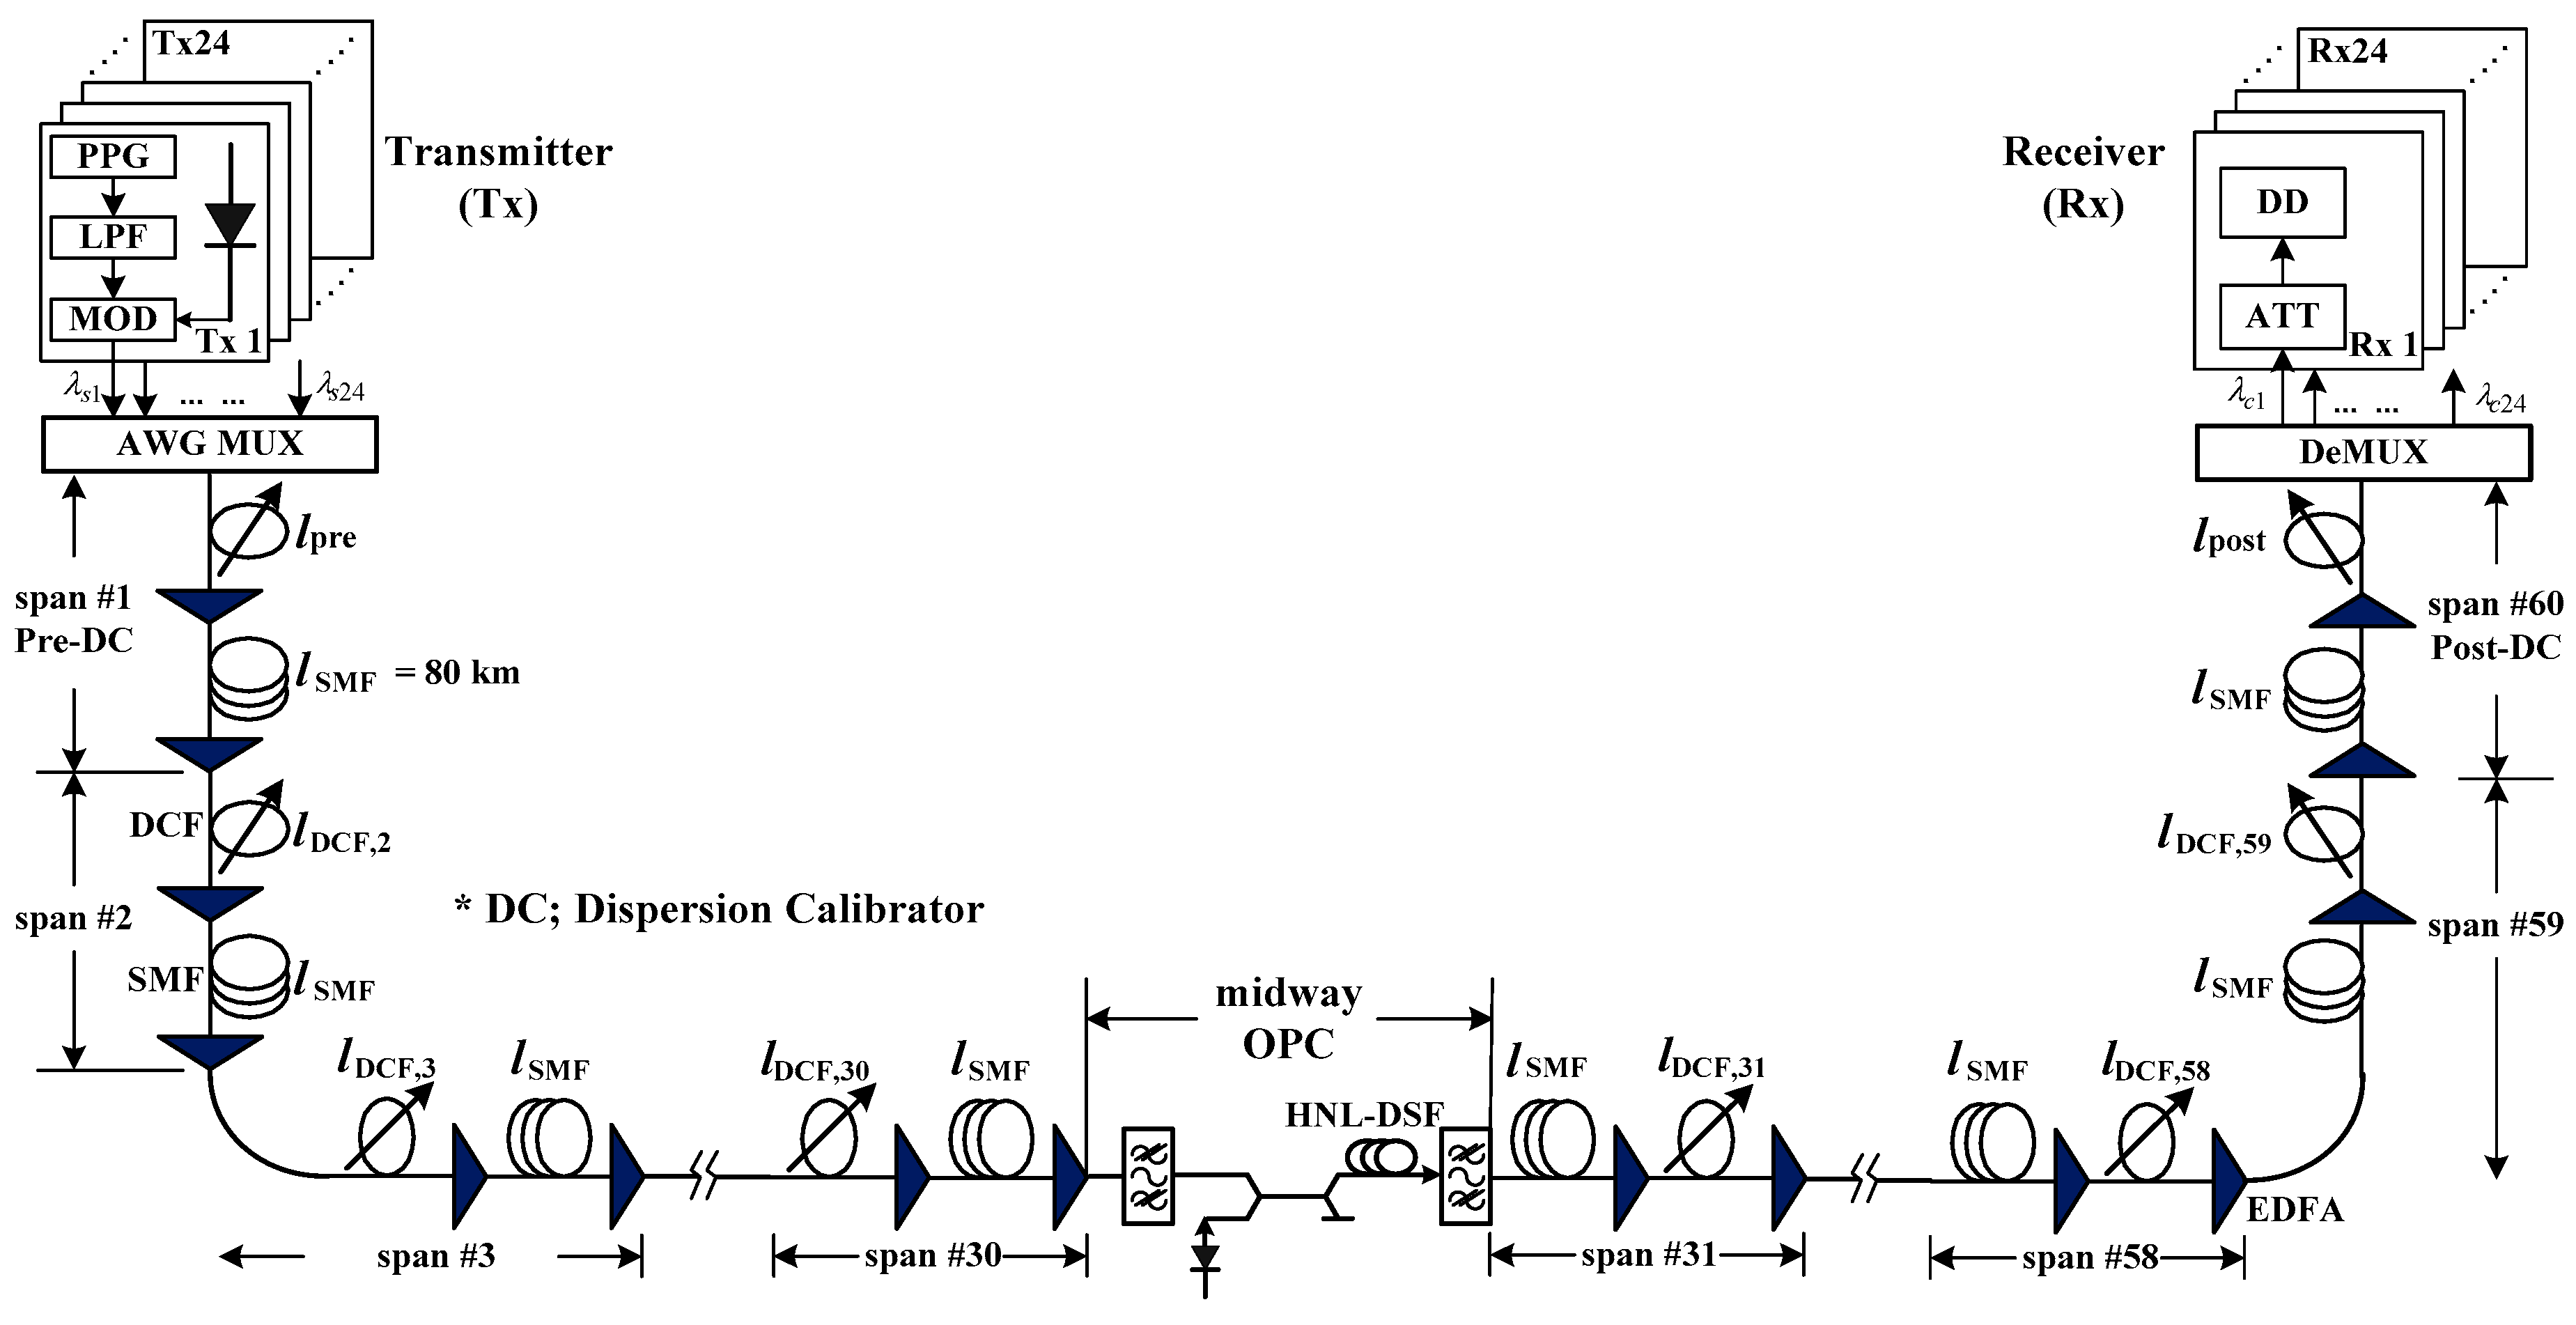
Figure 1 shows the WDM system and dispersion-managed optical transmission link to be analyzed through simulation in this paper. OPC is located in the middle of the entire transmission link in Figure 1. As will be mentioned later, the number of WDM channels transmitted over the link is 24, and the data rate of each channel is assumed to be 40 Gb/s.
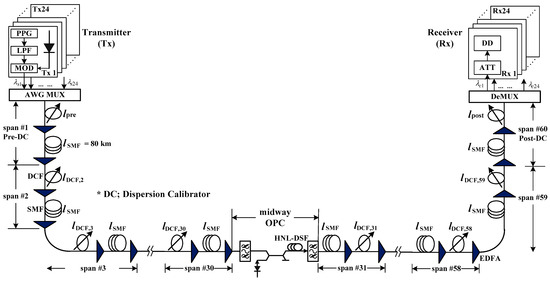
Figure 1.
The 40 Gb/s × 24 channels WDM transmission system through the dispersion-managed link and the midway-OPC.
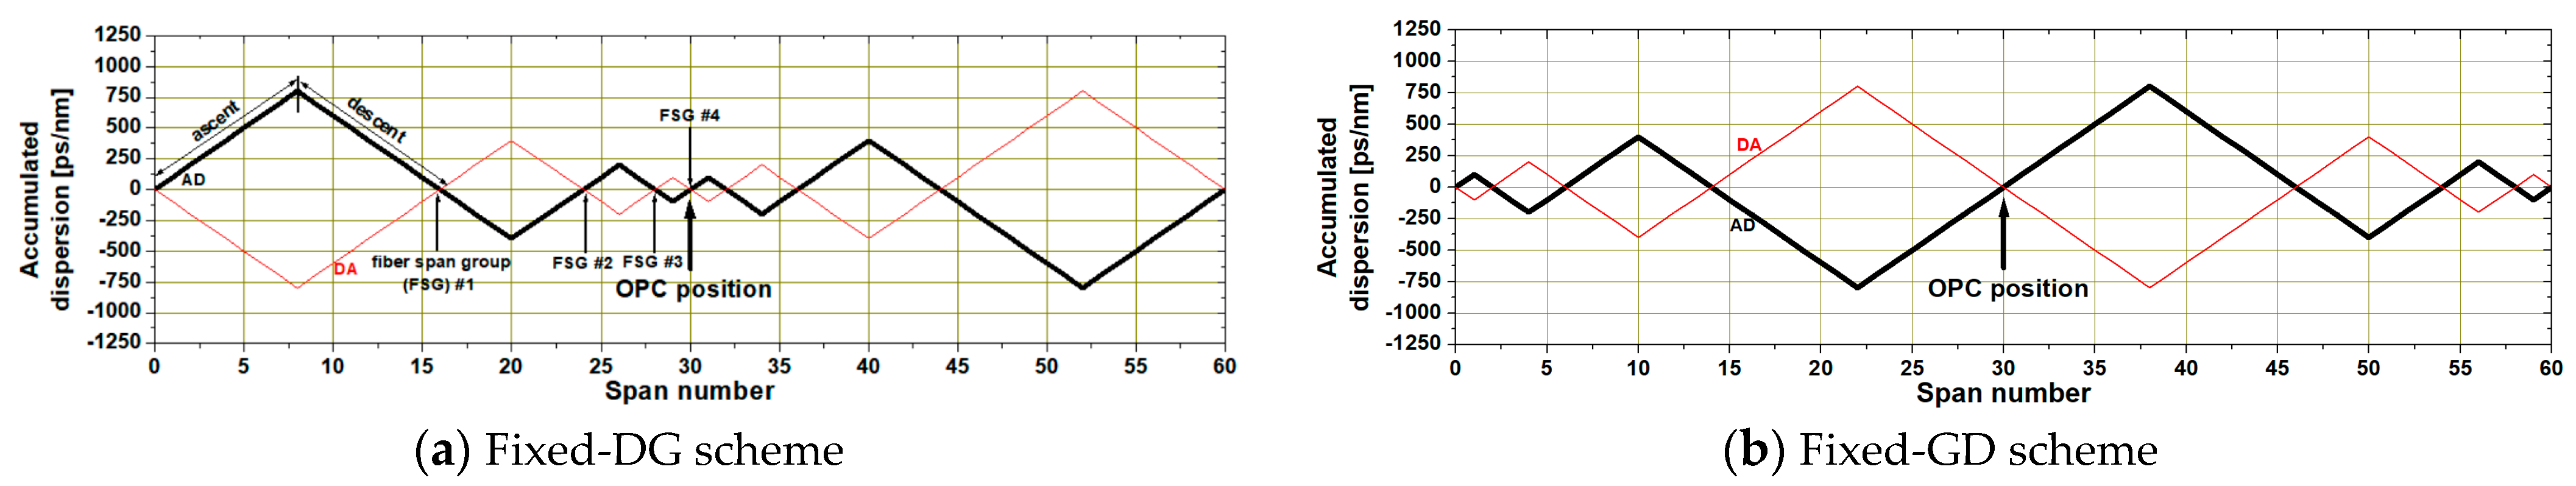
Though dispersion management is achieved by DCF added to all fiber spans of the first and second half-links with respect to midway-OPC, the dispersion maps are designed so that the cumulative dispersion becomes 0 ps/nm repeatedly at intervals of the fiber span group (FSG) as shown in Figure 2, rather than a structure in which the cumulative dispersion becomes 0 ps/nm for each fiber span. We divide these FSG spacings non-uniformly into 2, 4, 8, and 16 for each half-link. In other words, as shown in Figure 2, the zero-crossing place of cumulative dispersion in each half-link is not constant. Also, as can be seen in Figure 2, the dispersion maps are designed so that the zero-crossing places of cumulative dispersion in the first and the second half-link are symmetrical to each other with respect to midway-OPC. That is, if the zero-crossings of the cumulative dispersion occurs at the 2nd, 4th, 8th, and 16th fiber spans in the first half-link, then the zero-crossings in the second half-link must correspondingly occur in the order of 16th, 8th, 4th, and 2nd fiber spans. This dispersion map structure is hereafter referred to as the growth-decaying (GD) scheme, and in this paper, we simultaneously analyze the decaying-growth (DG) scheme, where the zero-crossing of the cumulative dispersion in each half-link is opposite to the GD scheme.
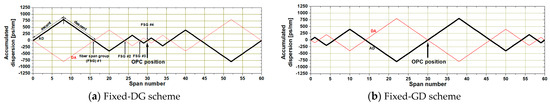
Figure 2.
The proposed dispersion maps.
The dispersion map proposed in this study has another symmetry. This symmetry is made by the cumulative dispersion distribution of successive FSGs. When the cumulative dispersion of the first FSG increases linearly to the middle point and then decreases, the cumulative dispersion of the next FSG decreases and then increases with the same slope. Also, the cumulative dispersion profile of consecutive FSGs configured in this way is symmetrical about the midway-OPC. In this paper, this symmetry has two forms for all proposed dispersion maps. In order to distinguish these two types, we denote AD (ascent–descent) and DA (descent–ascent) according to the distribution shape of the cumulative dispersion in the first FSG, as shown in Figure 2.
The last factor considered to analyze the effect of the proposed dispersion maps on WDM channel distortion compensation is the increase/decrease rate of dispersion accumulated in the FSGs. The increase and decrease in the accumulated dispersion depends on the magnitude and sign of the residual dispersion of each fiber span. As shown in Figure 2, the cumulative dispersion reversal occurs at each intermediate position of all FSGs. And, as mentioned above, the number of fiber spans constituting the FSG in which zero-crossing of cumulative dispersion occurs is 2, 4, 8, and 16 in each half-link. Based on these features, the dispersion maps classified into the following four cases.
The first case is that the residual dispersion assigned to all fiber spans is assumed to be same for all FSGs. The dispersion maps shown in Figure 2a,b correspond to the first case. Analyzing the dispersion map of Figure 2a, the rate of increase/decrease in the cumulative dispersion in all FSGs is the same regardless of the number of the fiber spans each FSG has. That is, if the rate of the cumulative dispersion in an FSG consisting of two fiber spans is ±100 (ps/nm)/span, the increase/decrease rates of the cumulative dispersion in all other FSGs also have the same value. For this reason, we will call the dispersion map in Figure 2a,b the ‘fixed’ scheme.
The remaining three cases are structures that determine the magnitude of the residual dispersion allocated to each fiber span in relation to the number of fiber spans of the four FSGs arranged in each half-link. More specifically, based on the magnitude of the residual dispersion allocated to one fiber span in the FSG with the smallest number of fiber spans (this is called ‘reference residual dispersion’ (abbreviated as ‘rRD’)), the magnitude of the residual dispersion allocated to each fiber span constituting the other three FSGs is obtained by artificially changing the rRD magnitude depending on the number of fiber spans of the corresponding FSG.
In the dispersion map shown in Figure 2c, the residual dispersion magnitudes of each fiber span of the FSG with 4 fiber spans, with 8 fiber spans, and with 16 fiber spans in each half-link are obtained by multiplying the magnitude of the rRD by 2, 4, and 8 times, respectively. In this dispersion map, if the increase/decrease rate of cumulative dispersion in FSG with 2 fiber spans is ±100 (ps/nm)/span, then the increase/decrease rate of cumulative dispersion in FSGs with 4, 8, and 16 fiber spans has values of ±200 (ps/nm)/span, ±400 (ps/nm)/span and ±800 (ps/nm)/span, respectively. For this reason, we will call the dispersion map in Figure 2c,d the ‘squared’ scheme. In the dispersion map shown in Figure 2e,f, the residual dispersion magnitudes of each fiber span of the FSG with 4 fiber spans, with 8 fiber spans, and with 16 fiber spans in each half-link are obtained by multiplying the magnitude of the rRD by 2, 3, and 4 times, respectively. In this case, because the increase/decrease rate of the cumulative dispersion in each FSG is 2, 3, and 4 times of FSG with 2 fiber spans, respectively, these will be called to the ‘linear’ scheme.
The last dispersion map considered in this study is the ‘flatted’ scheme shown in Figure 2g,h, because the maximum and minimum cumulative dispersion of each FSG are constant, unlike other dispersion maps. This dispersion map can be obtained by allocating the values corresponding to 1/2, 1/4, and 1/8 times of the magnitude of the rRD as the residual dispersion magnitude of each fiber span of FSGs with 4, 8, and 16 fiber spans, respectively.
In summary, there are 16 types of dispersion maps proposed in this paper for compensation of distorted WDM channel signals according to the detailed configuration methods described so far. For the convenience of analyzing the simulation results, we classify and express the 16 dispersion maps in Figure 2 as “the variation rate of rRD for each FSG—the deployment pattern of zero-crossing places: shape of unit dispersion map”, for example, “fixed-DG: AD”, “linear-GD: AD”, “flatted-DG: DA”, etc.
The shape of the 16 dispersion maps shown in Figure 2 is determined by appropriate selection of the lengths and dispersion coefficients of the SMF and DCF constituting the transmission link. In this paper, the length and the dispersion coefficient of SMF (lSMF and DSMF) are assumed to be 80 km and 17 ps/nm/km, respectively, and the dispersion coefficient of DCF (DDCF) is assumed to be −100 ps/nm/km in all fiber spans. However, to adjust the cumulative dispersion and the shape of the specific dispersion map, only the DCF length of each fiber span (lDCF) is varied by the equation below.
where RD means the residual dispersion of each fiber span.
Other characteristics of SMF and DCF assumed in this paper are as follows: the attenuation coefficient of SMF is 0.2 dB/km, the nonlinear coefficient of SMF is 1.35 W−1km−1 at 1550 nm, the attenuation coefficient of DCF is 0.6 dB/km, and nonlinear coefficient of DCF is 5.06 W−1km−1 at 1550 nm.
In all 16 dispersion maps analyzed in this paper, the deployment order of SMF and DCF is opposite to each other with respect to the midway-OPC, as can be seen in the transmission link shown of Figure 1. That is, all dispersion maps are obtained from a structure in which DCF is always placed before SMF in all fiber spans of the first half-link, whereas DCF is always placed after SMF in all fiber spans of the latter half-link. The most fundamental reason for reversing the arrangement order of each fiber is to further strengthen the symmetry of the dispersion profile with respect to the middle of the entire transmission link, which is the basic condition of applying optical phase conjugation into an optical link.
And this deployment of optical fibers is to help achieve another purpose. Xiao et al. have reported that the best compensation of a distorted optical signal in a pseudo-linear system over a dispersion-managed link is that the total residual dispersion (TRD) is not 0 ps/nm but near 0 ps/nm, and the authors’ previous studies have confirmed this result. All of the dispersion maps proposed in this study have a structure in which the overall dispersion profile is obtained by successive combinations of the unit dispersion profiles made by each of the four FSGs in each half-link. Since the cumulative dispersion of these four FSGs is 0 ps/nm, the TRD in the half-link also becomes 0 ps/nm, making it difficult to achieve the best compensation condition for the distorted WDM channel. Therefore, in the proposed dispersion-managed link of Figure 1, the TRD should be set to a value other than 0 ps/nm by using any one fiber span. We make the first fiber span in the first half-link or the last fiber span in the second half-link play this role. To be more precise, the variation of the TRD in the overall link for searching the optimal dispersion is set by correspondingly adjusting only the DCF length of the first or last fiber span under the respective circumstances where the TRD in the second or first half-link is set to 0 ps/nm. We define the methods for adjusting the TRD only with the DCF lengths of the first and last fiber span as pre-DC (dispersion calibrator) and post-DC, respectively.
2.2. WDM Transmitters, Recivers and Midway-OPC
The WDM transmitters and receivers located at both ends of the link in Figure 1 are based on intensity modulation (IM) and direct detection (DD), respectively. First, in each transmitter, data bits generated by 127 (=27−1) pseudo-random bit sequence (PRBS) intensity-modulate light from distributed feedback laser diode (DFB-LD) in modulator. The output electric field of intensity-modulated 127-bit signals is modeled in return-to-zero (RZ) format with 10-dB extinction ratio (ER) and duty cycle of 0.5. It is also assumed that these RZ pulses are frequency chirp-free. We assume that the center wavelength of each channel is 1550 nm to 1568.4 nm with 100 GHz (0.8 nm) spacing, based on ITU-T Recommendation G.694.1.
The signals of these 24 channels with different wavelengths are multiplexed in the AWG-MUX and propagate through the first half-link consisting of 30 fiber spans. The chromatic dispersion is somewhat compensated by the dispersion management applied to each fiber span, but distortion due to the interaction between the Kerr nonlinearity and the residual chromatic dispersion is unavoidable. The multiplexed signals distorted while propagating through the first half-link are converted into phase-conjugated signals at the midway-OPC and propagated through the remaining second half-link. The received signals can be restored similarly to the original signals, as the conjugated signals effectively experience the effects of the interaction of Kerr nonlinearity and chromatic dispersion in the second half-link.
Phase-conjugation in midway-OPC is generated through the process of four-wave mixing (FWM) of the input multiplexed signal and the pump light in a highly nonlinear dispersion-shifted fiber (HNL-DSF) as a nonlinear medium for phase-conjugation. The power and wavelength of the pump light for generating the phase-conjugated waves are assumed to be 18.5 dBm and 1549.75 nm, respectively. Consequently, each wavelength of the conjugated 24 channels in the midway-OPC is then arranged from 1549.5 nm to 1528.5 nm (−0.8 nm interval).
Each channel demultiplexed through DeMUX is finally received after optical and electrical processing based on the DD method. We assume that the receiver bandwidth is 0.65 times 40 Gb/s. The WDM receiver is comprised of an EDFA with a noise figure of 5 dB, optical filter, PIN diode as photodetector, pulse-shaping Butterworth filter, and decision circuit.
3. Simulation Method and Numerical Assessment
The characteristics of optical signal propagating in a medium dominated by loss, dispersion and nonlinearity can be expressed by the nonlinear Schrödinger equation (NLSE). Expressing NLSE as a slowly varying envelope approximation is as follows:
where j, k = 1, 2, …, 24 (j ≠ k), Aj represents the complex amplitude of the signal of the j-th channel, z is the propagation distance, β2j is the GVD, β3j is third-order dispersion, γj is the nonlinear coefficient, and T = t − z/vj is the time measured in a retarded frame.
The last two terms in (2) represent Kerr nonlinear effects, which are corresponding to self-phase modulation (SPM) and cross-phase modulation (XPM), respectively. It has been reported that the effect of XPM on WDM signals decreases as the dispersion of optical fiber increases [14]. The WDM signal may be affected by XPM due to the relatively high power of WDM signals, but since SMF with large dispersion coefficient was used as the basic fiber constituting the optical link, we excluded the effect of XPM based on the inference that the effect of XPM would be lower than that of SPM.
The numerical approach of (2) is completed by using the split-step Fourier method [15]. The split-step Fourier method divides the transmission medium dominated by NLSE into small steps, and processes linear calculations in the frequency domain and nonlinear calculations in the time domain separately and continuously through Fourier transform and inverse Fourier transform for each step [15].
First, each WDM channel with different PRBS in the 24 transmitters in Figure 1 is generated at 0.8 nm wavelength intervals and multiplexed. The behavior of multiplexed signals transmitted over the dispersion-managed link in Figure 1 is interpreted by the NLSE of Equation (2). To analyze this, we modeled the link in Figure 1 by applying the split-step Fourier method at 0.1 km intervals. The software tool we used for simulation is MATLAB.
For the noise in the transmission link in Figure 1, only the amplified spontaneous emission (ASE) generated by the EDFA was considered. The operating wavelength range of EDFA is from 1525 nm to 1570 nm, and the noise figure is assumed to be 5.5 dB based on 0 dBm of input power.
The performance evaluation of the optical fiber system is generally based on the eye diagram of the received signals. The eye-opening penalty (EOP) and bit error rate (BER) are consequently measured through the eye diagram. The BER is mainly used for signal sensitivity analysis in fiber optic communication systems, whereas EOP is considered to be more effective for performance analysis of high-power signals. Since the optical signals have the launch powers above −10 dBm, we use the EOP to assess the compensated optical signals in this work.
An easy way to characterize the quality of digital signals degraded by deterministic distortions is the determination of the EOP. When sampling a binary signal per bit period at a specified sample time, the eye-opening (EO) is defined as the difference between the minimum value of the “1” pulse and the maximum value of the “0” pulse. We define EO by considering the average value of the received signal as follows: 2Pav/(P1,minP0,max), where Pav is the averaged power of the optical signals, and P1,min and P0,max are the minimum power of the ‘1’ pulse and the maximum power of the ‘0’ pulse, respectively. Therefore, EOP is defined as the following Equation (3) in terms of decibels.
where EOrec and EObtb are the eye-openings of the receiving optical pulse and the input optical pulse, respectively.
Since the decision threshold is set in the center of the open portion of the eye, any reduction in eye-opening indicates an increase in BER. That is, the EOP is related with the BER. We take 1 dB as the performance criterion for the EOP of the worst channel, which corresponds to BER of 10−12 [16].
As mentioned earlier, in the pseudo-linear system with dispersion management, the best compensation is obtained when the TRD is set near but not 0 ps/nm. We have confirmed that the optimal TRD is 10 ps/nm or −10 ps/nm through the previous studies. This result is closely related to the use of the DCF with dispersion coefficient of −100 ps/nm/km for dispersion compensation. It is also related to adjusting the length of the DCF by 1 km intervals for pre-DC and post-DC in Figure 1. That is, TRD is changed at intervals of −10 ps/nm and 10 ps/nm, when the DCF with a dispersion coefficient of −100 ps/nm/km is increased and decreased at intervals of 1 km, among these TRDs, the smallest value, ±10 ps/nm, which consequently comes closest to 0 ps/nm, was determined to be the optimal value. And, we have also confirmed these optimal TRDs in previous studies.
Since the TRD determination method in this paper is the same as in previous studies, the simulation is performed under the condition that the dispersion-managed link shown in Figure 1 is always set to a TRD of 10 ps/nm.
4. Simulation Results and Discussion
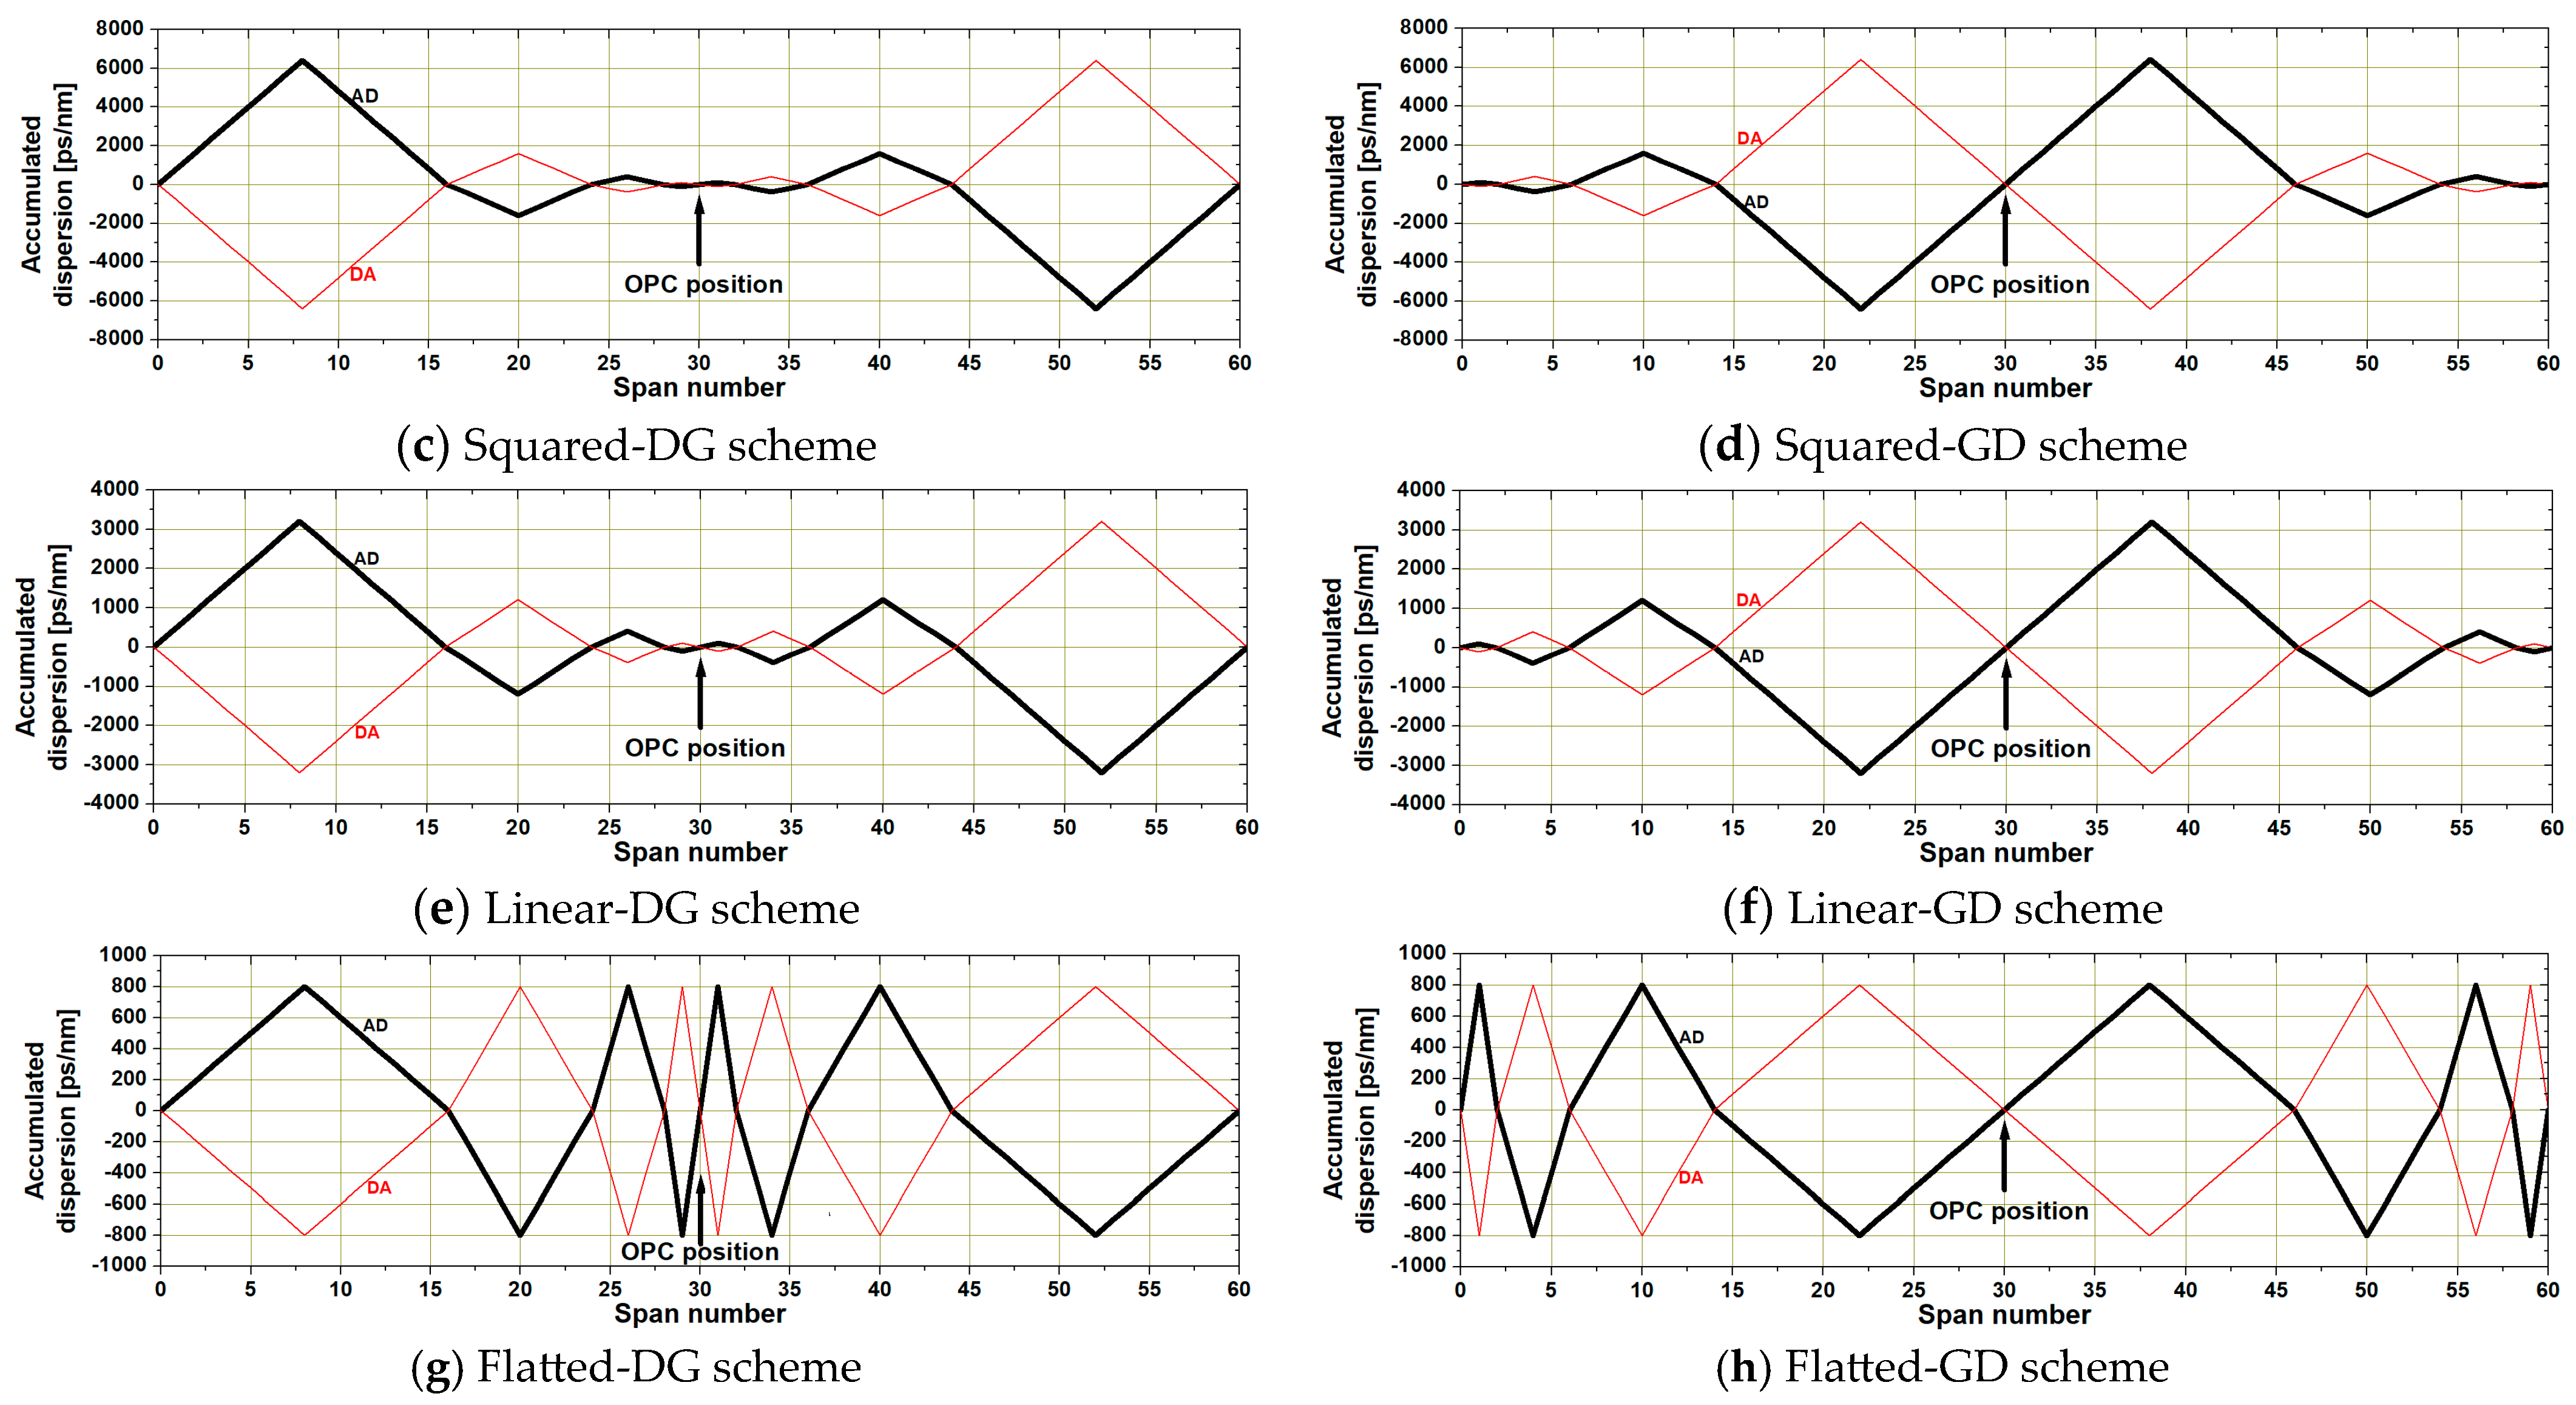
Figure 3 shows the eye diagrams of the channel with the worst compensation characteristics when 24 WDM channels are transmitted through each dispersion-managed link to which the dispersion map of Figure 2 is applied. The eye diagrams in Figure 3 are obtained when the launch power of the WDM channel is 5 dBm and the rRD of each fiber span is set to 240 ps/nm. Figure 3a is an eye diagram obtained in the case of applying the conventional dispersion map into a dispersion-managed link for comparing the compensation effect through the proposed dispersion maps of Figure 2. The conventional dispersion map does not intentionally change the cumulative dispersion profile over the transmission distance, but the cumulative dispersion profile is constant in all fiber spans, unlike the dispersion maps in Figure 2. That is, the eye diagram in Figure 3a is obtained from a dispersion-managed link where the rRD of each fiber span is uniformly applied at 240 ps/nm.
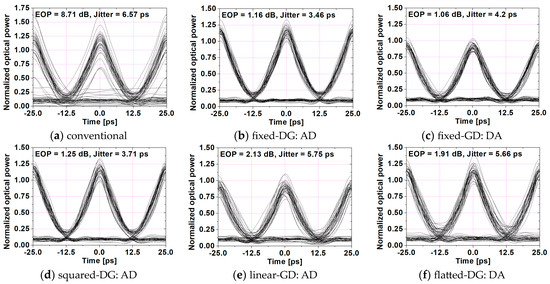
Figure 3.
The eye diagrams.
By comparing the rest of the eye diagrams with Figure 3a, it can be confirmed that the reception quality is better than the conventional dispersion map through compensation of distortion due to chromatic dispersion and SPM when the proposed dispersion map is applied. In a pseudo-linear system where chromatic dispersion and SPM exists, optical pulse distortion occurs through the interaction of the two phenomena. That is, when the amplitude (intensity) of the optical pulse is changed due to chromatic dispersion, the nonlinear phase shift is generated according to the changed intensity, resulting in distortion of the optical pulse.
Applying this mechanism to the eye diagram analysis shown in Figure 3, the eye diagram of Figure 3a shows that the conventional dispersion map does not sufficiently compensate for the amplitude and phase distortion caused by the interaction between the chromatic dispersion and SPM experienced by the optical pulse. On the other hand, although there are differences in degree, it can be confirmed that the proposed dispersion maps combined with midway-OPC help reduce the amplitude and phase fluctuation of the optical signal.
It is confirmed that, under the same conditions, the application of the proposed dispersion map to the dispersion-managed link is more effective in compensating the distorted WDM channel than the case where the conventional dispersion map is applied. What is noticeable from Figure 3 is that the degree of compensation for the distorted WDM channel varies depending on the applied dispersion map into dispersion-managed link, that is, on the specific configuration of the dispersion map. Therefore, from now on, for each dispersion map, it is necessary to evaluate the compensation characteristics depending on the changes of the launch power of the WDM channel, rRD required to form the dispersion map, and TRD of the overall link.
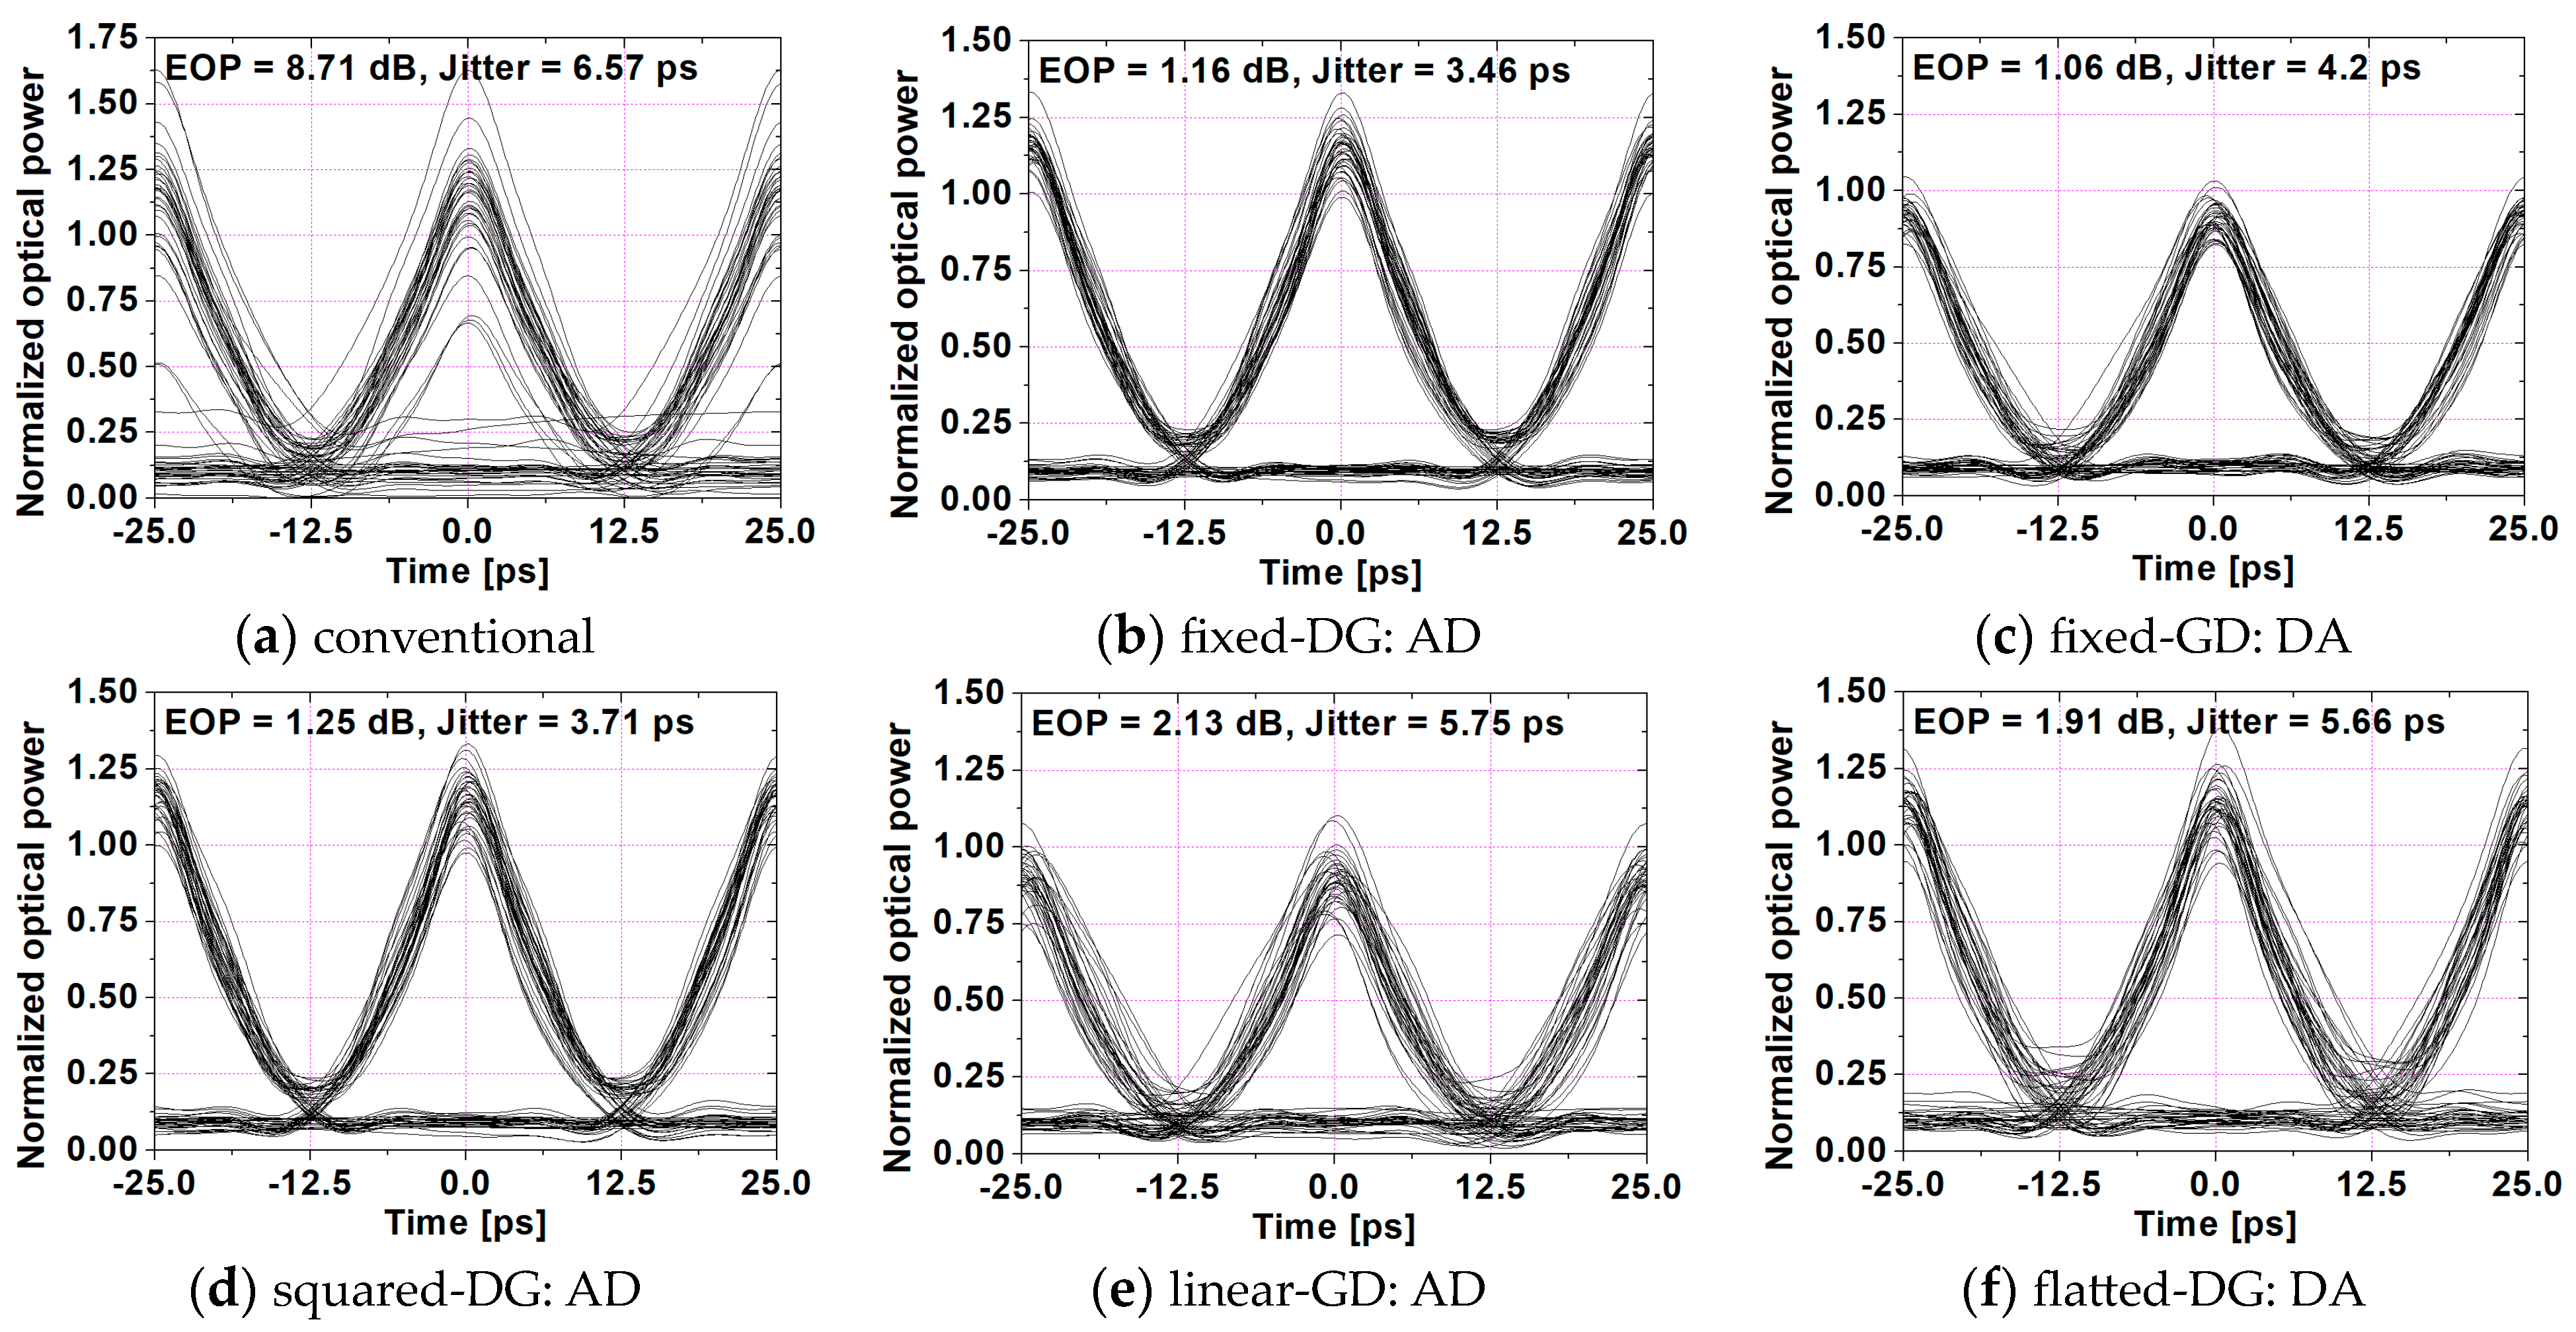
Figure 4 shows the rRD of the fiber span against the WDM channel launch power that can achieve 1 dB EOP for the worst channel, when WDM channels are transmitted through a dispersion-managed link configured with conventional dispersion map and with ‘linear-GD: AD’ of Figure 2f. It should be noted from Figure 4 that there is a lower limit on the launch power of the WDM channel that can achieve 1 dB EOP. It is judged that this is because when the launch power of the WDM channel is very small, the loss of the optical fiber can greatly affect the channel signals, and as a result, the compensation effect by the midway-OPC is reduced. What can be utilized from the results of Figure 4 is that the allowable range of the channel’s launch power for each rRD must be limited to achieve an EOP of 1 dB or less through the dispersion-managed link configured with the dispersion map of Figure 2. We define this range as the power margin notated in Figure 4. That is, the power margin is the difference between the maximum and the minimum value of the launch power of the WDM channel that can obtain 1-dB EOP.
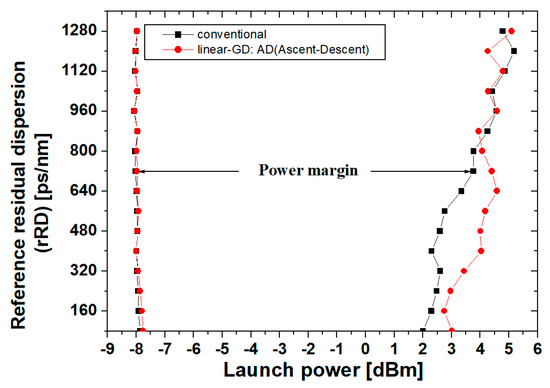
Figure 4.
The launch power versus reference residual dispersion that can achieve 1 dB EOP.
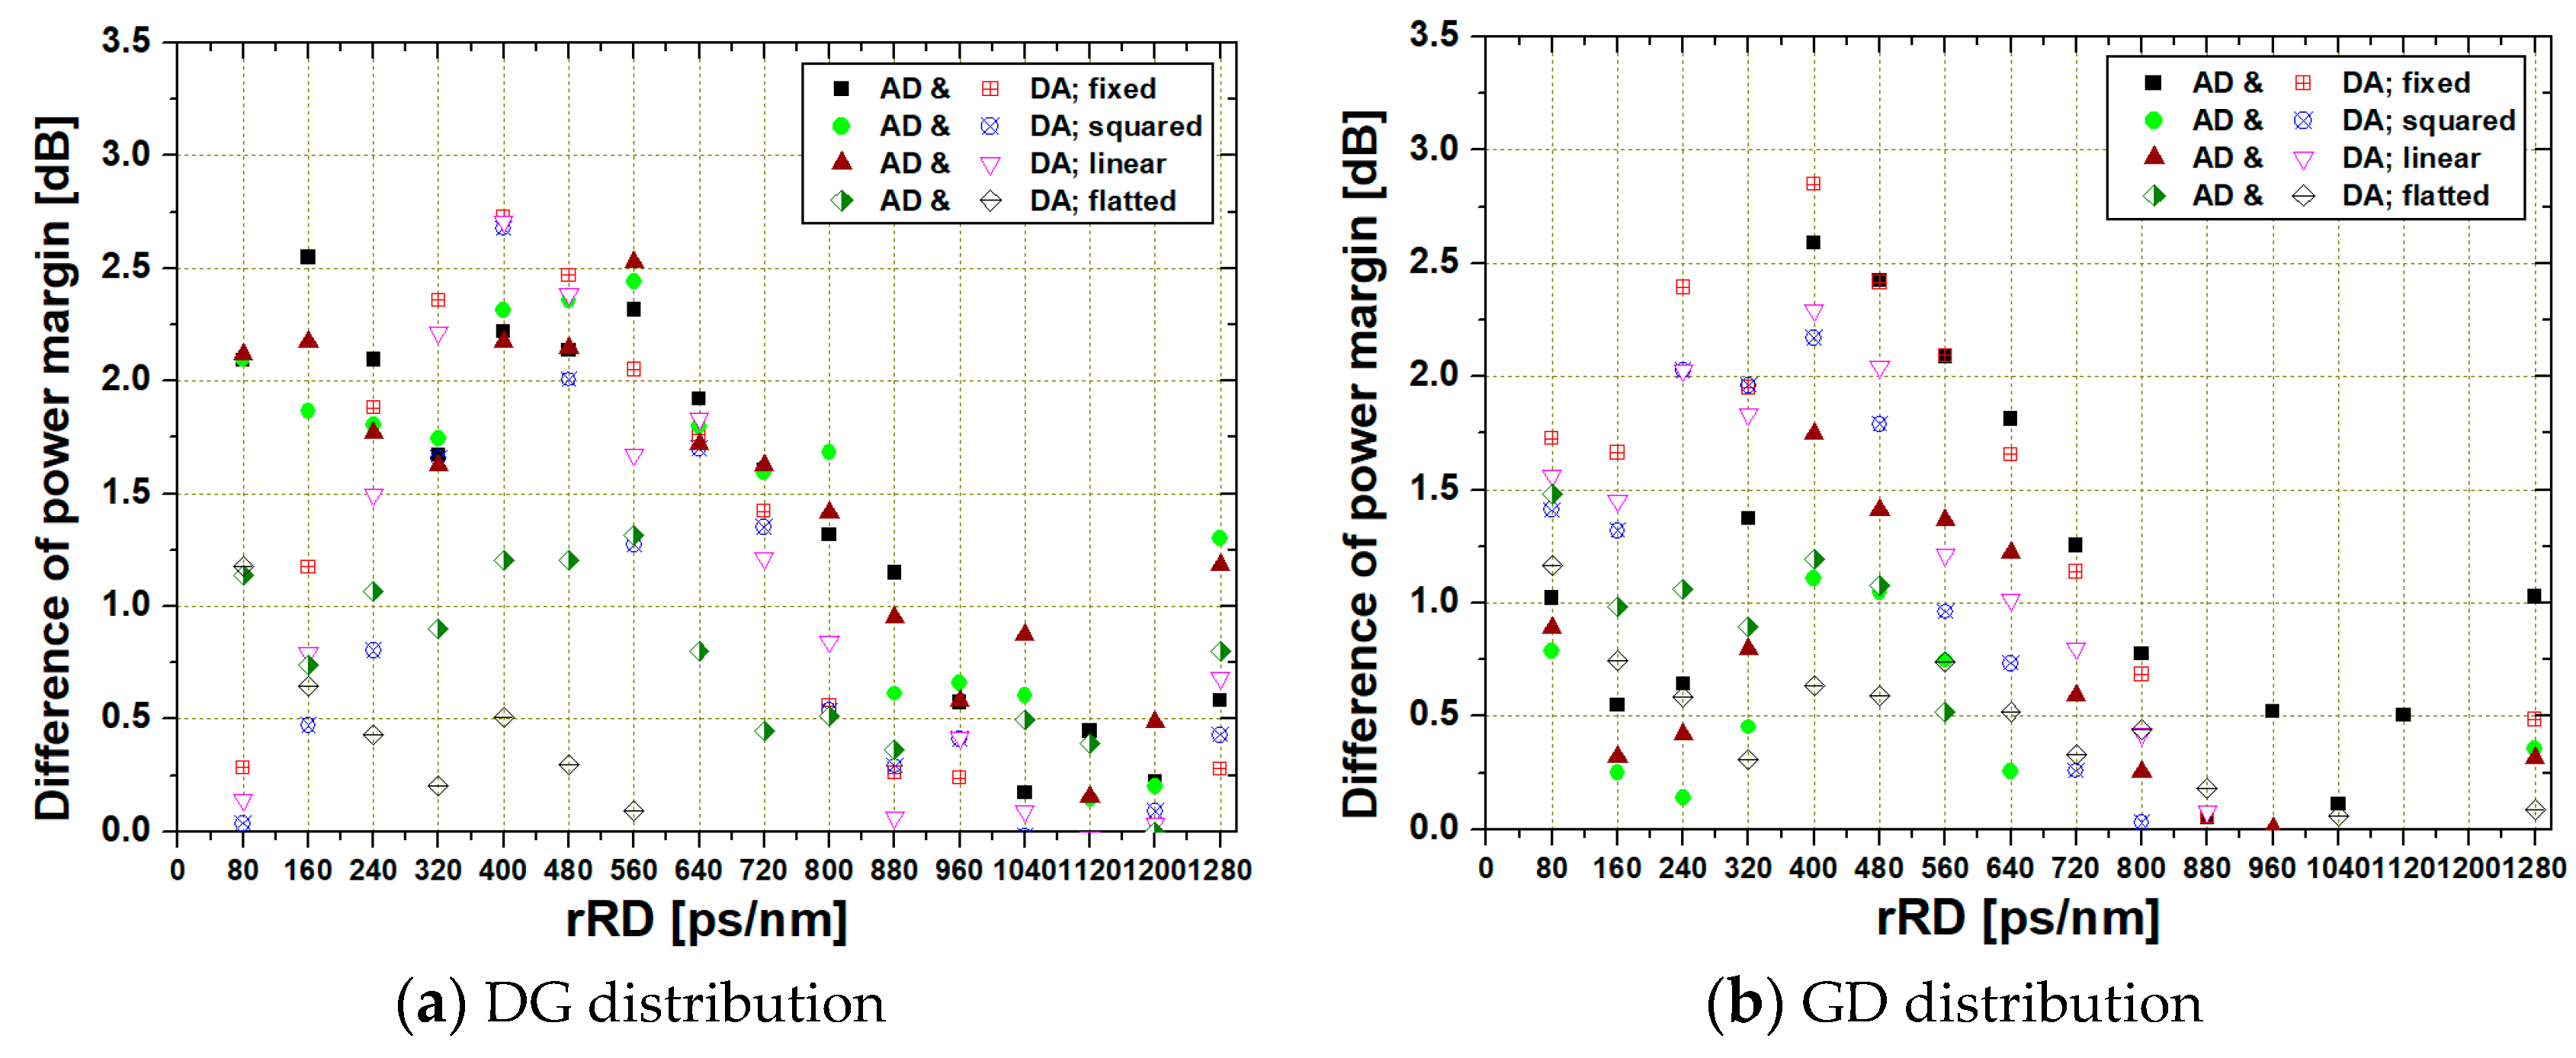
Optimization of the dispersion map is important not only in the distribution of cumulative dispersion in the entire link, but also in the magnitude of the residual dispersion per span. Figure 5 makes it possible to evaluate the effect of the magnitude of rRD on compensation in the proposed dispersion map in terms of power margin. Figure 5 shows the difference in power margin of the worst channel as a function of the rRD in the dispersion-managed link to each of the 16 different dispersion maps. The power margin difference is the arithmetic subtraction of the power margin obtained when the conventional dispersion map is applied from the power margin obtained when each dispersion map is applied into a dispersion-managed link. In other words, Figure 5 shows how much the power margin in the proposed dispersion maps is improved compared to the conventional dispersion map. As each value shown in Figure 5 increases, the compensation effect can be considered to have increased further. A feature common to Figure 5a,b is that the compensation effect is better improved when the rRD of each fiber span selected for each dispersion map in Figure 2 is moderately small (i.e., around 400 ps/nm). And from the rRD point of view, the dispersion maps that can achieve the improved compensation effect for all considered rRDs over the conventional configuration, albeit to varying degrees, are the fixed configurations of Figure 2a,b.
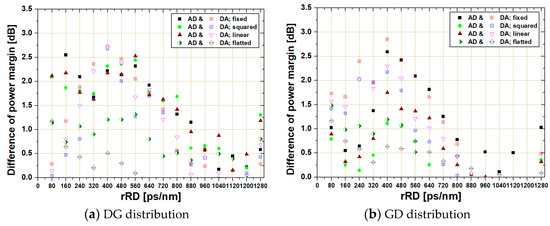
Figure 5.
The difference power margin versus reference residual dispersion for the worst channel.
Although the compensation characteristics for each dispersion map are examined when the TRD of the dispersion-managed link is basically set to 10 ps/nm, the EOP of 1-dB or less can be also obtained at other TRDs. Figure 6 shows the range of TRDs that result in 1-dB EOP at each launch power of the worst channel, which is the example of the above-mentioned feature. In Figure 6, the effective TRD means the upper and lower limits of the TRD that can obtain 1-dB EOP for each launch power. Although the characteristics of launch power versus effective TRD obtained from the conventional dispersion map and the dispersion map of the linear-DG:AD are generally similar, there is a distinguishable difference when the launch power is large.
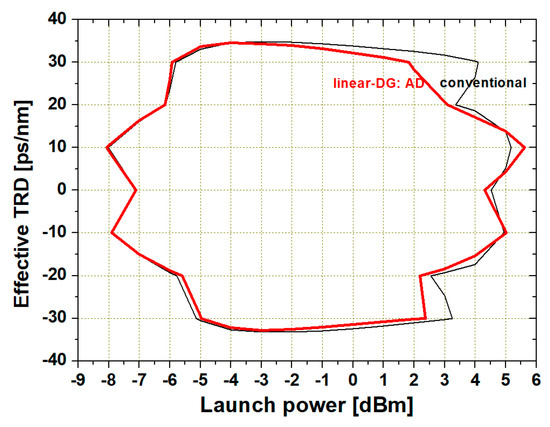
Figure 6.
The effective launch power versus the effective TRD ranges.
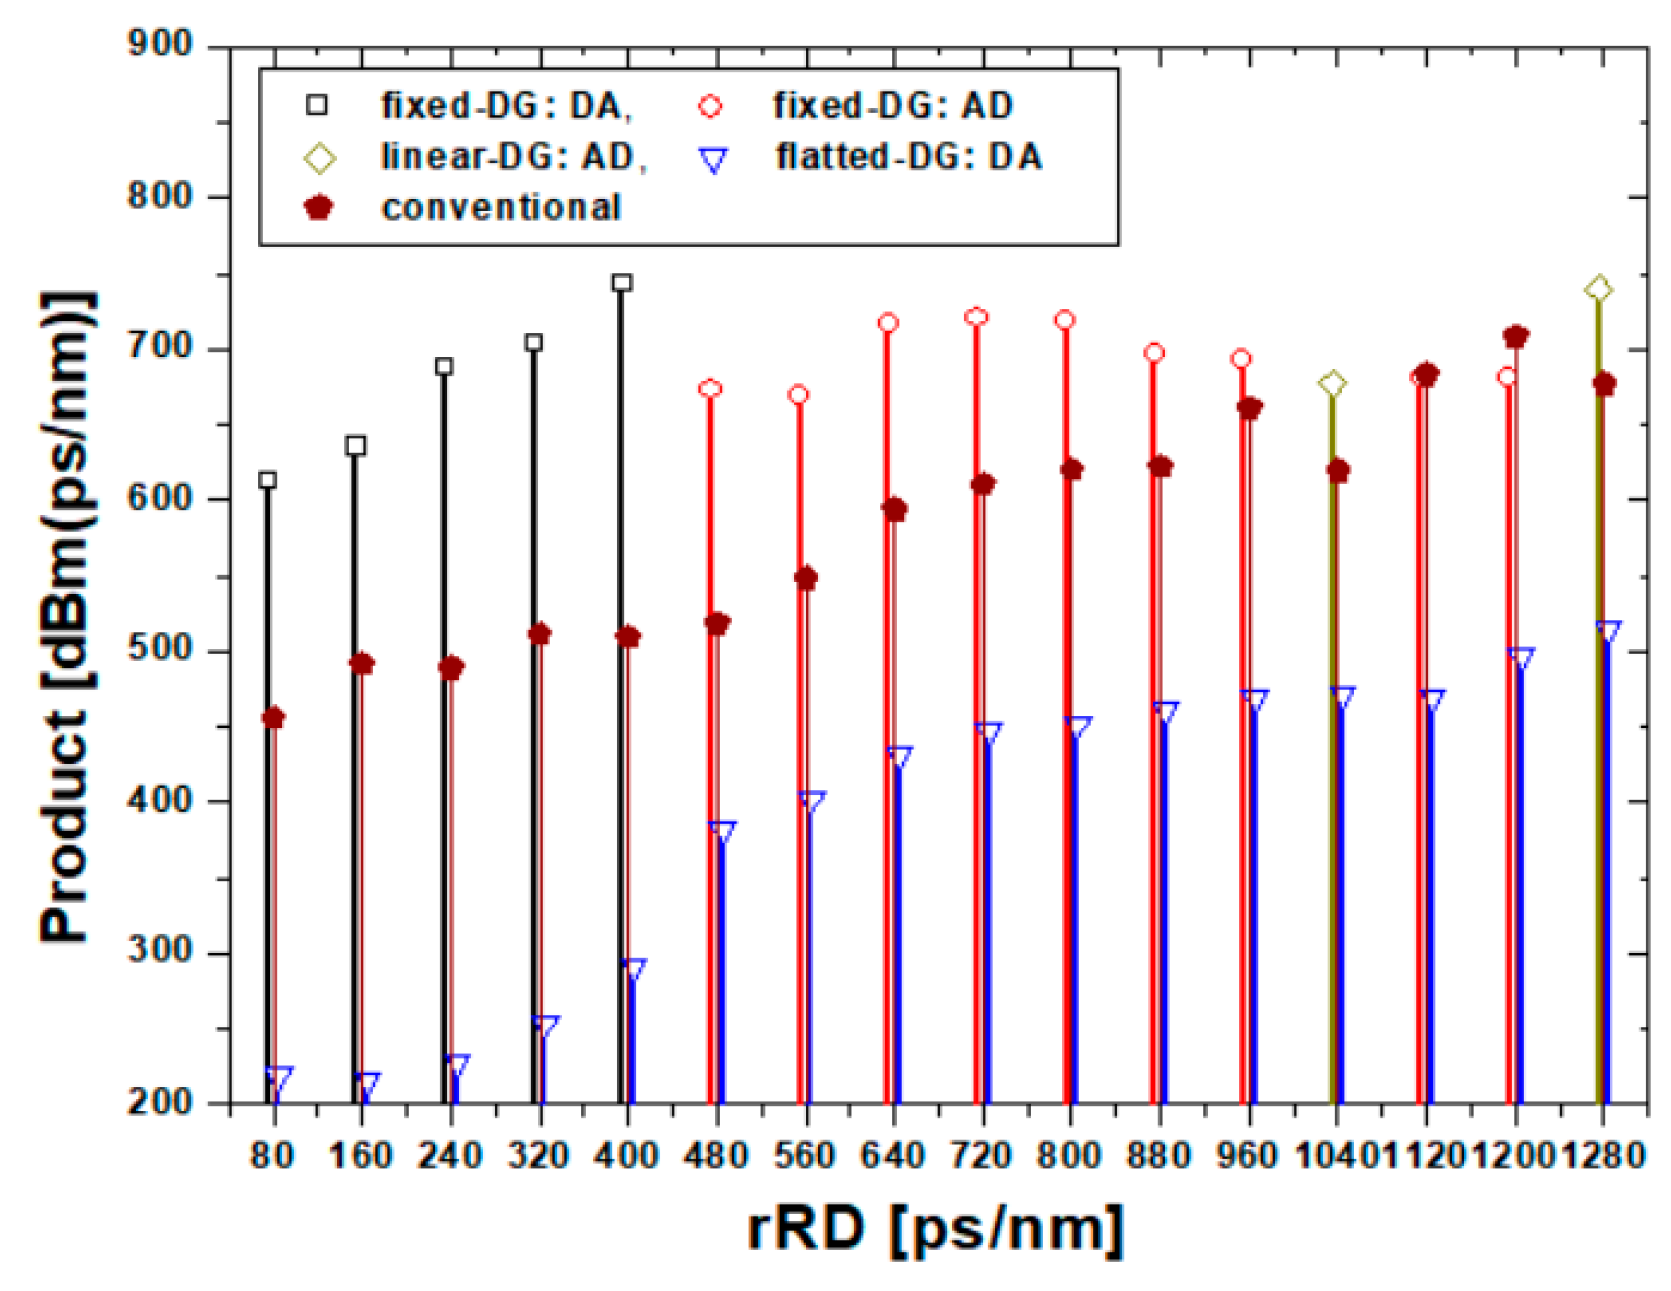
However, it is rather cumbersome to analyze the launch power versus effective TRD characteristics for the 16 dispersion maps in Figure 2 as shown in Figure 6. Looking at Figure 6, it can be known that the effective TRD for the launch power ultimately takes the form of a closed curve. Therefore, one way to numerically analyze the launch power versus effective TRD characteristics of each dispersion map is to evaluate and compare the area of the corresponding closed curve. The area of the closed curve is equivalent to the product of the available launch power and the effective TRD that can yield 1 dB EOP. We will simply call the product of available launch power and effective TRD to ‘the product’. As a matter of course, the larger the product, the larger the TRD coverage of the dispersion-managed link, or the larger the launch power of the WDM channel, depending on the link design requirements.
Figure 7 shows the product of the worst channel as a function of rRD when each dispersion map in Figure 2 is applied to the dispersion-managed link. Figure 7 illustrates the largest and smallest products for each rRD, and shows the corresponding dispersion map resulting in those values. For comparison, the product in the conventional dispersion map is also shown in Figure 7. It can be confirmed that the fixed-DG: DA configuration is most advantageous when WDM channel distortion is compensated for by selecting a relatively small rRD of 400 ps/nm or less. In addition, it can also be known that the fixed-DG: AD or linear-DG: AD configurations are preferable when rRD is selected to be 480 ps/nm or more. It can be determined with certainty that the best product is obtained when the fixed-DG: DA configuration with rRD selected as 400 ps/nm is applied to the dispersion-managed link.

Figure 7.
The product of available launch power and effective TRD for each rRD.
Through analyzing the results of Figure 7, it can be judged that the linear-DG: AD is the excellent dispersion map at rRD = 1280 ps/nm, but it cannot be recognized as the effective dispersion map that satisfies the purpose of this paper, since there is no significant difference from the product in the conventional dispersion map designed with the same rRD. Analyzing from the viewpoint of improving the product characteristics compared to the conventional dispersion map, it can be confirmed that the degree of improvement increases as the rRD applied to the dispersion map increases to 400 ps/nm, but decreases when the rRD exceeds 400 ps/nm. An interesting result from Figure 7 is that the dispersion map configuration that can lead to the good product is different for each rRD, but the dispersion map results in the minimum product for all rRDs is only flatted-DG: DA of Figure 2g. This result suggests that the maximum cumulative dispersion of the link must be variable, not constant, regardless of the detailed scheme of the dispersion map, in order to effectively compensate for the distorted WDM channels.
5. Summary and Consideration for Implementation of Optical Link
In this section, we would like to summarize the simulation results and to mention the points to be considered, when implementing the results of this study into the SMF- and EDFA-based optical link. The dispersion map configurations in which the zero-crossing place of cumulative dispersion is not constant and the dispersion distribution profile is symmetrical around the midway-OPC is more effective in compensating the distorted WDM signal than the conventional dispersion map. The fact that the dispersion profile should be symmetric with respect to the midway-OPC means that the role of the OPC is important in compensating for the nonlinear distortion of the signal amplified by the EDFA, and the optimization of the dispersion map is also an important factor in signal compensation, taking into account the correlation with the OPC added to the link.
The classification of the dispersion map proposed in this study is based on the shape of the dispersion profile of each FSG and the residual dispersion of each fiber span even if the zero-crossing place of the cumulative dispersion is the same. That is, even if the zero-crossing place of the cumulative dispersion is the same, the dispersion map proposed in this study is classified into 16 types depending on the increase/decrease in the dispersion profile of each FSG, the variation rate of rRD for each FSG and the residual dispersion of each fiber span.
Among the factors that specifically determine the shape of the dispersion map, it is found that the variation rate of rRD for each FSG had the greatest impact on compensation performance. It is confirmed that the dispersion map of the fixed configuration, in which the residual dispersion per each fiber span are equally allocated regardless of the number of fiber spans consisting of the FSG, is most advantageous for increasing the power margin of the WDM channel and securing the flexibility of dispersion-managed link design.
For the rest three configurations considered in this paper, the residual dispersion per each fiber span assigned to fiber span of any FSG must be determined by artificially multiplying or dividing the rRD by the number of fiber spans consisting of the corresponding FSG. That is, the fixed configuration can design the dispersion-managed link relatively simply compared to other configurations. Next, by examining the effect of rRD of each fiber span on WDM channel compensation, it is confirmed that relatively excellent compensation is obtained when rRD was set to the value of around 400 ps/nm, irrelevant with the dispersion map configurations.
Summarizing the results obtained through simulation in this paper, although the zero-crossing place of the cumulative dispersion is different, the compensation effect of WDM channel distortion by applying the dispersion map whose distribution is symmetric with respect to the midway-OPC can be more increased than the conventional dispersion map. In this case, the excellent compensation can be obtained by uniformly setting the residual dispersion in all fiber spans to around 400 ps/nm. Quantitatively, if the dispersion map of the fixed configuration with rRD of 400 ps/nm is applied to the link, depending on the specific location of the zero-crossing of the cumulative dispersion and the shape of the dispersion distribution of the FSG, the power margin can be more increased from 2 to 3 dB, and the product of available launch power and effective TRD can be increased by more than 200 dBm (ps/nm) compared to the conventional dispersion map.
The dispersion maps dealt with in this study are artificial and special ones that are symmetric around the midway-OPC and the zero-crossing place of the cumulative dispersion is not constant. In other words, the process of designing the 16 dispersion maps shown in this paper can be cumbersome compared to the dispersion maps reported in other studies. However, considering the results of other researchers including the author of this paper, the dispersion map should be optimized for high-speed and high-capacity optical transmission depending on the bit rate, the modulation format, transmission method, transmission distance, and network topology. In other words, the optimization of the dispersion map, which affects the performance of the dispersion-managed link, is inevitably process of finding the best rRD, TRD, unit dispersion profile and the overall dispersion profile of whole link suitable for various requirements, and it should be understood that this paper also went through such a process.
6. Conclusions
We analyzed the performance of a dispersion maps with non-constant zero-crossing places and symmetric configuration with respect to midway-OPC applying into the dispersion-managed link with midway-OPC for 24 WDM channels carrying 40 Gb/s RZ data. The performances of 16 different dispersion maps were compared, varying both the launch power of WDM channel, the residual dispersion per each fiber span and the TRD of whole links. Also, the performances of the proposed 16 different dispersion maps were compared with that of the conventionally configured dispersion map.
The best performance was achieved by using the dispersion maps of the fixed configuration with a residual dispersion of 400 ps/nm, and these dispersion maps were attributed to increase the power margin and the effective TRD of the whole link, regardless of the specific location of the zero-crossing of the cumulative dispersion and the shape of the dispersion distribution of the FSG. In addition, it was also confirmed that the rest dispersion maps can improve the power margin and effective TRD compared to the conventional dispersion map, if the residual dispersion per fiber span is optimally selected near 400–480 ps/nm.
The important point obtained in this paper is that in the case of nonlinear distortion compensation through OPC, as the optical transmission system and optical link become more complex, the shape of the dispersion map must be symmetric with respect to the OPC, and there must be a lot of variation in the local dispersion profile depending on the optical transmission channel and link conditions. Although the dispersion maps proposed in this paper are complex and the analysis process was not easy, we hope that our research will help design high-capacity long-haul optical transmission links.
Author Contributions
Conceptualization, J.-P.C. and S.-R.L.; methodology, S.-R.L.; software, S.-R.L.; analysis, J.-P.C. and S.-R.L.; resources, S.-R.L.; data curation, S.-R.L.; writing—original draft preparation, J.-P.C. and S.-R.L.; writing—review and editing, J.-P.C. and S.-R.L.; visualization, S.-R.L.; super-vision, J.-P.C. and S.-R.L.; project administration, S.-R.L. All authors have read and agreed to the published version of the manuscript.
Funding
This research received no external funding.
Institutional Review Board Statement
Not applicable.
Informed Consent Statement
Informed consent was obtained from all subjects involved in the study.
Data Availability Statement
The data presented in this study are available on request from the corresponding author. The data are not publicly available due to Institutional regulations.
Conflicts of Interest
The authors declare no conflict of interest regarding the publication of this paper.
References
- Zheng, Y.; Wang, H.; Zhang, Y. Master–slave carrier phase recovery using optical phase conjugation for frequency comb-based long-haul coherent communication systems. Opt. Commun. 2023, 535, 129373. [Google Scholar] [CrossRef]
- Suzuki, M. Dispersion managed solitons and their application to high-capacity optical submarine cable systems. Optik 2023, 280, 170771. [Google Scholar] [CrossRef]
- Tong, Z.; Wei, H.; Jian, S. Impacts of dispersion maps on nonlinear distortion in distributed Raman amplified multi-span systems. Optik 2008, 119, 365–372. [Google Scholar] [CrossRef]
- Yariv, A.; Fekete, D.; Pepper, D.A. Compensation for channel dispersion by non-linear optical phase conjugation. Opt. Lett. 1979, 4, 52–54. [Google Scholar] [CrossRef]
- Shieh, W.; Bao, H.; Tang, Y. Coherent optical OFDM: Theory and design. Opt. Express 2008, 16, 841–859. [Google Scholar] [CrossRef] [PubMed]
- Yi, X.; Shieh, W.; Tang, Y. Phase estimation for coherent optical OFDM. IEEE Photonics Technol. Lett. 2007, 19, 919–921. [Google Scholar] [CrossRef]
- Chowdhuru, A.; Raybon, G.; Essiambre, R.-J.; Sinsky, J.H.; Adamiecki, A.; Leuthold, J.; Doerr, C.R.; Chandrasekhar, S. Compensation of intrachannel nonlinearities in 40-Gb/s pseudo linear systems using optical-phase conjugation. J. Lightwave Technol. 2005, 23, 172–177. [Google Scholar] [CrossRef]
- Jansen, S.L.; van den Borne, D.; Monsalve, C.C.; Spälter, S.; Krummrich, P.M.; Khoe, G.D.; de Waardt, H. Reduction of Gordon–Mollenauer phase noise by midlink spectral inversion. IEEE Photonics Technol. Lett. 2005, 17, 923–925. [Google Scholar] [CrossRef]
- Liua, X.; Luanb, H.; Linc, X.; Lana, B.; Dai, B. SPM compensation for long-haul CO-OFDM systems with midlink optical phase conjugation. Optik 2013, 124, 1892–1896. [Google Scholar] [CrossRef]
- Cao, W. Improved compensation of intrachannel four-wave mixing in dispersion-managed transmission links with mid-span optical phase conjugation. Opt. Commun. 2023, 530, 129185. [Google Scholar] [CrossRef]
- Abd, H.J.; Gitaffa, S.A.; Al-Hamiri, M.G. Impact of optimized pulse shaping on optical transmission performance in the availability of different dispersion maps. Optik 2021, 241, 167006. [Google Scholar] [CrossRef]
- Chung, J.-P.; Lee, S.-R. MSSI-based dispersion-managed link configured by randomly-distributed RDPS only in former half section. Appl. Sci. 2022, 12, 8970. [Google Scholar] [CrossRef]
- Yim, H.-B.; Lee, S.-R. Compensation for the distorted WDM signals through dispersion-managed optical links combined with non-midway optical phase conjugation. Int. J. Control Autom. 2018, 11, 1–10. [Google Scholar] [CrossRef]
- Talukder, M.A.; Islam, M.N. Performance of bi-end compensation in a wavelength-division multiplexed system considering the effect of self phase modulation. Opt. Eng. 2005, 44, 115005-1–115005-6. [Google Scholar] [CrossRef]
- Agrawal, G.P. Nonlinear Fiber Optics, 3rd ed.; Academic Press: San Francisco, CA, USA, 2001; pp. 44–55. [Google Scholar]
- Kikuchi, N.; Sasaki, S. Analytical evaluation technique of self-phase modulation effect on the performance of cascaded optical amplifier systems. J. Lightwave Technol. 1995, 13, 868–878. [Google Scholar] [CrossRef]

Disclaimer/Publisher’s Note: The statements, opinions and data contained in all publications are solely those of the individual author(s) and contributor(s) and not of MDPI and/or the editor(s). MDPI and/or the editor(s) disclaim responsibility for any injury to people or property resulting from any ideas, methods, instructions or products referred to in the content. |
© 2023 by the authors. Licensee MDPI, Basel, Switzerland. This article is an open access article distributed under the terms and conditions of the Creative Commons Attribution (CC BY) license (https://creativecommons.org/licenses/by/4.0/).