Article

Mitigating Carbon Emissions: The Impact of Peat Moss Feeding on CH4 and CO2 Emissions during Pig Slurry Storage

1
Livestock Environmental Management Institute, Sejong 30127, Republic of Korea
2
Division of Animal and Dairy Science, Chungnam National University, Daejeon 34134, Republic of Korea
*
Author to whom correspondence should be addressed.
Appl. Sci. 2023, 13(18), 10492; https://doi.org/10.3390/app131810492
Submission received: 20 July 2023 / Revised: 24 August 2023 / Accepted: 11 September 2023 / Published: 20 September 2023
(This article belongs to the Special Issue Livestock and Poultry Production:Technologies and Prospects)

Abstract

:
The present study investigated the impact of peat moss as a feed additive on the emission of methane (CH4) and carbon dioxide (CO2) from piggery slurry stored in slurry pits. There is no well-known study on the relationship between pig manure generated after feeding peat moss as a feed additive and CH4 and CO2 released during the storage period. A lab-scale experiment was conducted for two months using a slurry pit simulator composed of six vessels—three for pig slurry collected after feeding 3.0% peat moss as a feed additive (PFS) and three for pig slurry without feeding peat moss (CTL). PFS reduced CO2 and CH4 emissions (p < 0.05) from stored pig slurry by approximately 23% and 44%, respectively. PFS exhibits substantially elevated concentrations of humic substance (HS) such as humic acid, fulvic acid, and humin compared with CTL, with fold differences of 2.3, 1.8, and 1.1, respectively. Elevated HS levels in the PFS seemed to limit hydrolysis, resulting in lower total volatile fatty acid concentrations compared with CTL. A dominance of CH4 in total carbon emissions was observed (p < 0.05), with CH4 accounting for approximately 93% and 95% of total carbon emissions in PFS and CTL, respectively. PFS had a roughly 43% lower impact on cumulative carbon emissions than CTL, primarily due to decreased CH4 emissions. These findings suggest that PFS may be a promising approach for mitigating carbon emissions and potentially impacting environmental sustainability and climate change mitigation efforts.

1. Introduction

The United Nations Environment Program (UNEP) announced in 2021 that agriculture is responsible for 40% of anthropogenic methane (CH4) emissions, with enteric fermentation and manure management accounting for 32% of the emissions and rice cultivation accounting for 8% [1]. Countries worldwide agree with the claim that CH4 emissions and carbon dioxide (CO2) must be reduced to improve global warming [1]. The number of countries that have endorsed the Global Methane Pledge (GMP) to curtail CH4 emissions—known for their amplified impact on global warming—by 30% before 2030 has risen to 151 [2]. However, to accurately calculate the amount of CH4 reduction, actual data on emission sources and emissions in various manure management environments are required.
The slurry pit stores slurry-type manure generated in slatted-floor pig houses for a certain period and then discharges it outside [3,4,5,6]. Stored pig slurry generally induces biochemical reactions depending on aerobic and anaerobic conditions resulting from pig house management [3,7,8,9]. Greenhouse gases such as CH4, CO2, and nitrous oxide (N2O) can be emitted due to biochemical reactions, and studies have been conducted on greenhouse gas emissions from pig slurry pits under various environmental conditions [10,11,12]. During storage of the raw pig slurry, CH4 and CO2 emissions were reported to range from 5 to 75 g·m−3·d−1 and 50 to 300 g·m−3·d−1, respectively [12,13,14]. N2O emissions occurred at negligible levels [14,15,16,17].
Various studies have been conducted to reduce greenhouse gas emissions from these pig slurry pits in terms of diet manipulation, housing system, and manure management, such as the use of feed additives [18], the use of cover agents [12,19], the acidification of manure [17,20], and the formation of aerobic conditions in the slurry [8]. In particular, for acidification, chemical amendments such as sulfuric acid and citric acid and organic-based compounds such as humic substances (HS) were used [21,22,23]. HS is composed mainly of humic acid, fulvic acid, and humin and is usually associated with acidification [24]. However, according to a recent study, the abundant electron transport function derived from the molecular structure of HS causes a biochemical reaction to inhibit hydrolysis and methanogenesis [25,26,27,28].
Peat moss contains such HS, and the contents of HS in peat moss have been reported as 76% humin, 18% humic acid, and 3% fulvic acid based on the total organic matter content [29]. When peat moss was used for feeding livestock, there were positive effects, such as promoting digestion and improving growth rate [24]. Feeding of HS improved broiler productivity by about 7% compared with the control, which was estimated to be due to increased absorption of nitrogen, phosphorus, and other nutrients according to chelating properties [30]. Several studies have shown that feed efficiency is improved when HS is fed as feed additives to livestock, especially in poultry and pigs [30,31,32,33,34]. The reasons for the increase in feed efficiency include the maintenance of intestinal microbial activity, improvement of animal gut health such as antibacterial activity [35,36,37], modification of protein digestibility [37], and activation of pancreatic enzymatic activity [35].
However, the prior studies mentioned above focus only on the utilization of HS themselves or on the effect of peat moss on the physiological changes of livestock. There is no well-known study on the relationship between pig manure generated after feeding peat moss as a feed additive and CH4 and CO2 released during the storage period.
Using peat moss as a feed additive for livestock could potentially lead to a decrease in the organic matter content of manure due to improved feed efficiency [35,36,37]. This, in turn, might result in lower emissions of CH4 and CO2 during the storage period of pig slurry. Hence, the purpose of this study is to investigate the impact of peat moss as a feed additive on the emissions of CH4 and CO2 originating from pig slurry stored in a slurry pit.

2. Materials and Methods

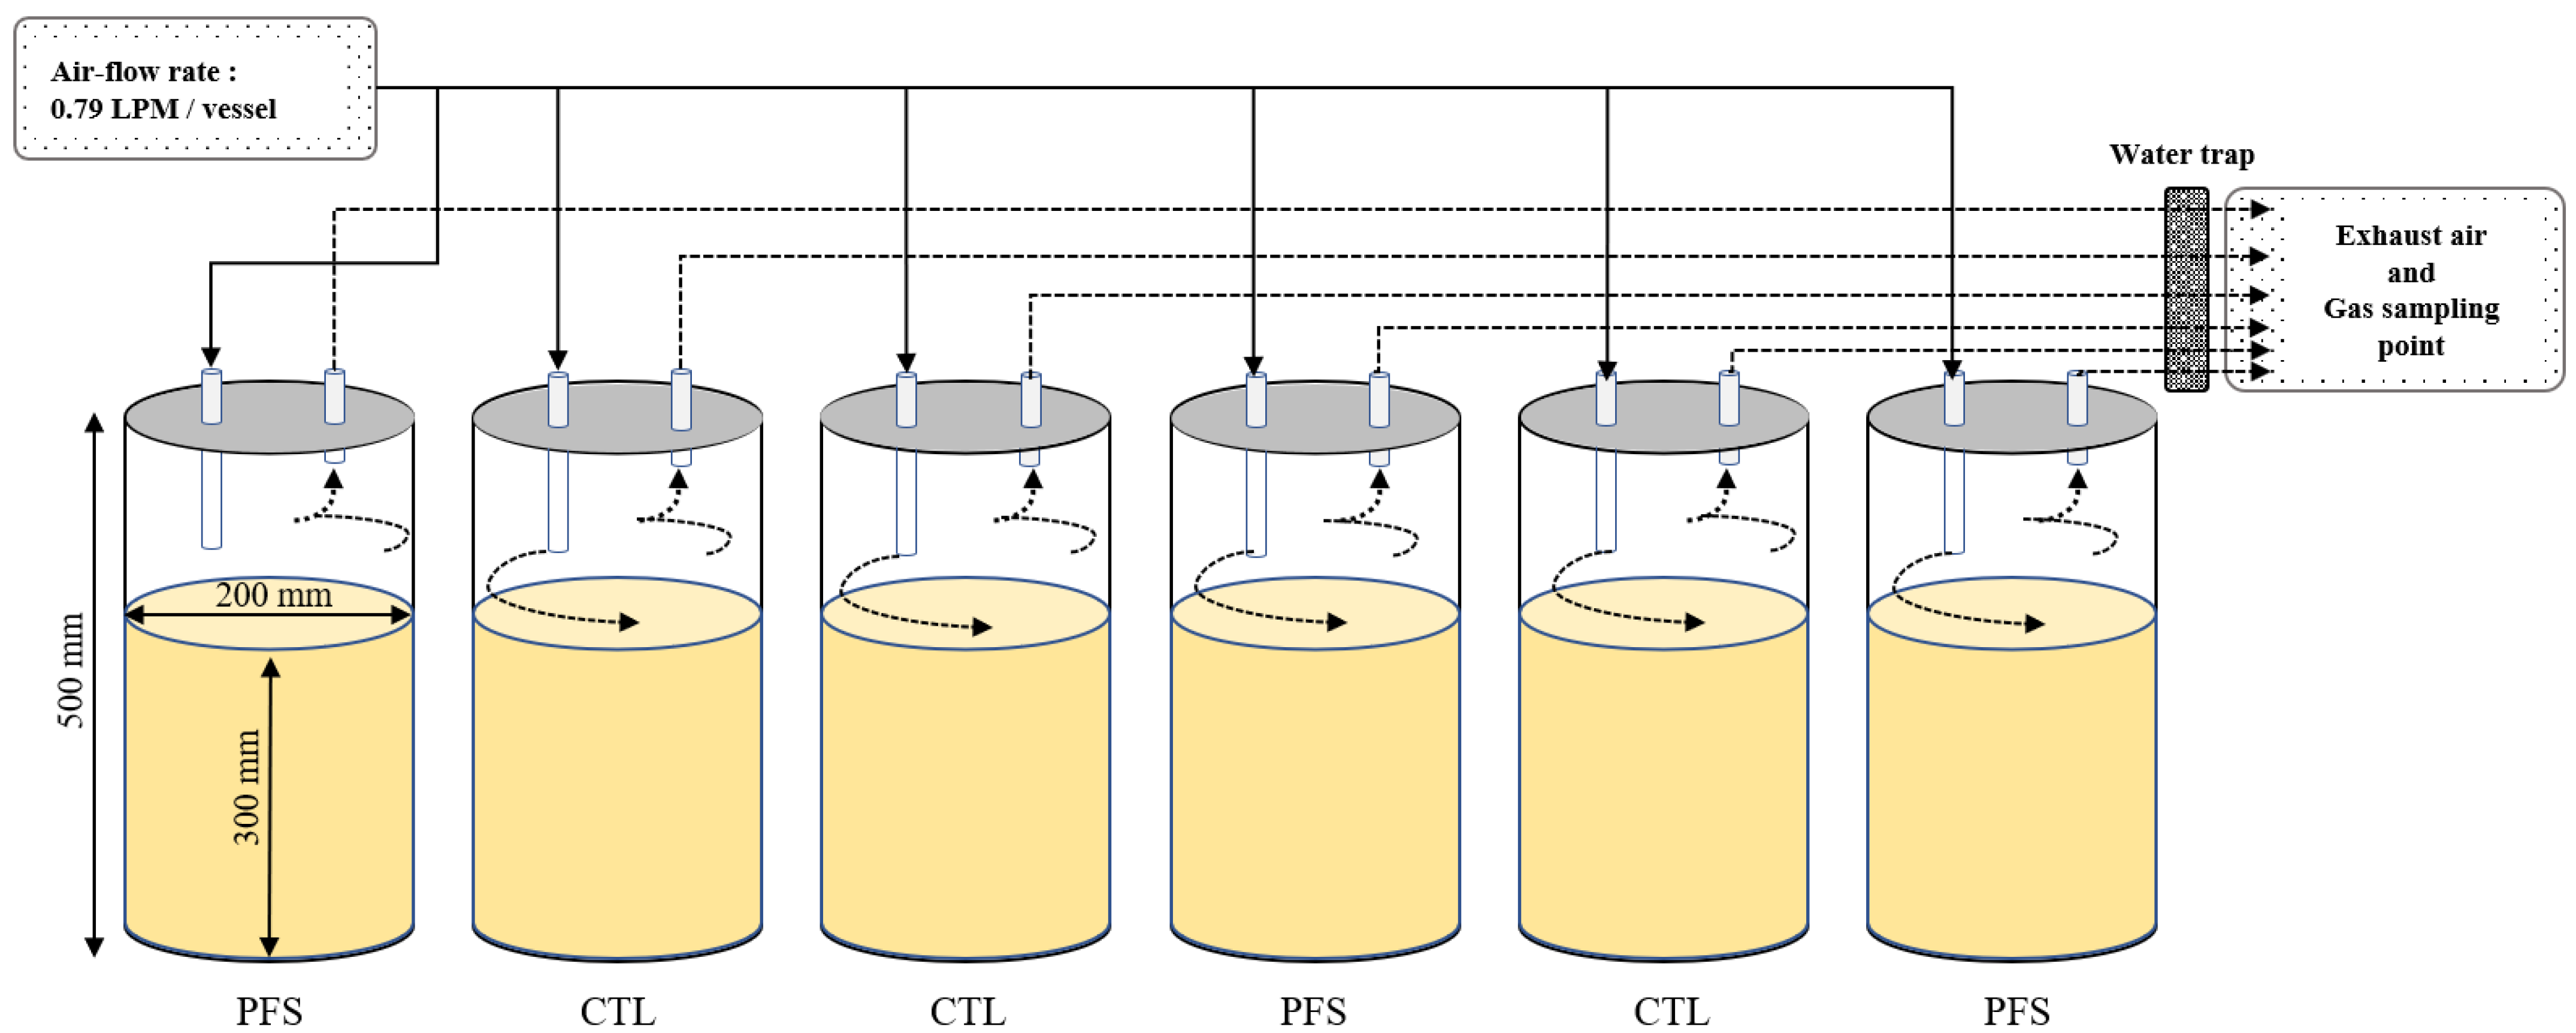
2.1. Experimental Design for Gas Emissions

A lab-scale experiment simulating a pig manure storage facility was conducted (Figure 1). The slurry pit simulator consisted of six vessels, three for pig slurry excreted after feeding a 3.0% peat moss (wet basis) as a feed additive (PFS) and three for pig slurry excreted from pigs fed conventional feed without peat moss supplement (CTL).
The room temperature at which the vessels were installed was measured at 30 min intervals using a T-type thermocouple connected to the module (NI-9213, National Instruments, Austin, TX, USA). The room temperature was maintained between 26 °C and 35 °C throughout the experiment to simulate summer conditions.
Each vessel (200 mm in diameter and 500 mm in depth) was made of polyvinyl chloride (PVC). The container was sealed with a plastic lid, and an inlet–outlet was installed on top of the cover. Piggery slurry was filled in to a height of 300 mm (9.4 L), which was 60% of the storage space of each vessel. Air corresponding to an exchange rate of 7.5 times the headspace volume per hour was ventilated (ventilation rate: 0.79 L·min−1). In order to achieve uniform flow regulation across all six containers, six air flow meters (LF-101, Unicell Instruments, Bucheon, Republic of Korea) were affixed between the inlet tubes connecting the PFS and CTL vessels and the air pump (SWT-20, WITHUS AIR, Busan, Republic of Korea).
Since moisture due to condensation may occur inside the exhaust tube connected to the outlet valve of the vessel, a water trap made of a glass bottle was installed at the point before the air is discharged.

2.2. Animals and Housing Conditions

Six sows, aged over 8 months and weighing 215 ± 15 kg, were used. They were divided into two groups: PFS and CTL, each with three respiratory chambers. One sow was placed in each chamber with ad libitum access to feed and water. Chambers (1 × 2.4 × 1.5 m) had feeding pipes, waste removal doors, plastic slat flooring, and ventilation via a ring blower (HB-129s, Hae Sung Techologies, Seoul, Republic of Korea) providing 300 L·min−1 airflow. Airflow was monitored using a mass flow meter (HFM 200 LFE, Teledyne Hastings, Hampton, VA, USA). Chambers maintained a temperature-controlled environment (24 °C) using strategically placed thermocouples (T-type). Lighting mimicked natural patterns (6 a.m. to 8 p.m.). This lighting schedule not only contributed to the animals’ natural rhythms but also facilitated meticulous observation and management of the sows to guarantee their well-being and adherence to the experimental conditions. The animal protocol used in this study has been reviewed by the Chungnam National University-Institutional Animal Care and Use Committee (CNU-IACUC) for ethical procedures and scientific management.
All sows in both groups (conventional diet and diet supplemented with 3.0% peat moss) underwent a feed adaptation period of five days. Following the adaptation period, excreted pig slurry from sows was collected for three days. The collected pig slurry (30 L of each group) was thoroughly mixed and immediately refrigerated at 5 °C. Conventional diet consisted of 12.9% crude protein, 2.6% crude fat, 0.7% calcium, 0.4% phosphorus, 17.2% neutral detergent fiber (NDF), 8.1% acid detergent fiber (ADF), and 0.7% lysine. The feed additive peat moss employed in this study was formulated with the following constituents on a dry matter basis: 0.73% crude fat, 0.51% calcium, 0.07% phosphorus, 43.7% NDF, and 37.4% ADF.
During the experiment (56 days), pig slurry was sampled from the vessel five times every two weeks. Total solid (TS) of raw pig slurry obtained from CTL and PFS was 127.5 and 133.5 g·kg−1, respectively. Volatile solid (VS) of CTL and PFS was 103.4 and 105.5 g·kg−1, respectively (Table 1). When the stored pig slurry was put into the vessel, distilled water (waste water from waterers and washing water), equivalent to about 20% of the weight of the pig slurry, was evenly mixed with the pig slurry [38]. The initial moisture content of raw slurry was 87.3% for CTL and 86.6% for PFS. After adding water, the moisture content of CTL and PFS increased to 89.4% and 88.9%, respectively.

2.3. Physico-Chemical Analysis

The TS and VS of pig slurry and peat moss were analyzed using APHA standard methods [40]. The humic acid, fulvic acid, and humin of pig slurry and peat moss were analyzed. About 5 g of sample (peat moss and pig slurry) was taken in a 50 mL centrifuge tube, 40 mL of CHCl3/MeOH (3:1, v/v) was added, and the mixture was allowed to react for 24 h to extract free lipids, followed by centrifugation (Mega 17R, Hanil, Daejeon, Republic of Korea). After centrifugation, the supernatant (humic acid + fulvic acid) and the precipitate (humin) were separated, and 40 mL of sodium pyrophosphate alkali solution (0.5 M NaOH and 0.1 M Na4P2O7) was added to the remaining residue except for the supernatant, followed by shaking for about 1 h.
All the extracted supernatants were combined, 6 N HCl was added little by little to adjust the pH of the solution to 1.0, and it was allowed to stand for about 6 h so that the humic acid precipitated to the bottom, followed by centrifugation. A total of 1 M NaOH solution was added to the precipitate, ultrasonic extraction was performed for about 1 h, left overnight, centrifuged, and the supernatant was filtered through a dry filter (Whatman No. 4) and diluted to 100 mL with distilled water. Humic and fulvic acid were measured using a UV/VIS spectrophotometer (UV-2450, Shimadzu Co., Kyoto, Japan). Humin was analyzed as a precipitate generated using sodium pyrophosphate alkali solution and 200 mL of 10% hydrofluoric acid. Table 2 presents the quantification of HS in pig slurry and peat moss.
A pig slurry supernatant mixed with 25% metaphosphoric acid was injected into the gas chromatography–flame ionization detector (GC-FID) system (iGC 7200, DS Science, Daejeon, Republic of Korea) to analyze total volatile fatty acid (TVFA). The injector and detector temperatures were set to 280 °C as the default setting of the GC-FID. The GC carrier gas (N2), detector H2 gas, and airflow were set to 1.0, 30.0, and 300 mL·min−1, respectively. The split ratio was 10.

2.4. Analysis of Methane (CH4) and Carbon Dioxide (CO2) Emissions

The gas discharged from each vessel was collected in a 10 L Tedlar bag (CEL Scientific Tedlar gas bag, Santa Fe Springs, CA, USA). The CH4 concentration was measured using a methane gas sensing module (LGD Compact-A, axetris, Kaegiswil, Switzerland). The CO2 concentration of the collected gas was analyzed using a GC fitted with a thermal conductivity detector (iGC 7200, DS Science, Daejeon, Republic of Korea). The temperature of the oven and detector was set to 50 °C. The total flow rate of He gas and air was set at 25.0 mL·min−1. The CH4 and CO2 emissions were calculated using the following Equation (1) [5]:
G a s   e m i s s i o n   p e r   d a y g · d 1 = ( C E × V × 273.15 × M W 273.15 + T E × 22.4 × 10 3 ) ( C A × V × 273.15 × M W 273.15 + T A × 22.4 × 10 3 )
  • CE = Target gas concentration of exhausted air (mL·m−3).
  • V = Headspace ventilation rate (m3·min−1).
  • MW = Molecular weight of target gas (g·mol−1).
  • TE = Exhaust air temperature (°C).
  • CA = Target gas concentration of ambient air (mL·m−3).
  • TA = Ambient air temperature (°C).

2.5. Statistical Analysis

Taking into account the underlying normal distribution characteristics of the dataset, the investigation employed a one-way ANOVA (IBM SPSS STATISTICS 22) to evaluate the impact of pig slurry fed with peat moss on the cumulative emissions of CH4 and CO2 per VS over a defined temporal interval. Additionally, an independent t-test was employed to make a comparative assessment of the daily emissions of CH4 and CO2, as well as the outcomes derived from physico-chemical analysis, between PFS and CTL. Tukey’s test was used for post hoc analysis. The analysis of variance was conducted at a significance level of 0.05.

3. Results and Discussion

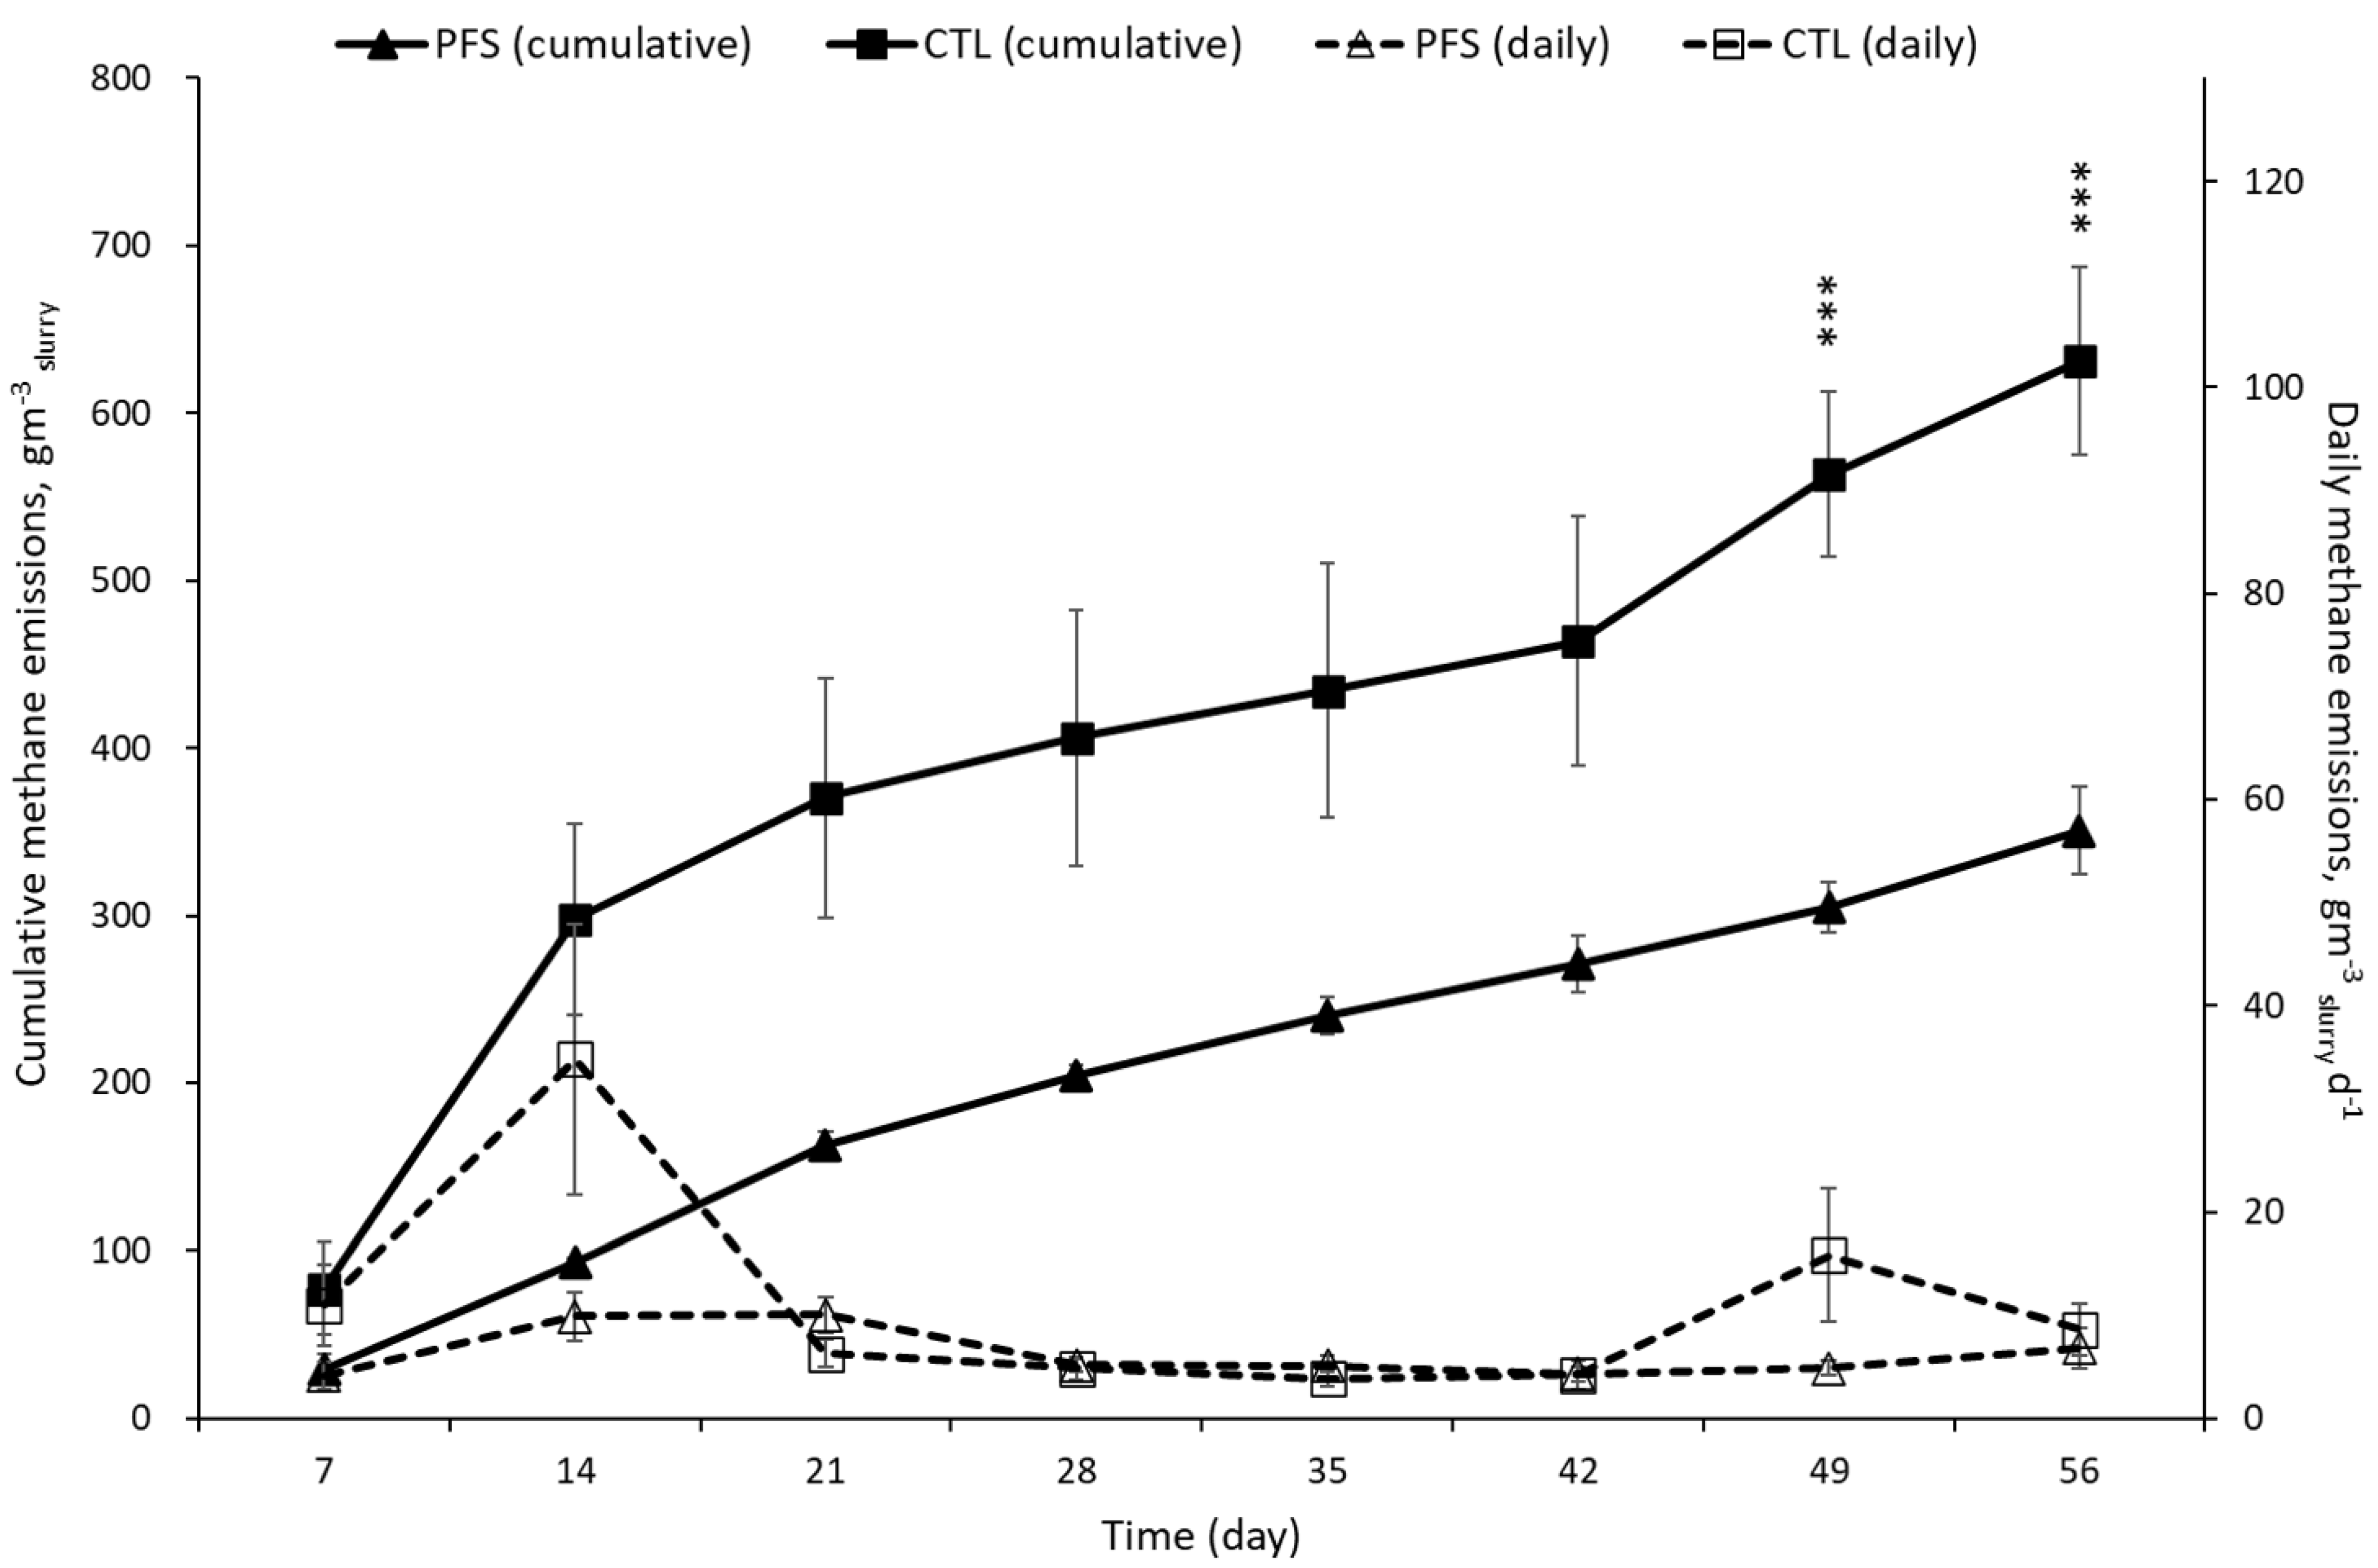
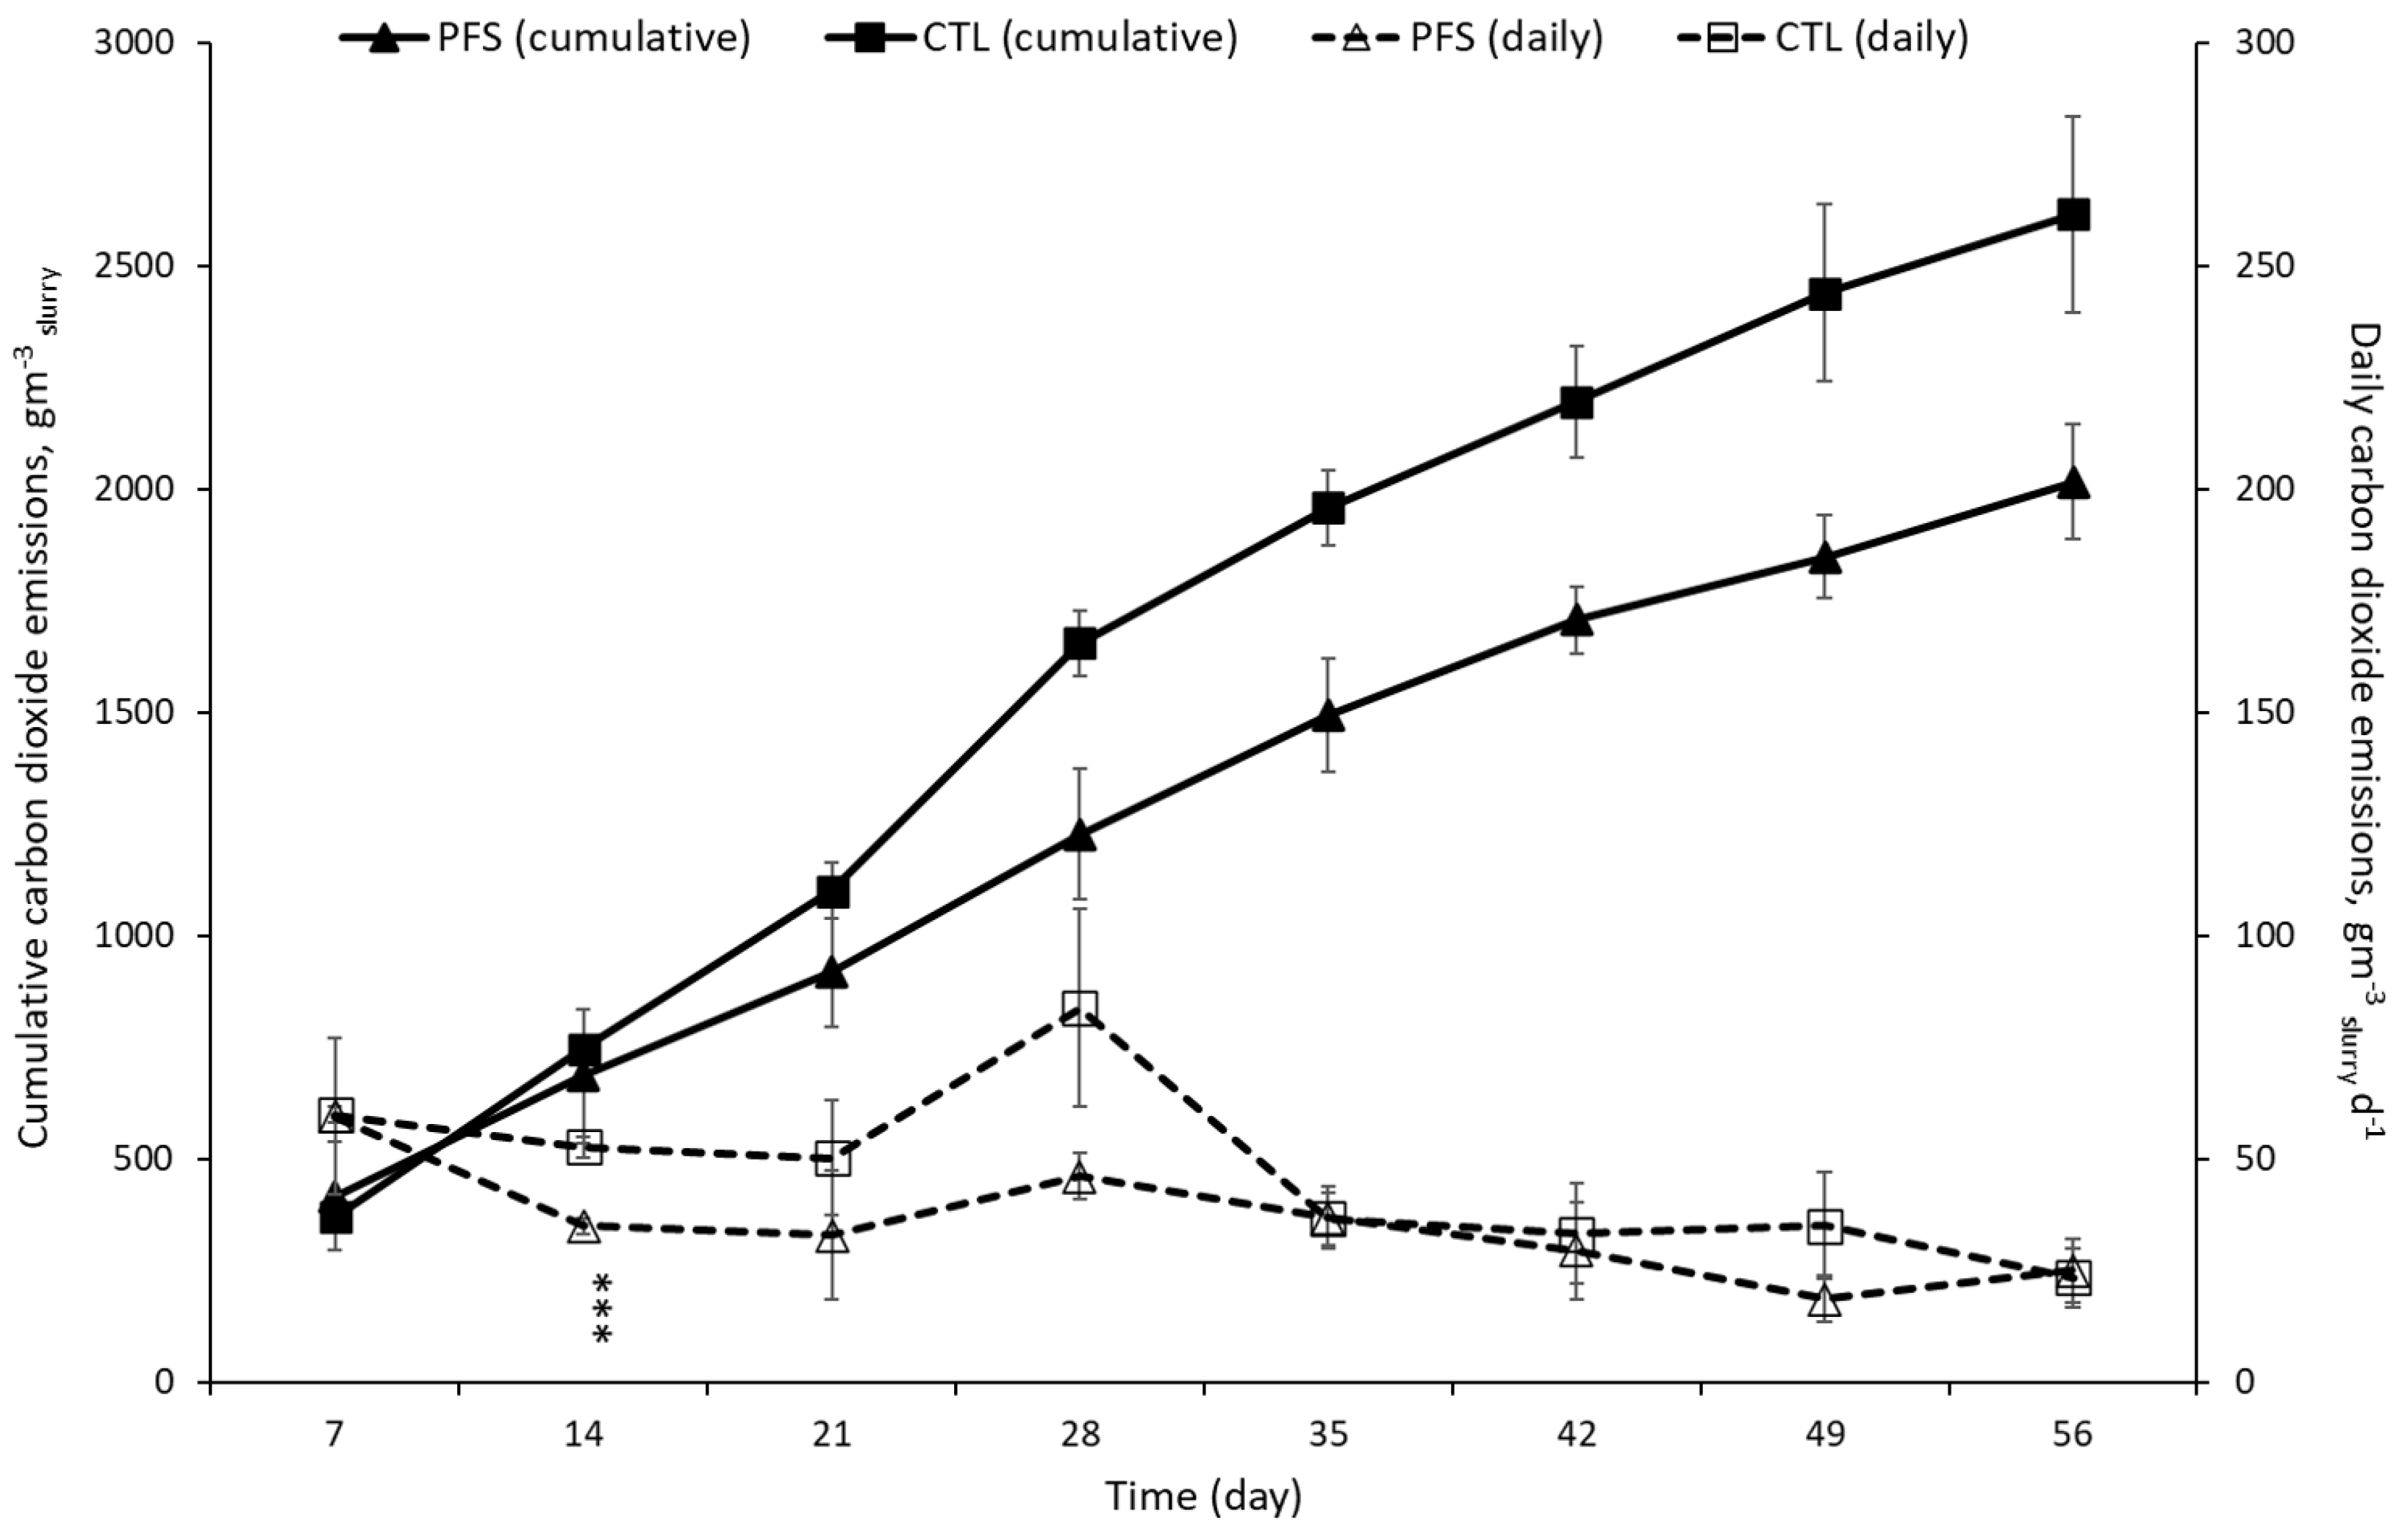
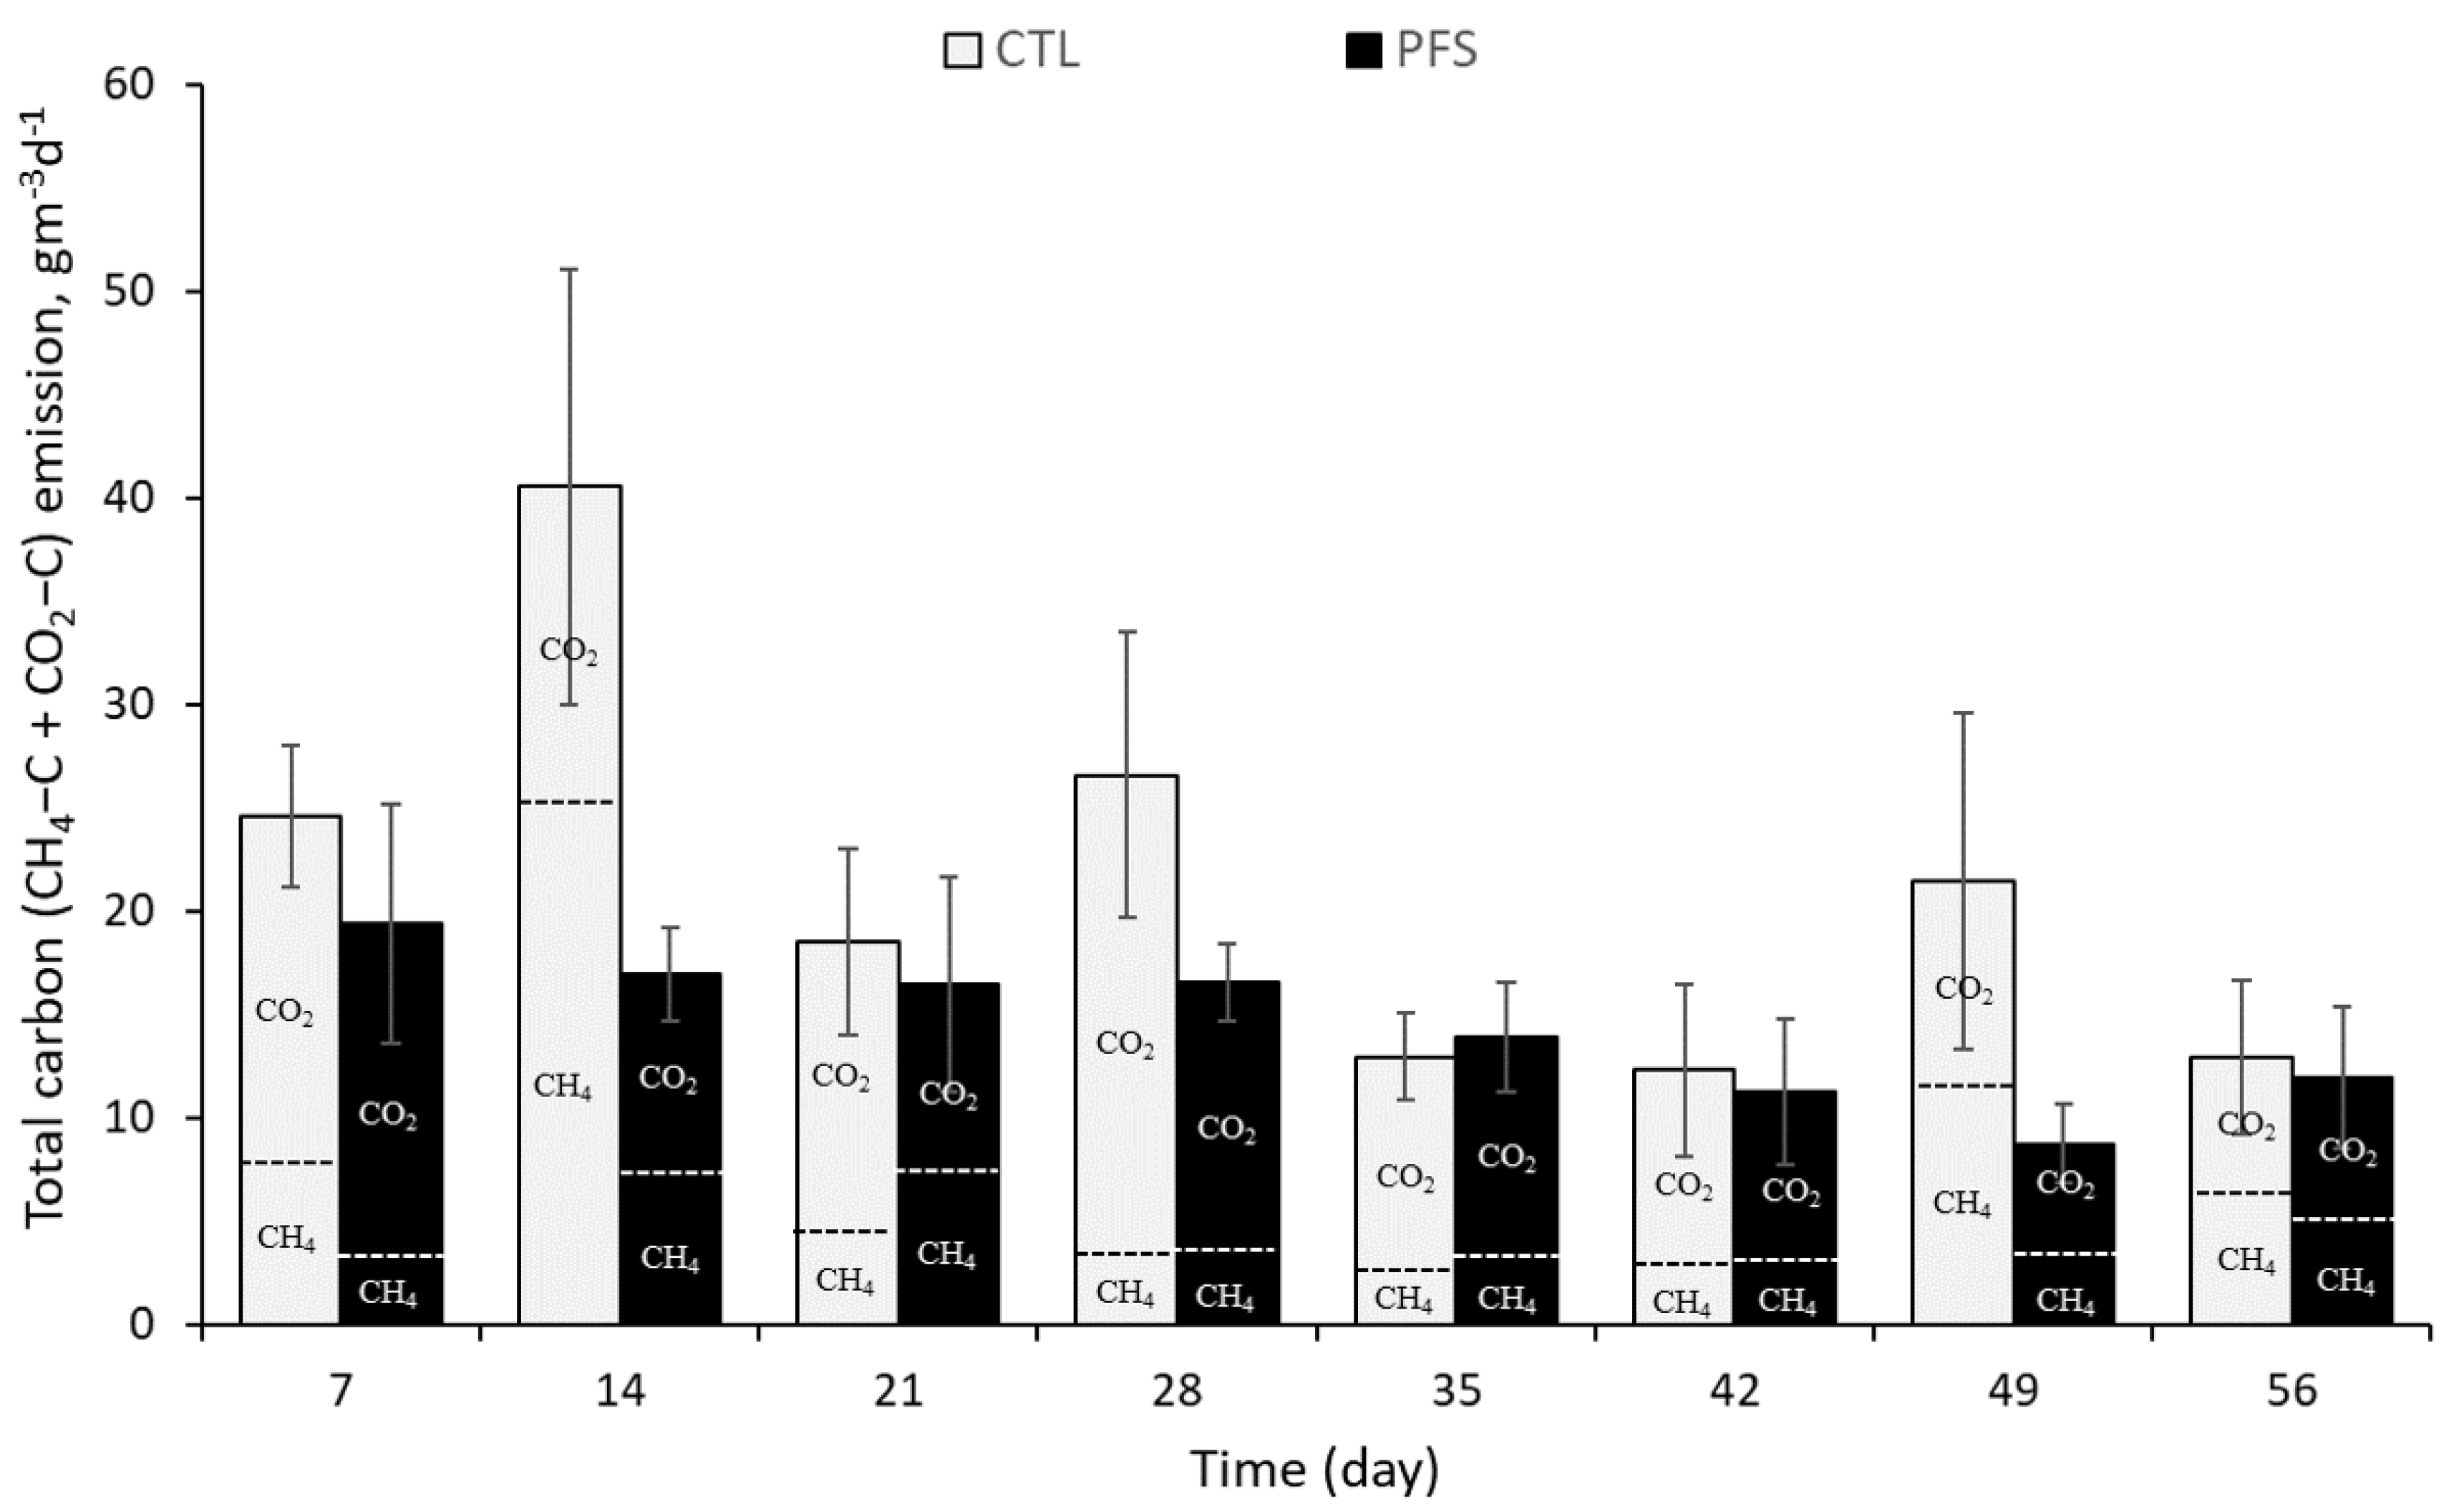
3.1. CH4 and CO2 Emissions during Storage of Pig Slurry

Cumulative CH4 and CO2 emissions during the experiment were reduced by about 44% and 23% in the PFS compared with the CTL (Figure 2 and Figure 3). In the fresh slurry on the day of the start of the experiment, CH4 emissions were not expected to be high due to the minor involvement of methanogenic microorganisms [20], so the measurement of CH4 emissions was carried out seven days after the start of the experiment. A significant difference between PFS and CTL in cumulative methane emissions during the experimental period occurred from day 49 (Figure 2). The daily CH4 emission of CTL ranged from 3.9 to 34.8 g·m−3·d−1, and the range of fluctuation was greater than that of the PFS (4.2 to 10.0 g·m−3·d−1). This study found that the amount of CH4 emissions from pig slurry produced by CTL falls within the range of 5 to 75 g·m−3·d−1 that has been reported in other studies conducted under comparable conditions [12,13,14]. As a precursor study to this research, an evaluation was conducted using respiration chambers to assess the effect of peat moss diet supplementation (3.0% wet basis) on CH4 emissions from sows during the pre-storage phase of manure [41]. The research conducted over eight days revealed that the average CH4 emissions from the control and treatment groups were 14.96 g·d−1·head−1 and 14.57 g·d−1·head−1, respectively, indicating no significant effect of peat moss. Using a 3.0% peat moss feed additive affected CH4 emissions in a storage environment rather than during the rearing stage.
During most of the experimental period, CO2 emissions in the CTL were higher than in the PFS, and the increase was considerable on the 28th day (Figure 3). PFS also showed a slight increase in daily CO2 generation on the 28th day and decreased until the 49th day. Twenty-eight days after the initiation of the experiment coincided with the period of highest temperature (34 °C) observed throughout the experiment. Thus, it can be inferred that there was an increase in CO2 emissions in both the PFS and CTL during this period [12].
The daily CO2 emission of the CTL ranged from 23.3 to 83.7 g·m−3·d−1, indicating a considerable degree of emission fluctuation over time. This fluctuation range was greater than that of the PFS system, which exhibited a range of CO2 emissions from 18.6 to 59.5 g·m−3·d−1. The CO2 emissions from pig slurry produced by the CTL were slightly lower than the range reported in other research (50 to 300 g·m−3·d−1) conducted under comparable conditions [12].
The daily and cumulative emissions of CH4 and CO2 per VS for the five sampling periods were analyzed (Table 3). The daily CH4 emission of CTL ranges from 0.05 to 0.54 g·kg−1 VS·d−1 and of PFS ranges from 0.05 to 0.15 g·kg−1 VS·d−1. Except for the second period of daily CO2 emissions per VS, where a p-value of <0.05 was observed, there were no statistically significant differences between PFS and CTL in terms of daily CH4 and CO2 emissions per VS. Table 1 indicates that there were no significant differences in the concentrations of organic matter components, including TS, VS, and carbon, between the PFS and CTL. This result suggests that peat moss as a feed additive has no significant effect on the degradation of organic matter in pig slurry due to enhanced feed efficiency. Consequently, it can be surmised that the lower CH4 emissions observed in PFS compared with CTL are attributable to the distinctive biochemical properties of HS rather than a reduction in organic matter. PFS has significantly higher levels of humic acid, fulvic acid, and humin than CTL, by a factor of 2.3, 1.8, and 1.1, respectively, which lends credence to this inference (Table 2). Prior research has documented that HS is critical in restraining methanogenesis or hydrolysis in anaerobic digestion [25,26,27,28].
Although the daily emissions of CH4 and CO2 per VS were not significantly different between PFS and CTL, the present study found that the decomposition of degradable substances in the pig slurry of CTL occurred primarily during the second and third period, while the decomposition of recalcitrant substances occurred slowly after that, leading to a gradual decrease in the daily emissions of CH4 and CO2 over time.
The cumulative emissions of CH4 and CO2 per VS were lower in the PFS than in the CTL, but no statistically significant differences were observed (p > 0.05). The cumulative CH4 emission of the CTL was 7.74 g·kg−1 VS, which was approximately 3.5 times lower than the CH4 emission reported in a previous study [12].
The discrepancy between our experimental results and those reported in other studies is likely attributable to differences in the characteristics of the pig slurry and variations in temperature conditions. The notable variation in CH4 emissions observed during a specific period in the control group is attributed to the intermittent release of CH4 through ebullition [42]. Furthermore, the high variability of gas concentrations, including CO2 and CH4, in livestock manure slurry and their tendency to reach maximum values are well-established phenomena in laboratory-scale studies [42,43].
Based on the daily and cumulative emissions of CH4 and CO2 per VS, the present study suggests that incorporating 3.0% peat moss into conventional pig feed may be an effective way to reduce CH4 and CO2 emissions. This finding can be explained by the improved feed efficiency that leads to a lower organic matter content in pig slurry, ultimately reducing the emissions of CH4 and CO2 [20].

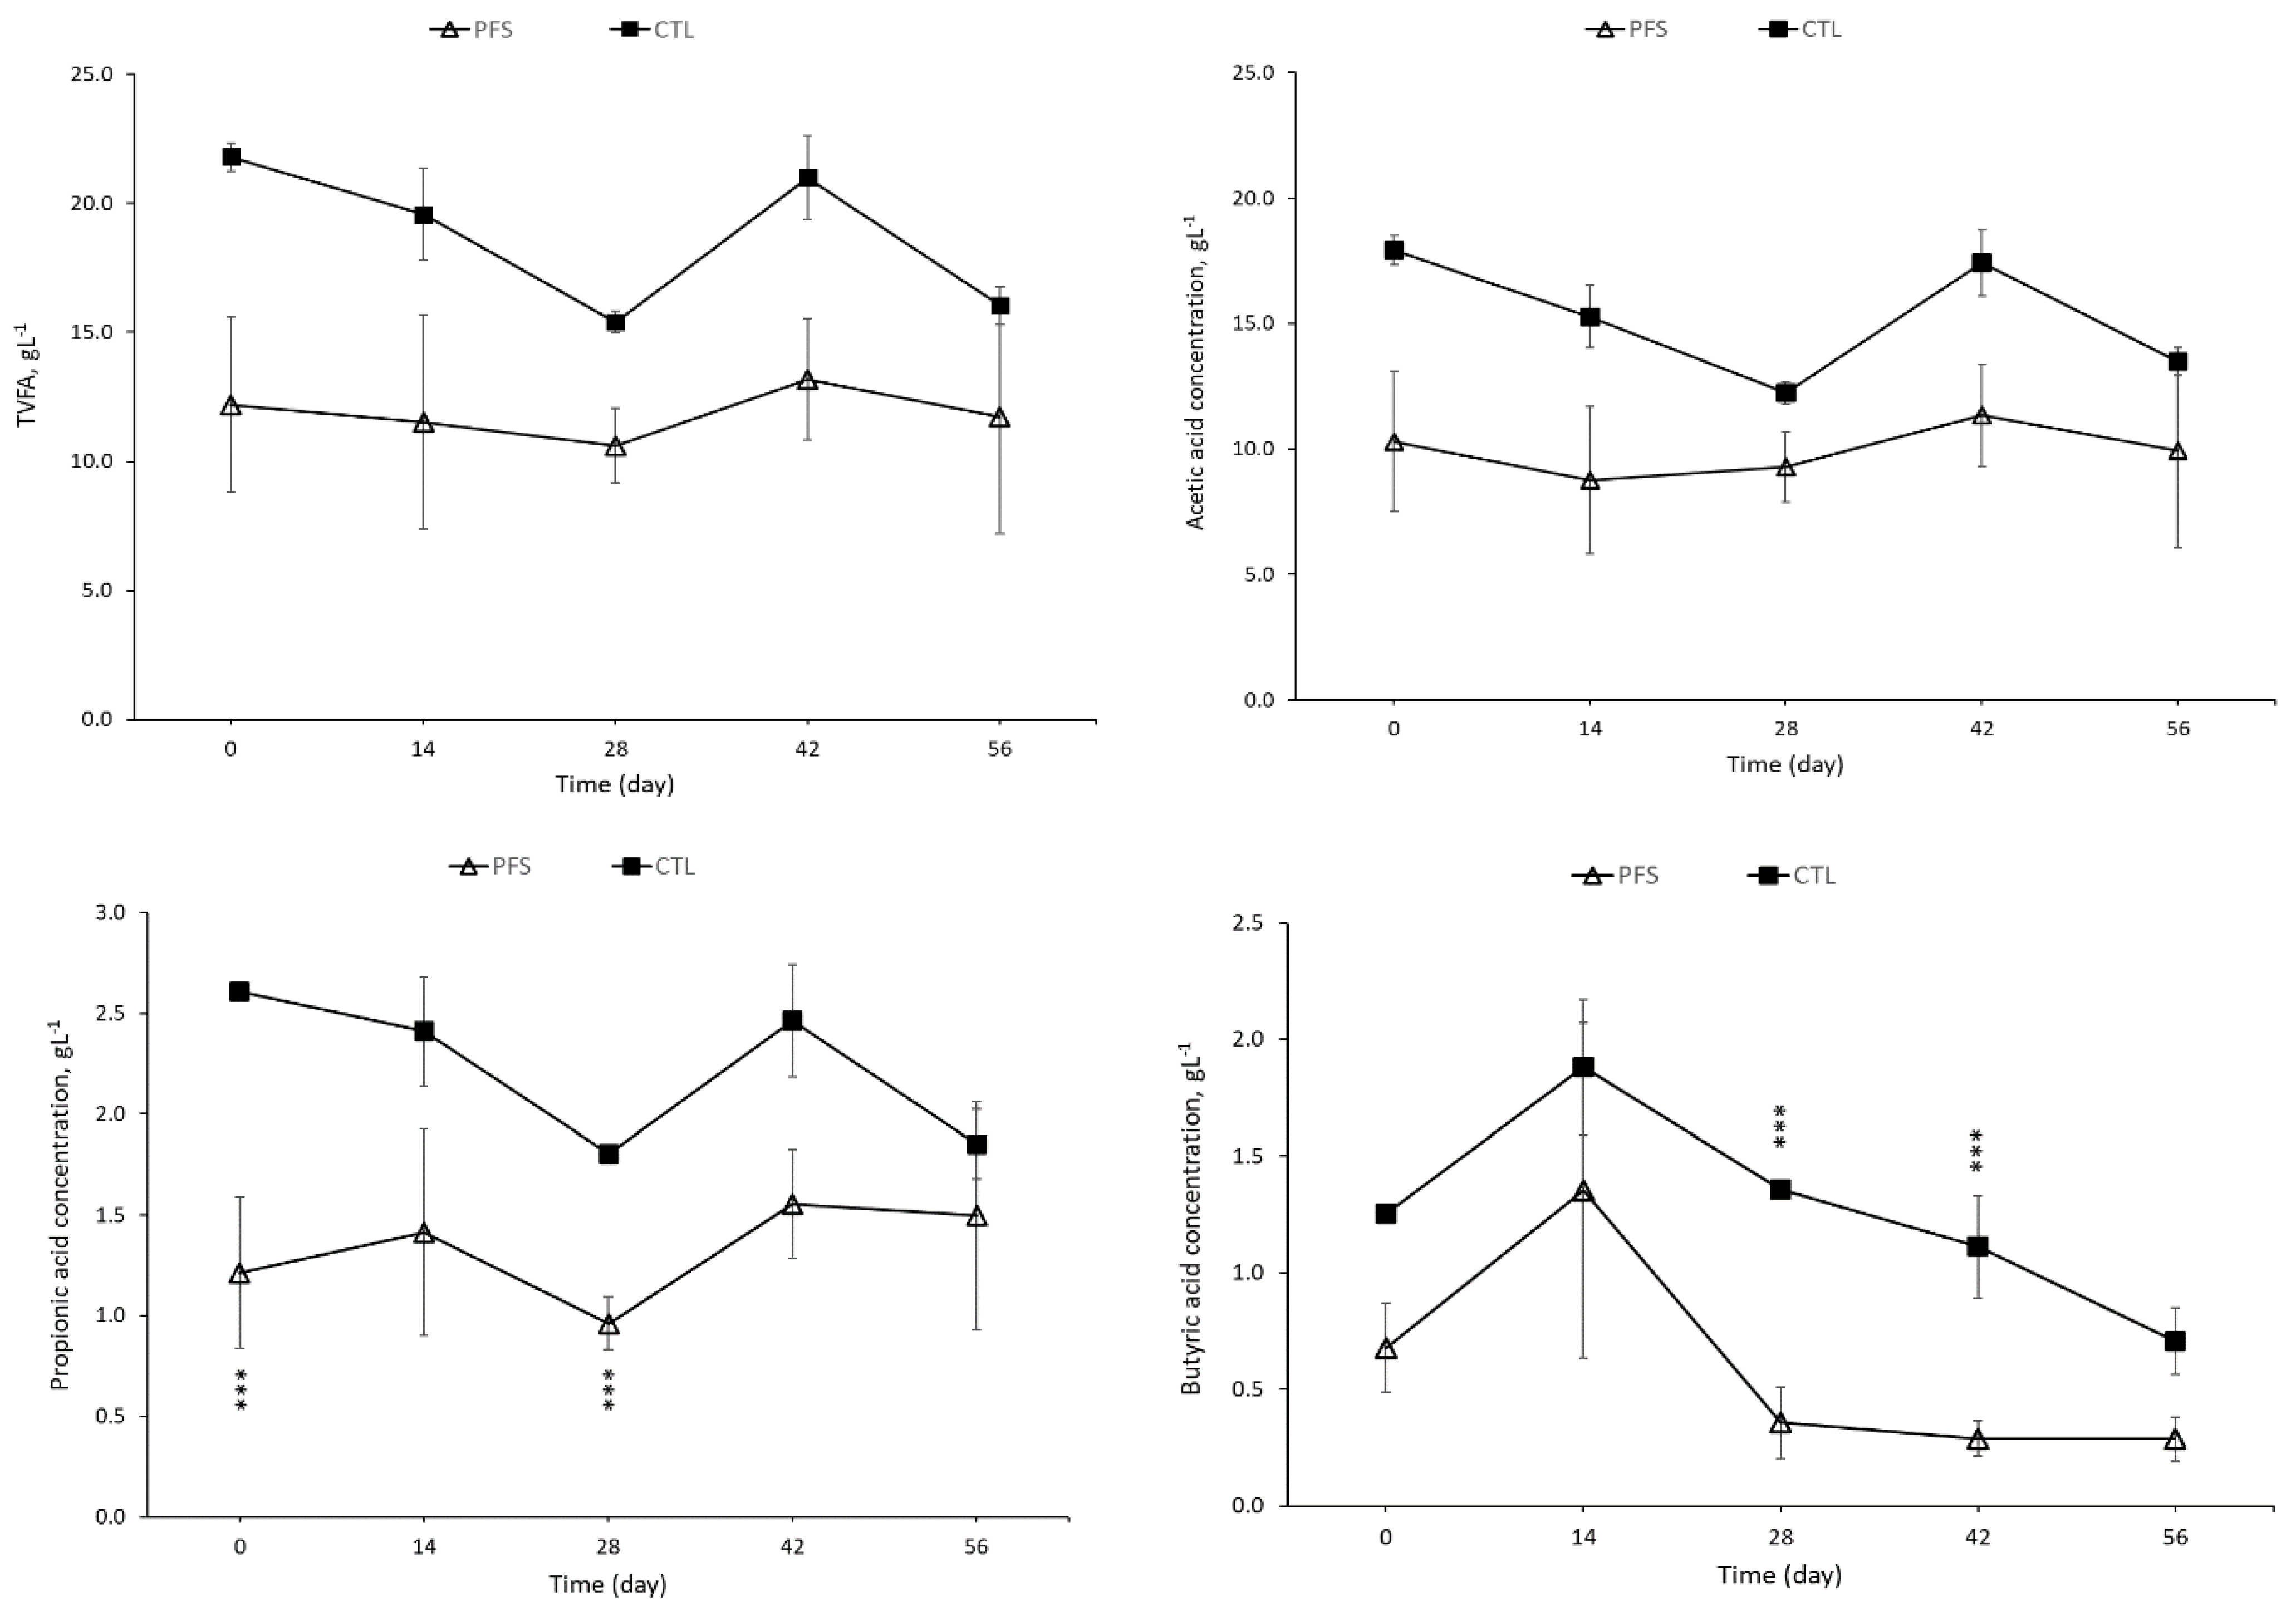
3.2. Concentration of Volatile Fatty Acid (VFA) in Pig Slurry

Figure 4 depicts the changes in VFA concentration in the pig slurry over the storage period. Considering the temporal variations in TVFA concentration observed in the pig slurry of PFS and CTL, it can be concluded that the concentration decreased until day 28, increased until day 42, and then decreased again until day 56. This trend indicates a complex dynamic in the formation and degradation of VFA in the pig slurry. A negative correlation between VFA concentration and CH4 emissions in pig slurry [20] implies that the period of TVFA accumulation (28–42 days) was related to a decrease in CH4 emissions, whereas the periods of TVFA decrease (0–28 days, 42–56 days) were related to an increase in CH4 emissions.
During anaerobic digestion, VFA is sequentially generated through hydrolysis and acidogenesis. Methanogenic microorganisms then utilize this VFA to produce CH4. As a result, the concentration of VFA tends to increase immediately before the increase in CH4 emissions and then decrease shortly after the increase in CH4 emissions. This pattern is because the production of VFA precedes the production of CH4 in the anaerobic digestion process.
In the first two weeks of storage (0–14 d), the concentration of TVFA and emission of CO2 decreased, and CH4 emission increased (Table 3, Figure 4). It is assumed that the methanogenesis activity increased due to the slurry’s anaerobic decomposition of organic substances. In the third period (15–28 d), CO2 increased, and TVFA concentration and CH4 emission decreased. From the second week of pig slurry storage, the rate of methanogenesis was stagnant, while fermentation and aerobic respiration of pig slurry were presumed to be active [20]. In the fourth period (29–42 d), only TVFA concentration increased, while emissions of both CO2 and CH4 decreased. The proliferation of acidogenic fermentative bacteria in the pig slurry led to the buildup of VFA, which, in turn, suppressed the emissions of CO2 and CH4. During the fifth experiment period (43–56 d), a decrease in TVFA concentration and CO2 emission was observed, accompanied by an increase in CH4 emission.
The results indicate that PFS tended to lower TVFA concentrations by 37 to 44% compared with CTL (Figure 4). However, statistical analyses revealed no significant differences between the PFS and CTL regarding TVFA, except propionic and butyric acid. Previous research has demonstrated that HS can elicit hydrolysis inhibition within a concentration range of 0.5–5.0 g·L−1 [28]. Two putative mechanisms underlying this inhibition have been posited: threshold-type inhibition, which involves the binding of humic acid to active sites of hydrolytic enzymes, thereby blocking substrate access and disrupting crucial cellular transport processes via binding to bacterial cell walls [26].
HS represent an important outcome of the aerobic composting process and aerobic digestion, such as autothermal thermophilic aerobic digestion (ATAD), and are a crucial indicator for evaluating compost maturity [44,45]. As a core product of the process, they are vital for achieving a mature compost that can be used for soil amendments, which have been shown to enhance plant growth [46]. Therefore, aerobic digestion or composting systems are a better method for treating pig slurry with high levels of humic substances than anaerobic digestion.
Previous studies have explored the increased VFA content in pig slurry resulting from fibrous feedstuffs [47,48]. However, even though the peat moss used in our study had a high fiber content, a 3% inclusion of peat moss had a limited impact on enhancing VFA levels in the pig slurry. The authors of [49] examined factors affecting VFA content in stored pig slurry, encompassing diet, season, storage location, conditions (covered or aerated), and pig operation type (finishing, sow, mixed), with pig operation type emerging as the most prominent factor. In the present study, maintaining consistent conditions except for dietary variations, the utilization of excreted sow slurry enabled the attribution of the observed difference in VFA content between the PFS and CTL mainly to the presence or absence of peat moss supplementation.
During the experimental period, the pH of the CTL and PFS ranged from 7.4 to 7.8 and 7.5 to 8.1, respectively. The relationship between VFA accumulation and pH decrease in the pig slurry did not show a clear trend in either group.

3.3. Changes in CH4 Carbon (CH4-C), CO2 Carbon (CO2-C), and Carbon Dioxide Equivalent (CO2-eq.) Emissions during Storage of Pig Slurry

A comparative analysis of carbon emissions was conducted to determine the gaseous carbon sources contributing to decreased CO2 and CH4 emissions in PFS. Figure 5 presents the total carbon emissions (CH4-C + CO2-C) of PFS and CTL. As previously observed, cumulative CO2 and CH4 emissions decreased by 23% and 44% in PFS compared with CTL, respectively.
On the 7th day of storage, CTL and PFS showed higher carbon emissions in the form of CO2 compared with CH4. CO2 accounted for 66% and 84% of the total carbon emissions in CTL and PFS, respectively. On the 14th day of storage, the contribution of carbon emissions from CH4 in CTL increased, accounting for 65% of the total carbon emissions. PFS increased CH4-C emissions compared with the previous week, but CO2 still accounted for about half of the total carbon emissions. During the subsequent storage period, the proportion of CO2 in the total carbon emissions was dominant in PFS until day 49 (average of 66% of total carbon emissions) and in CTL until day 42 (average of 78% of total carbon emissions). The percentage of CH4 in total carbon emissions ranged from 16 to 46% and 14 to 65% in PFS and CTL, respectively, comparable to the maximum values of 50–70% reported in other studies [16,50,51].
In the storage of pig slurry, CO2 emissions exceed those of CH4 when assessed based on total carbon emissions. However, when expressed in terms of CO2-eq., CH4 significantly influences greenhouse gas emissions. During the experimental period, the emissions of CH4-C and CO2-C converted to CO2-eq. displayed a different trend from the total carbon emissions (Table 4). The results of this study indicate that, in both PFS and CTL, the amount of CH4 emissions converted into CO2-eq. exceeded that of CO2 emissions throughout the entire storage period. This persistent pattern of CH4 dominance in the total carbon emissions is consistent with CH4 accounting for about 93% and 95% of the total carbon emissions in PFS and CTL, respectively. These findings are in contrast to those presented in Figure 5. Furthermore, PFS was found to have approximately 43% less impact on greenhouse gas emissions than CTL.
Overall, these results suggest that CH4 emissions during the 56-day storage period are a significant contributor to greenhouse gas emissions in pig slurry storage and should be carefully monitored and managed in efforts to mitigate the environmental impacts of agricultural waste management practices. Although CH4 emissions from pigs contribute a smaller proportion compared with the cattle’s impact from enteric fermentation on greenhouse gas generation, their significance remains pronounced in CH4 production through their integral role in manure management [1]. The methane emission factor originating from the storage of slurry in pig housing exhibits a range of 63.3 to 42.2 g·kg−1 VS·yr−1 within cool climate zones, 116.6 to 123.6 g·kg−1 VS·yr−1 within temperate climate zones, and 177.9 to 223.1 g·kg−1 VS·yr−1 within warm climate zones [52].
These findings suggest that implementing PFS may be a promising approach for mitigating carbon emissions, with potential implications for environmental sustainability and climate change mitigation efforts.

4. Conclusions

During the experiment period of about two months, peat moss feeding reduced CO2 and CH4 emissions from pig slurry by 23 and 44%, respectively, compared with the control group. The daily CH4 and CO2 emission fluctuations were lower in PFS compared with CTL. The present study’s results indicate that the HS levels were significantly higher in PFS than CTL. These findings suggest that the elevated HS levels observed in the PFS may play a pivotal role in constraining hydrolysis during anaerobic digestion. Consequently, the PFS tended to lower TVFA concentrations compared with the CTL.
When converting CH4 and CO2 emissions to carbon emissions (CH4-C + CO2-C), it was found that more carbon was emitted from CO2 than CH4 during the storage period. However, when expressed as CO2-eq., CH4 dominated carbon emissions during the entire storage period in both PFS and CTL, with CH4 accounting for 93% and 95% of the total carbon emissions, respectively. PFS was also found to have a lower impact on greenhouse gas emissions than CTL, with a reduction of approximately 43% according to cumulative CO2-eq. emissions.
Overall, this study suggests that implementing PFS may be a practical approach to mitigating carbon emissions and promoting environmental sustainability and climate change mitigation. This study provides fundamental data on the impact of peat moss feeding on CH4 and CO2 emissions during pig house storage periods, and these data can be utilized to conduct additional scaled-up experiments. It is hypothesized that aerobic digestion or composting systems could be more appropriate for treating stored pig slurry with high HS levels rather than anaerobic digestion. Further pilot- or field-scale experiments are required to identify the most suitable subsequent treatment processes for stored PFS.
However, the short-term experimental duration and the inherent variability in CH4 and CO2 emission measurements associated with laboratory-scale experiments are limitations of this study. Peat moss feeding can be a cost-effective approach for achieving carbon neutrality in the livestock industry. To this end, it is crucial to determine the optimal peat moss feeding ratio for pigs to maximize the reduction in CH4 and CO2 emissions. Furthermore, further research is needed to examine the effect of peat moss on greenhouse gas reduction in various livestock species and at different breeding stages.

Supplementary Materials

The following supporting information can be downloaded at: https://www.mdpi.com/article/10.3390/app131810492/s1, Figure S1: Changes in VFA (isobutyric acid, isovaleric acid, n-valeric acid, isocaproic acid, n-caproic acid, and heptanoic acid) concentration over time in PFS and CTL during the experimental period (56 d).

Author Contributions

Conceptualization, H.A. and J.L.; methodology, H.A.; software, J.L.; validation, H.A. and J.L.; formal analysis, J.L.; investigation, J.L.; data curation, J.L.; writing—original draft preparation, J.L.; writing—review and editing, H.A.; visualization, J.L.; supervision, H.A.; project administration, H.A.; funding acquisition, H.A. All authors have read and agreed to the published version of the manuscript.

Funding

This research was funded by Cargill Agri Purina, Inc. (Korea), project number 2022-0341-01.

Institutional Review Board Statement

Not applicable.

Informed Consent Statement

Not applicable.

Data Availability Statement

Not applicable.

Acknowledgments

The authors would like to acknowledge JH Shin, YJ Lee, DH Kim, and SH Lee for their assistance in preparing experimental materials and conducting instrument analysis.

Conflicts of Interest

The authors declare no conflict of interest. The funders had no role in the design of the study; in the collection, analyses, or interpretation of data; in the writing of the manuscript; or in the decision to publish the results.

References

  1. Climate and Clean Air Coalition, United Nations Environment Programme (UNEP). Global Methane Assessment: Benefits and Costs of Mitigating Methane Emissions; United Nations Environment Programme: Nairobi, Kenya, 2021. [Google Scholar]
  2. Iyer, G.; Ou, Y.; Edmonds, J.; Fawcett, A.A.; Hultman, N.; McFarland, J.; Fuhrman, J.; Waldhoff, S.; McJeon, H. Ratcheting of climate pledges needed to limit peak global warming. Nat. Clim. Chang. 2022, 12, 1129–1135. [Google Scholar] [CrossRef]
  3. Whitehead, T.R.; Cotta, M.A. Phylogenetic diversity of methanogenic archaea in swine waste storage pits. FEMS Microbiol. Lett. 1999, 179, 223–226. [Google Scholar] [CrossRef] [PubMed]
  4. Van der Meer, H.G.; Sommer, S.G.; Smith, K.; Matsunaka, T.; Ong, H.K. Guidelines for sustainable manure management in Asian livestock production systems. In Guidelines for Sustainable Manure Management in Asian Livestock Production Systems; International Atomic Energy Agency: Vienna, Austria, 2008; pp. 1–118. [Google Scholar]
  5. Wi, J.; Lee, S.; Kim, E.; Lee, M.; Koziel, J.A.; Ahn, H. Evaluation of semi-continuous pit manure recharge system performance on mitigation of ammonia and hydrogen sulfide emissions from a swine finishing barn. Atmosphere 2019, 10, 170. [Google Scholar] [CrossRef]
  6. Harrison, J.; Smith, D. Manure Storage, Process Improvement for Animal Feeding Operations; Cooperative Extension Service, Utah State University: Logan, UT, USA, 2004. [Google Scholar]
  7. Li, Y.; Liu, H.; Li, G.; Luo, W.; Sun, Y. Manure digestate storage under different conditions: Chemical characteristics and contaminant residuals. Sci. Total Environ. 2018, 639, 19–25. [Google Scholar] [CrossRef]
  8. Mostafa, E.; Selders, A.; Buescher, W. Aeration of pig slurry affects ammonia and greenhouse gases emissions. Int. J. Environ. Sci. Technol. 2019, 16, 7327–7338. [Google Scholar] [CrossRef]
  9. Jang, Y.N.; Hwang, O.; Jung, M.W.; Ahn, B.K.; Kim, H.; Jo, G.; Yun, Y.M. Comprehensive analysis of microbial dynamics linked with the reduction of odorous compounds in a full-scale swine manure pit recharge system with recirculation of aerobically treated liquid fertilizer. Sci. Total Environ. 2021, 777, 146122. [Google Scholar] [CrossRef]
  10. Gavrilova, O.; Leip, A.; Dong, H.; MacDonald, J.D.; Gomez Bravo, C.A.; Amon, B.; Barahona Rosales, R.; Prado, A.D.; de Lima, M.A.; Oyhantcabal, W.; et al. Emmisions from Livestock and Manure Management. 2019. Available online: https://www.alice.cnptia.embrapa.br/alice/bitstream/doc/1119362/1/Limaemissionslivestock2019.pdf (accessed on 10 July 2023).
  11. Park, K.H.; Thompson, A.G.; Marinier, M.; Clark, K.; Wagner-Riddle, C. Greenhouse gas emissions from stored liquid swine manure in a cold climate. Atmos. Environ. 2006, 40, 618–627. [Google Scholar] [CrossRef]
  12. Misselbrook, T.; Hunt, J.; Perazzolo, F.; Provolo, G. Greenhouse gas and ammonia emissions from slurry storage: Impacts of temperature and potential mitigation through covering (pig slurry) or acidification (cattle slurry). J. Environ. Qual. 2016, 45, 1520–1530. [Google Scholar] [CrossRef]
  13. Martinez, J.; Guiziou, F.; Peu, P.; Gueutier, V. Influence of treatment techniques for pig slurry on methane emissions during subsequent storage. Biosyst. Eng. 2003, 85, 347–354. [Google Scholar] [CrossRef]
  14. Petersen, S.O.; Dorno, N.; Lindholst, S.; Feilberg, A.; Eriksen, J. Emissions of CH4, N2O, NH3 and odorants from pig slurry during winter and summer storage. Nutr. Cycl. Agroecosyst. 2013, 95, 103–113. [Google Scholar] [CrossRef]
  15. Dinuccio, E.; Berg, W.; Balsari, P. Gaseous emissions from the storage of untreated slurries and the fractions obtained after mechanical separation. Atmos. Environ. 2008, 42, 2448–2459. [Google Scholar] [CrossRef]
  16. Moset, V.; Cambra-López, M.; Estellés, F.; Torres, A.G.; Cerisuelo, A. Evolution of chemical composition and gas emissions from aged pig slurry during outdoor storage with and without prior solid separation. Biosyst. Eng. 2012, 111, 2–10. [Google Scholar] [CrossRef]
  17. Petersen, S.O.; Højberg, O.; Poulsen, M.; Schwab, C.; Eriksen, J. Methanogenic community changes, and emissions of methane and other gases, during storage of acidified and untreated pig slurry. J. Appl. Microbiol. 2014, 117, 160–172. [Google Scholar] [CrossRef]
  18. Philippe, F.X.; Nicks, B. Review on greenhouse gas emissions from pig houses: Production of carbon dioxide, methane and nitrous oxide by animals and manure. Agric. Ecosyst. Environ. 2015, 199, 10–25. [Google Scholar] [CrossRef]
  19. Petersen, S.O.; Miller, D.N. Perspective Greenhouse gas mitigation by covers on livestock slurry tanks and lagoons? J. Sci. Food Agric. 2006, 86, 1407–1411. [Google Scholar] [CrossRef]
  20. Dalby, F.R.; Hafner, S.D.; Petersen, S.O.; VanderZaag, A.C.; Habtewold, J.; Dunfield, K.; Chantigny, M.H.; Sommer, S.G. Understanding methane emission from stored animal manure: A review to guide model development. J. Environ. Qual. 2021, 50, 817–835. [Google Scholar] [CrossRef] [PubMed]
  21. Blodau, C.; Deppe, M. Humic acid addition lowers methane release in peats of the Mer Bleue bog, Canada. Soil Biol. Biochem. 2012, 52, 96–98. [Google Scholar] [CrossRef]
  22. Shah, S.B.; Kolar, P. Evaluation of additive for reducing gaseous emissions from swine waste. Agric. Eng. Int. CIGR J. 2012, 14, 10–20. [Google Scholar]
  23. Liang, T.; Elmaadawy, K.; Liu, B.; Hu, J.; Hou, H.; Yang, J. Anaerobic fermentation of waste activated sludge for volatile fatty acid production: Recent updates of pretreatment methods and the potential effect of humic and nutrients substances. Process Saf. Environ. Prot. 2021, 145, 321–339. [Google Scholar] [CrossRef]
  24. Trckova, M.; Matlova, L.; Hudcova, H.; Faldyna, M.; Zraly, Z.; Dvorska, L.; Beran, V.; Pavlik, I. Peat as a feed supplement for animals: A literature review. Vet. Med. 2005, 50, 361. [Google Scholar] [CrossRef]
  25. Valenzuela, E.I.; Cervantes, F.J. The role of humic substances in mitigating greenhouse gases emissions: Current knowledge and research gaps. Sci. Total Environ. 2021, 750, 141677. [Google Scholar] [CrossRef]
  26. Yap, S.D.; Astals, S.; Lu, Y.; Peces, M.; Jensen, P.D.; Batstone, D.J.; Tait, S. Humic acid inhibition of hydrolysis and methanogenesis with different anaerobic inocula. Waste Manag. 2018, 80, 130–136. [Google Scholar] [CrossRef] [PubMed]
  27. Azman, S.; Khadem, A.F.; Plugge, C.M.; Stams, A.J.; Bec, S.; Zeeman, G. Effect of humic acid on anaerobic digestion of cellulose and xylan in completely stirred tank reactors: Inhibitory effect, mitigation of the inhibition and the dynamics of the microbial communities. Appl. Microbiol. Biotechnol. 2017, 101, 889–901. [Google Scholar] [CrossRef] [PubMed]
  28. Fernandes, T.V.; van Lier, J.B.; Zeeman, G. Humic acid-like and fulvic acid-like inhibition on the hydrolysis of cellulose and tributyrin. Bioenergy Res. 2015, 8, 821–831. [Google Scholar] [CrossRef]
  29. Hyun-Sang, S.; Ki-Hoon, K. Chemical and spectroscopic characterization of peat moss and its different humic fractions (Humin, Humic acid and fulvic acid). J. Soil Groundw. Environ. 2004, 9, 42–51. [Google Scholar]
  30. Kocabağli, N.; Alp, M.; Acar, N.; Kahraman, R. The effects of dietary humate supplementation on broiler growth and carcass yield. Poult. Sci. 2002, 81, 227–230. [Google Scholar] [CrossRef]
  31. Wang, Q.; Chen, Y.J.; Yoo, J.S.; Kim, H.J.; Cho, J.H.; Kim, I.H. Effects of supplemental humic substances on growth performance, blood characteristics and meat quality in finishing pigs. Livest. Sci. 2008, 117, 270–274. [Google Scholar] [CrossRef]
  32. Ji, F.; McGlone, J.J.; Kim, S.W. Effects of dietary humic substances on pig growth performance, carcass characteristics, and ammonia emission. J. Anim. Sci. 2006, 84, 2482–2490. [Google Scholar] [CrossRef]
  33. Fuchs, B.; Orda, J.; Preś, J.; Muchowicz, M. The effect of feeding piglets up to the 100th day of their life with peat preparation on their growth and physiological and biochemical indices. Arch. Vet. Pol. 1995, 35, 97–107. [Google Scholar]
  34. Ozturk, E.; Ocak, N.; Turan, A.; Erener, G.; Altop, A.; Cankaya, S. Performance, carcass, gastrointestinal tract and meat quality traits, and selected blood parameters of broilers fed diets supplemented with humic substances. J. Sci. Food Agric. 2012, 92, 59–65. [Google Scholar] [CrossRef]
  35. Ozturk, E.; Ocak, N.; Coskun, I.; Turhan, S.; Erener, G. Effects of humic substances supplementation provided through drinking water on performance, carcass traits and meat quality of broilers. J. Anim. Physiol. Anim. Nutr. 2010, 94, 78–85. [Google Scholar] [CrossRef] [PubMed]
  36. Arif, M.; Alagawany, M.; Abd El-Hack, M.E.; Saeed, M.; Arain, M.A.; Elnesr, S.S. Humic acid as a feed additive in poultry diets: A review. Iran. J. Vet. Res. 2019, 20, 167. [Google Scholar] [PubMed]
  37. Arif, M.; Rehman, A.; Abd El-Hack, M.E.; Saeed, M.; Khan, F.; Akhtar, M.; Swelum, A.A.; Saadeldin, I.M.; Alowaimer, A.N. Growth, carcass traits, cecal microbial counts, and blood chemistry of meat-type quail fed diets supplemented with humic acid and black cumin seeds. Asian-Australas. J. Anim. Sci. 2018, 31, 1930. [Google Scholar] [CrossRef] [PubMed]
  38. Chastain, J.P.; Camberato, J.J.; Albrecht, J.E.; Adams, J. Swine manure production and nutrient content. In South Carolina Confined Animal Manure Managers Certification Program; Clemson University: Clemson, SC, USA, 1999; pp. 1–17. [Google Scholar]
  39. Haug, R.T. The Practical Handbook of Compost Engineering; Routledge: London, UK, 2018. [Google Scholar]
  40. American Public Health Association. Standard Methods for the Examination of Water and Wastewater (2540B, 2540E); APHA: Washington, DC, USA, 1992. [Google Scholar]
  41. Lee, Y.J.; Kim, D.H.; Shin, J.H.; Lee, S.H.; Lee, J.H.; Ahn, H.K. Effect of peat moss diet supplementation on NH3, H2S, and CH4 emissions from sows. In Proceedings of the 19th Asian-Australasian Association of Animal Production (AAAP) Animal Science Congress. Animal Production for Human & Nature, ICC Jeju, Jeju, Republic of Korea, 23–26 August 2022. [Google Scholar]
  42. Kupper, T.; Häni, C.; Neftel, A.; Kincaid, C.; Bühler, M.; Amon, B.; VanderZaag, A. Ammonia and greenhouse gas emissions from slurry storage-A review. Agric. Ecosyst. Environ. 2020, 300, 106963. [Google Scholar] [CrossRef]
  43. Husted, S. An open chamber technique for determination of methane emission from stored livestock manure. Atmos. Environ. 1993, 27, 1635–1642. [Google Scholar] [CrossRef]
  44. Wu, J.; Zhao, Y.; Zhao, W.; Yang, T.; Zhang, X.; Xie, X.; Cui, H.; Wei, Z. Effect of precursors combined with bacteria communities on the formation of humic substances during different materials composting. Bioresour. Technol. 2017, 226, 191–199. [Google Scholar] [CrossRef]
  45. Guo, X.X.; Liu, H.T.; Wu, S.B. Humic substances developed during organic waste composting: Formation mechanisms, structural properties, and agronomic functions. Sci. Total Environ. 2019, 662, 501–510. [Google Scholar] [CrossRef]
  46. Pascual, I.; Azcona, I.; Aguirreolea, J.; Morales, F.; Corpas, F.J.; Palma, J.M.; Rellan-Alvarez, R.; Sanchez-Diaz, M. Growth, yield, and fruit quality of pepper plants amended with two sanitized sewage sludges. J. Agric. Food Chem. 2010, 58, 6951–6959. [Google Scholar] [CrossRef]
  47. Nguyen, Q.H.; Le, P.D.; Chim, C.; Le, N.D.; Fievez, V. Potential to mitigate ammonia emission from slurry by increasing dietary fermentable fiber through inclusion of tropical byproducts in practical diets for growing pigs. Asian-Australas. J. Anim. Sci. 2019, 32, 574. [Google Scholar] [CrossRef]
  48. Canh, T.T.; Aarnink, A.J.A.; Verstegen, M.W.A.; Schrama, J.W. Influence of dietary factors on the pH and ammonia emission of slurry from growing-finishing pigs. J. Anim. Sci. 1998, 76, 1123–1130. [Google Scholar] [CrossRef]
  49. Conn, K.L.; Topp, E.; Lazarovits, G. Factors influencing the concentration of volatile fatty acids, ammonia, and other nutrients in stored liquid pig manure. J. Environ. Qual. 2007, 36, 440–447. [Google Scholar] [CrossRef] [PubMed]
  50. Møller, H.B.; Sommer, S.G.; Ahring, B.K. Biological degradation and greenhouse gas emissions during pre-storage of liquid animal manure. J. Environ. Qual. 2004, 33, 27–36. [Google Scholar] [CrossRef] [PubMed]
  51. Sommer, S.G.; Petersen, S.O.; Sørensen, P.; Poulsen, H.D.; Møller, H.B. Methane and carbon dioxide emissions and nitrogen turnover during liquid manure storage. Nutr. Cycl. Agroecosyst. 2007, 78, 27–36. [Google Scholar] [CrossRef]
  52. Intergovernmental Panel on Climate Change. Synthesis Report (Contribution of Working Groups I, II and III to the Fifth Assessment Report of the Intergovernmental Panel on Climate Change); Intergovernmental Panel on Climate Change: Geneva, Switzerland, 2014. [Google Scholar]
Figure 1. Schematic diagram of the pig slurry pit simulator for measuring CH4 and CO2 emissions. PFS and CTL represent peat moss fed slurry and control, respectively.
Applsci 13 10492 g001
Figure 2. Cumulative and daily methane (CH4) emissions during the experiment. Error bars indicate standard error (n = 3). The statistical differences (p < 0.05) between PFS and CTL are marked as ***.
Applsci 13 10492 g002
Figure 3. Cumulative and daily carbon dioxide (CO2) emissions during the experiment. Error bars indicate standard error (n = 3). The statistical differences (p < 0.05) between PFS and CTL are marked as ***.
Applsci 13 10492 g003
Figure 4. Changes in VFA concentration over time in PFS and CTL during the experimental period (56 d). TVFA includes acetic acid, propionic acid, butyric acid, isobutyric acid, isovaleric acid, n-valeric acid, isocaproic acid, n-caproic acid, and heptanoic acid (Supplementary Materials). The statistical differences (p < 0.05) between PFS and CTL are marked as ***.
Applsci 13 10492 g004
Figure 5. Total carbon (CH4-C + CO2-C) emission in stored pig slurry during the experiment.
Applsci 13 10492 g005
Table 1. Physico-chemical properties of raw pig slurry obtained from CTL and PFS.
ParametersCTLPFS
pH7.8 ± 0.0 n.s.8.1 ± 0.0 n.s.
Total solid (TS, g·kg−1 slurry)127.5 ± 1.7 n.s.133.5 ± 3.8 n.s.
Volatile solid (VS, g·kg−1 slurry)103.4 ± 1.7 n.s.105.5 ± 3.9 n.s.
Carbon (C, g·kg−1 slurry)57.4 ± 0.9 n.s.58.6 ± 2.2 n.s.
Total volatile fatty acid (TVFA, g kg−1 slurry)24.0 ± 0.6 n.s.13.8 ± 3.5 n.s.
Data (means ± S.E., n = 3) with superscript n.s. indicates no significant difference (p > 0.05) between CTL and PFS. Carbon was calculated by dividing VS by a factor of 1.8 [39].
Table 2. Humic substances (HS) concentration of raw pig slurry and peat moss.
Humic SubstancesRaw Pig SlurryPeat Moss
CTLPFS
g·kg−1 slurryg·kg−1 slurry% TS
Humic acid0.08 ± 0.0 a0.18 ± 0.0 b6.43
Fulvic acid7.8 ± 0.1 a14.4 ± 0.2 b8.03
Humin54.3 ± 0.9 a60.8 ± 1.0 b26.5
Data (means ± S.E., n = 3) with different letters in the same row are significantly different (p < 0.05).
Table 3. CH4 and CO2 emissions per VS during the experiment period (56 days).
PeriodMethane (CH4)Carbon Dioxide (CO2)
Daily EmissionsCumulative EmissionsDaily EmissionsCumulative Emissions
PFSCTLp-ValuePFSCTLp-ValuePFSCTLp-ValuePFSCTLp-Value
g·kg−1 VS·d−1 g·kg−1 VS g·kg−1 VS·d−1 g·kg−1 VS
1st period
(0–7 d)
0.14 ± 0.050.16 ± 0.060.8290.97 ± 0.32 a1.09 ± 0.39 a0.8620.84 ± 0.250.84 ± 0.030.9925.85 ± 1.73 a5.88 ± 0.18 a0.991
2nd period
(8–14 d)
0.15 ± 0.040.54 ± 0.210.2032.05 ± 0.06 ab4.90 ± 1.15 ab0.1800.55 ± 0.030.82 ± 0.040.0099.68 ± 1.91 ab11.64 ± 0.26 ab0.453
3rd period
(15–28 d)
0.07 ± 0.010.06 ± 0.010.6293.00 ± 0.11 bc5.72 ± 1.25 ab0.2160.55 ± 0.061.00 ± 0.260.25017.36 ± 2.75 abc25.63 ± 3.97 abc0.235
4th period
(29–42 d)
0.05 ± 0.010.05 ± 0.021.0003.69 ± 0.05 cd6.40 ± 1.17 ab0.1990.34 ± 0.130.38 ± 0.130.83222.11 ± 1.93 bc31.01 ± 5.02 bc0.248
5th period
(43–56 d)
0.08 ± 0.020.10 ± 0.030.6014.75 ± 0.32 d7.74 ± 1.13 b0.1060.27 ± 0.080.26 ± 0.070.92525.94 ± 2.82 c34.61 ± 5.35 c0.307
Data (means ± S.E., n = 3) with different letters in the same column are significantly different (p < 0.05).
Table 4. Cumulative CO2-eq. emissions during the experiment period (56 days).
ParameterCumulative CO2-eq. Emissions
CH4-CCO2-CTotal
g·CO2-eq.·m−3g·CO2-eq.·m−3g·CO2-eq.·m−3
PFS7423 ± 601 a541 ± 34 7963 ± 634 a
CTL13,205 ± 1164 b717 ± 6113,922 ± 1224 b
To estimate CO2-eq., CH4 emissions were multiplied by a factor of 28 [52]. Values (means ± S.E., n = 3) followed by different letters such as a and b within columns are significantly different (p < 0.05).
Disclaimer/Publisher’s Note: The statements, opinions and data contained in all publications are solely those of the individual author(s) and contributor(s) and not of MDPI and/or the editor(s). MDPI and/or the editor(s) disclaim responsibility for any injury to people or property resulting from any ideas, methods, instructions or products referred to in the content.

