Article

Limit Equilibrium Analysis of Landfill Instability Based on Actual Failure Surface

1
Moe Key Laboratory of Soft Soils and Geoenvironmental Engineering, Department of Civil Engineering, Zhejiang University, Hangzhou 310058, China
2
Center for Hypergravity Experiment and Interdisciplinary Research, Zhejiang University, Hangzhou 310058, China
*
Author to whom correspondence should be addressed.
Appl. Sci. 2023, 13(18), 10498; https://doi.org/10.3390/app131810498
Submission received: 16 August 2023 / Revised: 7 September 2023 / Accepted: 13 September 2023 / Published: 20 September 2023

Abstract

:
Slope stability is one of the key engineering problems in the whole lifetime of landfills. In this paper, combined with the wedge limit equilibrium analysis, a landfill stability analysis method based on the actual failure surface is proposed, and the model is verified according to the data of centrifuge model tests. It is found that this method can more accurately calculate the factor of safety (FS) of the slope of the landfill and evaluate the stability of the slope. Finally, sensitivity analysis was conducted to evaluate the effects of the actual failure surface angle, water level, soil parameters, and the presence or absence of a dam on the factor of safety.

1. Introduction

A landfill is a commonly used method for municipal solid waste disposal, and the stability of the landfill slope is crucial during the entire life cycle of construction, operation, and closure [1,2,3,4]. In the past few decades, several serious landfill failures and landslides in urban solid waste have evolved into significant disasters and led to severe environmental pollution. The failure of the Payatas solid waste landfill in Manila, Philippines is one of the most catastrophic landfill failure and landslide cases, causing massive casualties and property losses.
Many scholars have conducted theoretical research on the stability analysis of solid waste landfills since the 1990s. The instability modes of the landfill can be categorized into six types, and the stability analysis can be performed based on the traditional limit equilibrium method [5,6,7]. Qian et al. [8,9] analyzed the stability of the landfill slope system by the two-wedge limit equilibrium method. On this basis, the three-wedge limit equilibrium method is also used to evaluate the stability of landfills and their engineering berms [10,11,12,13]. In these methods, it is assumed that the solid waste landfill slides along the surface of the liner system or the engineered berm, the sliding blocks are divided into active wedges and passive wedges, and the limit equilibrium method is used to calculate the FS. The advantage of these methods is their ease of use in engineering; however, matching the failure process of the slope can be difficult. In addition, these theoretical models do not consider the influence of the water level on slope stability due to (1) rainfall [14]; (2) a large amount of leachate generation [15,16]; and (3) leachate recirculation in the bioreactor landfill [17,18], resulting in the elevation of pore pressure in the slope and the accumulation of a large amount of leachate inside the waste body. Similarly, this is also a defect of the traditional slope limit equilibrium analysis method in the application of landfill stability analysis [19].
According to on-site investigation and research, it appears that the landfill’s instability may be caused by excessive pore water pressure due to continuous rainstorms [20]. Survey and monitoring data from ten large landfills indicate that high leachate levels and excessive water content are major or significant triggers for landfill instability [14]. Research [21] shows that landfill instability is often related to the accumulation of water levels at the bottom of the landfill. Blight [22] provides a detailed review of six serious MSW landfill failures between 1977 and 2005, pointing out that continuous heavy rainfall or poorly controlled leachate recirculation may have contributed to the failures through increased water levels. Zhang et al. [23] analyzed 62 historical cases of slope instability in landfill sites, and the high water level was the main cause in 25 of them. The presence of high water levels can also soften the bedrock at the bottom of the landfill [24]. Therefore, it is crucial to understand the triggering mechanism and evolution of MSW landfill failure caused by the increase in water level.
During a slope failure process, the interface between the active wedge, the passive wedge, and the block wedge is not vertical, as traditionally assumed in the wedge limit equilibrium analysis. In fact, the face between the wedges has a certain angle with the horizontal plane. The factors influencing this angle are very complex, such as slope geometry, waste characteristics, water level, and so on. Figure 1 shows the failure at Payatas landfill in the Philippines, in which about 30 m failure took place. It is not difficult to observe that the failure surface is a sector rather than perpendicular to the ground. A similar phenomenon occurred at the Meetotamulla landfill in Sri Lanka in 2017 [25].
However, it is difficult to model such a large geological landfill, and the influencing factors are complex; so, the centrifugal model test becomes a possible method to study landslide instability [26,27]. The centrifuge applies N times the gravity acceleration to the scaled model, achieving the same self-weight stress in the model as the prototype, with the prototype’s scale model macroscopic geometry size reduced by N times [28]. Therefore, the application of the centrifugal model to the study of slope stability in landfills has many advantages, such as the same stress conditions as large-scale geological slopes, easy-to-realize variation in water level, and simple model preparation. Chen et al. [29] studied the influence of water level rise on the stability of centrifugal landfill slopes with different slope ratios. Lv et al. [30] explored different failure patterns of centrifugal landfill slopes and predicted the reasonable failure surface close to the actual slip surface according to the limit equilibrium method. Their centrifuge model tests results showed that the failure surface is at an angle to the horizontal. An image analysis method can help us to identify the slip plane [31]. Therefore, considering the actual surface angle between the active wedge and the passive wedge when analyzing slope instability is practical and has engineering significance. Based on this assumption, it can help us predict the slope stability more accurately.
Based on prior research on landfill failure’s critical water level and common failure modes at high water levels, we enhanced the conventional two-wedge and three-wedge limit equilibrium analysis methods. We established the interface between the active and passive wedges based on the actual failure surface during the slip process and calculated the stability factor FS. The sensitivity analysis evaluated the impact of failure surface angle, water level, and soil parameters on the factor of safety.

2. Theoretical Model and Analysis Method

2.1. Basic Theory

A waste body without a dam is vulnerable to an integral slope failure as the water level increases. Engineered dams are crucial in preventing the waste from sliding along the liner interface and causing a catastrophic event. For a general landfill with a garbage dam, due to the continuous decomposition of solid waste during the landfill process, the body will undergo large deformation over time, and the dam can significantly improve the stability of the slope at this time. Due to the limitation of the displacement of the bottom of the waste body by the garbage dam, when the critical water level is reached, there is no obvious overall slip along the liner interface. Initially, cracks emerged at the base of the landfill, with minimal displacement of the lower portion. No failure surface was observed inside the waste body but the displacement of the upper portion continued to increase. Consequently, the cracks advanced and penetrated the top of the landfill. This damage was accompanied by significant horizontal displacement.
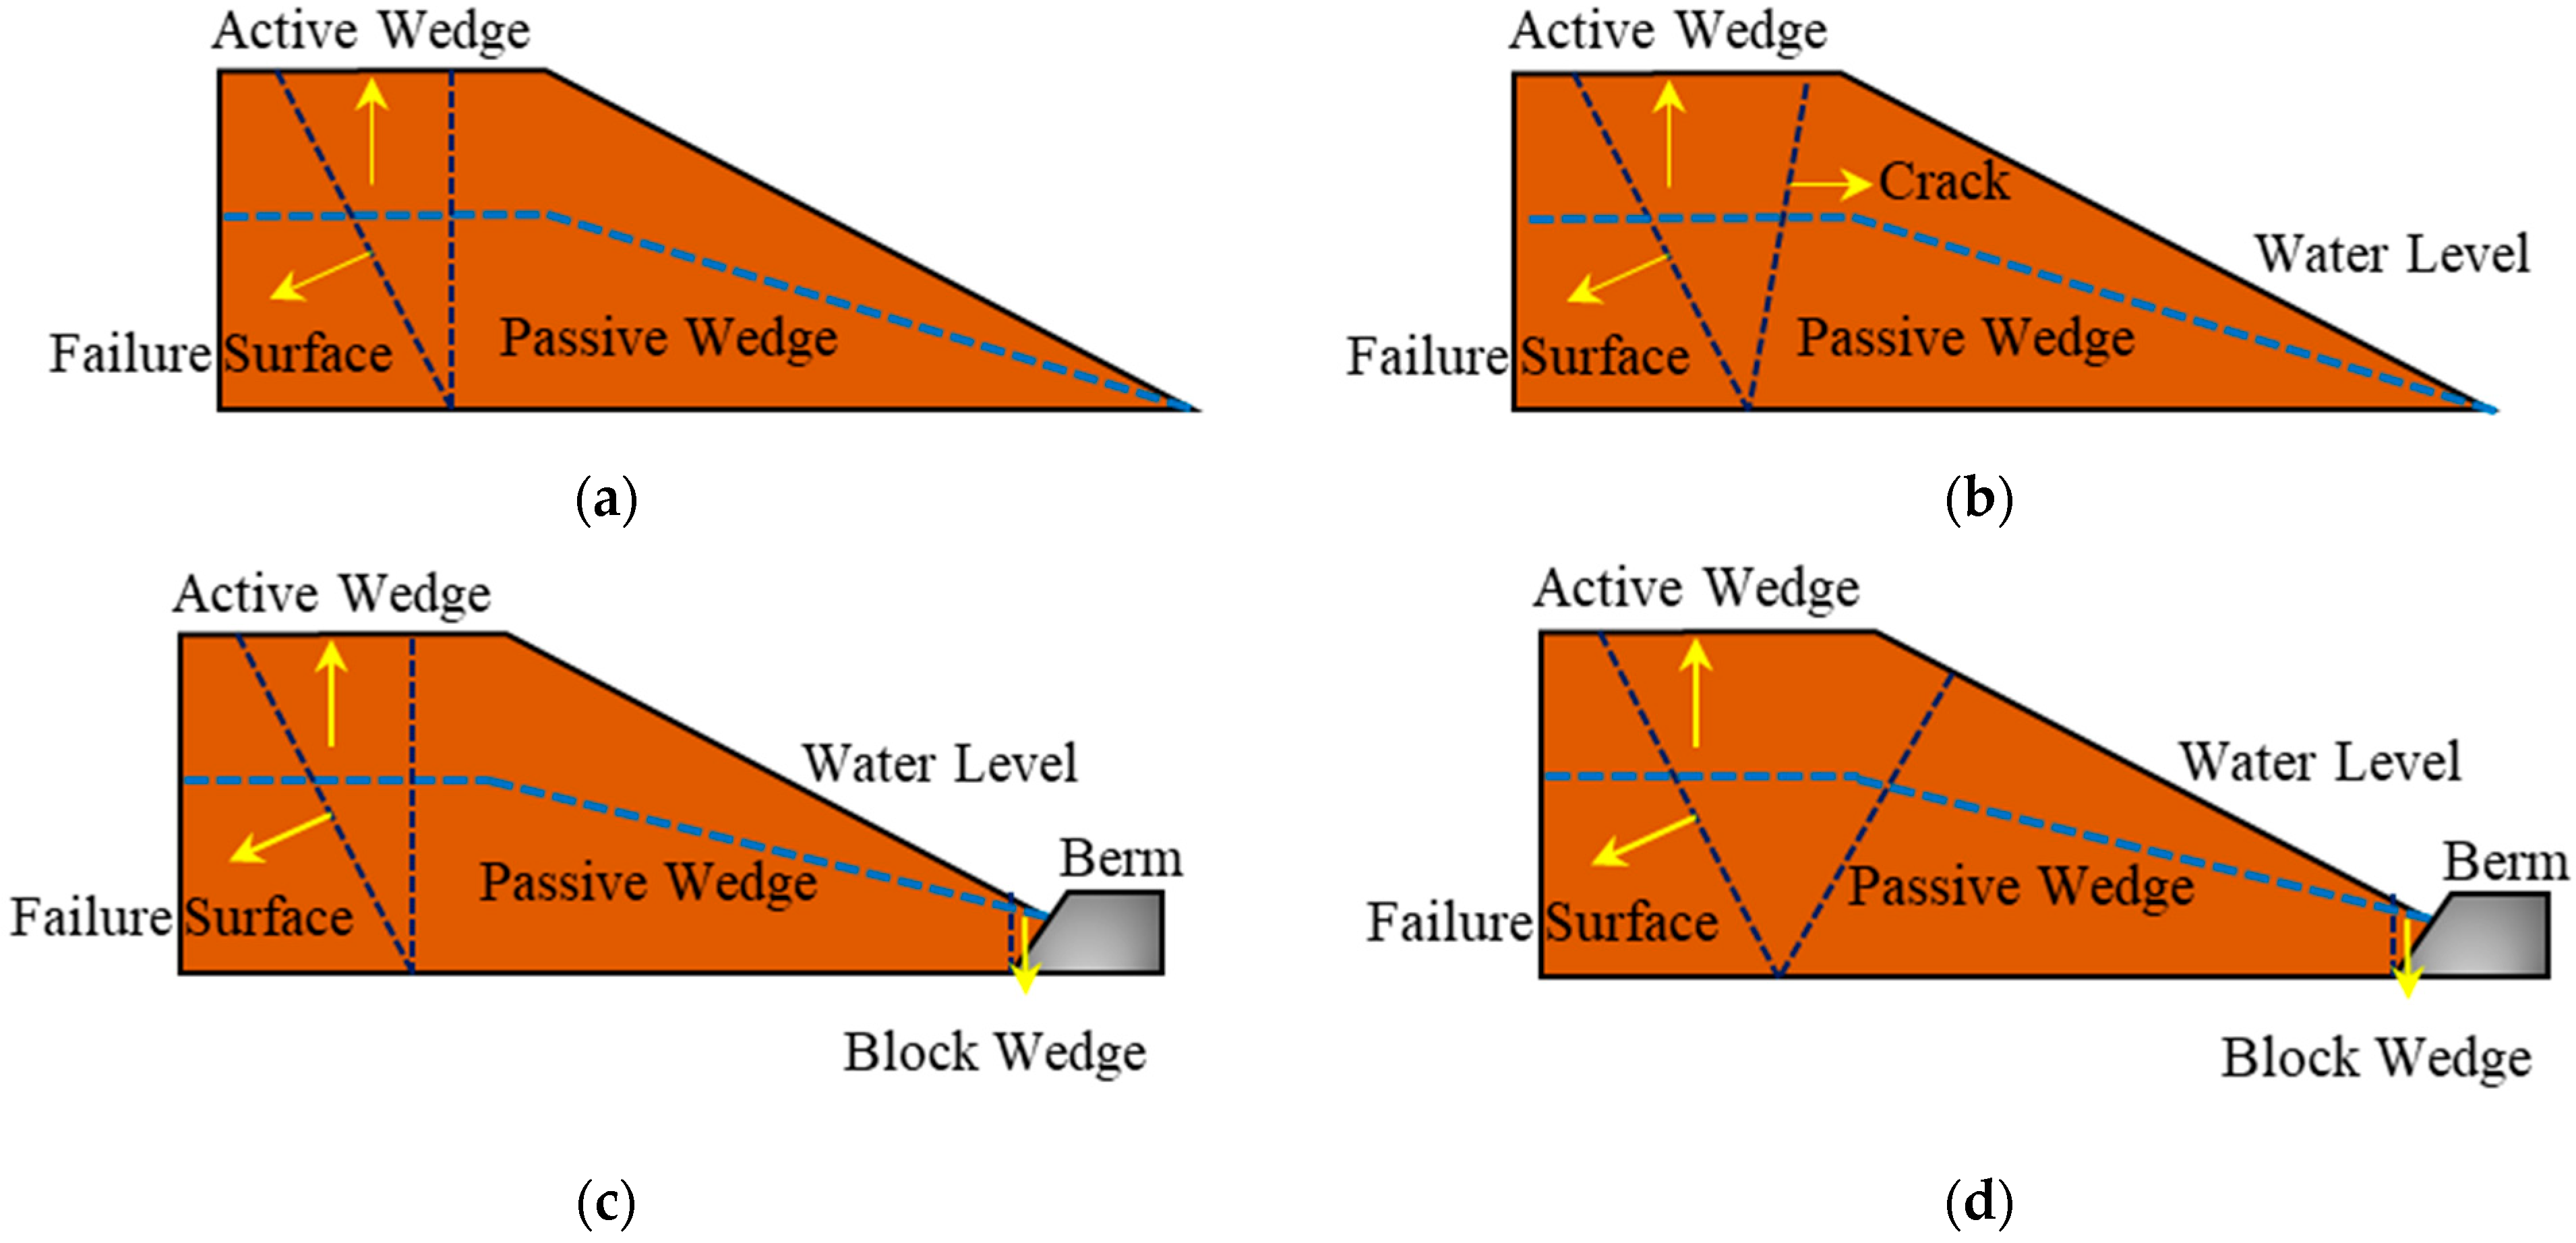
Under the failure condition without the garbage dam, the assumptions are similar to the two-wedge model from [8,9]. The sliding blocks can be divided into active wedges and passive wedges (Figure 2a); when there is an overall instability with a garbage dam, the limit equilibrium analysis of the three-wedge body by Qian and Koerner [11] can be used to calculate the slope stability, and the waste body can be divided into active wedge, passive wedge, and block wedge (Figure 2c). The difference between the actual slip failure process of the landfill slope and the assumption of the traditional wedge limit equilibrium analysis is that the interfaces of the active wedge, passive wedge, and block wedge are not vertical. This is related to the characteristics of solid waste and the geometry of the slope. Here, we consider the actual failure process of the unstable waste body, improve the limit equilibrium analysis of the traditional wedge, set the wedge interface as the actual failure surface according to the results of the previous centrifugal tests, and consider the effect of the water level; we propose the limit equilibrium analysis method of two-wedge and three-wedge based on the actual failure surface.

2.2. Assumptions

We refer to the traditional wedge method; regard the landfill as a rigid body; divide the sliding body into active wedge, passive wedge, and block wedge (not included in the two-wedge model); and consider the effect of water level on the overall stability. In the traditional method, each wedge is divided vertically and the wedge interface is perpendicular to the horizontal plane, as shown in Figure 2. Here, the wedges are divided according to the overall slip plane and penetrating cracks in the failure process. The wedge interface is set at a certain angle to the horizontal plane between the active wedge and the passive wedge, and the vertical interface is used for the block wedge interface among the three wedges. The friction between the active wedge and liner interface is not considered because the failure surface in the sliding process is basically connected with the through-crack. The assumptions are as follows:
(1)
The factor of safety FS of the landfill is equal everywhere along the sliding surface;
(2)
The resultant force between the wedges forms an angle with the horizontal direction and acts at 1/3 of the height of the interface between the wedges and the horizontal and vertical components on the interface;
(3)
Meet the rationality requirements of the limit equilibrium method—that is, the factor of safety FSV of the interface between the wedges is greater than or equal to 1;
(4)
The factor of safety FSV of the interface between the wedges is not less than the FS of the landfill—that is, FSVFS;
(5)
The water level acts on each interface as a hydrostatic pressure, and the pore pressure and water pressure on the sliding surface act on the sliding body as a resultant force;
(6)
The frictional resistance between the bottom of the active wedge and the liner is ignored.

2.3. Parameters

During a landfill slip, the water level typically decreases. While there may be a slight increase in pore pressure at the base of the slope, this can be attributed to seepage within the landfill and does not indicate any significant excess pore pressure [29]. Therefore, the effective stress and shear strength parameters obtained by the triaxial drainage test are selected in this model for calculation. Due to the large deformation of municipal solid waste, the internal structure of the landfill may be changed dramatically, such as the leachate drainage system and the liner system. The shear strength parameter corresponding to 20% axial strain is often used to calculate landfill stability for engineering design purposes [32]. Therefore, in the numerical calculation, the shear strength parameters of the triaxial drainage test corresponding to 20% strain are uniformly selected for the solid waste of the landfill body.

2.4. Analysis Method

2.4.1. Two-Wedge Model without Berm

The traditional two-wedge method is shown in Figure 3a. The pore pressure acting on the failure surface acts on the sliding body as a resultant force, and the pore pressures acting on the interface between the wedge bodies are same in amplititude and opposite in direction.
For passive wedges, considering the balance of vertical and horizontal forces, according to the limit equilibrium condition, calculations are as follows:
Equilibrium of forces in Y direction F Y = 0 gives
W P + E V P = U P + N P ,
E V P = C s w + E H P · t a n φ s w F S V ,
Equilibrium of forces in X direction F X = 0 gives
U H P + E H P = F P ,
F P = C P + N P · t a n δ P F S P ,
The horizontal component of the interface force can be expressed as
E H P = W P U P + C s w F S V · t a n δ P F S P + C P F S P U H P 1 t a n φ s w F S V · t a n δ P F S P ,
For the active wedge, considering the balance of vertical and horizontal forces, according to the limit equilibrium condition, we have the following equations:
Equilibrium of forces in Y direction F Y = 0 gives
W A = F A · s i n β + U A + N A · c o s β + E V A ,
F A = C A + N A · t a n δ A F S A ,
E V A = C s w + E H A · t a n φ s w F S V ,
Equilibrium of forces in X direction F X = 0 gives
U A + N A · s i n β = F A · c o s β + U H A + E H A ,
substituting Equations (6)–(9) into Equation (5) gives
E H A = W P C s w F S V · s i n β c o s β · t a n δ A F S A + U A · t a n δ A F S A U H A · c o s β + s i n β · t a n δ A F S A C A F S A c o s β + s i n β · t a n δ A F S A + s i n β · t a n φ s w F S V c o s β · t a n δ A F S A · t a n φ s w F S V ,
Since EHA = EHP, the relational expressions about FSA, FSP, and FSV can be obtained:
E H A = W P C s w F S V · s i n β c o s β · t a n δ A F S A + U A · t a n δ A F S A C A F S A c o s β + s i n β · t a n δ A F S A + s i n β · t a n φ s w F S V c o s β · t a n δ A F S A · t a n φ s w F S V ,
where FSA = FSP (both on the failure surface), since the overall slip occurs first in the waste body, the internal stability is relatively high, and FSV = 2.0 is used for calculation based on experience.

2.4.2. Two-Wedge Model without Berm Based on Actual Failure Surface

The geometry and stress conditions of the model are shown in Figure 3b. The angle between the interfaces of active wedge and passive wedge and the horizontal plane is α, α + β ≤ 180°. The interface between the active wedge and liner is a fixed point by default.
According to the equilibrium state of the passive wedge,
Equilibrium of forces in Y direction F Y = 0 gives
W P + E V P · s i n α + E H P · c o s α = U P + N P ,
E V P = C s w + E H P · t a n φ s w F S V ,
Equilibrium of forces in X direction F X = 0 gives
E H P · s i n α = F P + E V P · c o s α ,
F P = C P + N P · t a n δ P F S P ,
The horizontal component of the interface force can be expressed as
E H P = W P U P + C s w F S V · s i n α · t a n δ P F S P + C P F S P + C s w F S V · c o s α s i n α c o s α · t a n φ s w F S V c o s α · t a n δ P F S P t a n φ s w F S V · t a n δ P F S P · s i n α ,
According to the equilibrium state of the active wedge,
Equilibrium of forces in Y direction F Y = 0 gives
W A = F A · s i n β + U A + N A · c o s β + E V A · s i n α + E H A · c o s α ,
F A = C A + N A · t a n δ A F S A ,
E V A = C s w + E H A · t a n φ s w F S V ,
Equilibrium of forces in X direction F X = 0 gives
U A + N A · s i n β + E V A · c o s α = F A · c o s β + E H A · s i n α ,
substituting Equations (17)–(20) into Equation (16) gives
E H A = W A · sin β cos β · t a n δ A F S A + U A · t a n δ A F S A C A F S A + C s w F S V · cos ( α + β ) sin ( α β ) · t a n δ A F S A sin α + β + t a n φ s w F S V cos ( α + β ) sin ( α + β ) · t a n δ A F S A t a n δ A F S A · cos ( α + β ) ,
Similar to the previous section, the FS of the slope can be solved by FSA = FSP.

2.4.3. Three-Wedge Model with Berm

The traditional three-wedge analysis method is shown in Figure 4a. The interfaces of active wedge and passive wedge, and passive wedge and block wedge, are perpendicular to the horizontal plane.
Limit equilibrium analysis of the passive wedge is carried out, and the balance of vertical and horizontal forces is taken into account, which can be expressed as:
Equilibrium of forces in Y direction F Y = 0 gives
W P + E V P 1 = U P + N P + E V P 2 ,
E V P 1 = C 1 + E H P 1 · t a n φ s w F S V ,
E V P 2 = C 2 + E H P 2 · t a n φ s w F S V ,
Equilibrium of forces in X direction F X = 0 gives
E H P 1 = F P + E H P 2 ,
F P = C P + N P · t a n δ P F S P ,
Assume that n1sw = C1/FSV, n2sw = C2/FSV, msw = tanφsw/FSV; then, the relationship between the horizontal component of two interfaces can be expressed as
E H P 1 E H P 2 = W P U P + n 1 s w n 2 s w · t a n δ P F S P + C P F S P 1 m s w · t a n δ P F S P ,
According to the force balance state of the interceptor wedge,
Equilibrium of forces in Y direction F Y = 0 gives
W B + E V B + F B · s i n θ = ( U B + N B ) · c o s θ ,
E V B = C 2 + E H B · t a n φ s w F S V ,
F B = C B + N B · t a n δ B F S B ,
Equilibrium of forces in X direction F X = 0 gives
E H B = F B · c o s θ + ( U B + N B ) · s i n θ ,
substituting Equations (29)–(31) into Equation (28) gives
E H B = W B + n 2 s w · s i n θ + c o s θ · t a n δ B F S B + C B F S B U B · t a n δ B F S B c o s θ + s i n θ · m s w s i n θ + c o s θ · m s w · t a n δ B F S B ,
The force balance analysis of the active wedge is the same as that of the two-wedge model
E H A = W A n 1 s w · s i n β c o s β · t a n δ A F S A + U A · t a n δ A F S A C A F S A c o s β + s i n β · m s w + ( s i n β c o s β · m s w ) · t a n δ A F S A ,
On the condition of EHP1 = EHA and EHP2 = EHB, substituting Equations (32) and (33) into Equation (27) gives the solution of FS.

2.4.4. Three-Wedge Model with Berm Based on Actual Failure Surface

The two-wedge model based on the actual failure surface is shown in Figure 4b. The angle between the passive wedge interface and the horizontal direction is α, α + β ≤ 180°.
Limit equilibrium analysis of the passive wedge is carried out, and the balance of vertical and horizontal forces is taken into account, which can be expressed as:
Equilibrium of forces in Y direction F Y = 0 gives
W P + E V P 1 · s i n α + E H P 1 · c o s α = U P + N P + E V P 2 ,
E V P 1 = C 1 + E H P 1 · t a n φ s w F S V ,
E V P 2 = C 2 + E H P 2 · t a n φ s w F S V ,
Equilibrium of forces in X direction F X = 0 gives
E H P 1 · s i n α = F P + E V P 1 · c o s α + E H P 2 ,
F P = C P + N P · t a n δ P F S P ,
( W P U P + n 1 s w · s i n α n 2 s w ) · t a n δ P F S P + c o s α · n 1 s w + C P F S P = E H P 1 · s i n α c o s α · m s w c o s α · t a n δ P F S P m s w · s i n α · t a n δ P F S P E H P 2 · 1 m s w · t a n δ P F S P ,
The force balance of the block wedge is the same as in the previous section and will not be repeated here.

3. Results

3.1. Centrifugal Test Case Analysis

Since it is difficult to reproduce large-scale geological landslides at full scale, we used the results of centrifugal experiments [29] to verify the evaluation method. The model tests were carried out under the gravity acceleration of 66.7 g. The initial height of the model was 0.3 m, which was compressed to 0.24 m under the gravity acceleration of 66.7 g; thus, the prototype was 16 m in height. The model side slope ratio was 1:2.
The results of two centrifugal tests with and without a dam were selected as cases to evaluate the accuracy of the model used in this study. The process of slope instability induced by water level rise was simulated. The actual failure pattern of the slope and the critical water level were obtained.

3.1.1. Centrifugal Test without Berm

The geometric parameters of the model are shown in Figure 5a, taking centrifugal test 3 in [28] as an example: γ = 7 kN/m3, γsat = 12 kN/m3. It can be obtained that the water level h/overall slope height H (water level ratio) h/H = 0.79 when the overall slip occurs, and the shear strength corresponding to 20% failure strain is taken: δA = φsw = 28.6°, δP = 12.8°, cA = csw = 24 kPa, CP = 0, and β = 55.3°.
In the traditional two-wedge model, according to the geometric model, the bulk density and pore pressure of the active wedge and passive wedge are obtained: WA = 898.8 kN/m, WP = 4310 kN/m, UA = 554.3 kN/m, and UP = 3109.4 kN/m. Then, these values are substituted into Equation (11) to obtain the FS of the slope, FS = 1.29.
α = 78.7° was observed during the centrifuge test, and its failure mode is shown in Figure 5b. Substitute the actual failure surface angle into the improved two-wedge model to calculate WA = 1158 kN/m, WP = 4053.3 kN/m, UA = 554.3 kN/m, and UP = 2951.4 kN/m. Substituting these data into Equations (16) and (21), we obtain FS = 1.07. Obviously, the theoretical model based on the actual failure surface is more accurate for evaluating the critical state of slope instability.

3.1.2. Centrifugal Test with Berm

In order to evaluate the three-wedge theoretical model with a garbage dam, we selected test 5 [29] as the focus case, as shown in Figure 6a. The parameters in the experiment are as follows: γ = 9 kN/m3; γsat = 12.6 kN/m3; and, when damage occurs, the water level ratio is h/H = 0.85. Similarly, select the shear strength corresponding to 20% failure strain: δA = φsw = 26.4°, δP = 13.8°, δB = 20°, cA = csw = 22 kPa, CP = 0, β = 47.5°, and θ = 45°.
On the basis of α = 90°, according to the experimental data, the following can be calculated: WA = 1245.73 kN/m, WM = 3821.58 kN/m, WP = 101.31 kN/m, UA = 848 kN/m, UM = 2948.4 kN/m, UP = 82.5 kN/m, CA = 434 kN/m, and CB = CP = 0. Then, substitute these values into Equation (33) to obtain the FS of the slope, FS = 1.35.
In centrifuge test 5, the actual angle between the failure surface and horizontal plane α = 102° and its failure mode is shown in Figure 6b. Substitute the angle of the actual failure surface into the improved three-wedge model to calculate and obtain WA = 978.6 kN/m, WM = 4121.3 kN/m, and WP = 101.3 kN/m; then, we obtain FS = 1.12.

3.2. Parameter Analysis

3.2.1. Two-Wedge Model

  • Slope scale and water level
When the stability analysis of the actual landfill slope is carried out, the failure surface should be preliminarily judged according to the site topography, solid waste age and slope angle, etc. Then, based on the slope and displacement monitoring of the slope, the position of the failure surface and the angle of the most dangerous failure surface are determined; finally, the FS is calculated. This method of combining the measured data with the theoretical model can effectively improve the accuracy of the assessment of the FS of the slope. In this section, the failure surface data are obtained based on the centrifugal tests and the parametric analysis is conducted on the effect of the water level change and the failure surface angle on the FS.
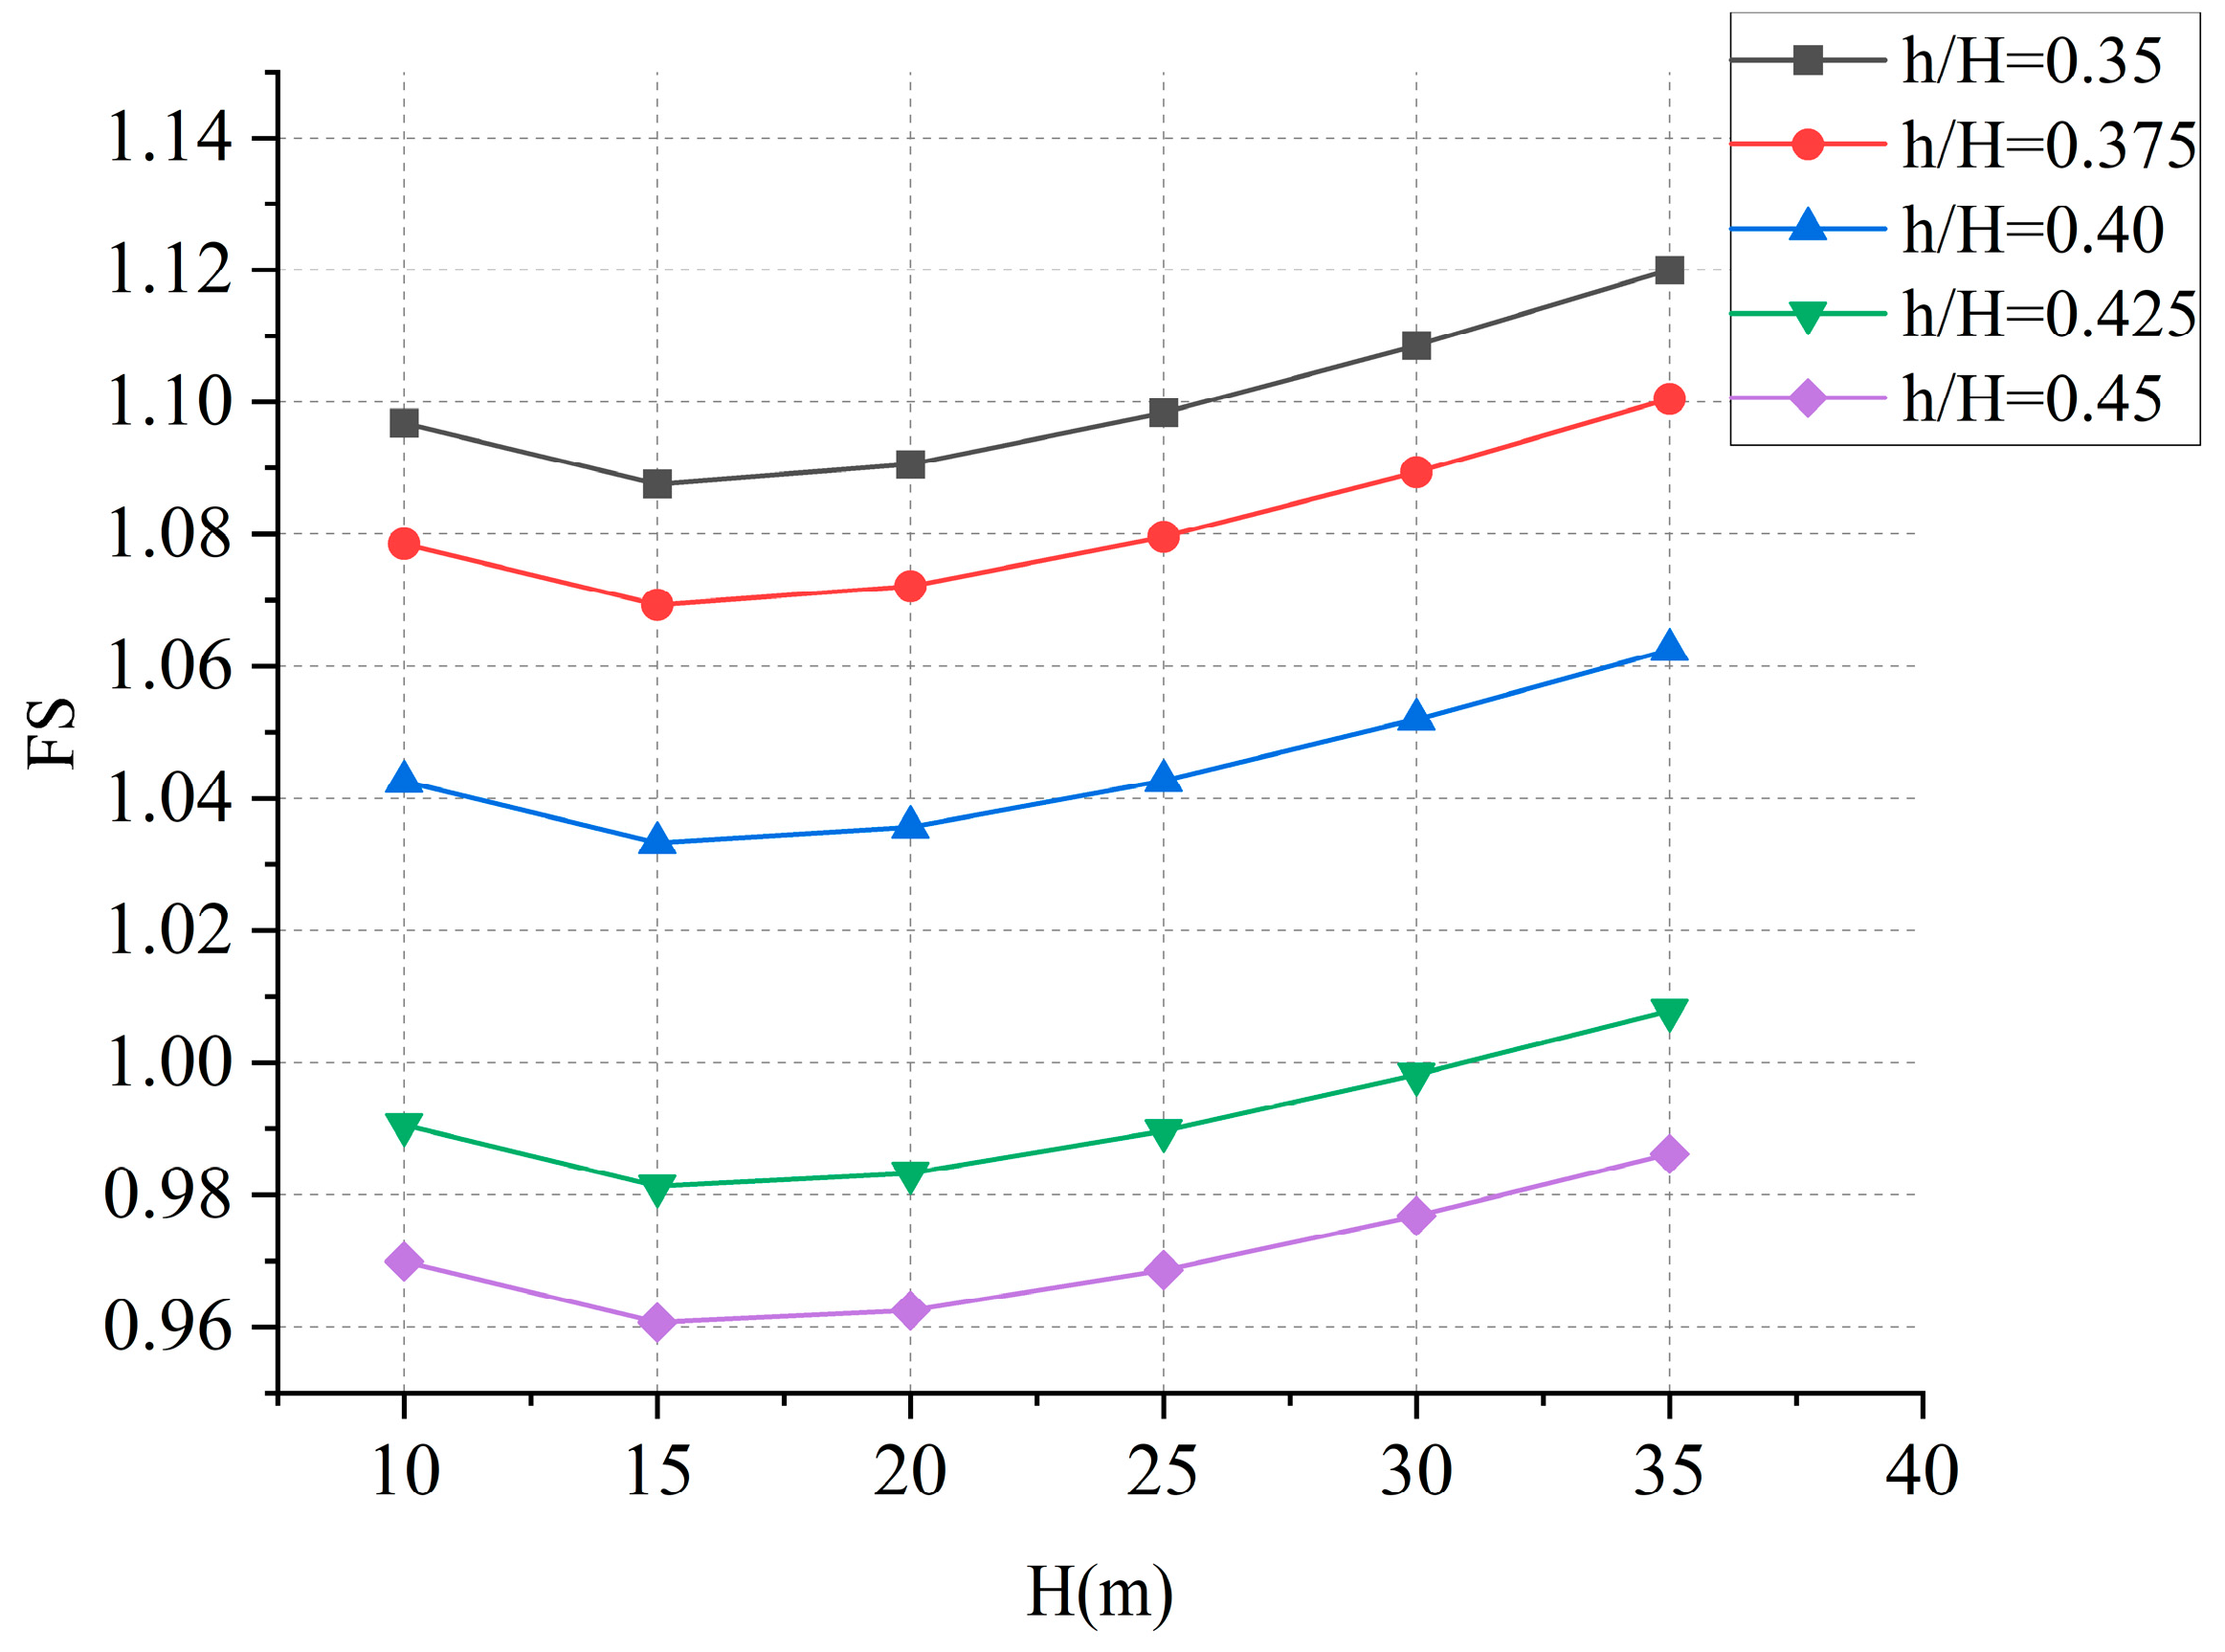
In the parameter analysis of the two-wedge model, the slope ratio of 1:2 and the case without a dam were selected for calculation, and five values of water level ratios of 0.35, 0.375, 0.4, 0.425, and 0.45 were selected for analysis.
It can be seen from Figure 7 that in the condition of constant water level ratio, with the increase in slope height, the FS tends to decrease and then increase. According to the proposed theoretical model, the stability changes of the slope with different water level ratios show good consistency. Therefore, it can be guessed that for a fixed water level ratio and failure mechanism, there might exist the most dangerous slope height range. It is an obvious conclusion that when the slope height is fixed, the stability of the landfill slope will decrease when the water level rises. This is consistent with the previous research conclusions. Taking the slope height of 20 m as an example, the water level rises from 7.5 m to 9 m, and the FS decreases by 0.1, which also explains the potential threats to slope stability caused by problems such as leachate accumulation or heavy rain.
2.
Failure surface angle
As shown in Figure 8, as the angle of the failure surface increases and the water level increases, the safety factor of the slope decreases. It can be found that the angle of the actual failure surface corresponds to the failure mode of the slope with a higher water level and the traditional method is conservative for the evaluation of FS. Further, the smaller the angle of the actual failure surface, the greater the influence of the water level change on the FS. That is to say, for the slope failure mode where the failure surface is not perpendicular to the ground, the traditional wedge method has a prudent evaluation of the FS of the slope due to the water level. This leaves a larger design space for slope support and reinforcement engineering works.
3.
Soil properties
Through sensitivity analysis, we evaluated the effect of cohesion and friction angle of active wedge and passive wedge, and different slope shapes (H:L is 1:1, 1:2, and 2:3; L = 30 m; and water level ratio h/H = 0.4), on the stability of the slope [33].
It can be analyzed from Figure 9a that under the condition of a certain water level ratio, when the cohesion of the active wedge increases gradually from 0 to 25 kPa, the increase in the FS is less than 0.05 and the decrease in the slope height will amplify the influence of cohesion of the active wedge. The cohesion of the passive wedge increases gradually from 0 to 25 kPa, and the increase in the safety factor is less than 0.03. The safety factor is not sensitive to the change in slope height. Figure 9b shows that the friction angle of the passive wedge significantly affects the stability of the whole slope. This is because the internal friction angle of the passive wedge contributes more to the overall anti-sliding force and the passive wedge occupies a large proportion of the sliding part in the test. When the friction angle increases from 10° to 30°, the increase in the FS is greater than 1. Under a fixed water level ratio, the smaller the slope height, the more sensitive the safety factor is. The significant difference is that the FS has minor sensitivity to the change in the friction angle of the active wedge and the slope height has little effect.

3.2.2. Three-Wedge Model

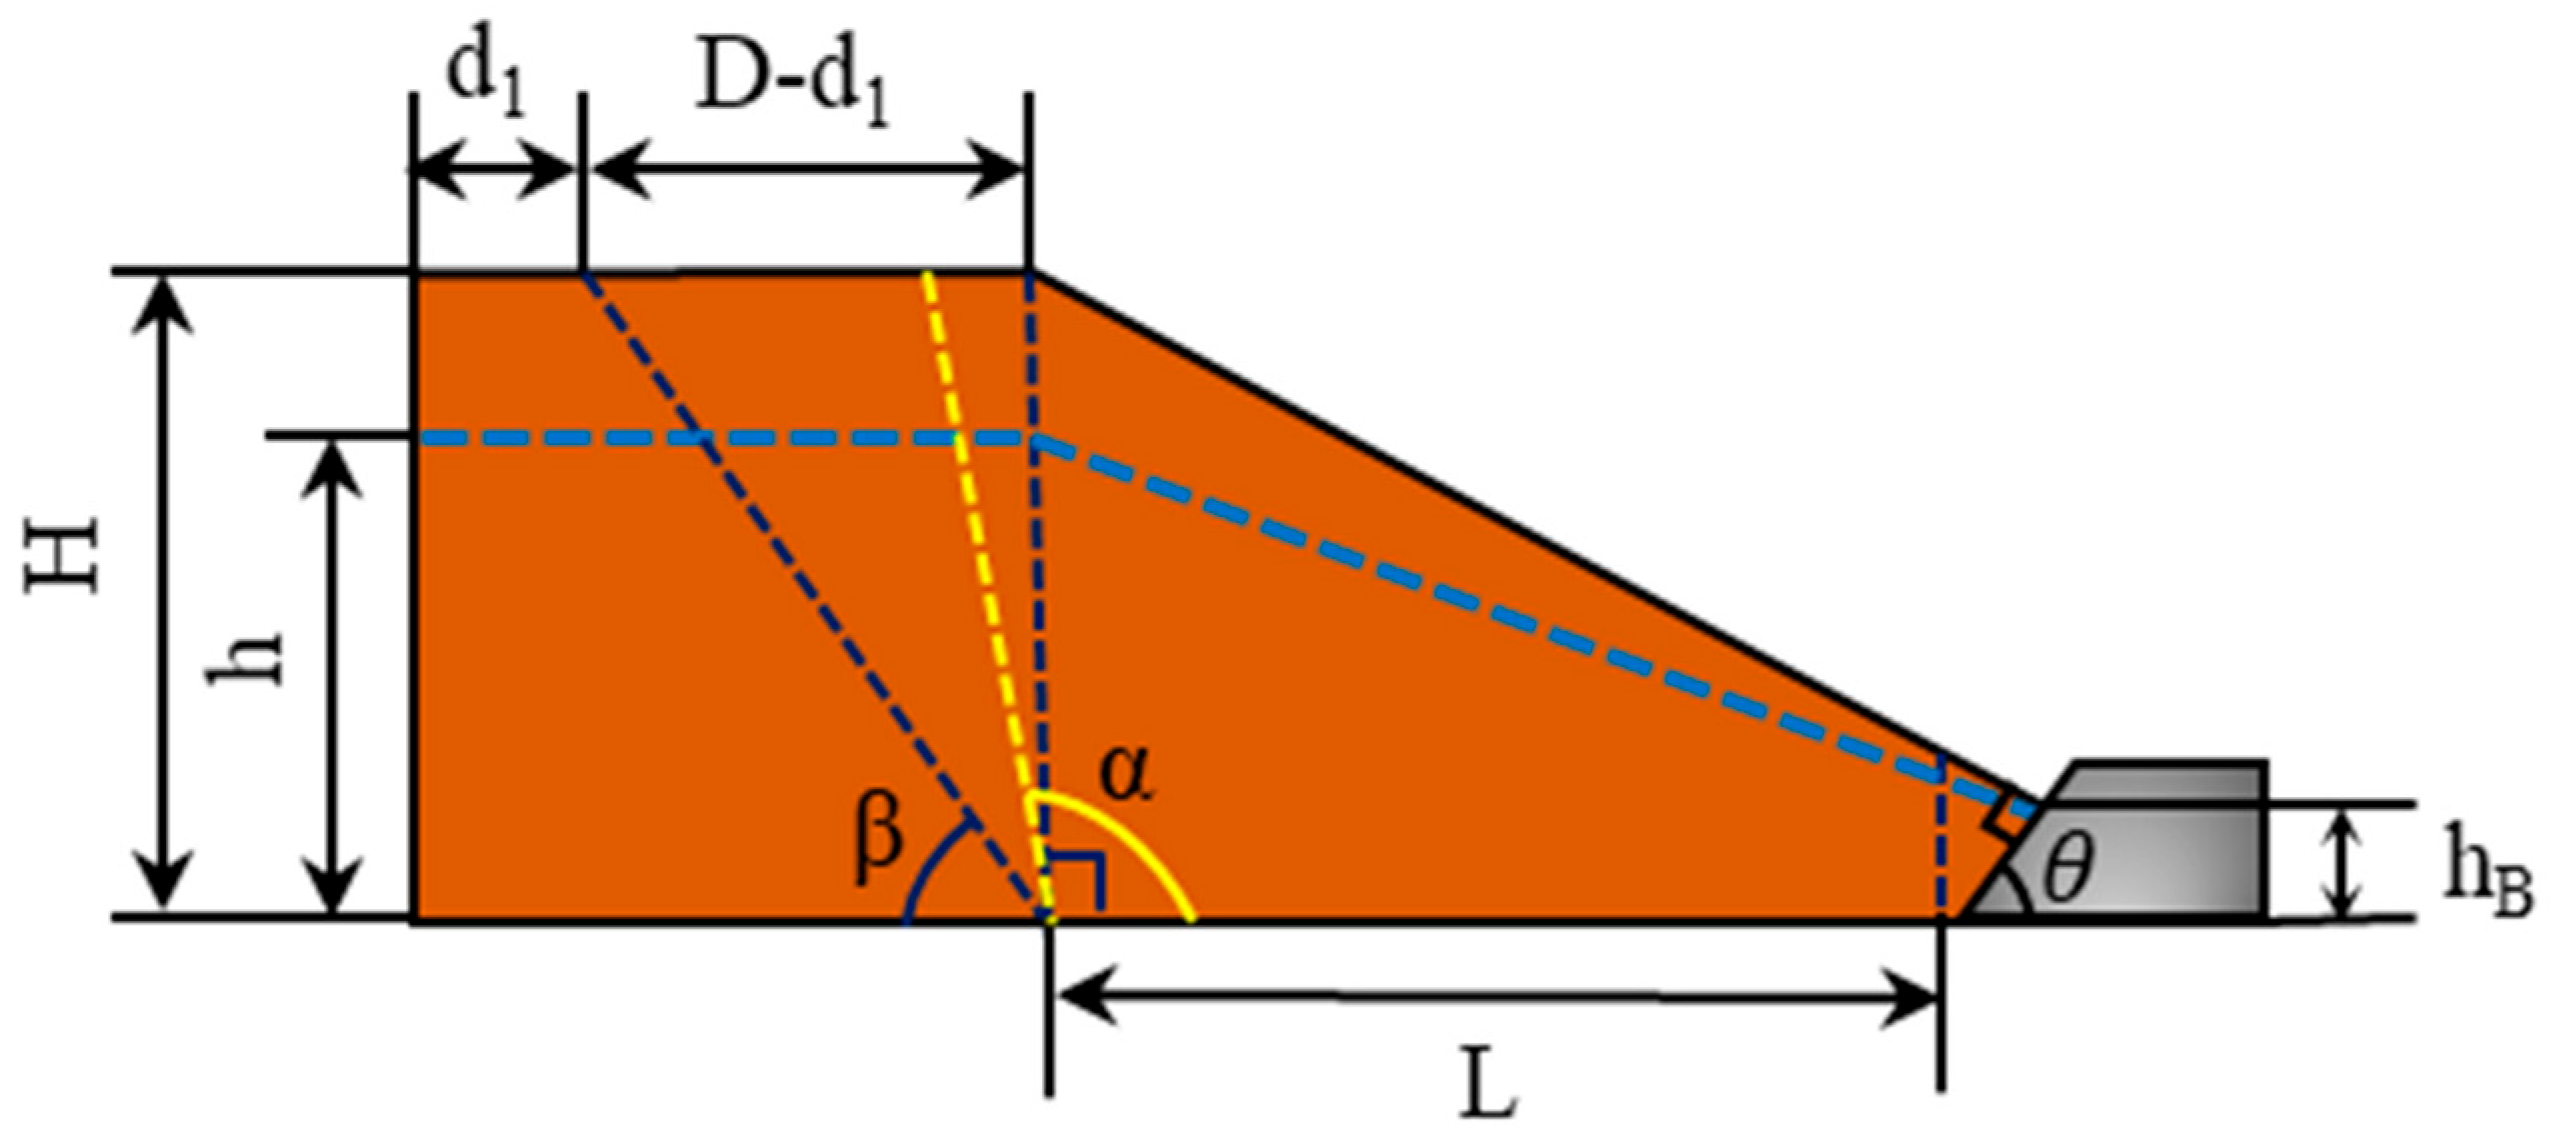
In order to make the calculation of the factor of safety easier, we simplified the geometric model as follows: in the parameter analysis of the three-wedge model, the intersection of the failure surface and the slope bottom is flush with the slope shoulder, as shown in Figure 10, where d1 = 3 m, D = 16 m, H = 16 m, hB = 3 m, dam angle θ = 60°, β = 50.9°, L can be obtained according to the geometric relationship in the figure, and the mechanical parameters of the soil are consistent with those in Two-Wedge Model analysis. We analyze the influence of water level, angle of the failure surface, soil parameters, height and angle of the dam to the FS.
4.
Failure surface angle and water level
Considering the failure mode in the centrifugal model tests, the failure surface angle α is around 90° and the water level h increases from 5 m to 9 m. The factor of safety improved quickly but the assumption that the safety factor of the active wedge and the passive wedge are equal and the assumption that α is too large or too small is obviously unrealistic; so, in the analysis of the angle of the failure surface, α is only in the range of 75–115°. Figure 11 shows that as the angle of the failure surface increases, the FS of the slope increases gradually. It is conservative to evaluate the situation where the actual failure surface is greater than 90° and it is relatively dangerous for the actual failure surface angle to be less than 90°; so, it is necessary to analyze the slope stability based on the actual failure mode for safety. Compared with the case where the angle of the actual failure surface is less than 90°, the safety factor fluctuates less with the change in the angle. Therefore, the traditional method is relatively reliable for the evaluation of the instability mode of a failure surface angle less than 90°. However, once the angle exceeds 90°, the difference between the safety factors of 95° and 115° can reach about 0.5. In addition, it can be seen that with the increase in water level, the change in the failure surface angle has no apparent effect on the slope stability.
5.
Soil properties
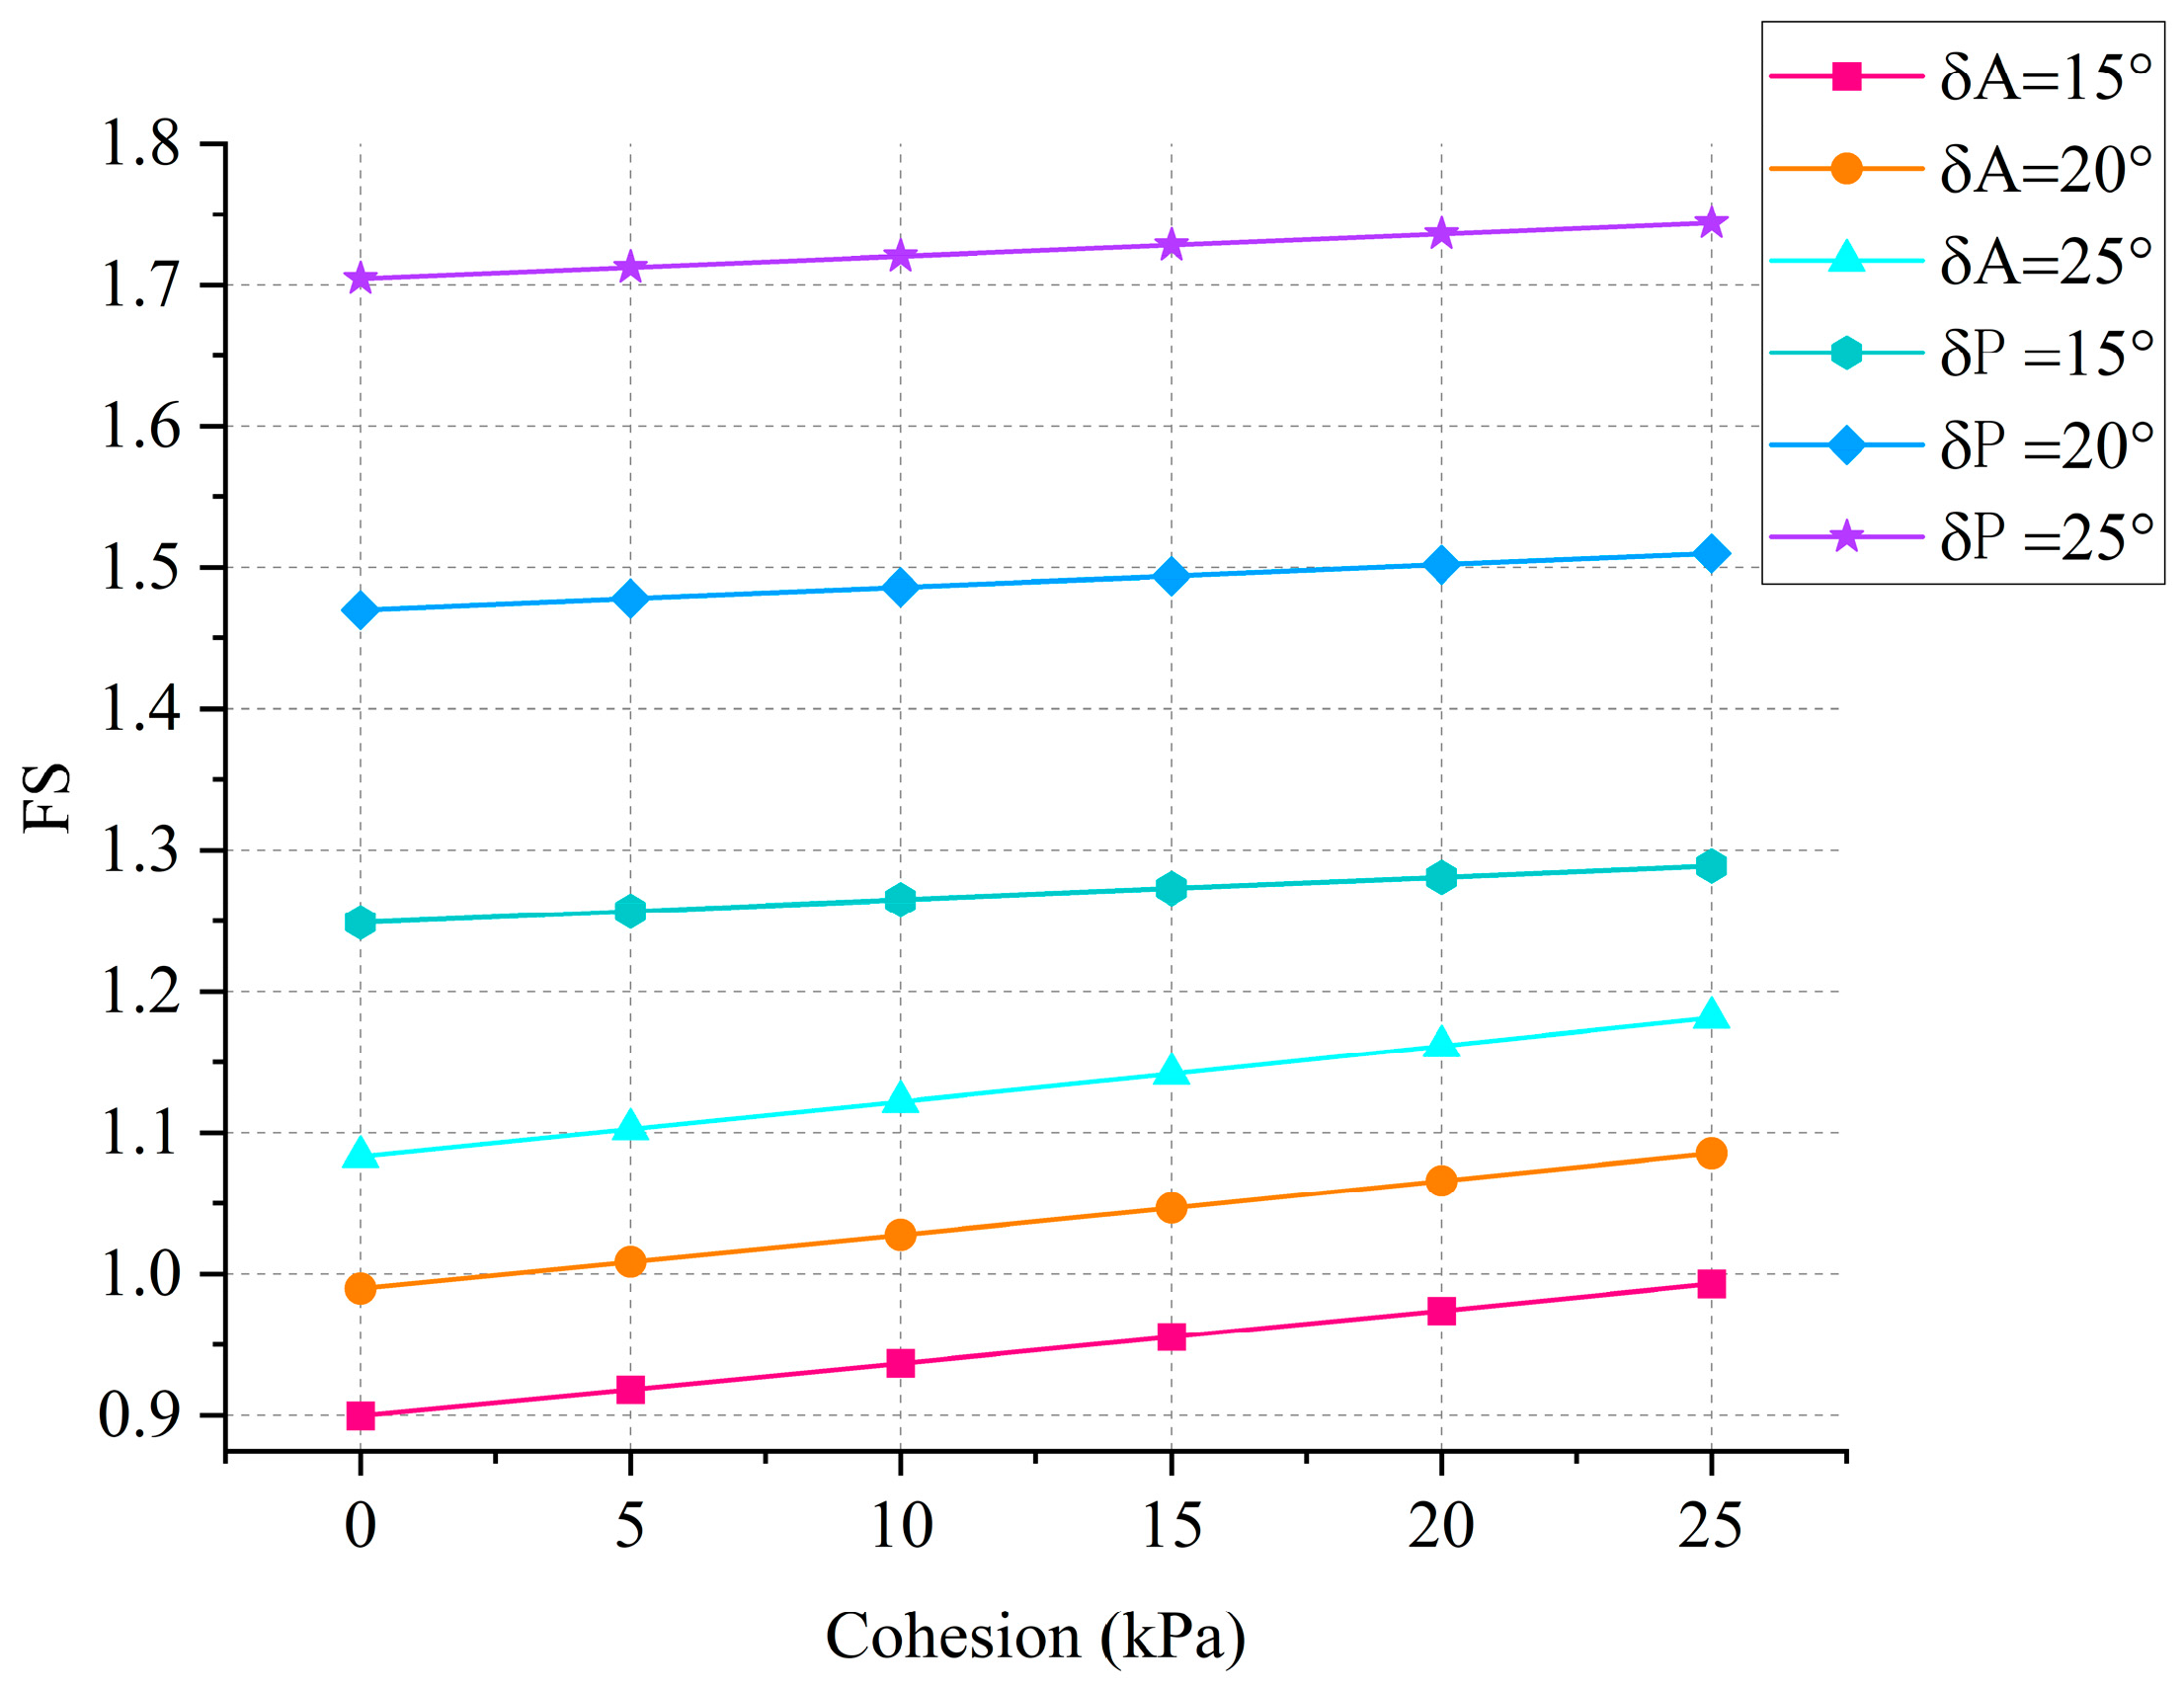
We consider the case where the angle of the failure surface is 100° under the condition of water level h = 6 m. By changing the cohesion and friction angle of the soil of active wedge and passive wedge, the influence of soil property change on slope stability is analyzed. The other parameters are the same as in the previous section. The active wedge and passive wedge friction angles of 15°, 20°, and 25° and the cohesion forces of 0 kPa, 5 kPa, 10 kPa, 15 kPa, and 20 kPa are calculated, respectively.
It can be seen from Figure 12 that the change in the cohesion of the active wedge and the passive wedge has little effect on the overall stability, and the FS does not change more than 0.1 when the cohesion increases by 5 kPa. The FS is more sensitive to the cohesion of the active wedge than the passive wedge. Similar to the conclusion obtained from the two-wedge model, the change in the friction angle has a significant impact on slope stability. The friction angle in the active wedge soil increases from 15° to 25°; the safety factor increases by about 0.2; and the passive wedge increases by about 0.5, which is relatively more obvious.
6.
Berm parameters
The retaining dam of the landfill can significantly improve the stability of the slope of the landfill and effectively prevent the slope instability disaster of the garbage dump [22,34]. In this section, taking an actual failure surface angle of 100°, under the condition of water level h = 6 m, the influence of the garbage dam on overall slope stability was analyzed by changing the height and dip angle of the dam body.
Figure 13 shows the effect of different dip angles (45°–70°) and different heights of garbage dam on slope stability in the three-wedge model. As the height of the dam increases, the increasing trend of the FS becomes more obvious. For example, the dam with an angle of 60° increases from 1 m to 2 m and the safety factor increases by 0.02, while the increase in the dam from 4 m to 5 m increases the safety factor by 0.12. The dip angle of the garbage dam also has a significant impact on the body stability. The angle increases from 45° to 70°, and the FS increases by about 0.6. This difference is not sensitive to the increase in dam height.

4. Discussion

When analyzing an existing landfill site, the failure surface is initially evaluated based on the site’s topography, the age of the solid waste, the shape of the slope, and water level. The potential instability pattern is then predicted. Subsequently, the position of the failure surface and the actual angle of the failure surface are determined with the help of slope and displacement monitoring. A limit equilibrium analysis of the wedge on the failure surface during the landfill instability process is carried out. The FS of the landfill slope is closer to 1.0, which is indicative of an unstable state.
Site-specific analysis is required, as the current model analysis is only validated based on the results of centrifugal physical tests, and further optimization based on field data is required in the future. In addition, the method assumes that the soil structure is homogeneous and isotropic with a simple geometry slope. However, these results provide directions for methods that can be used to make such assessments as well as input parameters and operational scenarios for important assessments as part of the design. Based on the above conclusions, evaluating the failure mode of the slope in combination with on-site monitoring data is conducive to the accurate analysis of the slope stability of the landfill.

5. Conclusions

In this paper, a landfill instability analysis method based on the actual failure surface is proposed. Compared with the traditional wedge model, the safety of landfill slopes with different failure modes can be more accurately evaluated. The specific conclusions are as follows:
(1)
The phenomena of previous centrifugal model tests show that the penetrating crack of the instability failure of the landfill under a high water level is not vertical to the horizontal plane, as in the traditional wedge model; so, the limit equilibrium analysis method was improved based on the actual failure surface angle. The interface between the active wedge and the passive wedge was changed to the failure surface in the process of slope slip, and the results of the centrifugal experiment were verified, which has important implications for predicting the stability of the landfill slope;
(2)
The proposed model was checked according to the results of the previous centrifuge tests. The wedges were divided according to the failure surface in the process of model instability and slip, and the limit equilibrium analysis was carried out. The obtained FS is closer to 1.0, which means close to the unstable state;
(3)
In the two-wedge model, the factor of safety hardly changes under the condition of a particular value of water level ratio. As the failure surface angle of the slope continues to increase and the water level rises, the safety factor of the slope decreases significantly. The friction angle of the passive wedge in the wedge model significantly affects the stability of the entire slope;
(4)
After analyzing the parameter-sensitivity of the three-wedge model based on the actual failure surface, it was found that with the increase in failure surface angle, the FS of the slope gradually increases. The soil properties and the parameters of the retaining dam significantly affect the stability of the slope.

Author Contributions

J.L.: supervision and writing—review and editing. R.C.: conceptualization, methodology, formal analysis, and writing—original draft. H.L.: supervision and writing—review and editing. All authors have read and agreed to the published version of the manuscript.

Funding

This work presented in this paper was jointly supported by the Basic Public Welfare Research Program of Zhejiang Province (Grant No. LGF21E080013) and the Basic Science Center Program for Multiphase Media Evolution in Hypergravity of the National Natural Science Foundation of China (Grant No. 51988101).

Institutional Review Board Statement

Not applicable.

Informed Consent Statement

Not applicable.

Data Availability Statement

Data can be acquired upon reasonable request.

Acknowledgments

The authors also would like to gratefully acknowledge the laboratory support personnel at the Center for Hypergravity Experimental and Interdisciplinary Research and MOE Key Laboratory of Soft Soils and Geoenvironmental Engineering.

Conflicts of Interest

The authors declare no conflict of interest.

References

  1. Feng, S.J.; Chang, J.Y.; Shi, H.; Zheng, Q.T.; Guo, X.Y.; Zhang, X.L. Failure of an unfilled landfill cell due to an adjacent steep slope and a high groundwater level: A case study. Eng. Geol. 2019, 262, 105320. [Google Scholar] [CrossRef]
  2. Gao, W.; Bian, X.-C.; Xu, W.-J.; Chen, Y.-M. Storage Capacity and Slope Stability Analysis of Municipal Solid Waste Landfills. J. Perform. Constr. Facil. 2018, 32, 04018036. [Google Scholar] [CrossRef]
  3. Ering, P.; Sivakumar Babu, G.L. Slope Stability and Deformation Analysis of Bangalore MSW Landfills Using Constitutive Model. Int. J. Geomech. 2016, 16, 04015092. [Google Scholar] [CrossRef]
  4. Platis, A.; Eng, C.E.M.; Paraskevi, A. Reinforced Earth Used in Uncontrolled Landfill Final Closures—The Case of Syros Landfill. Int. J. Geoengin. Case Hist. 2016, 4, 1–13. [Google Scholar] [CrossRef]
  5. Stark, T.D.; Eid, H.T.; Evans, W.D.; Sherry, P.E. Municipal Solid Waste Slope Failure. II: Stability Analyses. J. Geotech. Geoenviron. Eng. 2000, 126, 408–419. [Google Scholar] [CrossRef]
  6. Seed, R.B.; Mitchell, J.K.; Seed, H.B. Kettleman hills waste landfill slope failure. II: Stability analyses. J. Geotech. Eng. 1990, 116, 669–690. [Google Scholar] [CrossRef]
  7. Mitchell, J.K.; Seed, R.B.; Seed, H.B. Kettleman hills waste landfill slope failure. I: Liner-system properties. J. Geotech. Eng. 1990, 116, 647–668. [Google Scholar] [CrossRef]
  8. Qian, X.; Koerner, R.M.; Gray, D.H. Translational Failure Analysis of Landfills. J. Geotech. Geoenviron. Eng. 2003, 129, 506–519. [Google Scholar] [CrossRef]
  9. Qian, X.; Koerner, R.M. Effect of Apparent Cohesion on Translational Failure Analyses of Landfills. J. Geotech. Geoenviron. Eng. 2004, 130, 71–80. [Google Scholar] [CrossRef]
  10. Chen, Y.M.; Gao, D.; Zhu, B.; Chen, R.P. Seismic stability and permanent displacement of landfill along liners. Sci. China Ser. E Technol. Sci. 2008, 51, 407–423. [Google Scholar] [CrossRef]
  11. Qian, X.; Koerner, R.M. Stability Analysis When Using an Engineered Berm to Increase Landfill Space. J. Geotech. Geoenviron. Eng. 2009, 135, 1082–1091. [Google Scholar] [CrossRef]
  12. Feng, S.J.; Gao, L.Y. Seismic analysis for translational failure of landfills with retaining walls. Waste Manag. 2010, 30, 2065–2073. [Google Scholar] [CrossRef] [PubMed]
  13. Feng, S.J.; Chen, Y.M.; Gao, L.Y.; Gao, G.Y. Translational failure analysis of landfill with retaining wall along the underlying liner system. Environ. Earth Sci. 2010, 60, 21–34. [Google Scholar] [CrossRef]
  14. Koerner, R.M.; Soong, T.Y. Leachate in landfills: The stability issues. Geotext. Geomembr. 2000, 18, 293–309. [Google Scholar] [CrossRef]
  15. Fellner, J.; Brunner, P.H. Modeling of leachate generation from MSW landfills by a 2-dimensional 2-domain approach. Waste Manag. 2010, 30, 2084–2095. [Google Scholar] [CrossRef]
  16. Aziz, H.A.; Adlan, M.N.; Amilin, K.; Yusoff, M.S.; Ramly, N.H.; Umar, M. Quantification of leachate generation rate from a semi-aerobic landfill in Malaysia. Environ. Eng. Manag. J. 2012, 11, 1581–1585. [Google Scholar] [CrossRef]
  17. Feng, S.J.; Chen, Z.W.; Chen, H.X.; Zheng, Q.T.; Liu, R. Slope stability of landfills considering leachate recirculation using vertical wells. Eng. Geol. 2018, 241, 76–85. [Google Scholar] [CrossRef]
  18. Kadambala, R.; Townsend, T.G.; Jain, P.; Singh, K. Temporal and spatial pore water pressure distribution surrounding a vertical landfill leachate recirculation well. Int. J. Environ. Res. Public Health 2011, 8, 1692–1706. [Google Scholar] [CrossRef]
  19. Feng, S.-J.; Chang, J.-Y.; Zhang, X.-L.; Shi, H.; Wu, S.-J. Stability Analysis and Control Measures of a Sanitary Landfill with High Leachate Level. J. Geotech. Geoenviron. Eng. 2021, 147, 05021009. [Google Scholar] [CrossRef]
  20. Merry, S.M.; Kavazanjian, E.; Fritz, W.U. Reconnaissance of the July 10, 2000, Payatas Landfill Failure. J. Perform. Constr. Facil. 2005, 19, 100–107. [Google Scholar] [CrossRef]
  21. Kavazanjian, E.; Beech, J.F.; Matasović, N.; Eid, H.T.; Stark, T.D.; Evans, W.D.; Sherry, P.E. Municipal Solid Waste Slope Failure. I: Waste and Foundation Soil Properties. J. Geotech. Geoenviron. Eng. 2001, 127, 812–815. [Google Scholar] [CrossRef]
  22. Blight, G.E. Interpretations of surface movements of a landfill built on steeply sloping ground. A cautionary case history. Waste Manag. Res. 2007, 25, 572–584. [Google Scholar] [CrossRef] [PubMed]
  23. Zhang, Z.; Wang, Y.; Fang, Y.; Pan, X.; Zhang, J.; Xu, H. Global study on slope instability modes based on 62 municipal solid waste landfills. Waste Manag. Res. 2020, 38, 1389–1404. [Google Scholar] [CrossRef] [PubMed]
  24. Wu, Q.; Liu, Y.; Tang, H.; Kang, J.; Wang, L.; Li, C.; Wang, D.; Liu, Z. Experimental study of the influence of wetting and drying cycles on the strength of intact rock samples from a red stratum in the Three Gorges Reservoir area. Eng. Geol. 2023, 314, 107013. [Google Scholar] [CrossRef]
  25. Munwar Basha, B.; Raviteja, K.V.N.S. Meethotamulla Landfill Failure Analysis: A Probabilistic Approach. In Geotechnics for Natural and Engineered Sustainable Technologies: GeoNEst; Springer: Singapore, 2018; pp. 341–351. [Google Scholar] [CrossRef]
  26. Guo, C.; Zhang, Y.; Yuan, H.; Liu, D.; Yan, Y.; Hua, S.; Ren, S. Study of an ancient landslide reactivation mechanism based on centrifuge model testing: An example of the Jiangdingya ancient landslide reactivation in 2018, Gansu Province, China. Landslides 2023, 20, 127–141. [Google Scholar] [CrossRef]
  27. Ling, H.; Ling, H.I. Centrifuge Model Simulations of Rainfall-Induced Slope Instability. J. Geotech. Geoenviron. Eng. 2012, 138, 1151–1157. [Google Scholar] [CrossRef]
  28. Xu, J.; Ueda, K.; Uzuoka, R. Evaluation of failure of slopes with shaking-induced cracks in response to rainfall. Landslides 2022, 19, 119–136. [Google Scholar] [CrossRef]
  29. Chen, Y.M.; Li, J.C.; Yang, C.B.; Zhu, B.; Zhan, L.T. Centrifuge modeling of municipal solid waste landfill failures induced by rising water levels. Can. Geotech. J. 2017, 54, 1739–1751. [Google Scholar] [CrossRef]
  30. Lü, X.; Xue, D.; Chen, Q.; Zhai, X.; Huang, M. Centrifuge model test and limit equilibrium analysis of the stability of municipal solid waste slopes. Bull. Eng. Geol. Environ. 2019, 78, 3011–3021. [Google Scholar] [CrossRef]
  31. Fang, K.; Zhang, J.; Tang, H.; Hu, X.; Yuan, H.; Wang, X.; An, P.; Ding, B. A quick and low-cost smartphone photogrammetry method for obtaining 3D particle size and shape. Eng. Geol. 2023, 322, 107170. [Google Scholar] [CrossRef]
  32. Zhan, T.L.T.; Chen, Y.M.; Ling, W.A. Shear strength characterization of municipal solid waste at the Suzhou landfill, China. Eng. Geol. 2008, 97, 97–111. [Google Scholar] [CrossRef]
  33. Xu, Q.; Tolaymat, T.; Townsend, T.G. Impact of Pressurized Liquids Addition on Landfill Slope Stability. J. Geotech. Geoenviron. Eng. 2012, 138, 472–480. [Google Scholar] [CrossRef]
  34. De Stefano, M.; Gharabaghi, B.; Clemmer, R.; Jahanfar, M.A. Berm design to reduce risks of catastrophic slope failures at solid waste disposal sites. Waste Manag. Res. 2016, 34, 1117–1125. [Google Scholar] [CrossRef] [PubMed]
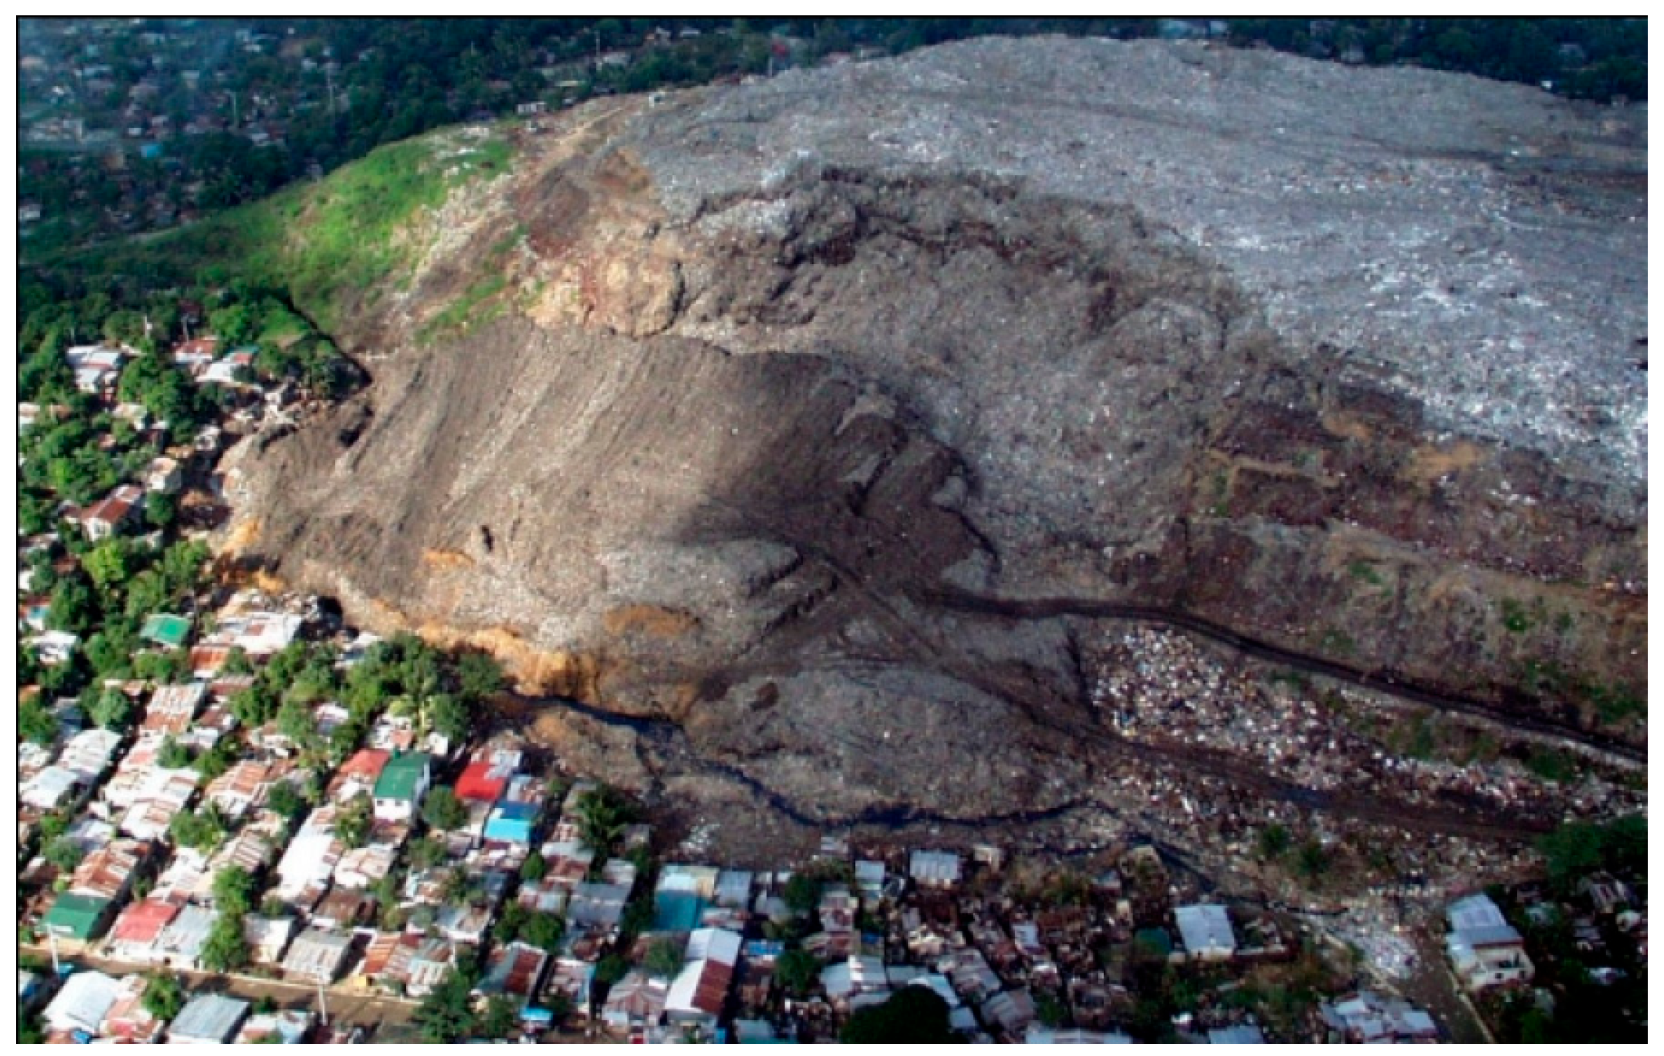
Figure 1. Slope failure in the Payatas landfill in Quezon City, Philippines (source: International Journal of Geoengineering Case Histories).
Applsci 13 10498 g001
Figure 2. Schematic diagram of the two-wedge and three-wedge division of the waste body slope: (a) traditional method, two-wedge model; (b) based on failure surface, two-wedge model; (c) traditional method, three-wedge model; (d) based on failure surface, three-wedge model.
Applsci 13 10498 g002
Figure 3. Two-wedge model. (a) Traditional two-wedge force analysis model. (b) Two-wedge force analysis model based on actual failure surface. WA, WP are the bulk density of the active wedge and passive wedge. EHA, EVA, UHA, EHP, EVP, and UHP are the horizontal and vertical components of the interface force between the active wedge and the passive wedge, and the water pressure, respectively. UA, UP, NA′, NP′, FA, and FP are the resultant pore water pressure, effective positive pressure, and frictional resistance acting on the active wedge and passive wedge failure surfaces. CA, CP, Csw, δA, δP, and φsw are the cohesion and friction angle of active wedge and passive wedge interfaces. FSA, FSP, and FSV are the FS of active wedge sliding surface, passive wedge sliding surface, and active wedge and passive wedge interface. β is the angle between the failure surface and the horizontal plane.
Applsci 13 10498 g003
Figure 4. (a) The traditional three-wedge force analysis model. (b) The three-wedge force analysis model based on the actual failure surface. Subscript B represents the block wedge.
Applsci 13 10498 g004
Figure 5. Schematic diagram of the two-wedge model of a slope without berm based on the centrifugal test: (a) traditional model; (b) based on the actual failure surface. It should be noted that the geometry scale marked is the full-scale model corresponding to the centrifugal model.
Applsci 13 10498 g005
Figure 6. (a) Three-wedge centrifugal test result (modified from [29]). (b) Equivalent actual-scale model. The size unit of the centrifugal test is mm. The geometric size in the diagram is derived from the conversion of centrifugal model similarity relationship.
Applsci 13 10498 g006
Figure 7. Variation curve of FS with slope height H for fixed water level ratio of two-wedge model.
Applsci 13 10498 g007
Figure 8. Two-wedge model: profile of FS with water level of different failure surface angles α.
Applsci 13 10498 g008
Figure 9. Sensitivity analysis: the effects of (a) cohesion and (b) friction angle.
Applsci 13 10498 g009
Figure 10. Simplified diagram of three-wedge model.
Applsci 13 10498 g010
Figure 11. Three-wedge model: profile of FS with water level of different failure surface angles α.
Applsci 13 10498 g011
Figure 12. Three-wedge model: profile of FS with cohesion of different friction angle in active and passive wedges.
Applsci 13 10498 g012
Figure 13. Three-wedge model: profile of FS with different heights of berm and several dip angles.
Applsci 13 10498 g013
Disclaimer/Publisher’s Note: The statements, opinions and data contained in all publications are solely those of the individual author(s) and contributor(s) and not of MDPI and/or the editor(s). MDPI and/or the editor(s) disclaim responsibility for any injury to people or property resulting from any ideas, methods, instructions or products referred to in the content.