Article

Histogram-Based Analysis of Low- and High-Grade Glioma and Its Surrounding Edema Using Arterial Spin Labeling Magnetic Resonance Imaging

1
Department of Diagnostic and Interventional Neuroradiology, University Hospital Hamburg-Eppendorf, 20246 Hamburg, Germany
2
Department of Neurosurgery, University Hospital Hamburg-Eppendorf, 20246 Hamburg, Germany
*
Author to whom correspondence should be addressed.
Appl. Sci. 2023, 13(19), 10581; https://doi.org/10.3390/app131910581
Submission received: 28 August 2023 / Revised: 20 September 2023 / Accepted: 21 September 2023 / Published: 22 September 2023

Abstract

:
A glioma is a type of intra-axial brain tumor originating from the glial cells. Making up about one-third of all brain tumors, a timely diagnosis alongside correct grading and subsequent therapy planning is crucial. Magnetic Resonance Imaging is an established method for the diagnosis of tumors. Arterial Spin Labeling (ASL) Perfusion Imaging allows for the non-contrast enhanced visualization of tumor hyper- or hypoperfusion. Commonly, cell swelling occurs around the tumor that causes edema, which subsequently puts healthy tissue at risk by potentially reducing regional perfusion. The patient collective in this study consists of 495 patients (501 scans) with histopathologically confirmed grade II-IV diffuse gliomas. The aim of this study was to evaluate the potential of histogram analysis of the ASL data to find biomarkers for the pathological diagnosis, grading, MGMT, and mutation status of the tumors as well as the analysis of tumor-surrounding edema. The analysis showed statistically significant results for the pathological diagnosis and grading but not for MGMT status or mutation. The differentiation between tumor and edema showed highly significant results yet did not show differences between edema and perfusion on the contralateral hemisphere.

1. Introduction

Gliomas are a type of brain tumor that arises from neuroepithelial tissue and make up about 28% of all brain tumors [1]. Depending on the originating cell type, gliomas are grouped as either astrocytomas or oligodendrogliomas. Furthermore, the World Health Organization (WHO) suggested a subdivision of tumor grades, namely grade I for the lowest and IV for the highest grade. To be specific, grades I and II are denoted as low-grade gliomas (LGGs), and grades III and IV are high-grade gliomas (HGGs). This classification has been in place since the last update in 2016 [2]. However, despite these categorizations, gliomas are heterogeneous regarding their histopathology, mutation type, and methylation. In particular, diffuse gliomas (grades II–IV) are currently subdivided based on their isocitrate dehydrogenase (IDH) 1 and 2 gene expression, methylation, i.e., O-6-Methylguanin-DNA-Methyltransferase (MGMT), and further parameters such as telomerase, tumor suppressor genes, and others [2]. Next to the tumor mass itself, edema is likely to surround the lesion, which results from the leakage of plasma that comes across the vessel wall into the parenchyma after disruption of the blood–brain barrier. Due to the accumulation of liquid inside the fixed system of the brain, which is mainly limited by the skull, such edema may result in increased intracranial pressure (ICP) and potentially lead to permanent neurological damage by compression of the brain tissue [3,4]. For the diagnosis of gliomas and the surrounding edema, the gold standard method is stereotactic biopsy and/or sample collection during neurosurgery. Due to its invasiveness, however, such methods might not be able to be performed in all patients and bear various risks, such as infections. In order to non-invasively evaluate tumors and their progression, radiological and nuclear medicine imaging methods are available and clinically used. These include methods using ionizing radiation, such as positron emission tomography (PET) or contrast-enhanced computed tomography (CT). While the latter is generally not seen as a standard method, the combination of PET and CT is commonly used for glioma imaging. PET uses radioactive tracers that bind to specific targets (e.g., tumor cells) to visualize them [5,6,7]. This method, however, involves ionizing radiation from the tracer and the CT scanner as well as bears a risk from the injection of the radionuclide. Another method is Magnetic Resonance Imaging (MRI), which is generally considered the most important modality and not only includes the initial diagnosis but also the therapy planning and follow-up imaging [8]. Sometimes MRI is also used in combination with PET-CT and shows improved specificity (66–95.5%), sensitivity (81–90.05%), and accuracy (70.9–74.9%) [9]. Most often, structural imaging with T1 and T2 (FLAIR) image contrast is performed, commonly with the use of a contrast agent, to visualize the hypervascularized tumor tissue. Such structural methods are, however, limited, and therefore, advanced techniques are commonly considered to be added to current protocols for a more comprehensive analysis. These include but are not limited to diffusion-weighted imaging (DWI), dynamic susceptibility contrast imaging (DSC), and susceptibility-weighted imaging (SWI) as already described in the literature [10]. However, there is still a need to improve the available biomarkers that could allow for a safer diagnosis and could lead to the reduction of biopsies, which would be beneficial for patients due to its invasiveness. A promising method in this regard is Arterial Spin Labeling (ASL), which is a method that allows for non-contrast-enhanced perfusion imaging. ASL can be used for the diagnosis of various pathologies that alter brain perfusion, including strokes, arterio-venous malformations, and tumors [11,12]. The currently recommended ASL technique is denoted as single post labeling delay (PLD) pseudo-continuous ASL (PCASL) imaging in which blood flowing through the labeling plane in the neck is inverted (label) for one image, and for the second, the net magnetization is not altered (control), followed by a waiting period known as the PLD to allow for the blood to reach the tissue and undergo perfusion. Another advantage of PCASL compared to other methods is its robustness over a range of blood flow velocities, which might be altered in patients, and also the low demand on the hardware of the scanners, which allows its use on most clinical devices [11]. After acquiring these two images, subtraction of the data shows qualitative brain perfusion. Due to the low signal difference between the label and control, the acquisition is repeated multiple times, keeping the parameters constant to acquire a high signal-to-noise ratio for the final images. ASL mainly allows for the visualization of gray matter perfusion. However, in tissues with perfusion alterations, such as tumors, these can be visualized using ASL irrespective of the originating tissue. Previous work already showed that it is possible to differentiate between HGGs and LGGs, which has already been presented in the literature [13,14,15]. ASL additionally has been used for discrimination between glioma recurrence and radiation damage [16], the grading of gliomas [17,18,19], and distinguishing between tumors and metastasis [20]. While these studies show the potential of ASL, they mainly address either differences with other tissues or correlate the findings with other methods. The inclusion of other biomarkers, such as MGMT, etc., however, has not yet been systematically analyzed by means of histogram analysis. Additionally, the surrounding edema has not yet been investigated by means of perfusion imaging. Cerebral edema is caused by a variety of factors and is not only limited to the presence of a tumor. However, in general, any tumor (or metastasis) in the brain results in tumor-surrounding edema. This occurs due to transcapillary filtration forces that are greater than the absorptive forces in the tissue. Thus, fluids transude into the tissue (i.e., the interstitial space) slowly. In the healthy brain, this inflow is normally counterbalanced by lymphatic flow, which then carries proteins and water back into the bloodstream. Tumors, however, lack this lymphatic system, and this physiological drainage system is not in place in and around the tumor. Other factors include a higher permeability of the tumor capillaries (compared to capillaries in healthy tissues), (temporary) occlusion of tumor capillaries by fast growth and subsequent compression, overproduction of collagen or polysaccharides and their accumulation, disaggregation of the matrix of the tumor cells, increased diffusion inside the cells, and cell death [4]. Because of these factors, the healthy osmotic gradient of the intra- and extracellular space cannot be maintained and thus leads to cell swelling, i.e., edema. The presence and amount of these factors vary between tumor entities, grades, and mutation. Having such changes in the cells translates to a reduced (or loss of) function in the brain tissue, which can be easily spotted using imaging modalities. Tumor edema can already be seen in T1-weighted images, which are generally not sensitive to free fluid, but are even more pronounced in T2/FLAIR images and especially DWI. These methods allow for a clear delineation of edema compared to not only the tumor but also the surrounding healthy tissue.
Since the accumulation of fluid in multiple cells (the edema) can have a strong effect on tissue blood flow, additional considerations have to be made. As edema disturbs the equilibrium of the volume inside the constrained volume of the skull, such an increase needs to be compensated by secondary effects, e.g., reduction of the flow of other fluids, such as blood or cerebrospinal fluid. However, when the compensation mechanism is inadequate, the pressure in the tissue can increase, which is not a local effect but a systemic effect on the brain. As a mild increase in the pressure can have an adverse effect on the capillaries, it is likely that the presence of edema can compress smaller capillaries, which reflects in a reduction in perfusion.
With these described physiological effects, such tissue alterations are expected to show reduced perfusion compared to regular perfusion in healthy gray matter due to the cell swelling that occurs. This effect is likely to happen as the swollen cells compress the affected area (i.e., compress the arteries), and thus, brain perfusion is reduced. However, since it is known that due to the described increase of relative brain volume, the perfusion inside the brain is generally reduced, i.e., the non-affected hemisphere, and all other parts might also have reduced perfusion [3].
The aim of this study, therefore, is to use ASL as a biomarker to differentiate between the histopathological diagnosis, HGGs and LGGs, MGMT status, and mutation type and to finally assess the performance of ASL in the diagnosis and delineation of tumor-surrounding edema in order to overcome limitations of previous studies that did not have these clinical parameters and/or no segmentations of the tumor and surrounding edema at hand. Additionally, the goal is to highlight ASL being used in routine glioma imaging, highlighting the potential for differential diagnosis and prompting the use in clinical settings.

2. Materials and Methods

The data used in this study were taken from the University of California San Francisco Preoperative Diffuse Glioma MRI (UCSF-PDGM) dataset [21]. The collective consists of 495 patients (501 MRI datasets) with a histopathologically confirmed diagnosis of grade II–IV diffuse gliomas. The patients underwent preoperative MRI at a single medical center between 2015 and 2021. Imaging was performed using a 3T scanner (Discovery 750, GE Healthcare, Waukesha, WI, USA) using a dedicated 8-channel head coil (Invivo, Gainesville, FL, USA). The data used in this study are freely available at the Cancer Imaging Archive (cancerimagingarchive.net, accessed on 14 August 2023). Next to the imaging data, clinical data of the patients were also available. This includes sex, age, tumor grade, pathological diagnosis (WHO classification), MGMT status and index, genetic makeup, IDH mutation, dead or alive status, overall survival, extent of resection, and finally if a biopsy was performed. In this study, the parameters found in Table 1 have been selected and used for further analysis, i.e., WHO classification, mutation status, MGMT, and tumor grade. No discrimination between sex and/or age was performed. The survival status was also not included in the analysis. Details on the distribution of patients with regard to the different classifications used in this study can be found in Table 1. The entire dataset consists of structural images, i.e., T1 (with and without contrast agent), T2, and FLAIR as well as physiological imaging data, such as susceptibility-weighted images, diffusion-weighted images (and derivatives), and ASL perfusion.
In this study, only the ASL data were used for the purpose of analyzing the tumor itself alongside the surrounding edema and the contralateral side in order to evaluate differences between the affected and contralateral hemispheres. ASL was performed as 3D sequence and registered and resampled to the 3D space defined by the FLAIR image that had a 1 mm isotropic resolution using automated non-linear registration (Advanced Normalization Tools). Thus, the ASL had the same final resolution as the FLAIR scan (and the other sequences from the dataset). Additionally, the available tumor segmentation was used to delineate the ASL images. For this, the available segmentations of the enhancing tumor from the gadolinium-enhanced T1 images and the surrounding edema from the FLAIR images were used. This multicompartment tumor segmentation was part of the 2021 BraTS challenge [22]. In this, the image data first underwent automated segmentation using an ensemble model consisting of prior BraTS challenge-winning segmentation algorithms and were then manually corrected by trained radiologists and approved by 2 expert reviewers. Finally, with both the enhancing tumor and edema segmentation available within the same 3D space, these segmentations were directly used. Precisely, from the individual segmentations, binary masks were created and applied to the ASL perfusion images. This was performed for the highly perfused tumor area and the edema, while the latter was also mirrored to allow for a comparison to the contralateral hemisphere. The remaining image data after the logical AND operation were the used regions of interest for the subsequent statistical analysis, i.e., the region of interest (ROI).
An example is shown in Figure 1.
Within these ROIs, the values for entropy, minimum, maximum, mean value, standard deviation, skewness, and kurtosis of the resulting histograms were calculated using in-house developed scripts using MATLAB R2018b (The MathWorks, Natick, MA, USA). These scripts calculated each parameter on a voxel-wise base within the corresponding masks, and finally, the average value per parameter and patient was taken into consideration for further processing and statistical analysis. Having obtained a single value for each parameter, the subsequent statistical analysis was performed using GraphPad 10.0.0 for Windows (GraphPad Software, Boston, MA, USA). Comparisons were calculated for the pathological diagnosis for LGG vs. HGG, MGMT status, mutation type (or wildtype), and finally between tumor, edema, and the contralateral hemisphere. The data were not normally distributed; thus, the Kruskal–Wallis test was performed when three or four parameters were compared and the Mann–Whitney test for two parameters. In all instances, a p-value of <0.05 was interpreted as statistically significant.

3. Results

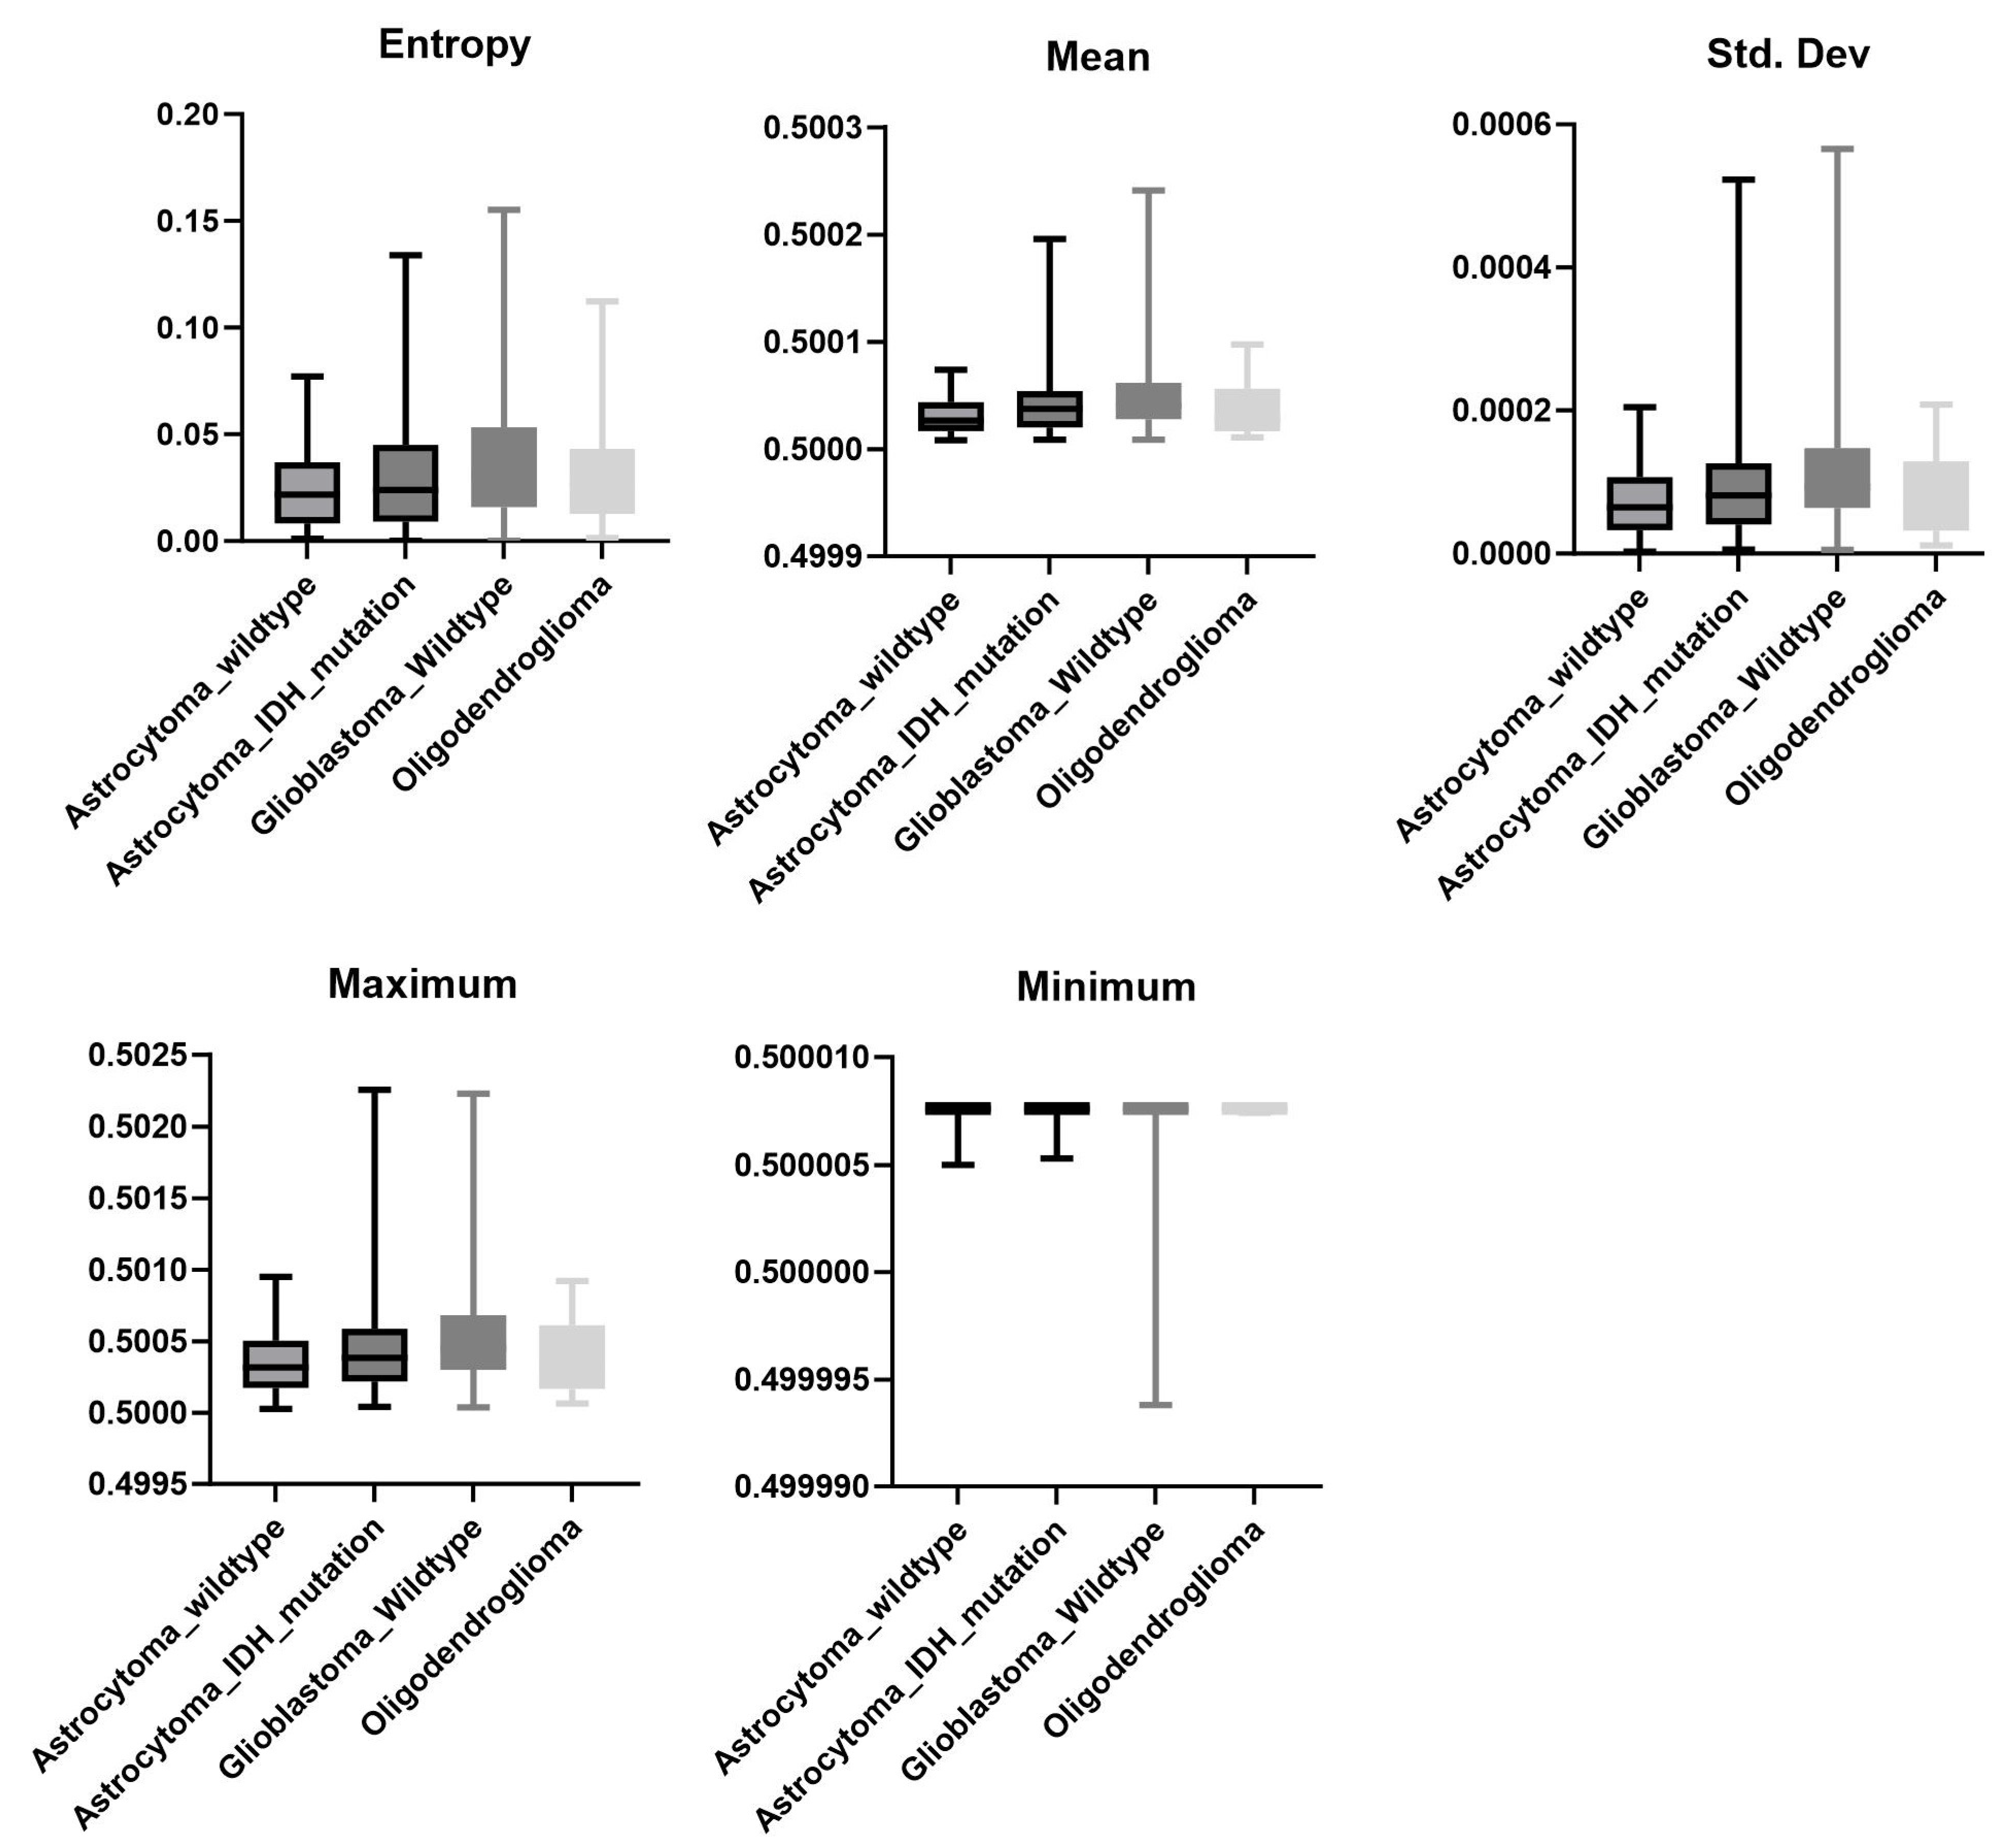
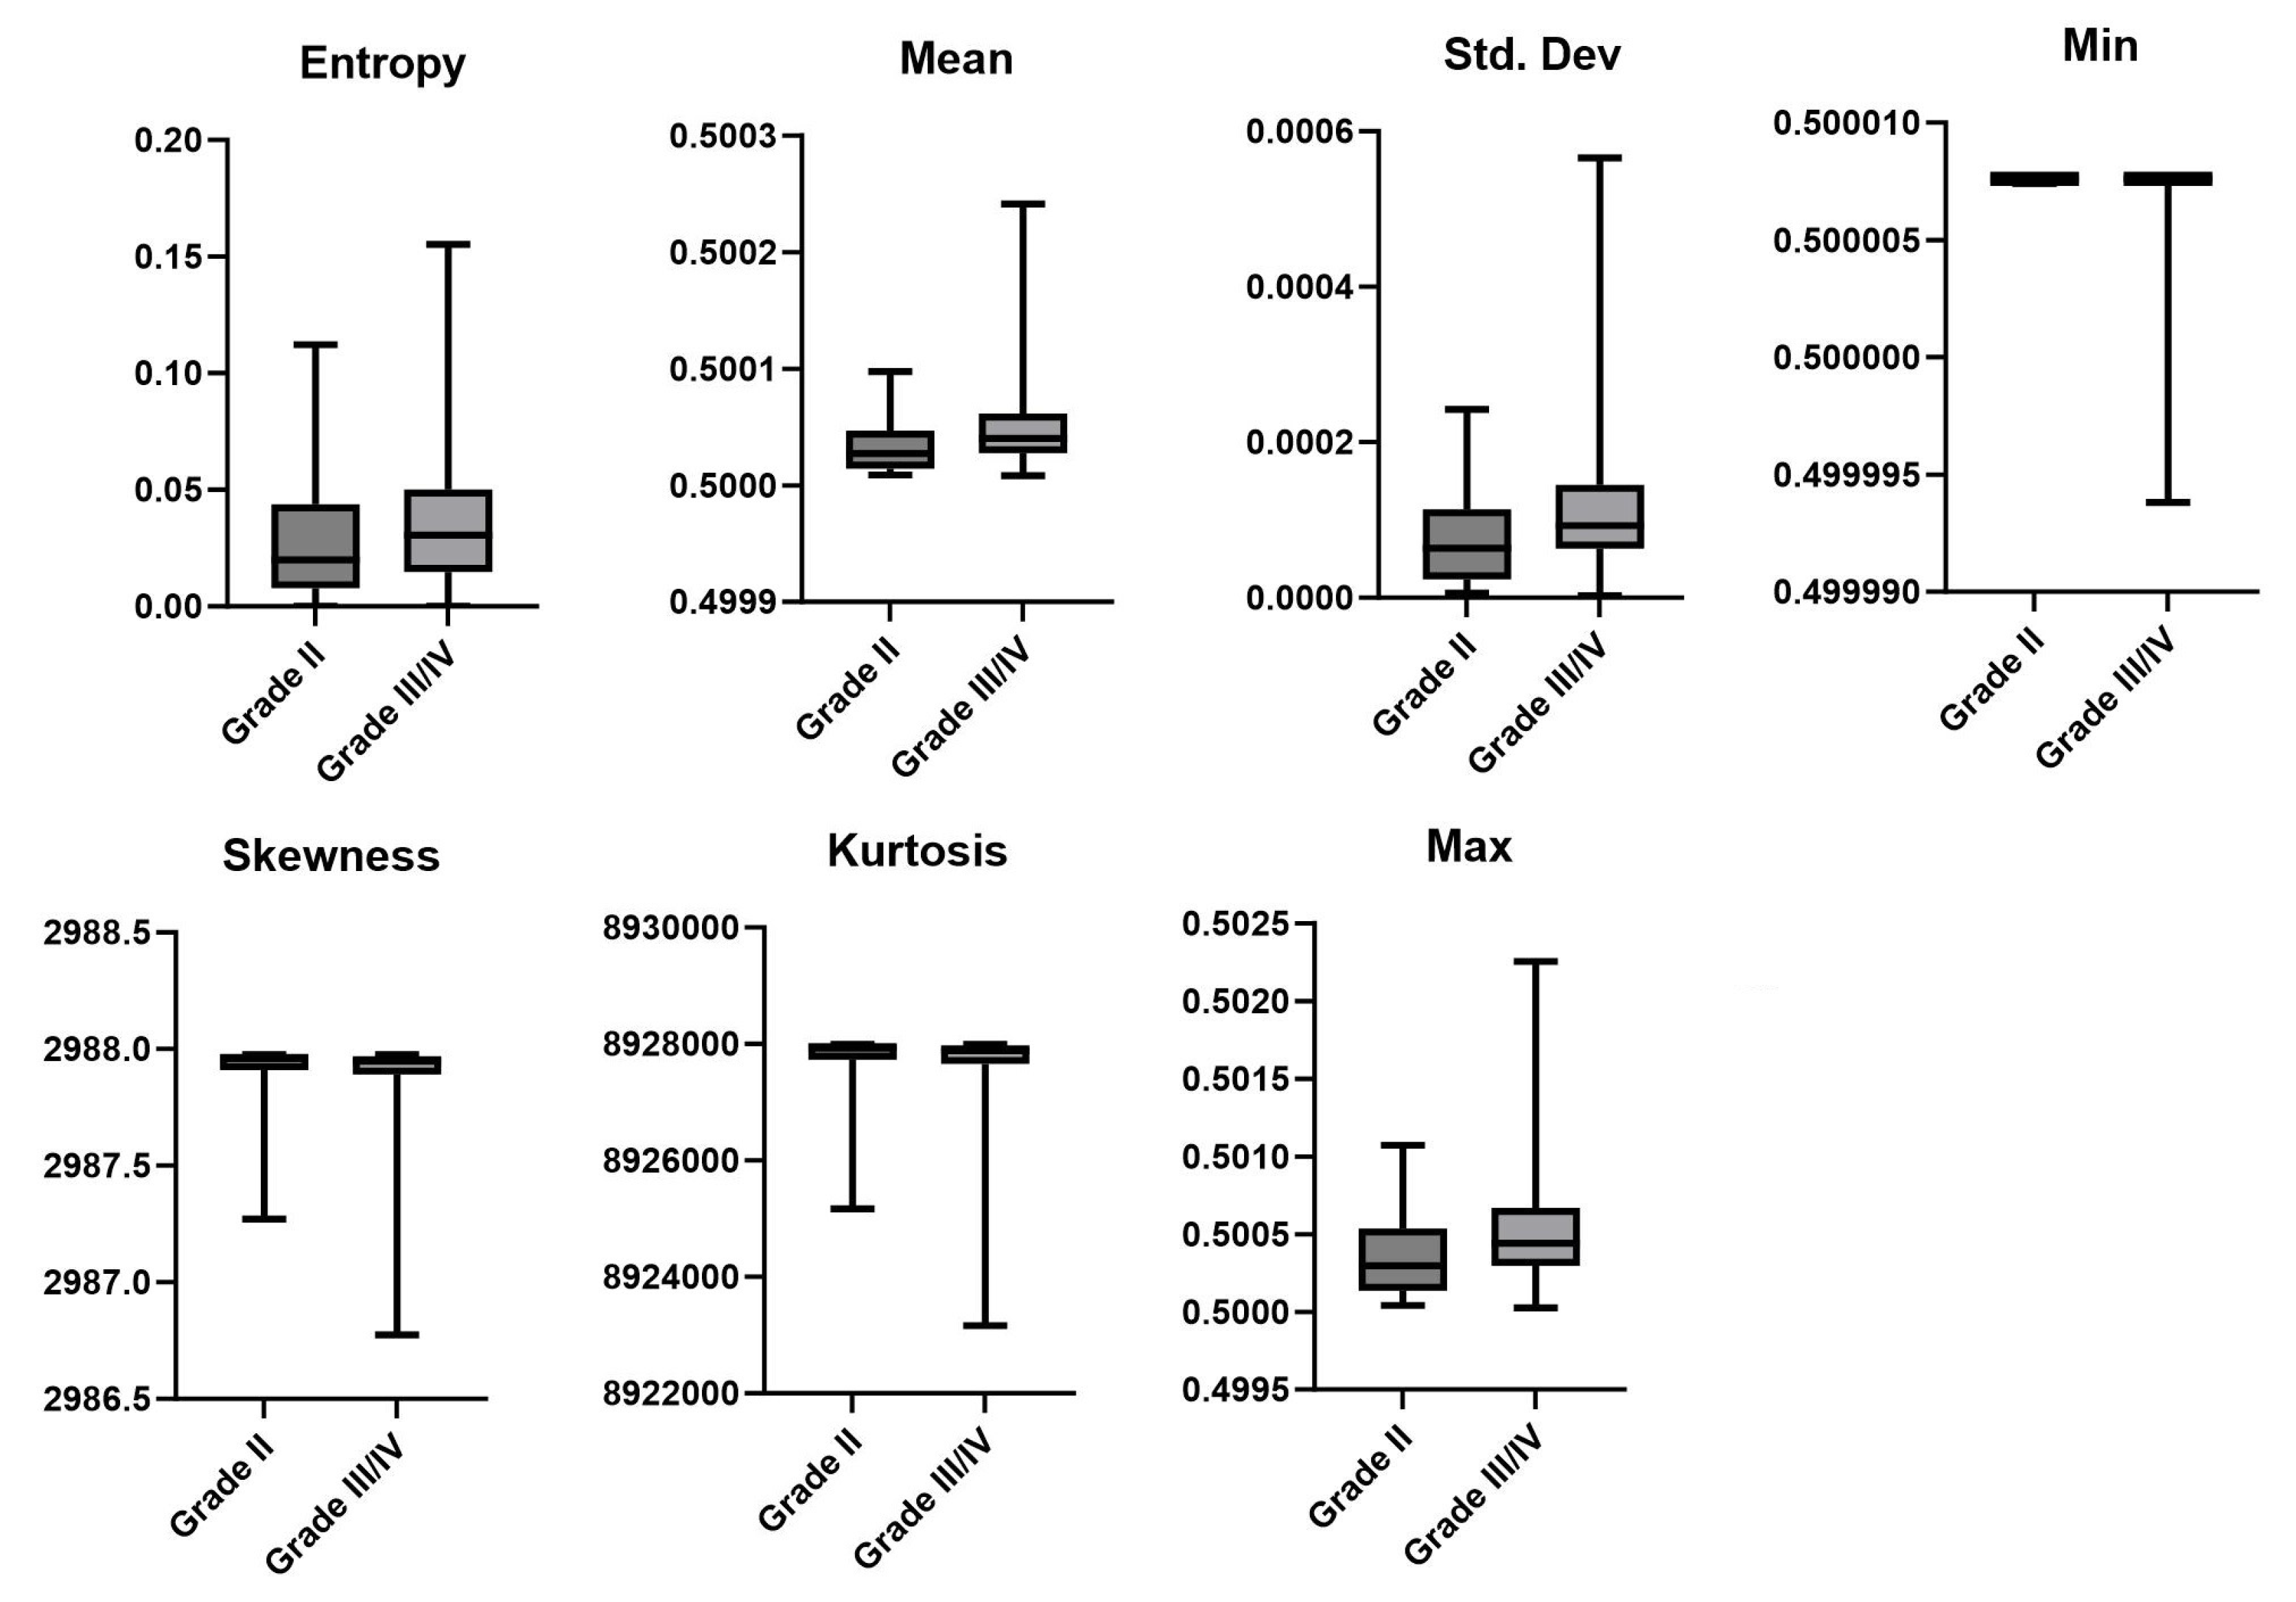
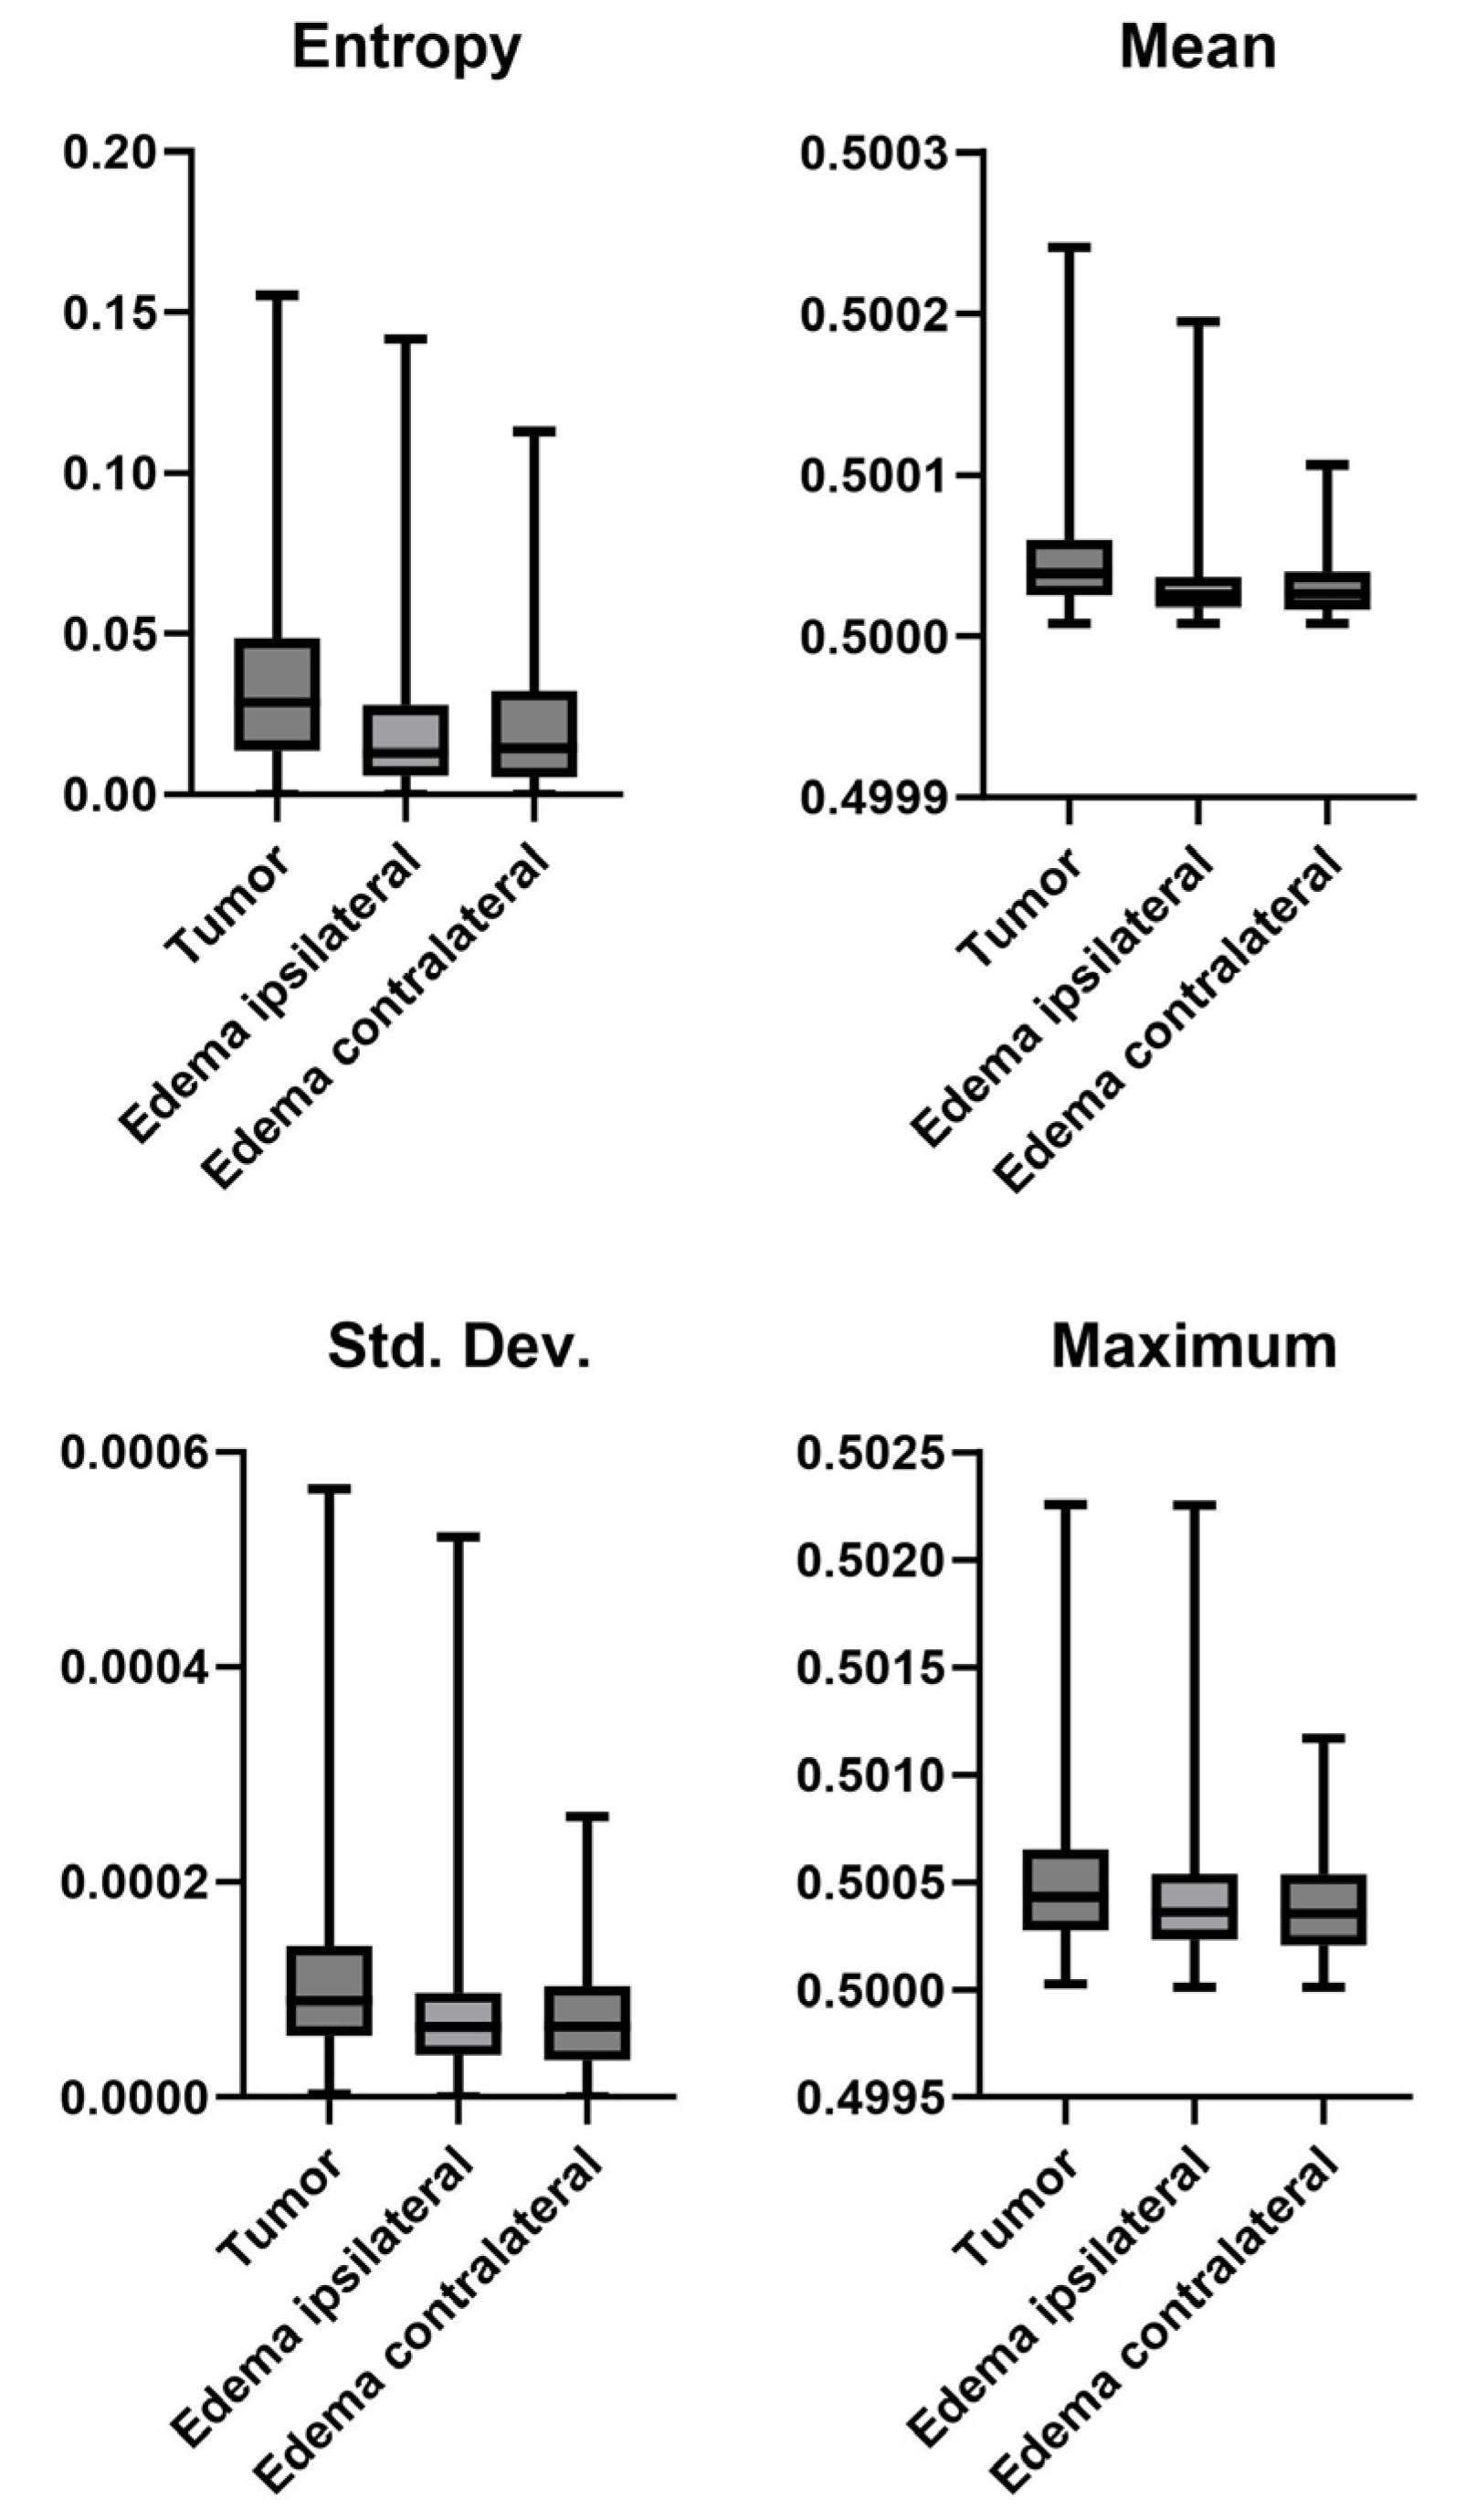
The results presented in this section describe the statistically significant findings only. All p-values for all parameters are shown in Table 2. The graphical representation of the statistically significant parameters of the pathological diagnosis and LGG vs. HGG are shown in Figure 2 and Figure 3. The representation comparing the tumor, edema, and contralateral side is in Figure 4. For all measured parameters and the remaining non-significant results, the values are shown in the Supplementary Section (Supplementary Figures S1–S5).

3.1. Pathological Diagnosis

The Kruskal–Wallis test for the pathological diagnosis showed a statistical significance for the values of entropy (p < 0.0364), mean (p < 0.0028), standard deviation (p < 0.0045), minimum (p < 0.0073), and maximum (p < 0.0021) (Figure 2). The values for skewness and kurtosis did not reach statistical significance (p = 0.1204 and p = 0.1210, respectively).

3.2. LGG vs. HGG

To differentiate between LGGs and HGGs, the Mann–Whitney test showed statistical significance in all metrics, i.e., the entropy (p < 0.0072), mean (p < 0.0001), standard deviation (p < 0.0001), skewness (p < 0.0144), kurtosis (p < 0.0146), max (p < 0.0001), and min (p < 0.0016) (Figure 3).

3.3. MGMT Status

The analysis of the MGMT status (positive or negative) showed statistical significance using the Mann–Whitney test only for the min value (p < 0.0278). The values for entropy (p = 0.8595), mean (p = 0.9388), standard deviation (p = 0.9271), skewness (p = 0.9278), kurtosis (p = 0.9278), and max (p = 0.7397) were not statistically significant.

3.4. Mutation

For the analysis of the mutation type, the Kruskal–Wallis test showed statistical significance for the min (p < 0.0048) and the max (p < 0.0354). The values for entropy (p = 0.1409), mean (p = 0.1396), standard deviation (p = 0.0985), skewness (p = 0.3051), and kurtosis (p = 0.3050) were not statistically significant.

3.5. Tumor vs. Edema

Finally, the differentiation between tumor and edema showed statistical significance in the Kruskal–Wallis test (comparing tumor, edema, and contralateral side) in all analyzed parameters with p < 0.0001 (Figure 4). Comparing the edema with the contralateral side using the Mann–Whitney test showed statistical significance only for the minimum value (p < 0.0001). The remaining values of entropy (p = 0.4866), mean (p = 0.9823), standard deviation (p = 0.7005), skewness (p = 0.2790), kurtosis (p = 0.2701), and max (p = 0.0767) were not statistically significant.

4. Discussion

In this study, the ASL datasets of 495 patients (with a total of 501 MRI scans) with a confirmed diagnosis of glioma (grades II–IV) were analyzed by means of histogram analysis of the segmented tumor area as well as the surrounding edema and its contralateral side.
Using ASL, the differentiation between low-grade and high-grade gliomas has been presented earlier in smaller cohorts and meta-analyses [13,23,24]. The final pathological diagnosis according to the WHO 2021 criteria has not yet been performed. Furthermore, from the dataset, the MGMT status and type of mutation were analyzed. Finally, a differentiation between the tumor mass and edema was performed alongside the side-comparison of the edema and the unaffected hemisphere, which has not yet been done before as to our knowledge.
The metrics of entropy, mean, standard deviation, skewness, kurtosis, minimum, and maximum are commonly used in the analysis of medical images, and their use has already been presented for gliomas on ADC data for diffusion-weighted imaging [25]. These parameters can be easily calculated using state-of-the-art software, and since the output is a single number only, the results can be directly used for interpretation and comparison. Furthermore, the described parameters depict a wide range of possible influencing factors in medical imaging; e.g., they describe the inhomogeneity of the areas (or the homogeneity) alongside the distribution of gray values and whether they tend to the lower or higher end. Thus, using these parameters, a holistic view of tumor image properties can be drawn in reasonable processing times and with clear and easily understandable results. Additionally, as these metrics are measured and not derived by algorithms, they are less likely to be skewed by the type of calculation that is being performed.
The first aim of this study was to investigate whether ASL is an appropriate tool for determining the final pathological diagnosis of gliomas according to the WHO guidelines [2]. In the used dataset, wildtype and IDH-mutated astrocytomas as well as wildtype gliomas and oligodendrogliomas were clinically and pathologically confirmed. Most analyzed metrics (except skewness and kurtosis) showed statistically significant differences between these tumor types. This is also reflected in the box plots (Figure 2) with the larger range of values evident in the IDH-mutated astrocytomas and the wildtype gliomas. These results can be explained with the higher cell differentiation in mutated cells which causes a higher variation in multiple metrics, including their perfusion pattern. Such distinctions are important, as these differences can influence the type of therapy. However, given the overlap of values between the different types of diagnosis, one should be careful to not overestimate the effect of the values, especially in individual cases.
As a second result, the differentiation between LGGs and HGGs has been performed, and each of these metrics showed a p-value below the threshold of 0.05. Thus, it seems appropriate to use ASL as a tool for differentiation between glioma tumor grades. This has already been shown previously [13,23,24]. The large dataset available that has been used in this study thus adds to the body of proof to use ASL in such a setting. A differentiation between LGGs and HGGs is straightforward, and the differences in perfusion are evident. Commonly, higher-grade tumors have a higher rate of cell proliferation and thus increased perfusion. In this study, grade II was compared to grades III and IV. The results of this study might be skewed, as the difference in the number of patients is high (99 LGG and 402 HGG). However, as the results show clear differences, tumor perfusion can be seen as a viable option for differential diagnosis in gliomas as part of a larger MRI protocol including other sequences and contrasts.
Third, the MGMT status was analyzed. Here, either the positive or negative status was used, while the indeterminate and empty datapoints were discarded. There were no statistically significant results obtained except for the minimum value. However, this single metric might be skewed due to the small range and large outlier datapoints. Thus, ASL seems to be not an appropriate predictor of MGMT status, which is not surprising, as these kinds of changes likely do not reflect in perfusion changes.
Similarly, the type of mutation was analyzed, i.e., IDH-1, NOS, or wildtype (the dataset only had two patients with IDH-2 mutations, which were subsequently discarded), which did not show statistically significant results. Only the minimum shows a p-value below 0.05, which again has to be interpreted with care as in the MGMT status analysis. As explained in the MGMT status, mutations will not likely cause (strong) changes in perfusion and thus will not be reflected in the ASL analysis.
While MRI has been shown to be predictive of MGMT and mutation status, such analyses likely were performed using multiple sequences and contrasts rather than perfusion imaging alone, and therefore, the value of (ASL) perfusion imaging remains questionable [26,27].
Finally, the differentiation between tumor and edema shows highly statistically significant results (p < 0.0001) for all analyzed metrics. This is obvious, as there is a large signal difference between the tumor volume and the surrounding edema, which is then also reflected in the histograms. Somewhat surprising is that there is no statistically significant difference between perfusion in the surrounding edema of the tumor and the contralateral side. Visually, the box plots show a higher standard deviation compared to the contralateral side, which could hint at a difference in perfusion, i.e., the tumor surrounding the edema area experiences changes in perfusion. As there is cell swelling within the area of the tumor, it is self-evident that perfusion in this area is being reduced. However, the results in this study suggest that there is an overall reduction of perfusion within the entire brain, as the measured values of the contralateral side do not differ much from the ones in the edema area. As a further consequence, this could mean that the cell swelling itself does not influence local perfusion, but the secondary increase in ICP downregulates cerebral perfusion globally. This specific topic, however, seems to have received only low attention in the past [4,28]. Even there, perfusion mechanisms were only assessed indirectly using DWI [4] to differentiate between tumor or metastasis [28]. A specific edema perfusion-characterizing study has not yet been performed to our knowledge. Observing isolated edema perfusion has several potential advantages, including finding biomarkers that predict drug delivery when administered and prediction of cell death inside the edema. These questions could not be answered in this study; thus, further analysis alongside different methods should be performed.
Comparing the findings to the current literature as well as clinical practice shows that ASL holds the potential to add to the current clinical routine use and to be seen as an add-on for glioma evaluation. Current standard methods such as T1, T2 (FLAIR), and DWI still remain the gold standard that should be performed as a minimum [29]. Other methods such as DSC already show the potential of grading gliomas, which, however, happens at the expense of having to use contrast agents [30]. Thus, ASL might be attractive to be used in patients who cannot obtain external contrast agents. Other methods such as SWI can be used as well and show promising results yet are also limited compared to perfusion imaging, such as investigating the vascularity of tumors [31]. More advanced DWI methods such as diffusion kurtosis imaging are being currently investigated yet have not found their way into routine applications yet [32].
The strength of this study is the large number of patients and MRI datasets alongside quality-controlled segmentations of the areas of interest and a multitude of clinical parameters that were assessed. Furthermore, the parameters that were calculated in this study are easily obtainable with simple image-processing methods. The large dataset is particularly interesting as it is a quality-controlled and freely available set of MRI data, which can be used for research and all parameters are clinically confirmed, therefore a control group was not necessary as the methods used can be considered as gold standard. Furthermore, such a large dataset compensates for outliers that can likely occur in such complex entities like gliomas. Another major advantage is the available tumor segmentation. This quality-controlled segmentation that was performed as part of an international challenge and evaluated by independent experts eliminates mostly any kind of bias compared to manual (and local) tumor segmentation efforts, let alone the potential loss of concentration when delineating more than 500 datasets with multiple slices. Therefore, any bias of segmentation in the used dataset can be mostly discarded. Using the ASL data alone, as in this study, allows for an isolated view of this method whether it could bring future benefits in clinical routine or not. This was shown for some parameters (WHO grade, LGG vs. HGG, and tumor vs. edema analysis), while others could not be detected using this method. Thus, the knowledge gained from this study can be translated to clinical routine by being aware of which parameters are being able to be analyzed. Additionally, ASL can not only show the extent of the tumor via visual analysis, but its main use is perfusion analysis. Thus, such a physiological parameter can become interesting when it comes to tumor metabolism (i.e., cell proliferation) and the subsequent effect it has. Using this method for perfusion imaging could then be an aid for deciding whether chemotherapy can be utilized in highly perfused tumors or if there might not be a benefit due to central necrosis or low blood flow which could mean that the active substances cannot reach the tumor cells.
There are limitations to this study, mainly the potential loss (or skewing) of information due to the image processing, i.e., reshaping the ASL data to the FLAIR resolution, which potentially alters the obtained information. Furthermore, the data are not equally distributed. This includes, for example, a higher number of wildtype glioblastomas (374 out of 501) or 402 HGGs vs. 99 LGGs. Imaging of tumors is generally not a single-sequence, single-parameter method. In clinical routine, multiple sequences and their derivatives are being used for a holistic image of the tumor to aid in the diagnostic decision. Commonly clinically used are structural imaging including T1, T2, FLAIR, and T1 with contrast agents alongside DWI and potentially SWI. ASL is currently underutilized in clinical routine; therefore, our study aims to show more applications of this MRI method. It is clear that the results from this study cannot claim ASL to be a singular method to diagnose and classify gliomas, but they show the potential of this method in order to bring ASL closer to being part of a routine protocol, as it can differentiate between several tumor entities. In fact, ASL as a means of a clinical imaging method in brain tumors has already been suggested earlier [12,13,14,15,16,17,18,19,20]. Another issue that this study raises is that only the image features have been used rather than using CBF as the main predictor of disease; thus, a direct comparison of the findings with the literature cannot be performed. A comparative analysis potentially can reveal a complementary diagnostic benefit when combining CBF and image features. Future studies could include the other acquired (and pre-processed) contrasts to create a more comparative image of the tumor. This could include the histogram analysis of the DWI (as presented earlier [25]) and the SWI alongside ASL or including all the available contrasts. Furthermore, as this study incorporated only general and clinically easily accessible parameters, more in-depth analysis could also be possible by means of radiomics post-processing, obtaining more than 100 parameters that could be used for differential diagnosis. This, however, would go beyond the scope of this work, as it aimed to be an investigation of clinically available methods to showcase the potential uses of ASL in glioma imaging.

5. Conclusions

In conclusion, ASL is a viable tool in the diagnosis of glioma grade and potentially also for the differentiation of the WHO pathological diagnosis, while the method fails to allow for the differentiation between MGMT status and mutation type. Furthermore, the results of this study suggest that cerebral perfusion is globally reduced due to the increase in ICP, and the edema surrounding the tumor itself is not being underperfused as compared to the contralateral hemisphere.

Supplementary Materials

The following supporting information can be downloaded at: https://www.mdpi.com/article/10.3390/app131910581/s1, Figures S1–S5. Figure S1: Box plots showing all analyzed values for the pathological diagnosis. Figure S2: Box plots showing all analyzed values for the tumor grading. Figure S3: Box plots showing all analyzed values for the tumor vs. edema. Figure S4: Box plots showing all analyzed values for the MGMT status. Figure S5: Box plots showing all analyzed values for the mutations.

Author Contributions

Conceptualization, T.L. and J.F.; methodology, T.L.; software, T.L.; validation, T.L., L.H. and W.E.; formal analysis, T.L.; investigation, T.L.; resources T.L.; data curation, A.A.K.; writing—original draft preparation, T.L.; writing—review and editing, all authors; visualization, T.L.; supervision, L.D.; project administration, J.F.; funding acquisition, T.L. All authors have read and agreed to the published version of the manuscript.

Funding

This research was funded by the German Research Foundation (DFG), grant number LI-3030/4-1.

Institutional Review Board Statement

Not applicable.

Informed Consent Statement

Patient consent was waived due to the datasets used being in a public repository for download.

Data Availability Statement

The data used for this study can be downloaded at the cancer archive.

Conflicts of Interest

The authors declare no conflict of interest.

References

  1. Ostrom, Q.T.; Cioffi, G.; Gittleman, H.; Patil, N.; Waite, K.; Kruchko, C.; Barnholtz-Sloan, J.S. CBTRUS Statistical Report: Primary Brain and Other Central Nervous System Tumors Diagnosed in the United States in 2012–2016. Neuro-Oncolgy 2019, 21 (Suppl. S5), v1–v100. [Google Scholar] [CrossRef]
  2. Louis, D.N.; Perry, A.; Wesseling, P.; Brat, D.J.; Cree, I.A.; Figarella-Branger, D.; Hawkins, C.; Ng, H.K.; Pfister, S.M.; Reifenberger, G.; et al. The 2021 WHO Classification of Tumors of the Central Nervous System: A summary. Neuro-Oncology 2021, 23, 1231–1251. [Google Scholar] [CrossRef] [PubMed]
  3. Nehring, S.M.; Tadi, P.; Tenny, S. Cerebral Edema. In StatPearls [Internet]; StatPearls Publishing: Treasure Island, FL, USA, 2023. Available online: https://www.ncbi.nlm.nih.gov/books/NBK537272/ (accessed on 24 August 2023).
  4. Steen, R.G.; Petrella, J.R.; Provenzale, J.M. Edema and tumor perfusion: Characterization by quantitative 1H MR imaging. AJR Am. J. Roentgenol. 1992, 158, 259–264. [Google Scholar] [CrossRef]
  5. Nihashi, T.; Dahabreh, I.J.; Terasawa, T. Diagnostic Accuracy of PET for Recurrent Glioma Diagnosis: A Meta-Analysis. AJNR Am. J. Neuroradiol. 2013, 34, 944–950. [Google Scholar] [CrossRef]
  6. Cui, M.; Zorrilla-Veloz, R.I.; Hu, J.; Guan, B.; Ma, X. Diagnostic Accuracy of PET for Differentiating True Glioma Progression From Post Treatment-Related Changes: A Systematic Review and Meta-Analysis. Front. Neurol. 2021, 12, 671867. [Google Scholar] [CrossRef]
  7. de Zwart, P.L.; van Dijken, B.R.; Holtman, G.A.; Stormezand, G.N.; Dierckx, R.A.J.O.; van Laar, P.J.; van der Hoorn, A. Diagnostic Accuracy of PET Tracers for the Differentiation of Tumor Progression from Treatment-Related Changes in High-Grade Glioma: A Systematic Review and Metaanalysis. J. Nucl. Med. 2020, 61, 498–504. [Google Scholar] [CrossRef] [PubMed]
  8. Haydar, N.; Alyousef, K.; Alanan, U.; Issa, R.; Baddour, F.; Al-Shehabi, Z.; Al-Janabi, M.H. Role of Magnetic Resonance Imaging (MRI) in grading gliomas comparable with pathology: A cross-sectional study from Syria. Ann. Med. Surg. 2022, 82, 104679. [Google Scholar] [CrossRef] [PubMed]
  9. Yang, Y.; He, M.Z.; Li, T.; Yang, X. MRI combined with PET-CT of different tracers to improve the accuracy of glioma diagnosis: A systematic review and meta-analysis. Neurosurg. Rev. 2019, 42, 185–195. [Google Scholar] [CrossRef]
  10. Wei, R.-L.; Wei, X.-T. Advanced Diagnosis of Glioma by Using Emerging Magnetic Resonance Sequences. Front. Oncol. 2021, 11, 694498. [Google Scholar] [CrossRef]
  11. Alsop, D.C.; Detre, J.A.; Golay, X.; Günther, M.; Hendrikse, J.; Hernandez-Garcia, L.; Lu, H.; MacIntosh, B.; Parkes, L.M.; Smits, M.; et al. Recommended implementation of arterial spin-labeled perfusion MRI for clinical applications: A consensus of the ISMRM perfusion study group and the European consortium for ASL in dementia. Magn. Reson. Med. 2015, 73, 102–116. [Google Scholar] [CrossRef]
  12. Lindner, T.; Bolar, D.S.; Achten, E.; Barkhof, F.; Bastos-Leite, A.J.; Detre, J.A.; Golay, X.; Günther, M.; Wang, D.J.J.; Haller, S.; et al. Current state and guidance on arterial spin labeling perfusion MRI in clinical neuroimaging. Magn. Reson. Med. 2023, 89, 2024–2047. [Google Scholar] [CrossRef] [PubMed]
  13. Falk Delgado, A.; De Luca, F.; van Westen, D.; Falk Delgado, A. Arterial spin labeling MR imaging for differentiation between high- and low-grade glioma—A meta-analysis. Neuro-Oncology 2018, 20, 1450–1461. [Google Scholar] [CrossRef]
  14. Alsaedi, A.; Doniselli, F.; Jäger, H.R.; Panovska-Griffiths, J.; Rojas-Garcia, A.; Golay, X.; Bisdas, S. The value of arterial spin labelling in adults glioma grading: Systematic review and meta-analysis. Oncotarget 2019, 10, 1589–1601. [Google Scholar] [CrossRef] [PubMed]
  15. Flies, C.M.; Snijders, T.J.; Van Seeters, T.; Smits, M.; De Vos, F.Y.F.; Hendrikse, J.; Dankbaar, J.W. Perfusion imaging with arterial spin labeling (ASL)–MRI predicts malignant progression in low-grade (WHO grade II) gliomas. Neuroradiology 2021, 63, 2023–2033. [Google Scholar] [CrossRef] [PubMed]
  16. Liu, Y.; Chen, G.; Tang, H.; Hong, L.; Peng, W.; Zhang, X. Systematic review and meta-analysis of arterial spin-labeling imaging to distinguish between glioma recurrence and post-treatment radiation effect. Ann. Palliat. Med. 2021, 10, 12488–12497. [Google Scholar] [CrossRef]
  17. Luan, J.; Wu, M.; Wang, X.; Qiao, L.; Guo, G.; Zhang, C. The diagnostic value of quantitative analysis of ASL, DSC-MRI and DKI in the grading of cerebral gliomas: A meta-analysis. Radiat. Oncol. 2020, 15, 204. [Google Scholar] [CrossRef]
  18. Kang, X.-W.; Xi, Y.-B.; Liu, T.-T.; Wang, N.; Zhu, Y.-Q.; Wang, X.-R.; Guo, F. Grading of Glioma: Combined diagnostic value of amide proton transfer weighted, arterial spin labeling and diffusion weighted magnetic resonance imaging. BMC Med. Imaging 2020, 20, 50. [Google Scholar] [CrossRef]
  19. Kong, L.; Chen, H.; Yang, Y.; Chen, L. A meta-analysis of arterial spin labelling perfusion values for the prediction of glioma grade. Clin. Radiol. 2017, 72, 255–261. [Google Scholar] [CrossRef]
  20. Fu, M.; Han, F.; Feng, C.; Chen, T.; Feng, X. Based on arterial spin labeling helps to differentiate high-grade gliomas from brain solitary metastasis: A systematic review and meta-analysis. Medicine 2019, 98, e15580. [Google Scholar] [CrossRef]
  21. Calabrese, E.; Villanueva-Meyer, J.E.; Rudie, J.D.; Rauschecker, A.M.; Baid, U.; Bakas, S.; Cha, S.; Mongan, J.T.; Hess, C.P. The University of California San Francisco Preoperative Diffuse Glioma MRI Dataset. Radiol. Artif. Intell. 2022, 4, e220058. [Google Scholar] [CrossRef]
  22. Baid, U.; Ghodasara, S.; Mohan, S.; Bilello, M.; Calabrese, E.; Colak, E.; Farahani, K.; Kalpathy-Cramer, J.; Kitamura, F.C.; Pati, S.; et al. The rsna-asnr-miccai brats 2021 benchmark on brain tumor segmentation and radiogenomic classification. arXiv 2021, arXiv:2107.02314. [Google Scholar]
  23. Wang, N.; Xie, S.-Y.; Liu, H.-M.; Chen, G.-Q.; Zhang, W.-D. Arterial Spin Labeling for Glioma Grade Discrimination: Correlations with IDH1 Genotype and 1p/19q Status. Transl. Oncol. 2019, 12, 749–756. [Google Scholar] [CrossRef] [PubMed]
  24. Lavrova, A.; Teunissen, W.H.T.; Warnert, E.A.H.; van den Bent, M.; Smits, M. Diagnostic Accuracy of Arterial Spin Labeling in Comparison With Dynamic Susceptibility Contrast-Enhanced Perfusion for Brain Tumor Surveillance at 3T MRI. Front. Oncol. 2022, 12, 849657. [Google Scholar] [CrossRef]
  25. Gihr, G.; Horvath-Rizea, D.; Kohlhof-Meinecke, P.; Ganslandt, O.; Henkes, H.; Härtig, W.; Donitza, A.; Skalej, M.; Schob, S. Diffusion Weighted Imaging in Gliomas: A Histogram-Based Approach for Tumor Characterization. Cancers 2022, 14, 3393. [Google Scholar] [CrossRef] [PubMed]
  26. Han, L.; Kamdar, M.R. MRI to MGMT: Predicting methylation status in glioblastoma patients using convolutional recurrent neural networks. In Proceedings of the 2018 Pacific Symposium on Biocomputing, Fairmont Orchid, HI, USA, 3–7 January 2018; Volume 23, pp. 331–342. [Google Scholar] [CrossRef]
  27. Sakai, Y.; Yang, C.; Kihira, S.; Tsankova, N.; Khan, F.; Hormigo, A.; Lai, A.; Cloughesy, T.; Nael, K. MRI Radiomic Features to Predict IDH1 Mutation Status in Gliomas: A Machine Learning Approach using Gradient Tree Boosting. Int. J. Mol. Sci. 2020, 21, 8004. [Google Scholar] [CrossRef] [PubMed]
  28. Halshtok Neiman, O.; Sadetzki, S.; Chetrit, A.; Raskin, S.; Yaniv, G.; Hoffmann, C. Perfusion-weighted imaging of peritumoral edema can aid in the differential diagnosis of glioblastoma mulltiforme versus brain metastasis. Isr. Med. Assoc. J. 2013, 15, 103–105. [Google Scholar]
  29. Carrete, L.R.; Young, J.S.; Cha, S. Advanced Imaging Techniques for Newly Diagnosed and Recurrent Gliomas. Front. Neurosci. 2022, 16, 787755. [Google Scholar] [CrossRef]
  30. van Santwijk, L.; Kouwenberg, V.; Meijer, F.; Smits, M.; Henssen, D. A systematic review and meta-analysis on the differentiation of glioma grade and mutational status by use of perfusion-based magnetic resonance imaging. Insights Imaging 2022, 13, 102. [Google Scholar] [CrossRef]
  31. Willats, L.; Calamante, F. The 39 steps: Evading error and deciphering the secrets for accurate dynamic susceptibility contrast MRI. NMR Biomed. 2013, 26, 913–931. [Google Scholar] [CrossRef]
  32. Pogosbekian, E.L.; Pronin, I.N.; Zakharova, N.E.; Batalov, A.I.; Turkin, A.M.; Konakova, T.A.; Maximov, I.I. Feasibility of generalised diffusion kurtosis imaging approach for brain glioma grading. Neuroradiology 2021, 63, 1241–1251. [Google Scholar] [CrossRef]
Figure 1. Original ASL image of the tumor (left) with the segmentations as overlay. The segmented tumor volume is shown in orange, the peritumoral edema in blue, and the contralateral (mirrored) area in green.
Applsci 13 10581 g001
Figure 2. Box plots showing the statistically significant differences in the tumor diagnosis.
Applsci 13 10581 g002
Figure 3. Box plots showing the statistically significant differences of LGG vs. HGG.
Applsci 13 10581 g003
Figure 4. Box plots showing the statistically significant differences of the tumor volume vs. the ipsi- and contralateral edema.
Applsci 13 10581 g004
Table 1. Number of analyzed patients per parameter. Discarded patients are indicated with *. Note: For the tumor/edema differentiation, all patients were analyzed.
Pathological DiagnosisMutation
DiagnosisNo. of PatientsMutationNo. of Patients
Astrocytoma wildtype24IDH-170
Astrocytoma IDH mutation90IDH-2 *2
Wildtype glioblastoma374NOS31
Oligodendroglioma13Wildtype398
MGMT StatusLGG vs. HGG
MGMTNo. of PatientsGradeNo. of Patients
Positive302LGG99
Negative114
Indeterminate *6HGG402
Not specified *80
Table 2. p-values of all analyzed metrics. Statistically significant measures are bold. * indicates the Kruskal–Wallis test and the Mann–Whitney test.
Pathological Diagnosis *LGG vs. HGG MGMT Status
Metricp-ValueMetricp-ValueMetricp-Value
Entropy0.0364Entropy0.0072Entropy0.8595
Mean0.0028Mean0.0001Mean0.9388
Std. Dev.0.0045Std. Dev.0.0001Std. Dev.0.9271
Skewness0.1204Skewness0.0144Skewness0.9278
Kurtosis0.121Kurtosis0.0146Kurtosis0.9278
Min0.0073Min0.0001Min0.0278
Max0.0021Max0.0016Max0.7937
Mutation *Tumor vs. Edema *Ipsi- vs. Contralateral Edema
Metricp-valueMetricp-valueMetricp-value
Entropy0.1409Entropy0.0001Entropy0.4866
Mean0.1396Mean0.0001Mean0.9823
Std. Dev.0.0985Std. Dev.0.0001Std. Dev.0.7005
Skewness0.3051Skewness0.0001Skewness0.279
Kurtosis0.305Kurtosis0.0001Kurtosis0.2701
Min0.0048Min0.0001Min0.0001
Max0.0354Max0.0001Max0.0767
Disclaimer/Publisher’s Note: The statements, opinions and data contained in all publications are solely those of the individual author(s) and contributor(s) and not of MDPI and/or the editor(s). MDPI and/or the editor(s) disclaim responsibility for any injury to people or property resulting from any ideas, methods, instructions or products referred to in the content.