Article

Evaluating Variability in Reflective Photoelasticity: Focus on Adhesives, Light Sources, and Camera Setup

Department of Civil Engineering, Kyung Hee University, Yongin 17104, Republic of Korea
*
Authors to whom correspondence should be addressed.
Appl. Sci. 2023, 13(19), 10628; https://doi.org/10.3390/app131910628
Submission received: 15 July 2023 / Revised: 20 September 2023 / Accepted: 21 September 2023 / Published: 24 September 2023

Abstract

:

Featured Application

This research has pivotal applications in geotechnical and civil engineering fields, particularly for improving the reliability and precision of stress and strain analysis in granular materials, which can lead to more accurate predictions of soil behavior and further optimize the design and safety of the infrastructure.

Abstract

This study investigates the impact of various experimental parameters on the reflective photoelastic coating technique used to measure the stress and strain in model soil particles. The focus is directed towards three pivotal parameters: the choice of adhesive for the photoelastic coating, the inherent properties of the light source, and the configuration of the camera for color image analysis. Through a series of uniaxial compression tests on consistently crafted model soil particles, a notable relationship emerges between the adhesive’s shear strength, its viscosity, and the uniformity of the photoelastic response. While the light source’s characteristics and camera adjustments hold significance, their influence on the consistency of the response is comparatively subtle. Consequently, the adhesive’s role is underscored as instrumental in influencing the photoelastic response, offering valuable insights for subsequent research endeavors utilizing the reflective photoelastic technique.

1. Introduction

Photoelastic measurement is a method used to measure the level of stress and strain within a material [1]. This technique leverages the property of birefringence, using transparent substances to visually examine stress and strain. Given its advantage of offering comprehensive visual accessibility, the photoelastic method has gained increased recognition. Initially, it was employed for stress analysis in infrastructures such as dams and bridges. Brahtz [2] compared theoretical results with the photoelastic phenomenon for plane stress and plane strain problems and applied it to experiments on the Morris Dam. Durelli et al. [3] analyzed the bending of beams using photoelasticity under various loading conditions. Burki and Richards [4] determined the elastic stresses acting inside the soil mass of a cofferdam using the photoelastic technique. While experiments using photoelasticity were primarily focused on the analysis of structures, over time, its application has been expanded to granular materials, including geotechnical engineering lab experiments to study soil behavior and aid in the development of mechanical models. In 1957, Dantu [5] and Wakabayashi [6] demonstrated that photoelasticity could be used to visualize the transmission of force in a packed particle assembly. Later, Drescher and De Jong [7] simulated granular material as a two-dimensional assembly of disks and utilized photoelastic techniques to determine the magnitude and direction of contact forces between the disks. Dyer [8] and Allersma [9] proposed applications using photoelasticity to address large displacement problems such as shear box, cone penetration, and reinforcement pullout. The subsequent research actively utilizes photoelasticity to understand the formation and impact of the force-chain network in granular materials [10,11,12], as well as explore the effects of the shearing rate [13] and packing density on slip behavior [14], and jamming in granular materials [15]. Recently, studies have been carried out on diverse subjects, such as the fabrication of particle models of various shapes using 3D printing [16], the impact of stress relaxation from temporary halts in pile penetration processes [17], and the visualization of the soil arching effect [18].
Nonetheless, most of these studies utilize transparent glass or polymer-based substances. While the transparent photoelastic approach offers high-quality fringe visibility and contrast, it also imposes a certain restriction as the material chosen for the model grains must be transparent. This leads to an issue where the mechanical properties of these model grains, made from transparent material, differ from those of mineral grains which occupy most soil particle types. In this regard, the reflective photoelastic coating technique emerges as a practical alternative for constructing the model grains.
Mesnager [19] was the pioneer in studying the concept of photoelastic coating. Following that, Zandman and others [20] delved into the reinforcement issues related to photoelastic coating, proposing correction factors to interpret the fringe patterns for practical engineering purposes. Ramesh [21] explored various facets of the reflective technique, including the optical setup of a reflection polariscope, the relationship between stress and strain-optics for a photoelastic coating, and the correction factors required for applying the reflection photoelastic method. Importantly, Ramesh discovered that the type of adhesive used to affix the photoelastic material to the sample greatly affected the photoelastic response. The light source’s wavelength band and the measurement camera’s setup were also identified as significant factors. More recently, thanks to the advancement of digital photoelasticity, researchers have been actively working on observing and analyzing RGB color information using polychromatic light, replacing monochromatic light, in order to compute the fringe order [22,23,24,25,26,27].
Park and her colleagues [28,29,30] recently conducted research into the contact force network within granular particles, primarily using RGB color data obtained from the reflective photoelastic coating method. Their findings showed how the contact force network changed during loading, but their study had limitations in providing an exact quantitative measurement of the contact force for each particle. This limitation was largely due to not thoroughly investigating the accuracy and precision fluctuations in their reflective photoelastic coating measurements.
Photoelastic experiments targeting granular media typically utilize multiple particle models. It is a fundamental assumption that individual model particles exhibit the same photoelastic response under identical load conditions. Unlike studies using transparent photoelastic materials directly cut into disk shapes, particle models applying the reflective photoelastic coating technique can display varying photoelastic responses under the same load conditions, depending on the fabrication environment. Therefore, identifying factors influencing the consistency of the photoelastic response and ensuring experiments are conducted under optimal conditions are crucial for obtaining accurate results when interpreting the photoelastic response.
This paper examines the effects of different factors on the variations in contact force measurement when employing the reflective photoelastic coating technique to construct the model soil particles. We evaluated three variables: the kind of adhesive used to attach the reflective photoelastic coating material to the model particles, the properties of the light source, and the methodology employed in setting up the digital camera for color image analysis. Uniaxial compression tests were performed on model soil particles fabricated under the same conditions to measure the influence of these three factors, and the results were subsequently scrutinized. From the statistical analysis of the findings, the paper suggests the best experimental conditions for conducting studies on the model soil particles using the reflective photoelastic method.

2. Materials and Method

2.1. Theoretical Background

Photoelasticity describes the changes in the optical properties of a material under mechanical deformation, and this experimental method can be used to analyze the stress and strain field. A photoelastic material has isotropic properties in normal conditions but exhibits anisotropy when an external force is applied. Birefringence can be observed when light is transmitted after applying an external force to the photoelastic material. Birefringence is a phenomenon in which a single light wave with the same wavelength is split into two light waves and refracted when incident on an optically anisotropic material. At this time, if the travel speeds of the two refracted light waves are v 1 and v 2 , respectively, and the thickness of the photoelastic material is h , the time difference between the two refracted light waves is called relative retardation, δ, which can be expressed as follows [21]:
δ = 2 π f h v 1 h v 2 = 2 π h c λ 1 v 1 1 v 2 = 2 π h λ n 1 n 2
where f = the frequency of the incident light; h = the thickness of the photoelastic material; c = the velocity of the light; λ = the wavelength of the incident light; and n 1 and n 2 = the refractive indices of two light waves. Maxwell [31] defined the relationship between refractive index and stress as follows:
n 1 n 2 = C σ 1 σ 2
where σ 1 is the maximum principal stress; σ 2 is the minimum principal stress; and C is the relative stress-optic coefficient. Substituting Equation (2) into Equation (1), Equation (3) can be obtained as follows:
δ = 2 π h λ C σ 1 σ 2
There are two main types of photoelastic techniques: transparent and reflective. For both methods, light from the light source passes through a plane polarizer, a quarter wave plate, and a photoelastic material. Here, the planar polarizer is composed of a polarizer that linearly polarizes the incident light and an analyzer that is used to observe the light passing through the photoelastic material. The quarter wave plate causes circular polarization by giving a phase difference of λ /4 with respect to the linearly polarized light passing through the planar polarizing plate. To observe the birefringence phenomenon, the optimal method is to use circularly polarized light in which the azimuth is symmetrical.
Figure 1 shows the difference between the transparent and reflective techniques. In the transparent technique shown in Figure 1a, the light of the light source passes through the polarizer-1/4 wave plate-photoelastic material-1/4 wave plate-analyzer in the order that it is observed. However, in the reflective technique shown in Figure 1b, the light of the light source observes the light passing through the polarizer-1/4 wave plate-photoelastic material-reflector-photoelastic material-1/4 wave plate-analyzer in the order of the photoelastic material and is passed through twice. For this reason, the relative delay in the reflective technique is calculated by setting h to 2 h in Equation (3) above. In the reflective method, because the light source and the observer are located in the same direction facing the specimen, structure analysis can be performed more easily compared to the transparent method. In this study, a sheet with a reflective coating on the back of a transparent photoelastic material was used to utilize the reflective technique.
The light intensity of the light passing through the polarizer, a quarter wave plate, and the analyzer was calculated by Equation (4) shown below [21]:
I = I a s i n 2 δ 2
where I a is the brightness of the incident light.
When a photoelastic material not subjected to an external force is observed using monochromatic light as the incident light under dark field conditions, the brightness of the light is measured as 0 in black. When an external force is applied to the photoelastic material, the brightness of the light changes, and the pattern of lightening and darkening is repeated according to the sine function. The arrangement of the black bands that appears at this time is called a fringe, and the number of fringes is defined as the fringe order.
In Equation (4) above, in order for the brightness of light, I , to become 0, the relative delay, δ , must be an even multiple of the half-wavelength.
This can be expressed as follows [21]:
I = 0 ; δ = 2 N π N = 0 , 1 , 2
When the brightness of light, I , becomes 0, it means that a fringe appears, and the integer N in Equation (5) above represents the order of the fringe.
σ 1 σ 2 = N λ h C
Hence, through the photoelasticity experiment, the intensity of the force exerted on the photoelastic material can be determined by tracking the fringe order, as expressed by Equation (6) above. If polychromatic light replaces monochromatic light, the fringe is manifested in a spectrum of colors rather than black. In this situation, the fringe order is represented by the number of bands sharing the same color.
Based on photoelastic theory, the combination of bright and dark field setups is distinguished by whether the orientation of the plane polarizer and the quarter wave plate are perpendicular or parallel to one another [16]. In the present study, a dark field arrangement was chosen as the light traversed the plane polarizer, with the quarter wave plate installed in the corresponding direction.
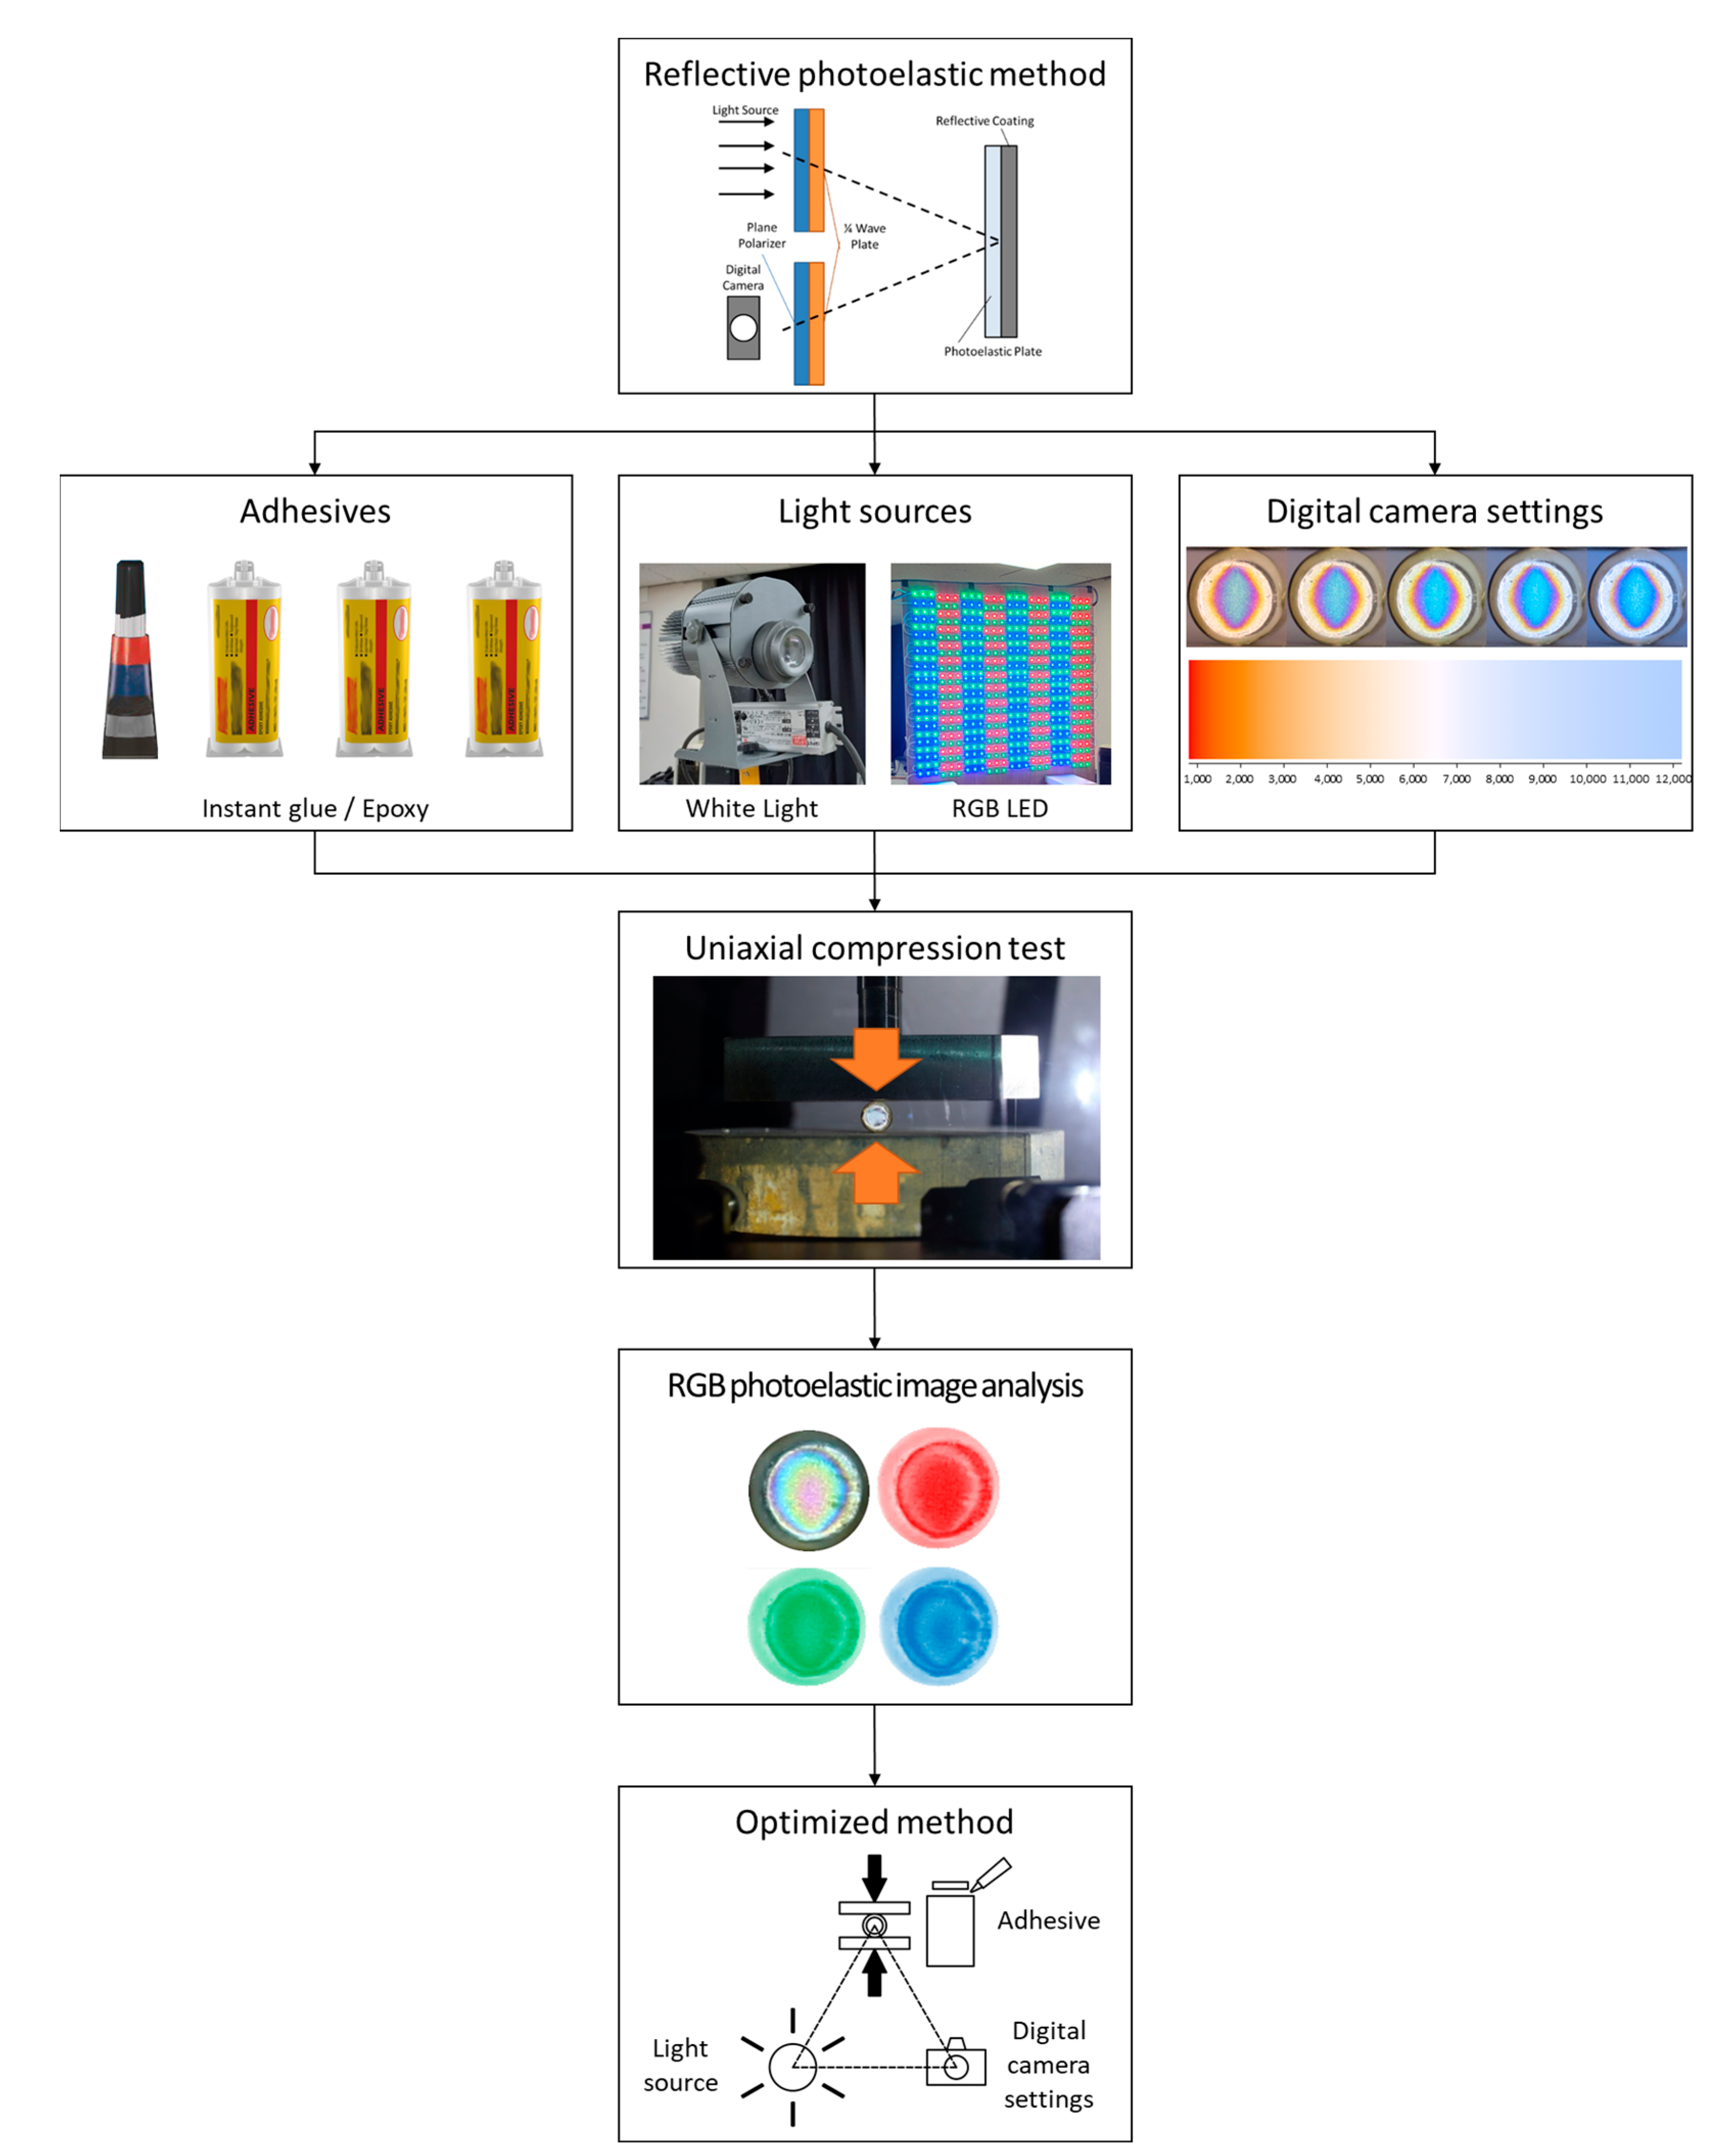
Figure 2 presents the flow chart illustrating the experimental process of the current study. Uniaxial compression tests were conducted on model particles under various testing conditions, taking three factors into consideration: the kind of adhesive, the light source, and the employment of the white balance function.

2.2. Adhesives

In the preparation of a model soil particle, an adhesive was employed to affix the photoelastic coating sheet to the front surface of the model particle. The bonding condition is influenced by the mechanical characteristics of the adhesive. The peak shear strength of the adhesive can vary based on the base material to be bonded and the condition of the surface. To explore their effectiveness and the disparity in the photoelastic response, four different adhesives were used. Table 1 provides a summary of the physical and chemical properties of the four adhesives, including tensile strength, tensile elongation, shear strength, specific gravity, and viscosity, provided by the manufacturer.

2.3. Light Sources and White Balance Function

Because the photoelastic technique uses light, the response may vary depending on the optical characteristics of the light such as the wavelength band of the light source, color temperature, and color reproducibility. As seen from Equation (6), the wavelength of the incident light has a direct linear relationship with the principal stress difference appearing in the photoelastic material. In addition, depending on the setting of the digital camera when observing the photoelastic response, the acquired image data may be affected.
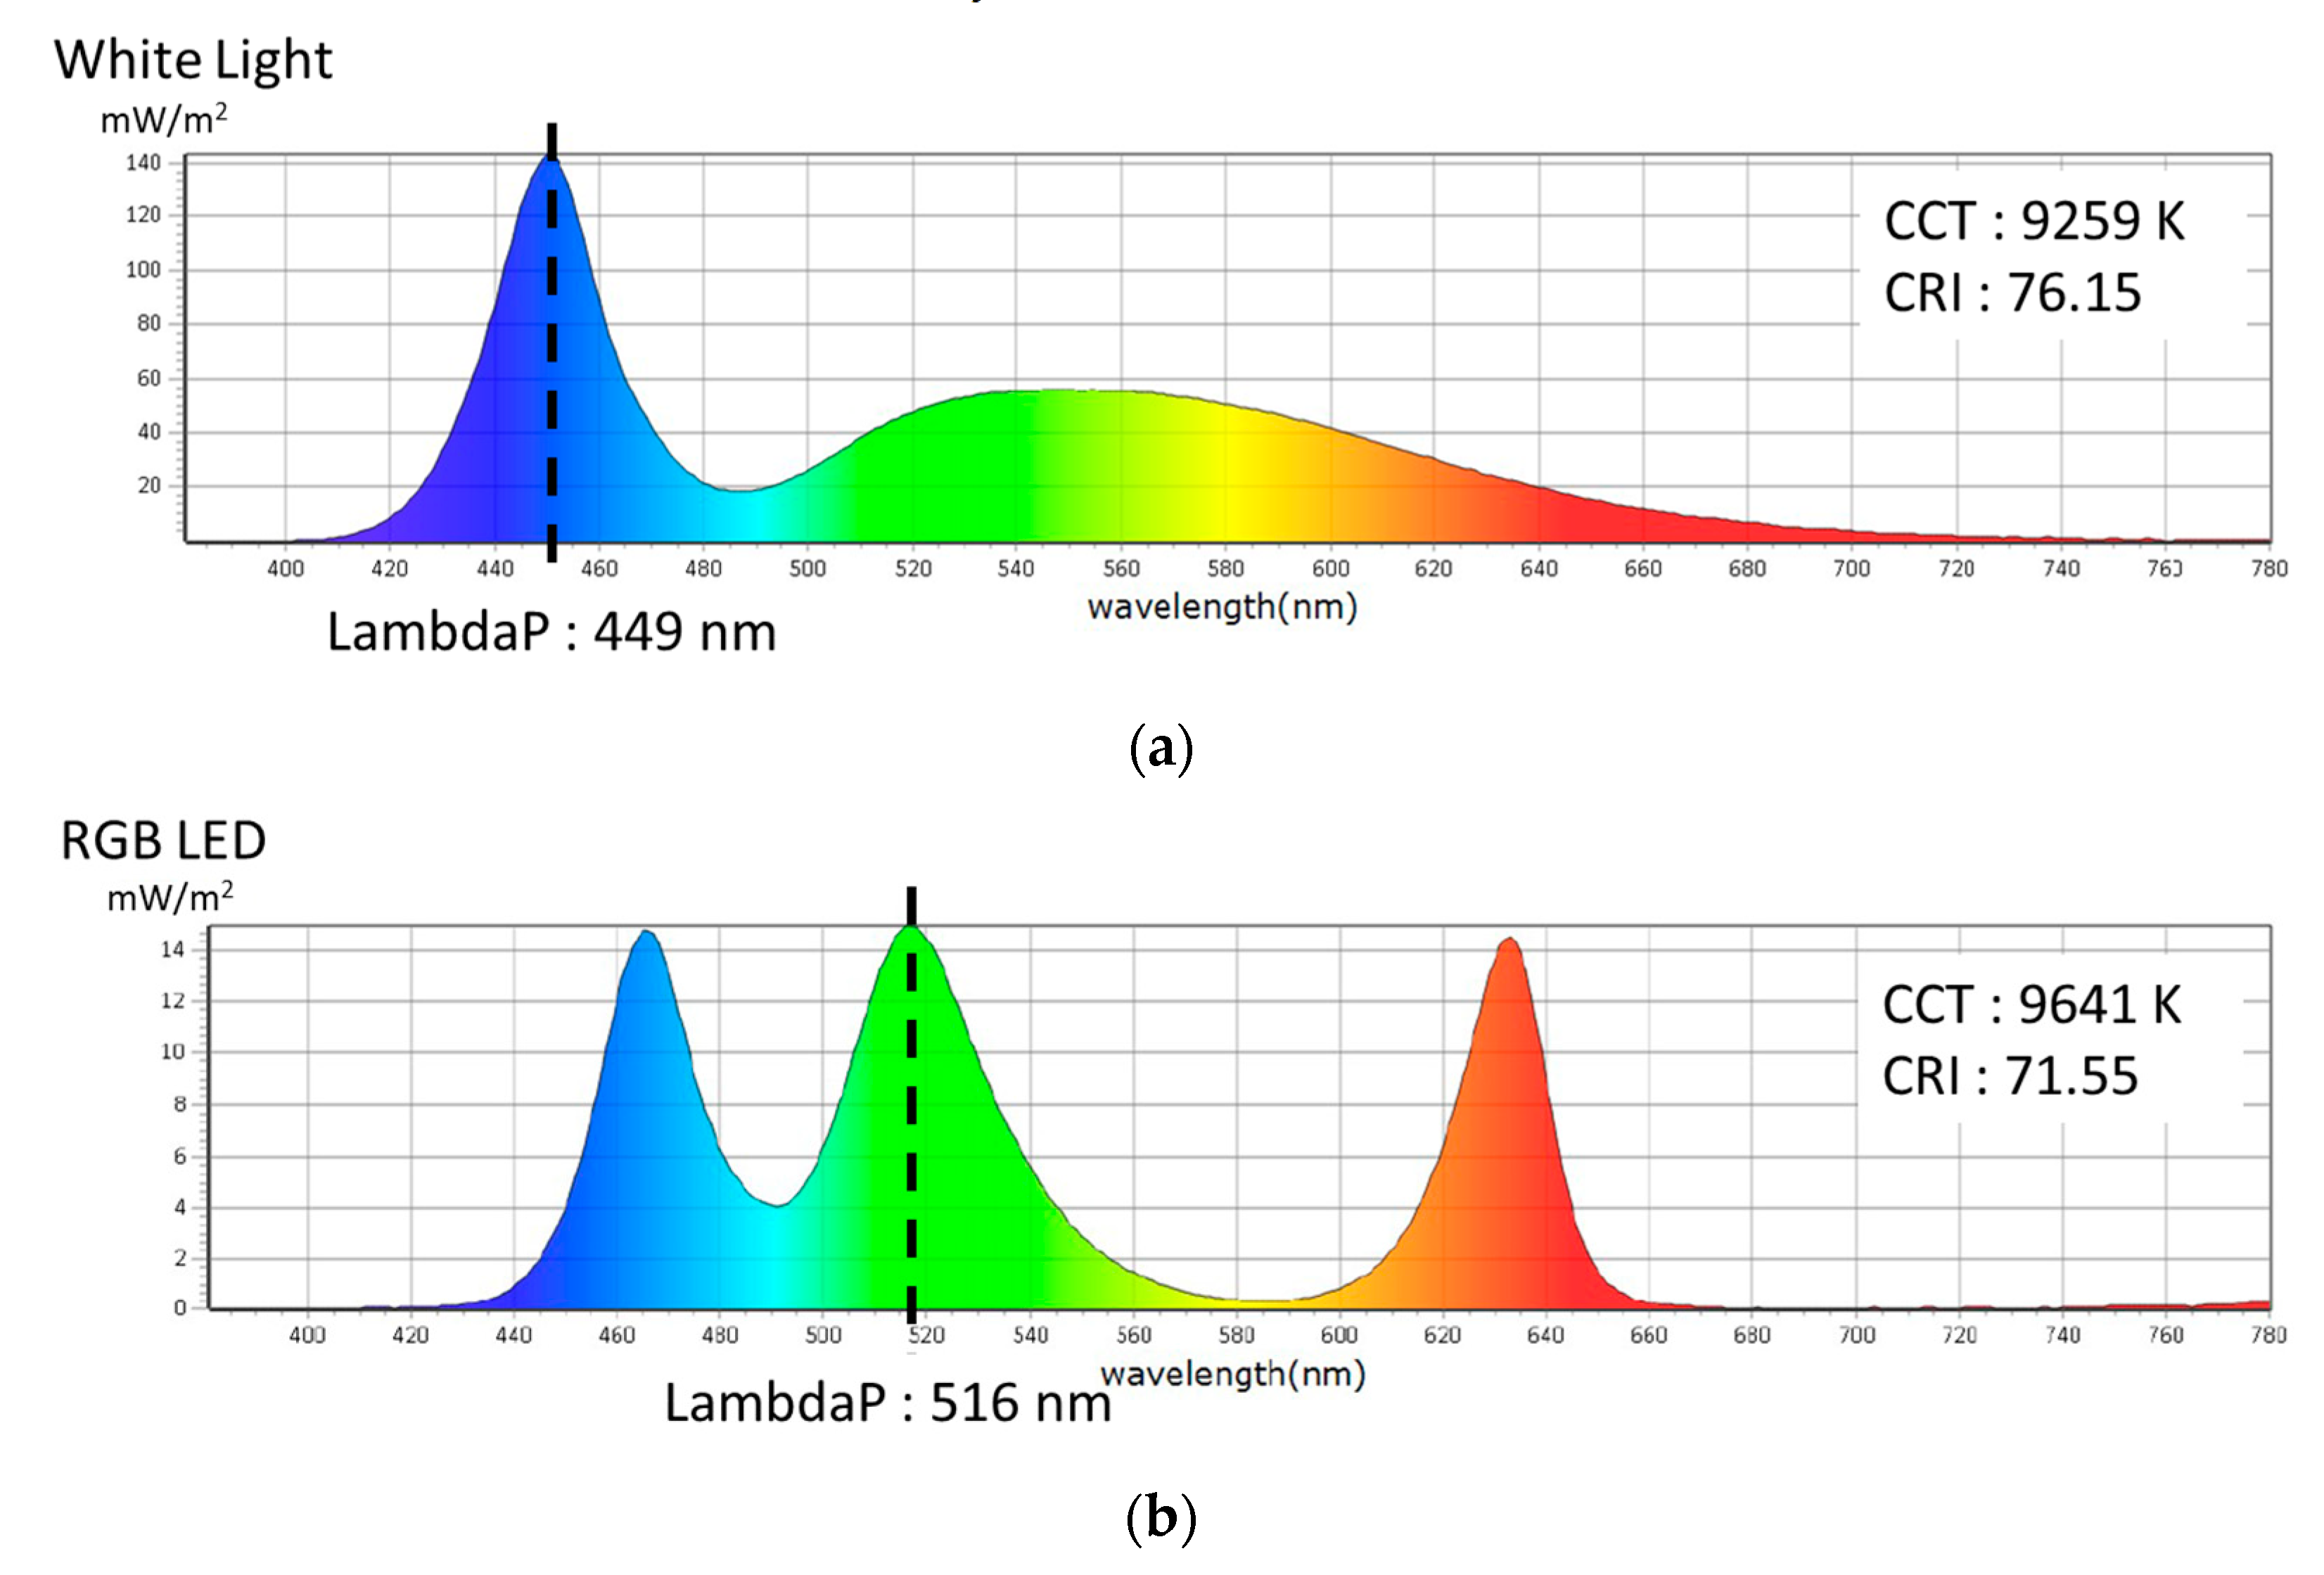
In the experiment, we employed two types of light sources: a specially-designed RGB LED light source, featuring red, green, and blue LED panels arranged in a Bayer pattern, and a commercially available standard white light source. The maximum luminous intensity of the white light source was about 140 mW/m2, the wavelength at the time of testing, P, was 449 nm, and the color temperature was 9259 K. However, the maximum luminous intensity of the RGB LED was about 15 mW/m2, the wavelength at the time of testing, P, was 516 nm, and the color temperature was 9641 K. Although the peak wavelength of the RGB LED appeared in the green band, the measured luminous intensity in the blue (460 to 470 nm) and red (630 to 640 nm) wavelength bands was also manufactured to be about 15 mW/m2. Figure 3 compares the spectral power distributions of two different light sources analyzed by the MK350S spectrometer manufactured by UPRtek (Miaoli County, Taiwan).
The sensitivity of the digital camera was set to ISO 100; the aperture value was set to F5.6, and the shutter speed was set to 0.1 s. The color of light appears different depending on the temperature. Even for the same observation object, if the color temperature of the light source is low, the target object appears red, and in contrast, if the color temperature of the light source is high, the object appears blue.
The white balance is a function that adjusts the balance of the three colors of the image according to the color temperature of the light source to be close to the actual color. The digital camera used in the experiment provides an automatic white balance function, and it is also possible to correct the image by manually setting the color temperature value. In this study, the automatic white balance function was compared with no color correction. After acquiring the images using an EOS 650D (Canon, Tokyo, Japan) camera and an EF-S 18–55 mm/3.5–5.6 IS II lens, the responses were analyzed. The resolution of the digital image was 350 DPI (dots per inch), which was set high enough to precisely observe the photoelastic response.

2.4. Photoelastic Coating Sheet

A photoelastic coating sheet manufactured by Vishay (Malvern, PA, USA) was used. Given the required sensitivity to reactions and simplicity in cutting, we selected a sheet with a thickness of 1 mm. Table 2 summarizes the specifications of the selected photoelastic sheet.
The soil particle model was developed based on the research conducted by Byeon [32], Jung [33], Shin [34,35], and Park [28,29,30]. To conduct experiments under plane stress conditions, it was designed in the shape of a cylinder. The model particle used in this study was produced using brass as the primary material, in compliance with the KS D5101 standard [36]. Young’s elastic modulus and Poisson’s ratio of the brass were 100 GPa and 0.34, respectively. Figure 4 shows that the material was specially designed in a short hollow cylindrical shape with a 10-mm diameter and 15-mm height to amplify the deformation. As illustrated in Figure 4, the coating sheet was cut into an 8-mm diameter circle and then securely attached to one end of the cylinder using the adhesive selected for the experiment. For each test condition, a batch of ten identical specimens was produced, adhering to the same fabrication process described above.

2.5. Uniaxial Compression Test

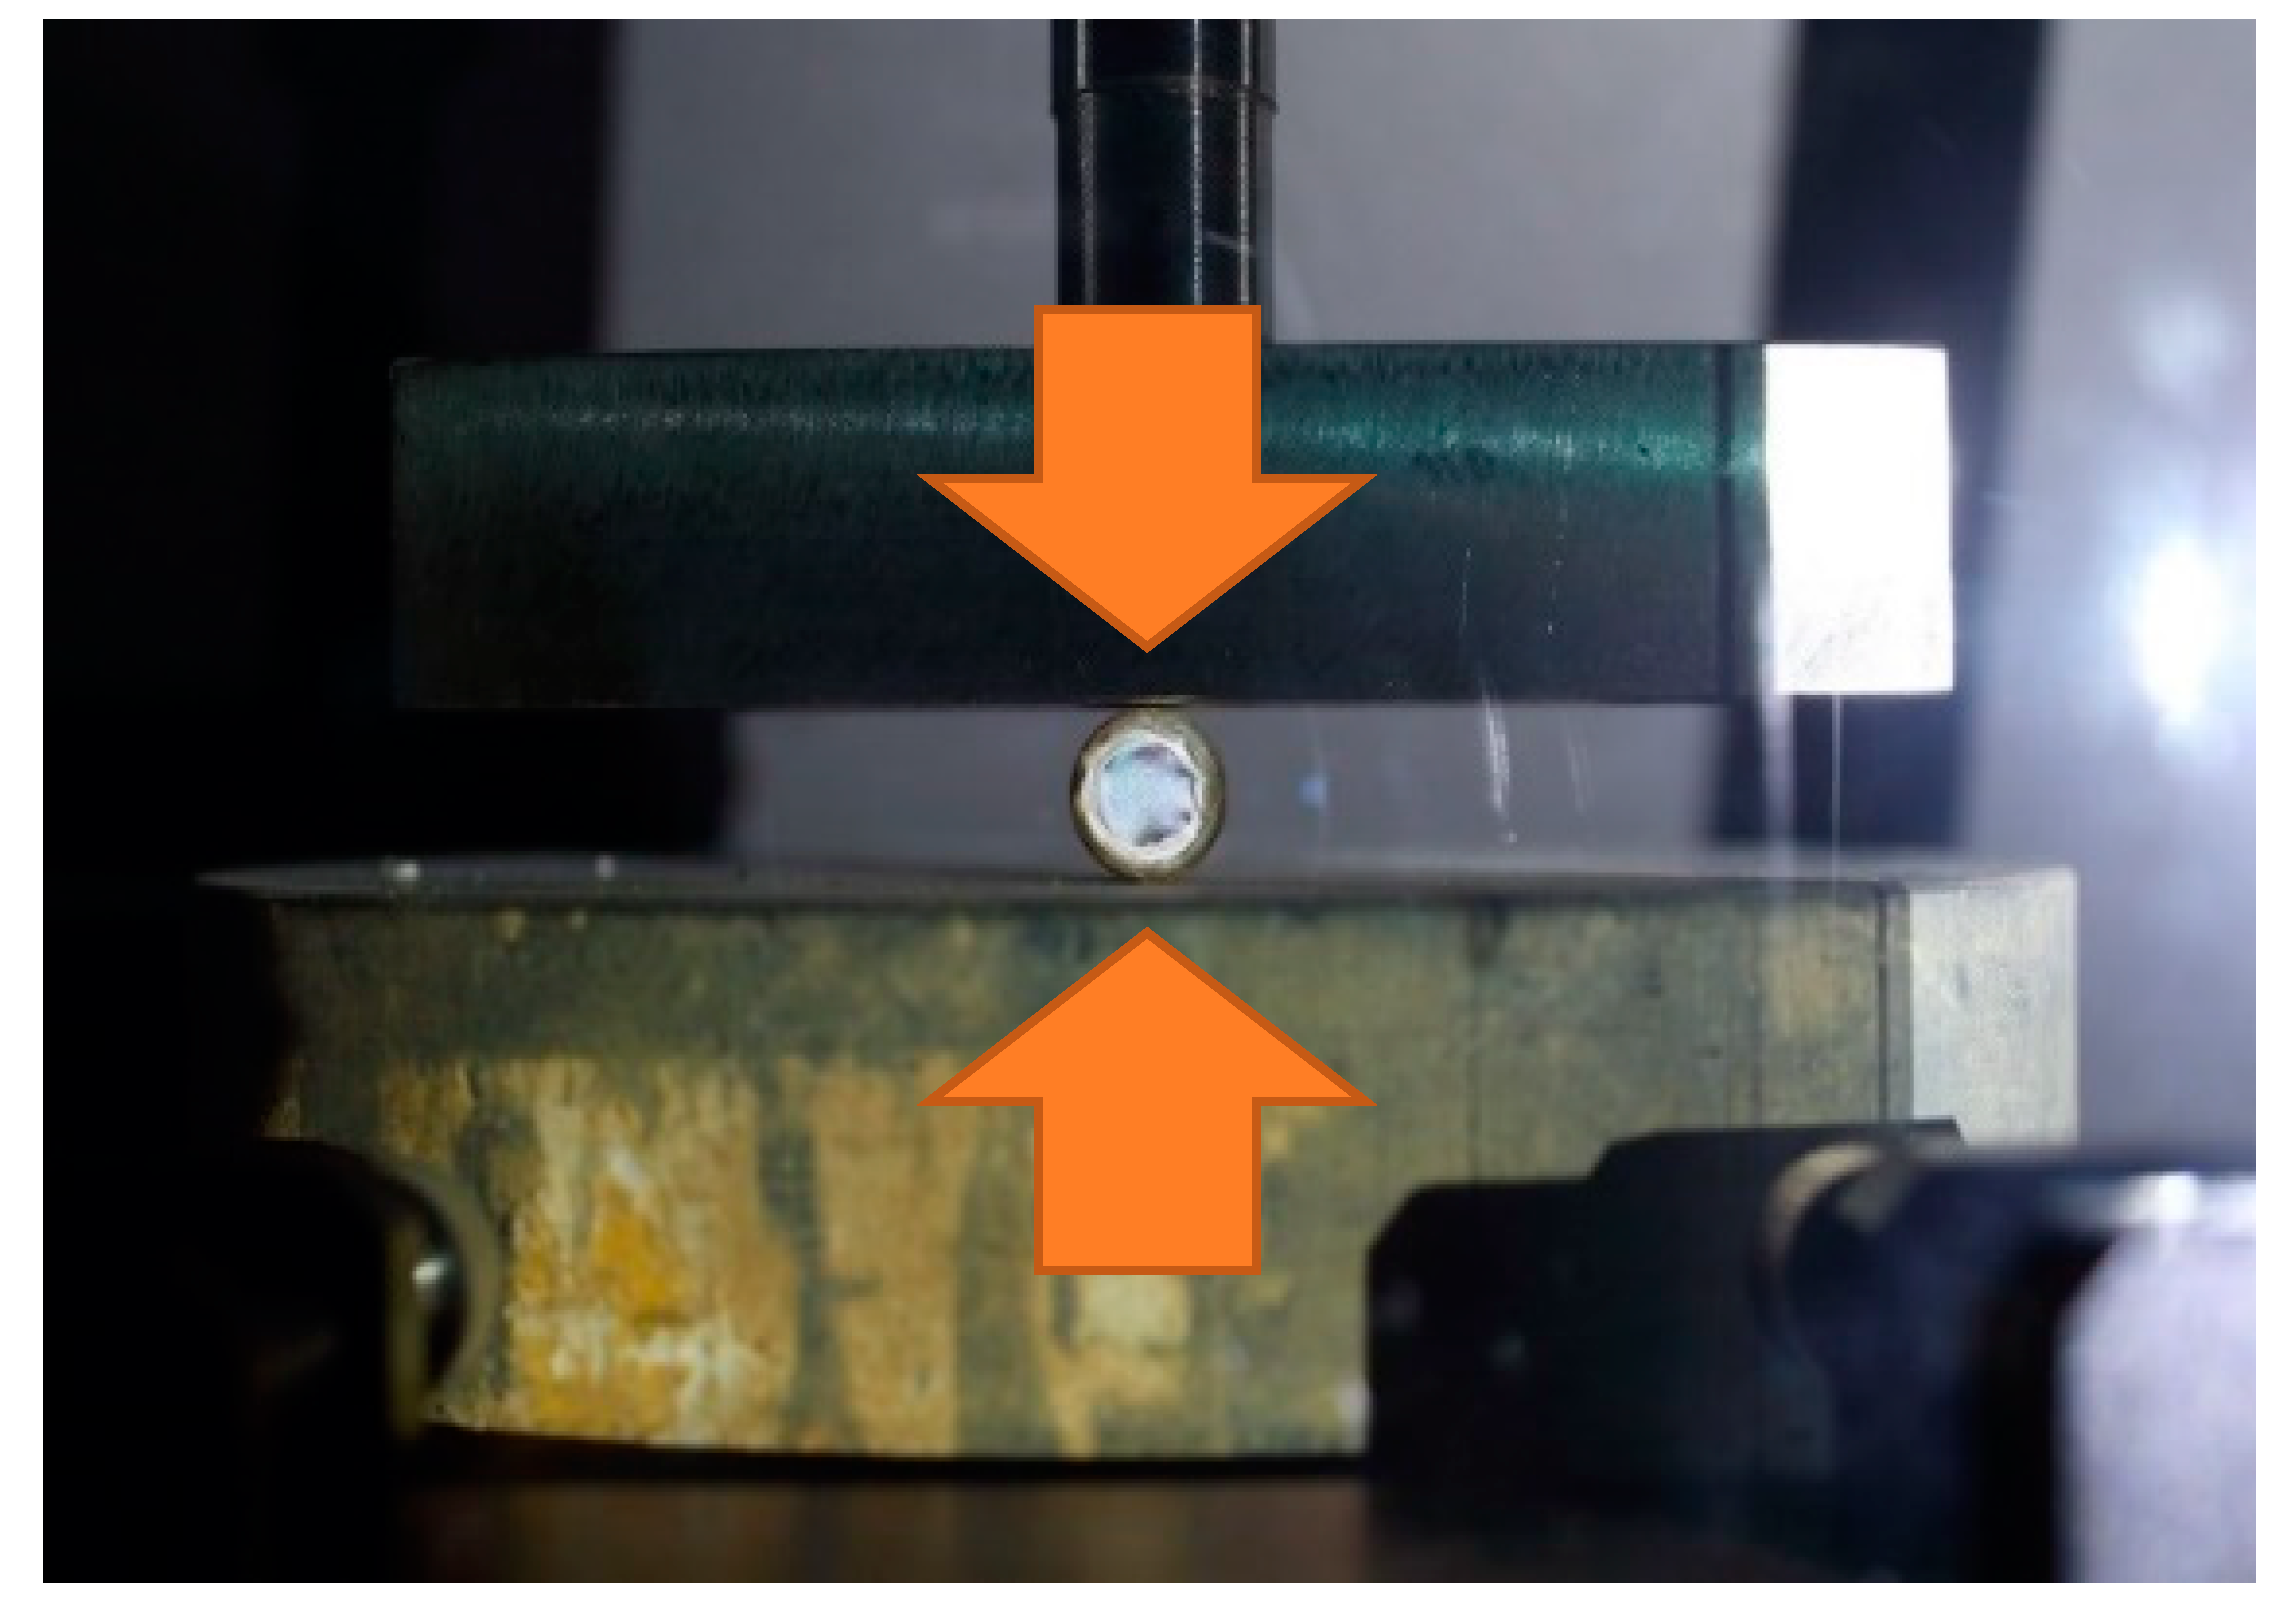
A uniaxial compression test was performed on a single particle. One cylindrical particle was placed between two plates, followed by the application of the load. Figure 5 shows how the uniaxial compression test was conducted. The test assumed the contact points between the model soil particle and the loading pad were the top and bottom of the particle. The test particle was gradually compressed at a steady displacement speed, and the reaction force was recorded by the load cell during the application of the load.
Table 3 provides a summary of the conditions under which the eight uniaxial compression tests were conducted. In cases 1 through 4, different adhesives were used in the production of the model particles. Cases 5 through 8 differed based on the type of light source input and the usage of the auto white balance function. In Cases 1 through 4, the load applied amounted to 200 N, while in Cases 5 through 8, it increased to 500 N. During the loading process, the digital images were taken for each 50 N increment in the loading phase. To account for the uncertainty in the manufacturing process, ten model particles were used in repeat testing under the given condition. The displacement in the loading direction was recorded using a linear variable displacement transducer (LVDT).

2.6. RGB Photoelastic Image Analysis

Each photoelastic image was used to gather information about the red, green, and blue color components. The additive RGB color model merges these three primary colors in various combinations to produce a vast spectrum of colors. In this model, every light source (red, green, and blue) is represented by an intensity ranging between 0 and 255. For instance, “RGB (255, 0, 0)” appears red since red has the maximum value, while green and blue are set to 0. Conversely, “RGB (0, 255, 0)” shows up as green because green has the top value, while red and blue are at 0. There can be as many as 16,777,216 (equal to 255 × 255 × 255) unique colors resulting from various RGB code combinations.
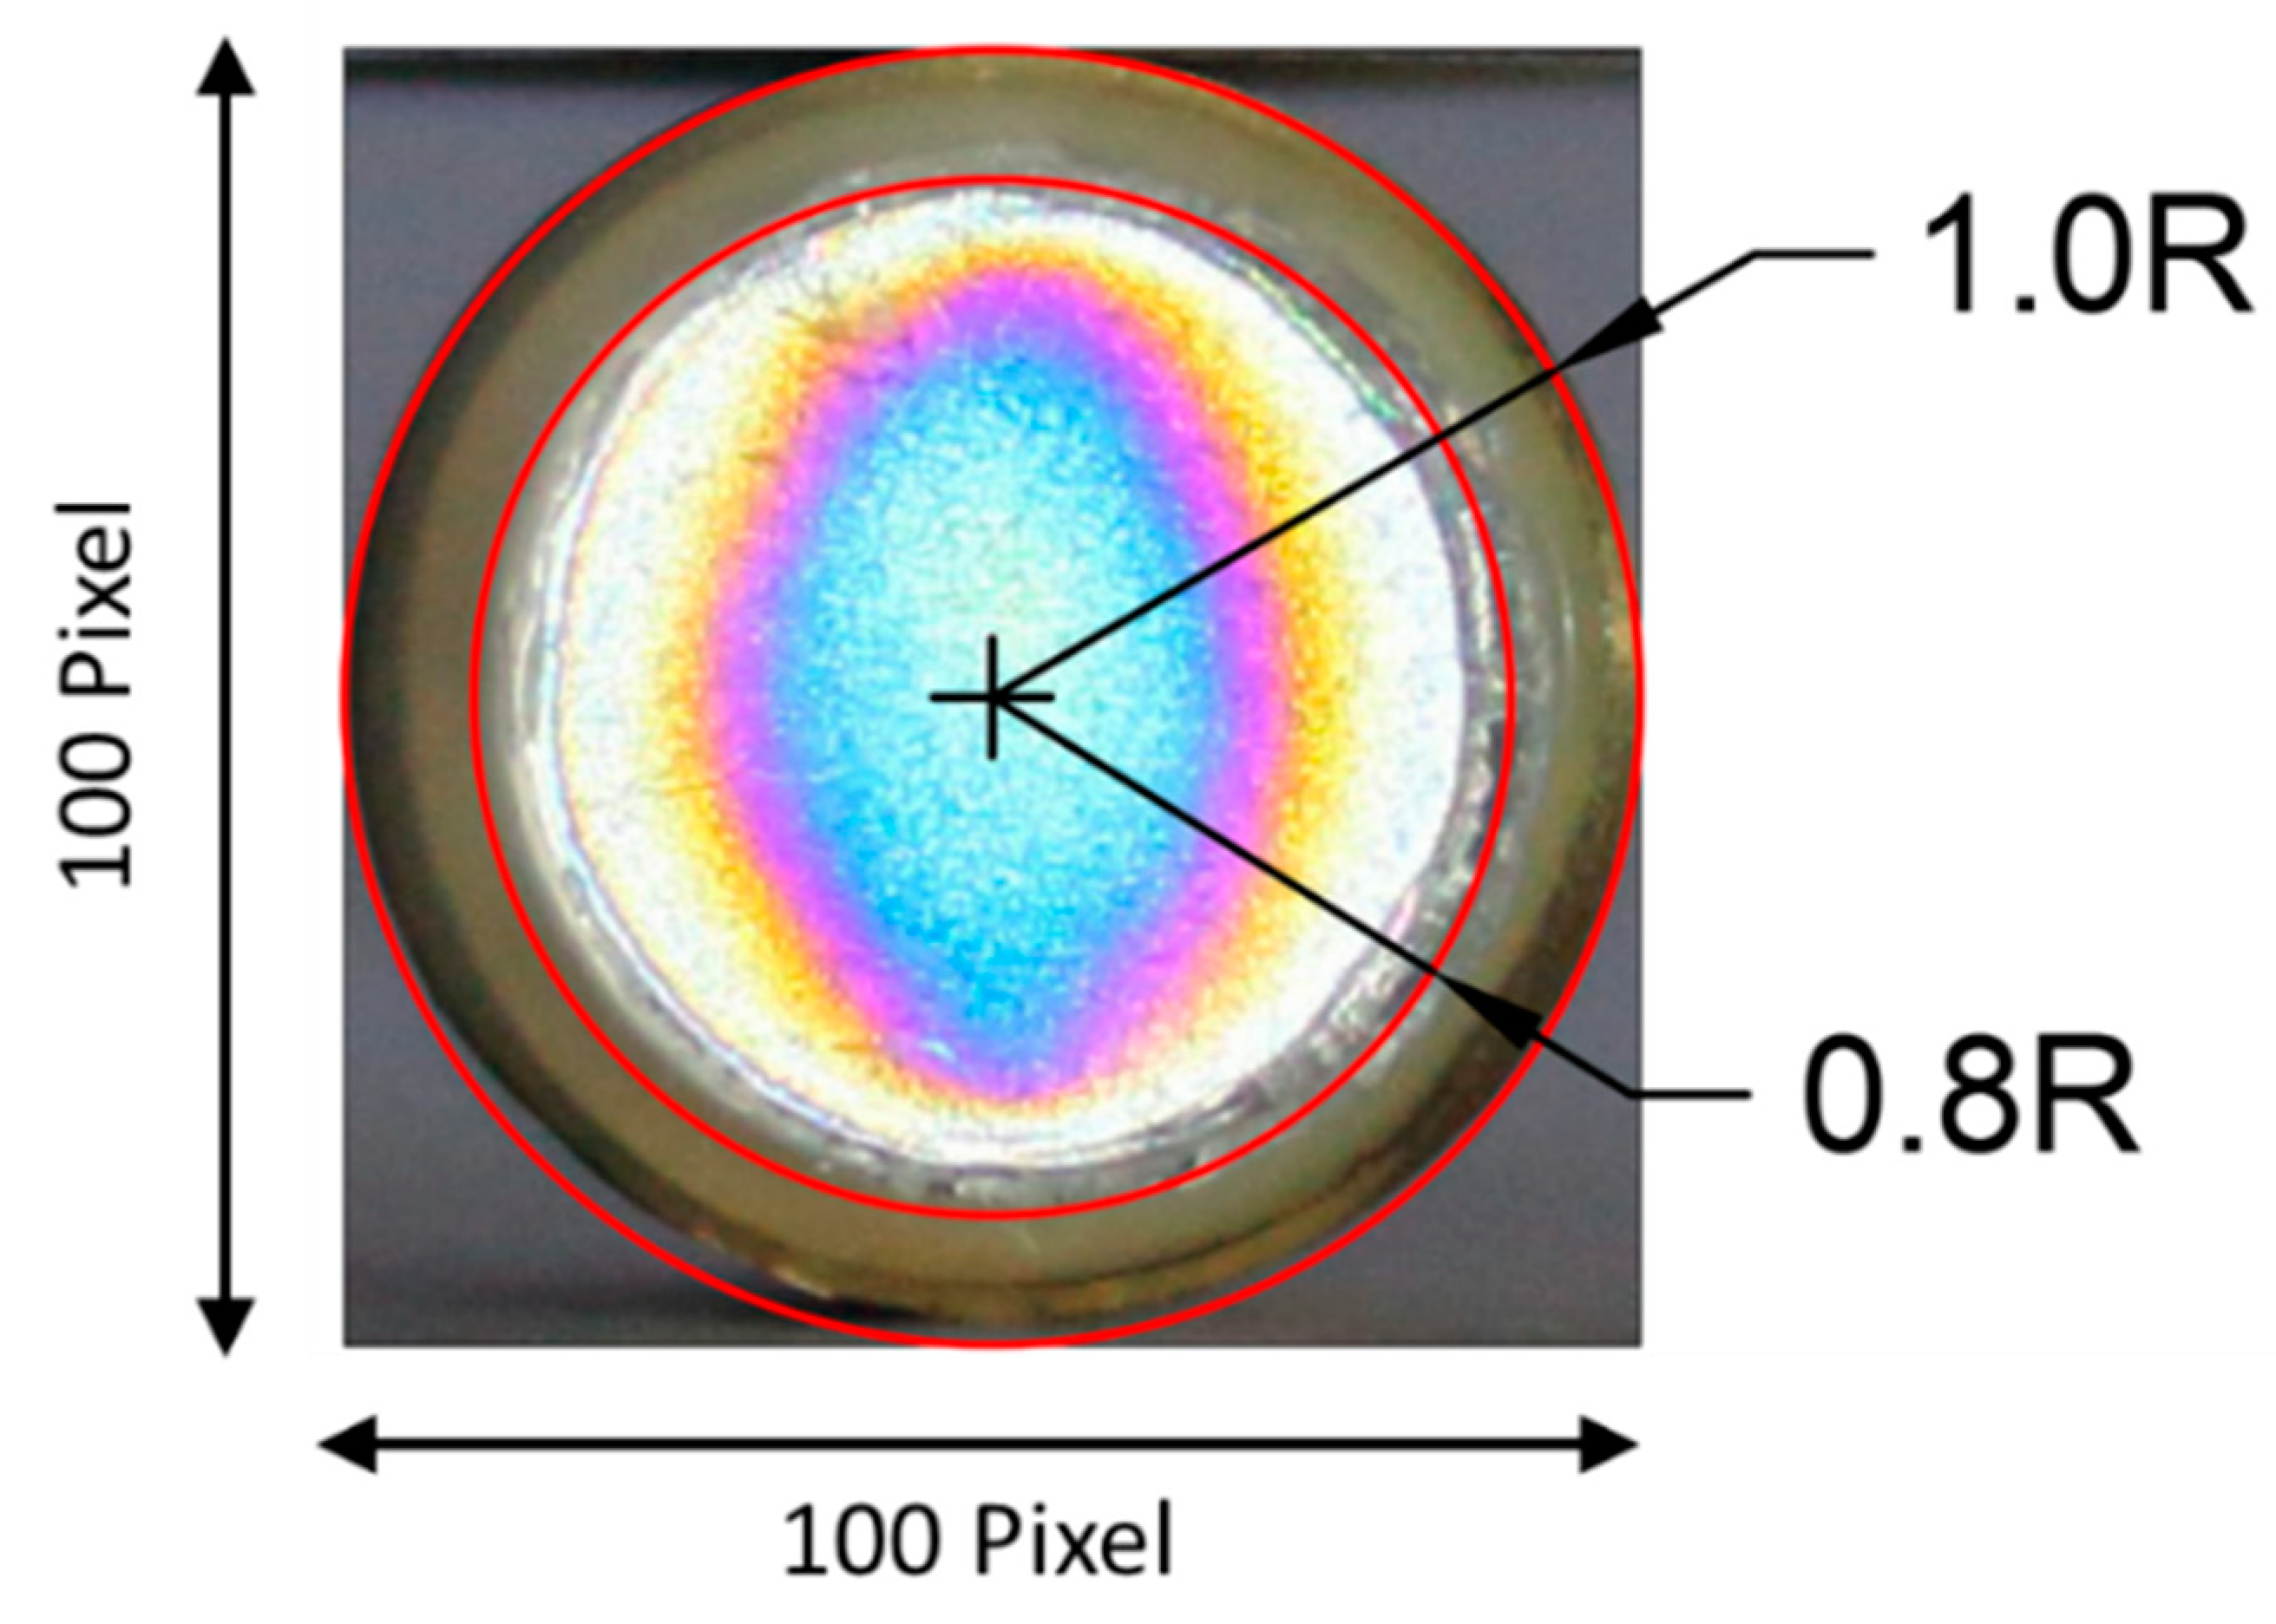
The analysis of the RGB code-based photoelastic image requires a three-step data processing procedure. Initially, the captured image is trimmed to fit a circular section of the model particle and adjusted to a resolution of 100 × 100 pixels. Subsequently, a circular region of interest is defined within the radius of 0.8 R, where R is the radius of the cylindrical section of the model particle, covering approximately 5000 pixels (refer to Figure 6). Following this, the average value of the red, green, and blue color intensities is computed within this designated region of interest. For each testing condition, ten average values are obtained from a set of ten identical specimens. Finally, variations in these average values are represented at each load level using a box plot. The interquartile range (IQR), which demonstrates the data spread in a box plot, is employed to statistically ascertain the consistency of measurements for each test condition. A smaller IQR implies a lower spread of data, indicating more consistent results.

3. Results and Discussions

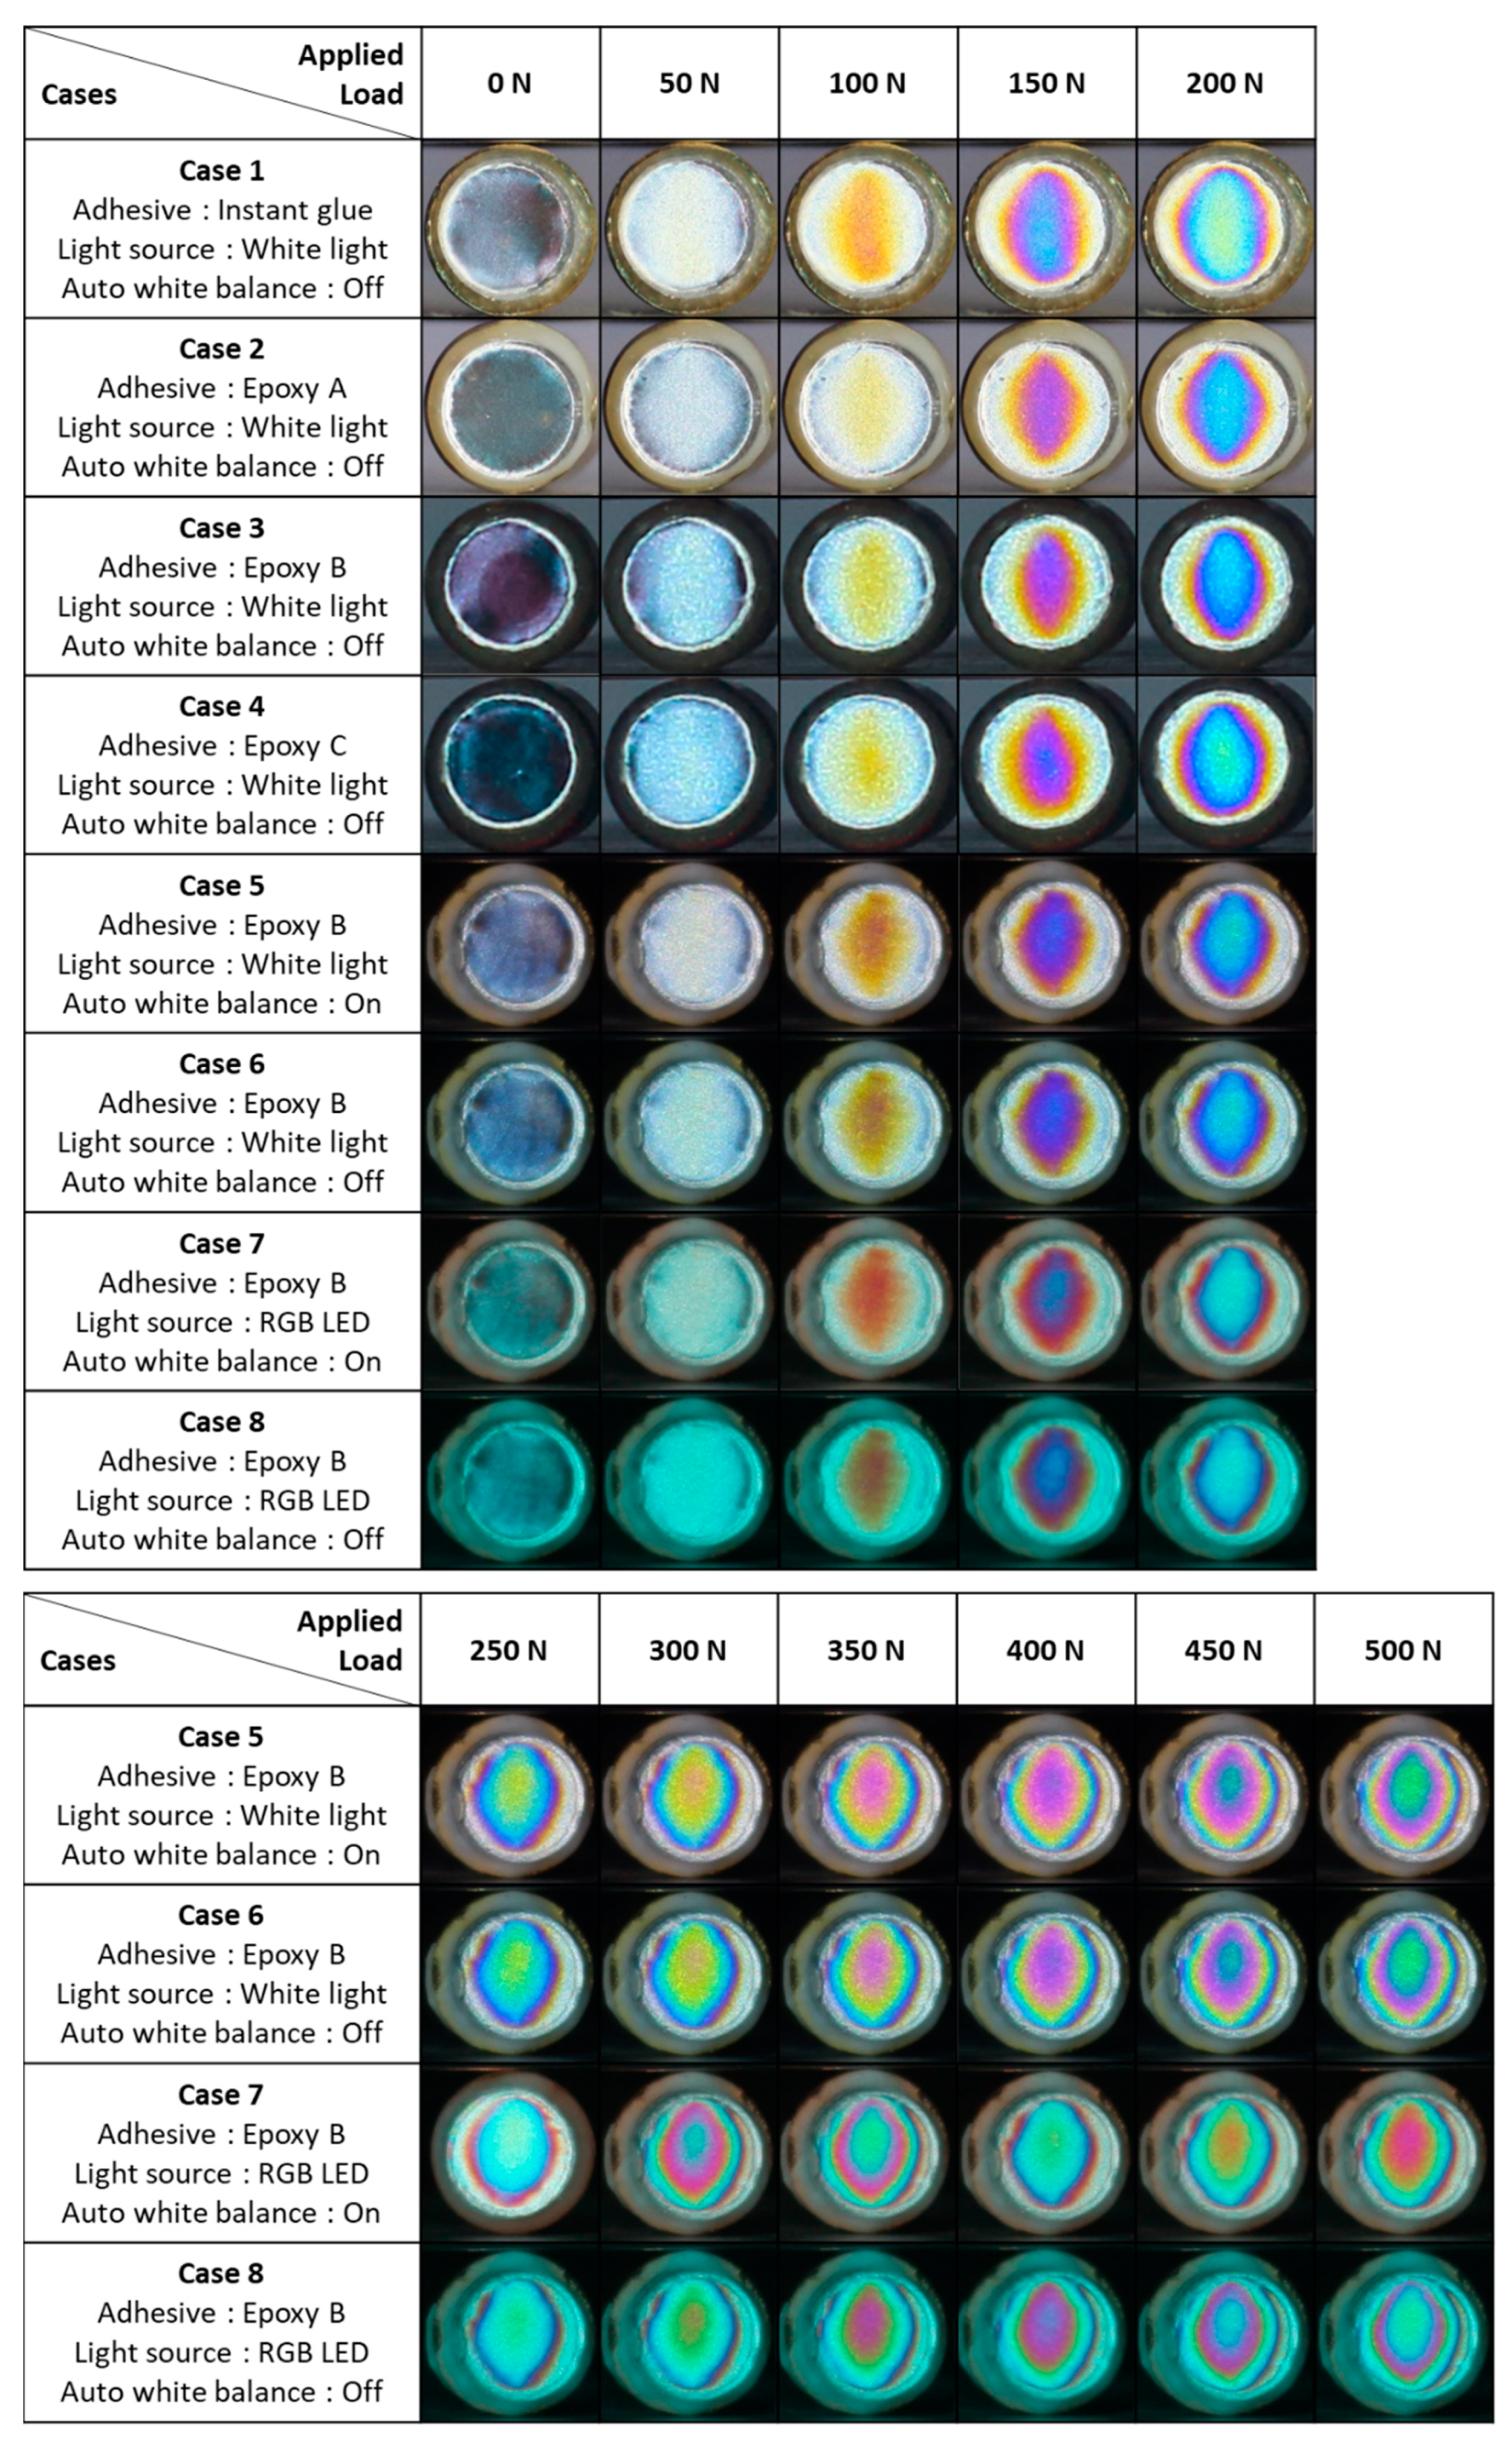
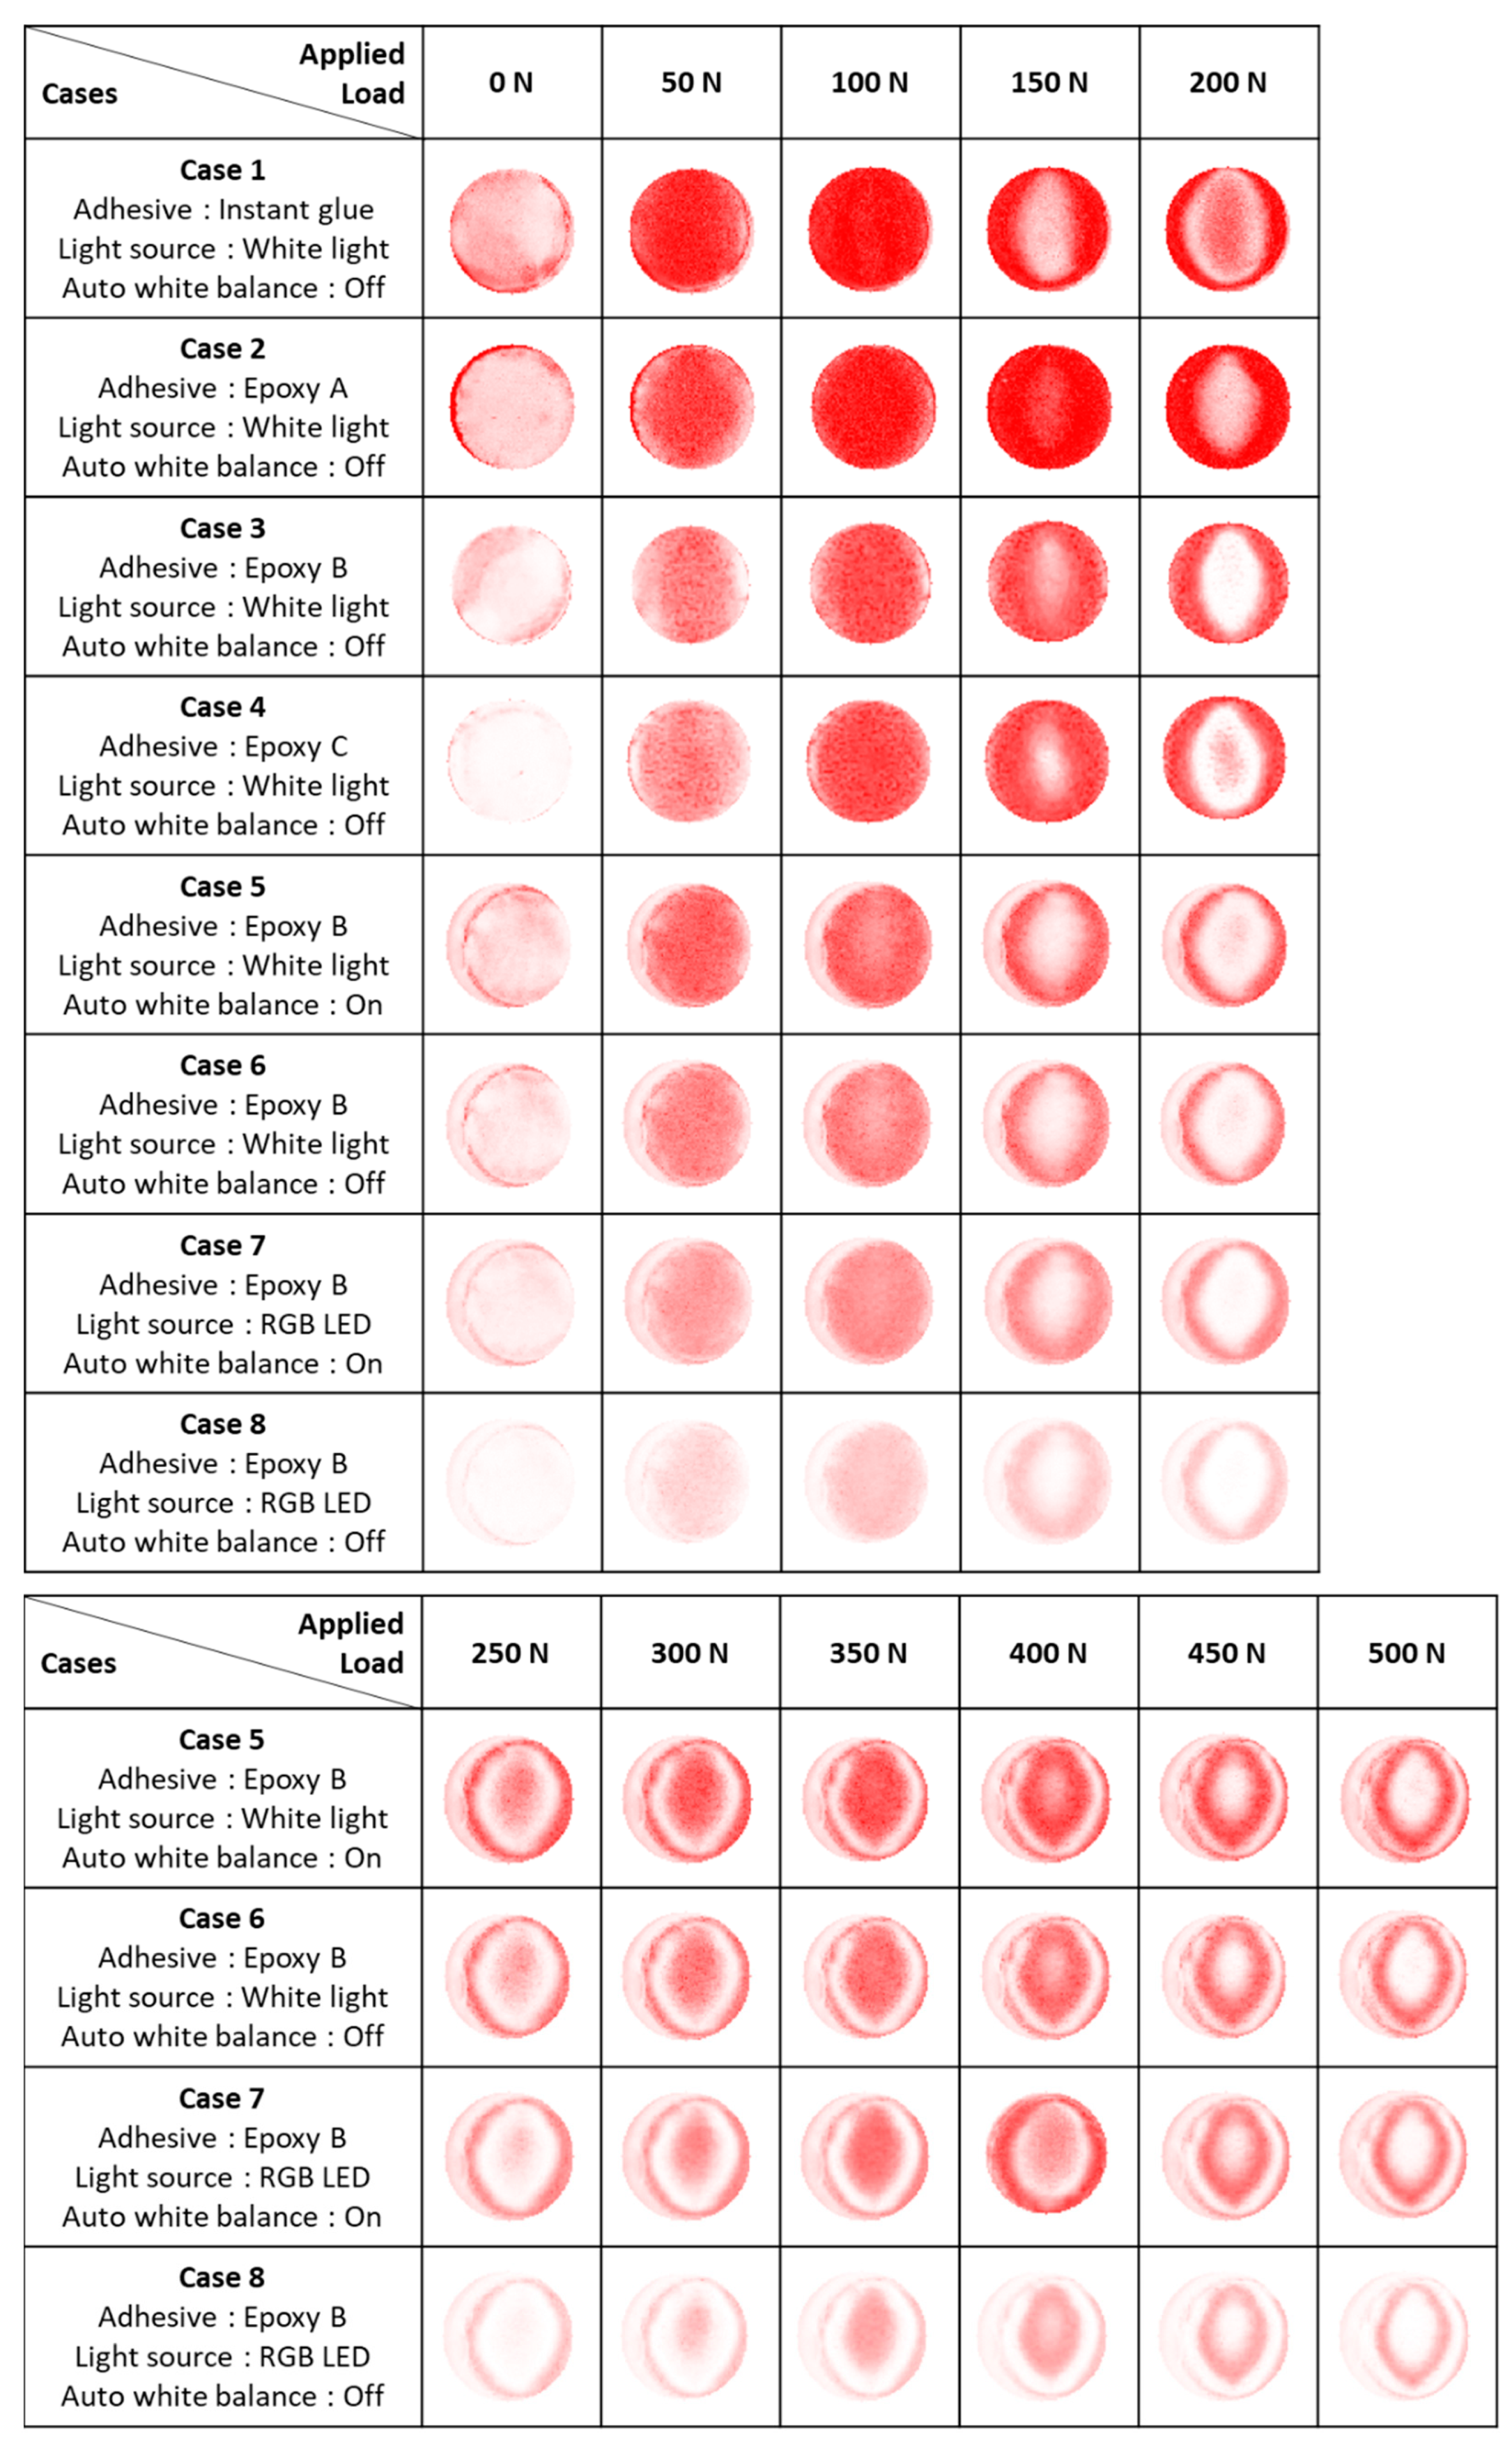
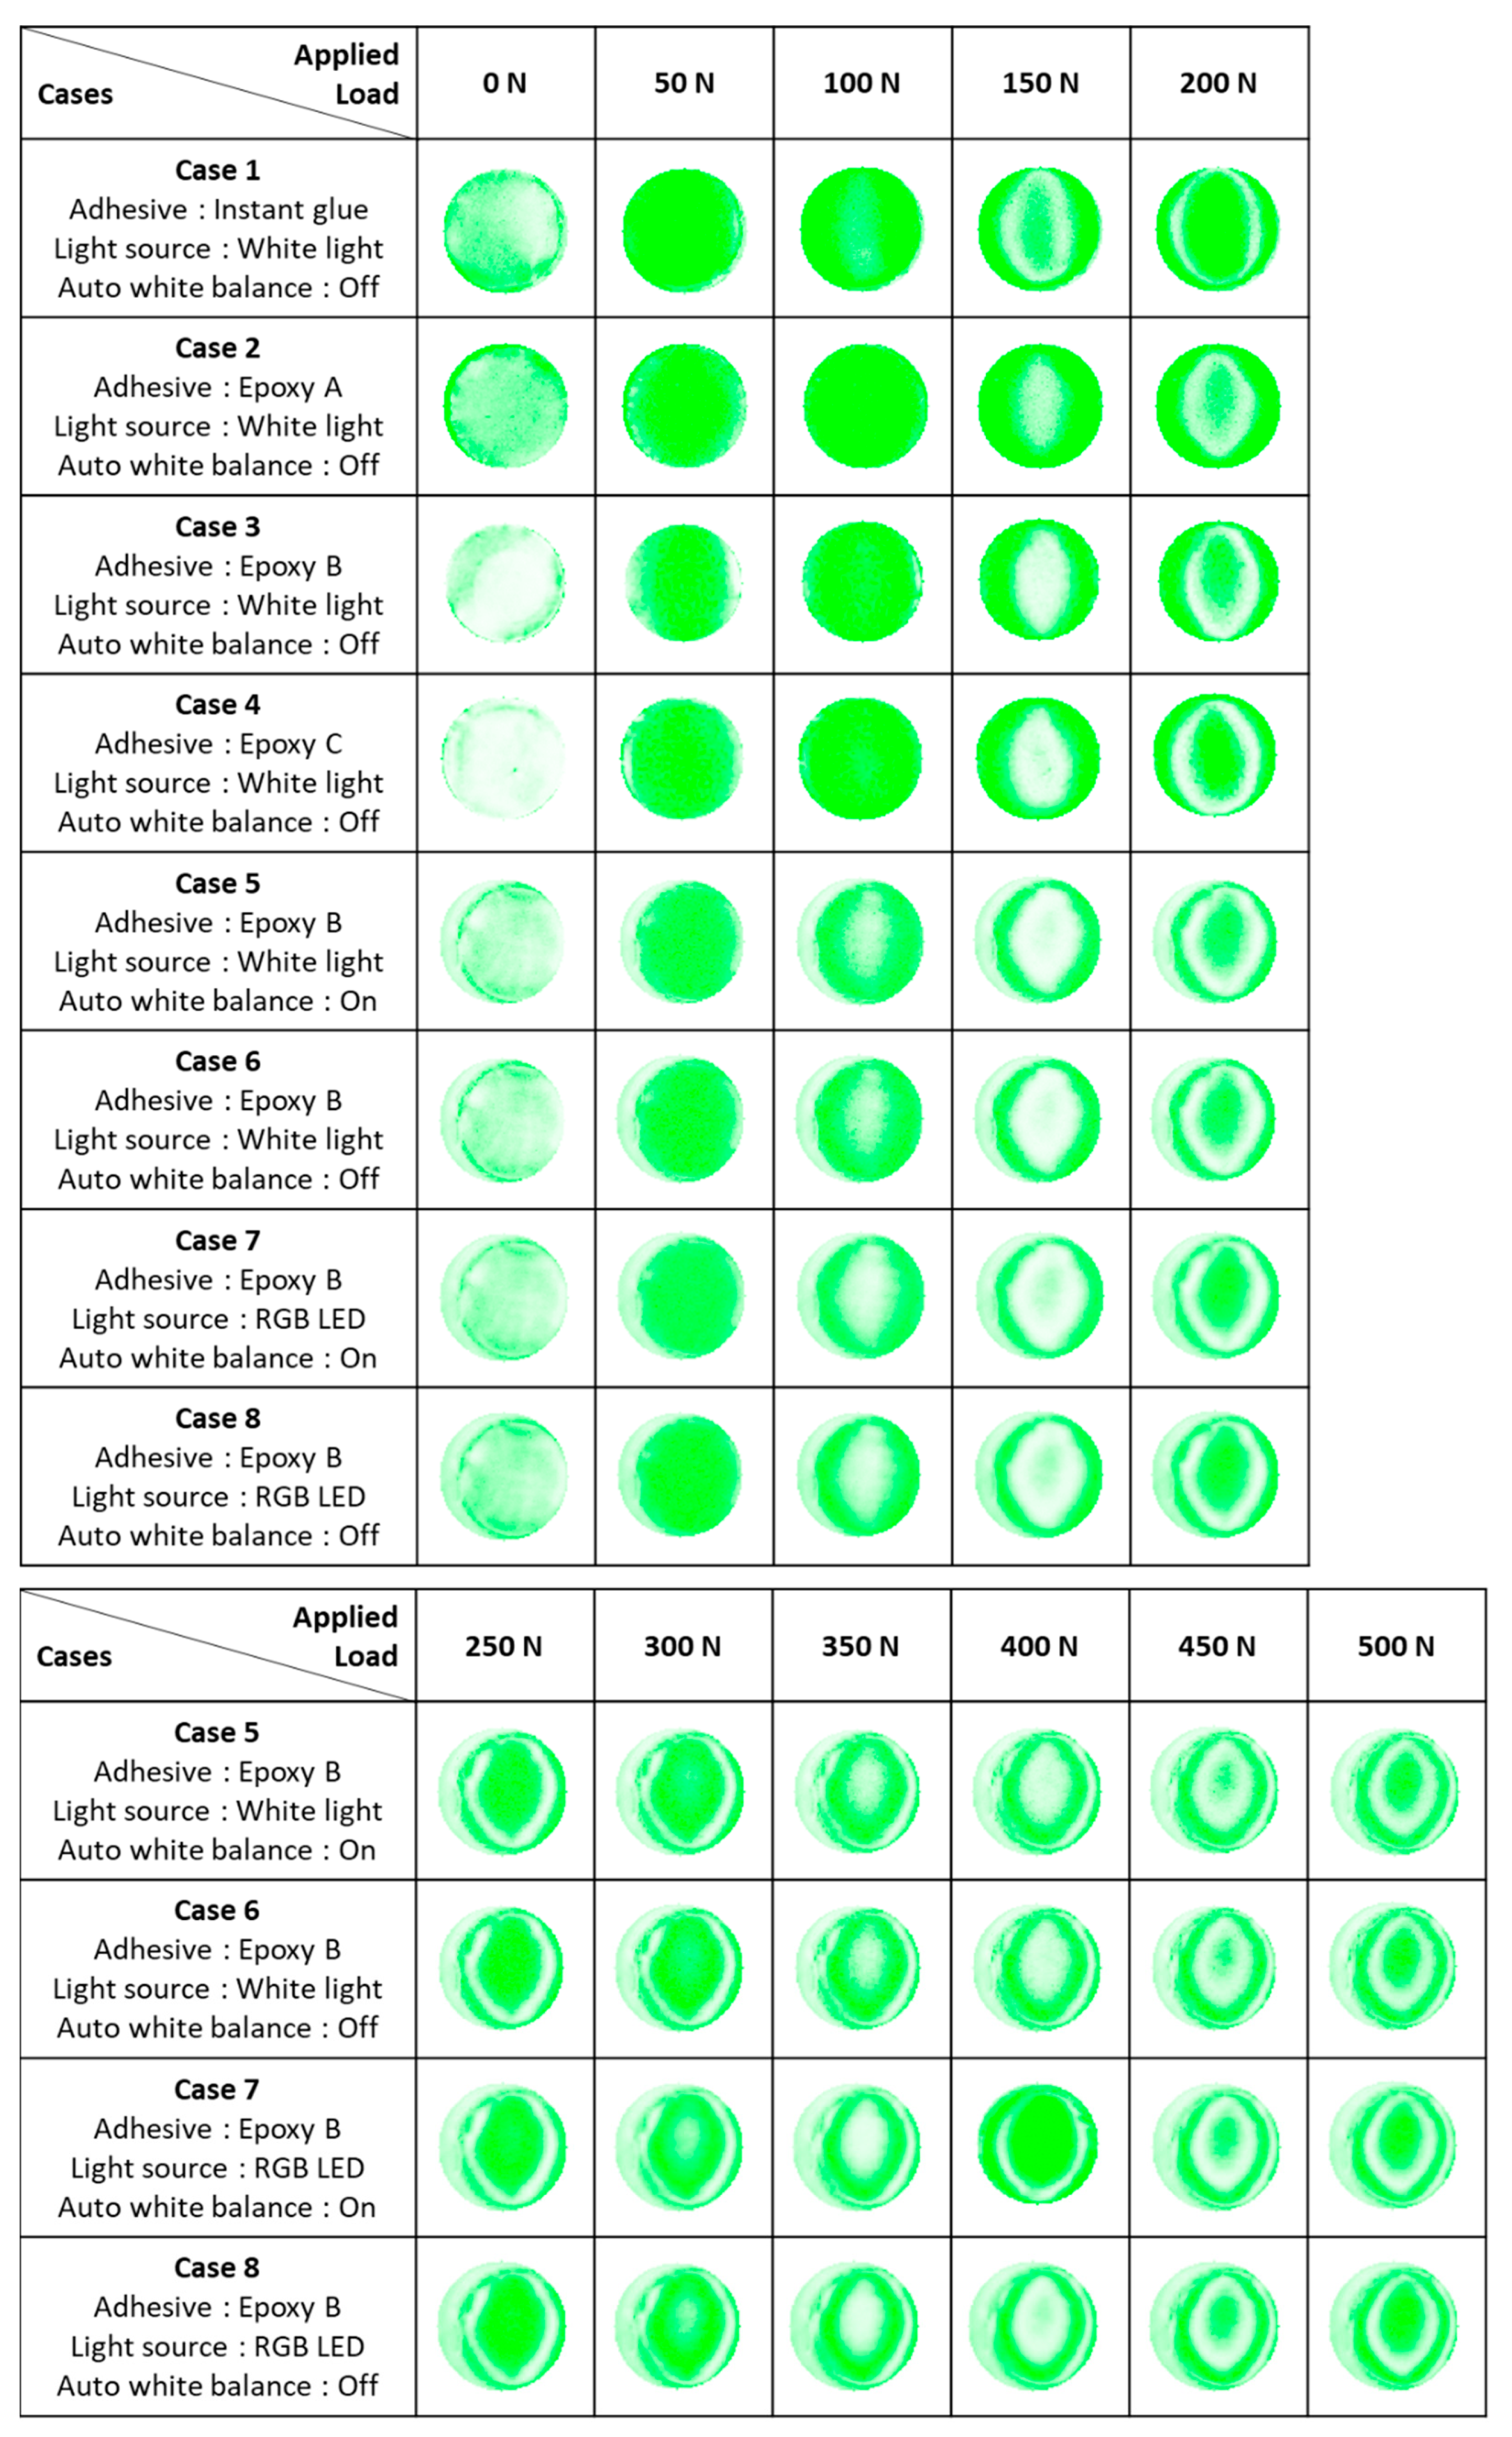
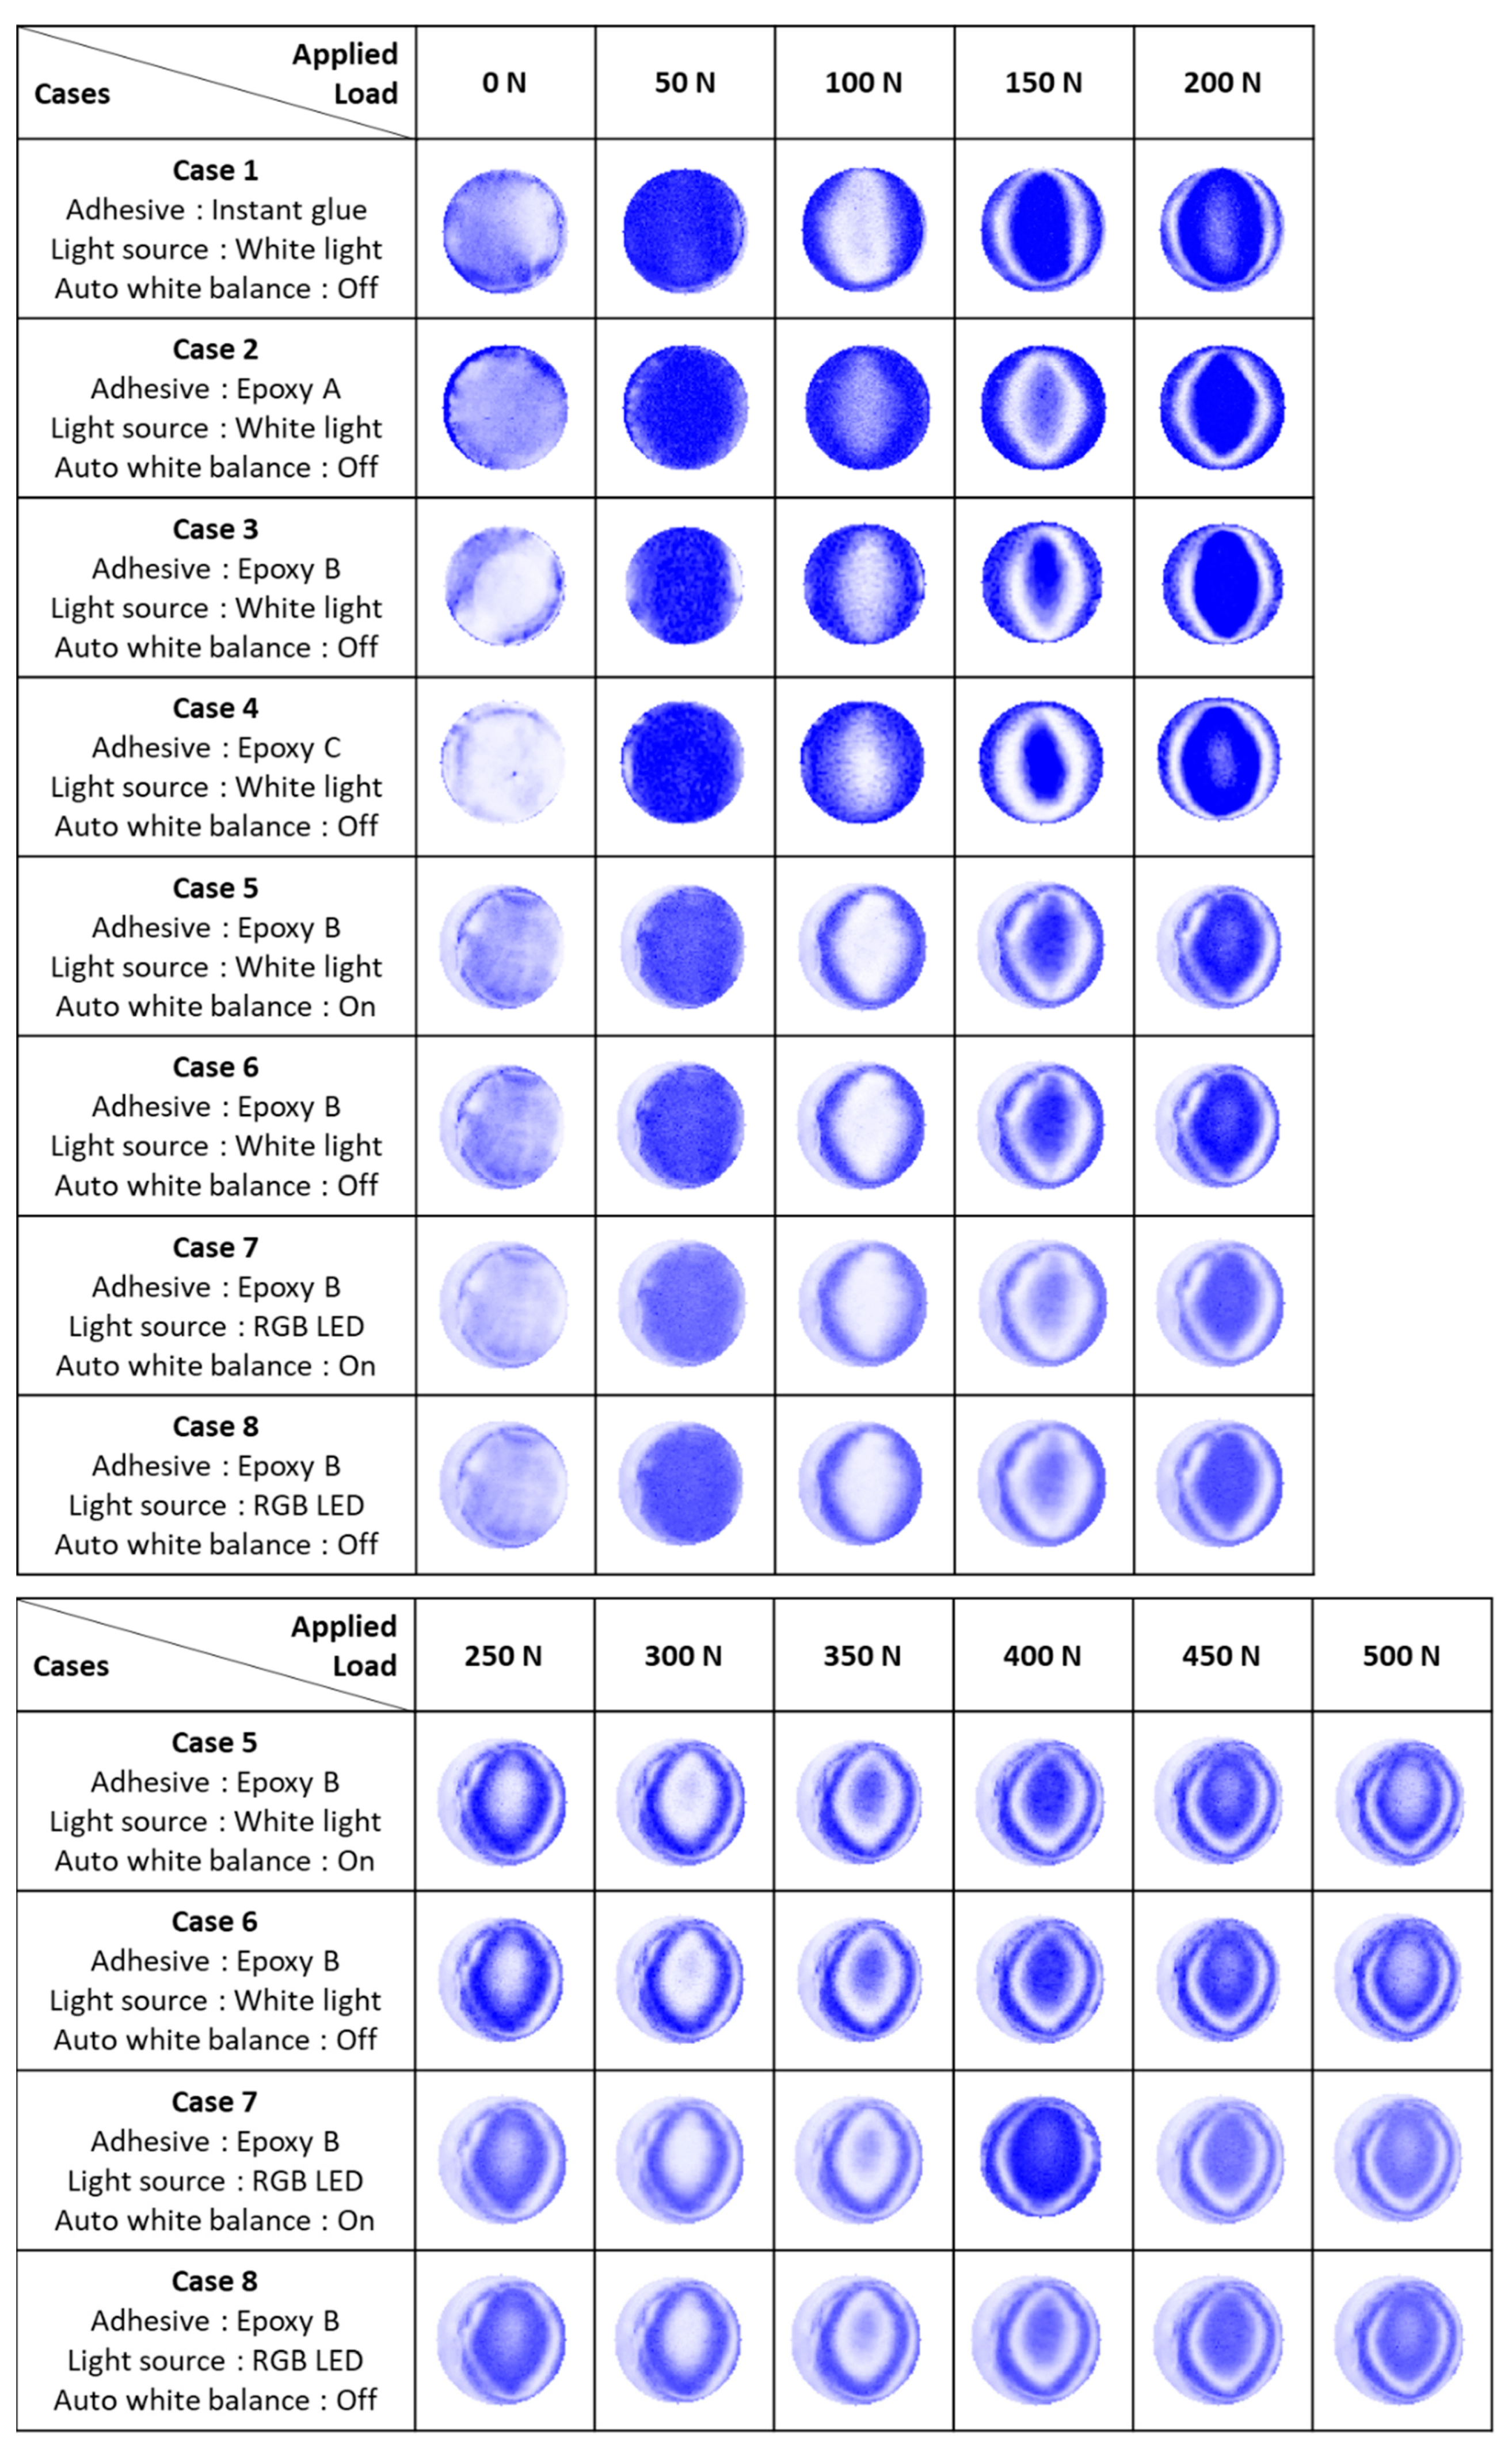
Figure 7 depicts how the photoelastic image evolves in response to the uniaxial compression test as the applied load gradually increased from 100 to 500 N. With an increasing load, the color transitions from a darker shade (at 0 N) to a more vibrant one, with a corresponding rise in the fringe order. Figure 8, Figure 9 and Figure 10 illustrate the contours derived from the red (R), green (G), and blue (B) color intensities of the photoelastic image. Since the brightness of the light varies based on the RGB value, the contours exhibit differences even when the same photoelastic image is employed.

3.1. Effect of the Adhesives on the RGB Photoelastic Responses

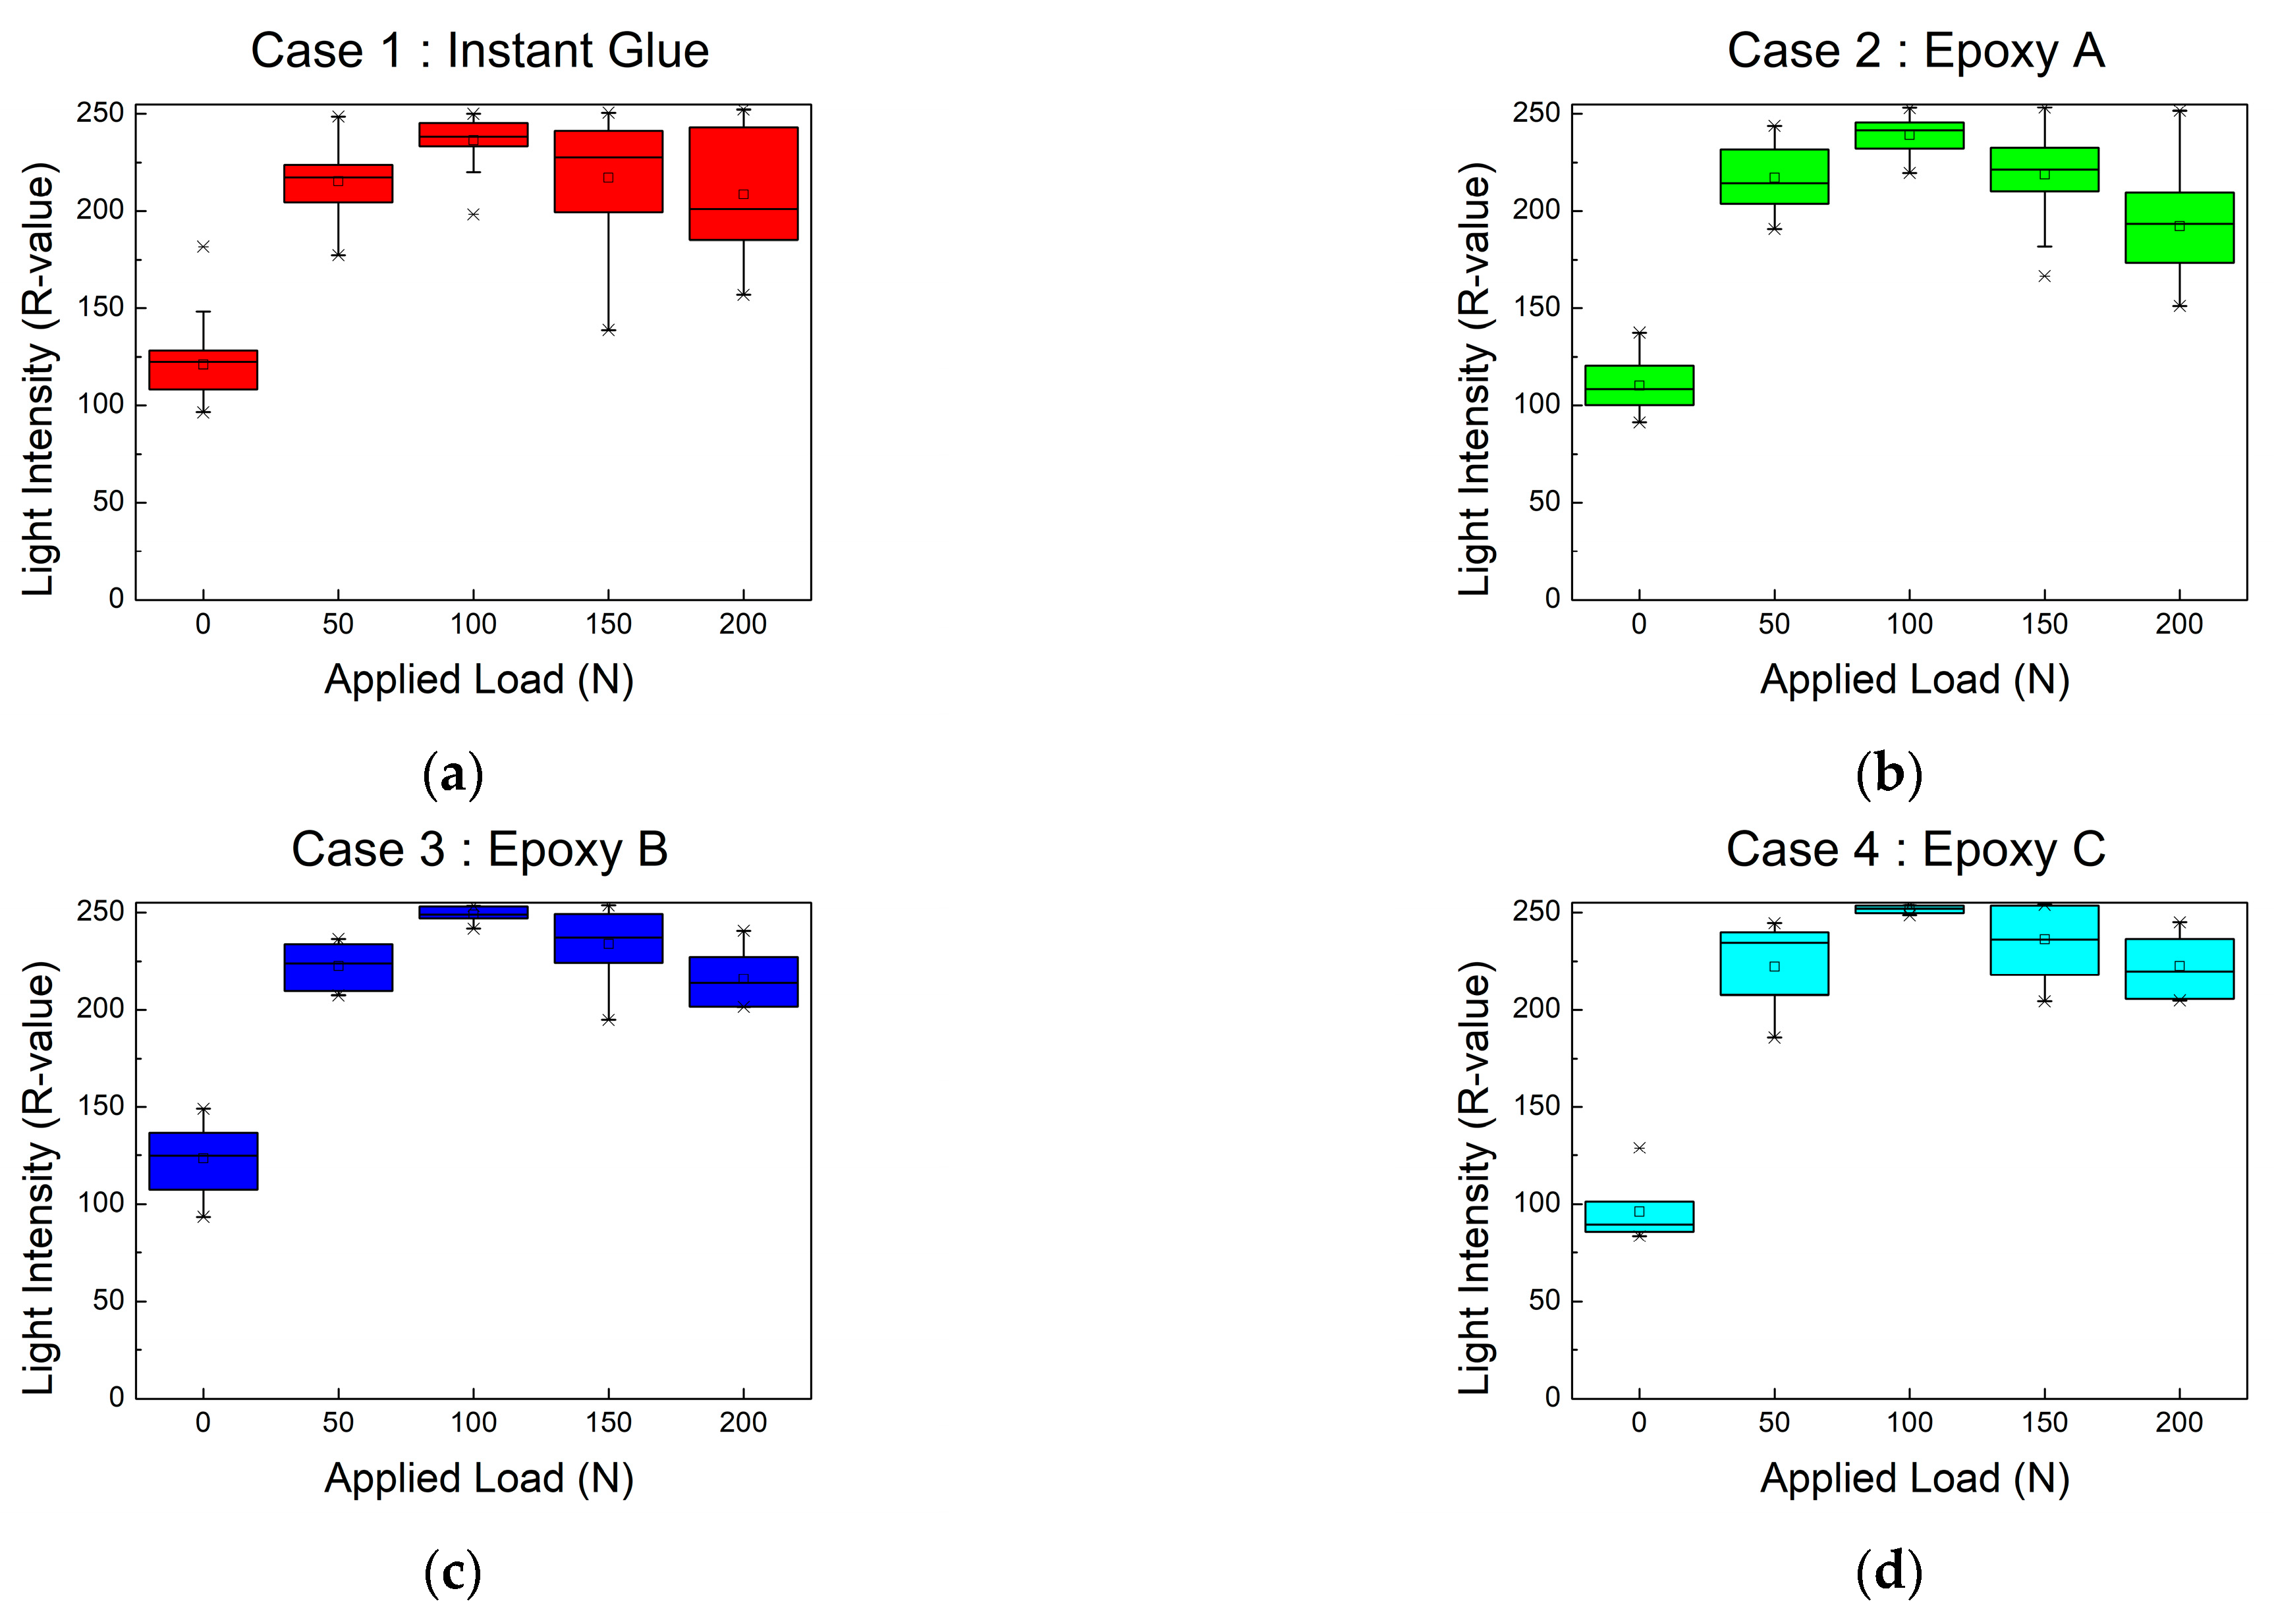
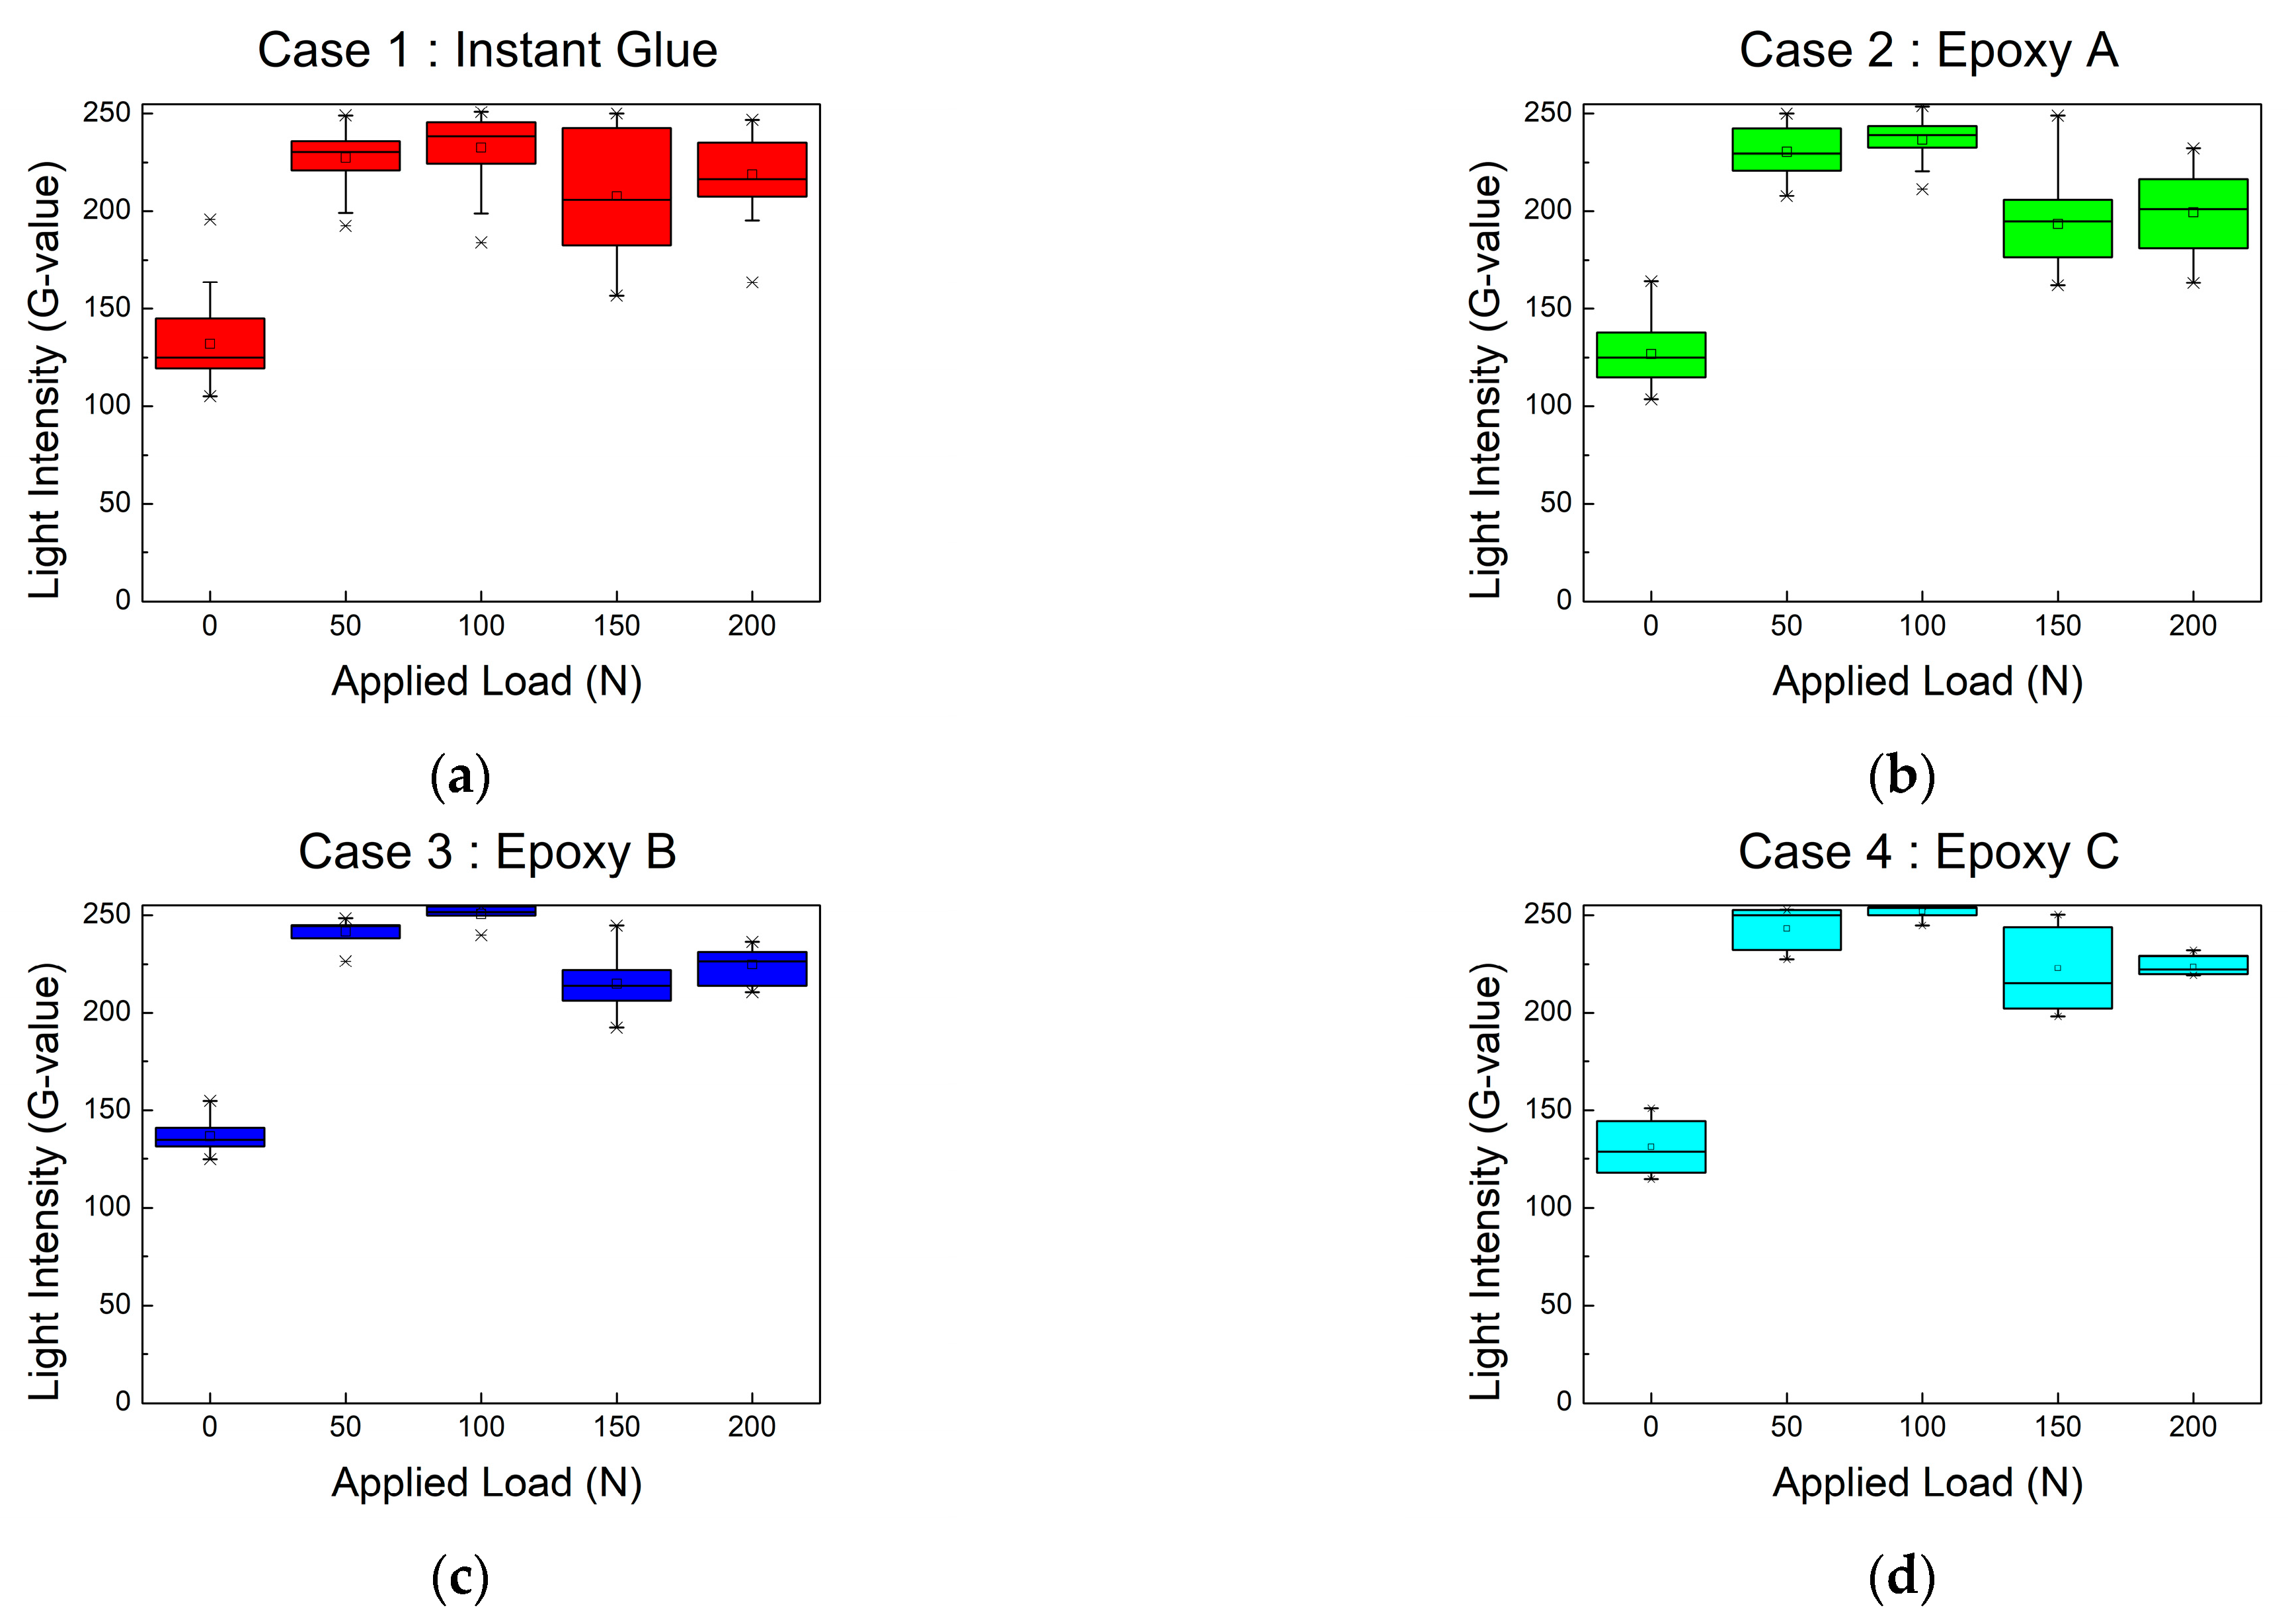
The analysis of the RGB value distribution at various load levels revealed significant differences between the four types of adhesives (instant glue, Epoxy A, B, and C) used. Figure 11, Figure 12 and Figure 13 compared this distribution for the R, G, and B values, respectively. The R value intensity demonstrated a parabolic pattern, increasing before decreasing as the load level changed. It consistently peaked at a load of 100 N. However, an increased load level resulted in a larger interquartile range, suggesting reduced consistency in the photoelastic response at these higher loads. In contrast, the G and B values followed a sinusoidal pattern, initially decreasing from the peak and subsequently increasing again. Their maximum values were recorded at loads of 100 N and 50 N, respectively. Consequently, the overall distribution of the RGB values resembled a sinusoidal waveform, with the blue value’s peak detected at a lower load level, indicating a shorter wavelength. Additional analysis of the interquartile distribution for various load stages (shown in Figure 14) revealed a significant widening in the interquartile range at the load level stage immediately following the maximum RGB values. Across all test cases, the experimental data from the photoelastic soil particle model using Epoxy B had the smallest average interquartile range, indicating the most consistent results. Notably, the G value interquartile range for Epoxy B was also relatively low.

3.2. Effect of the Light Source and the White Balance Function

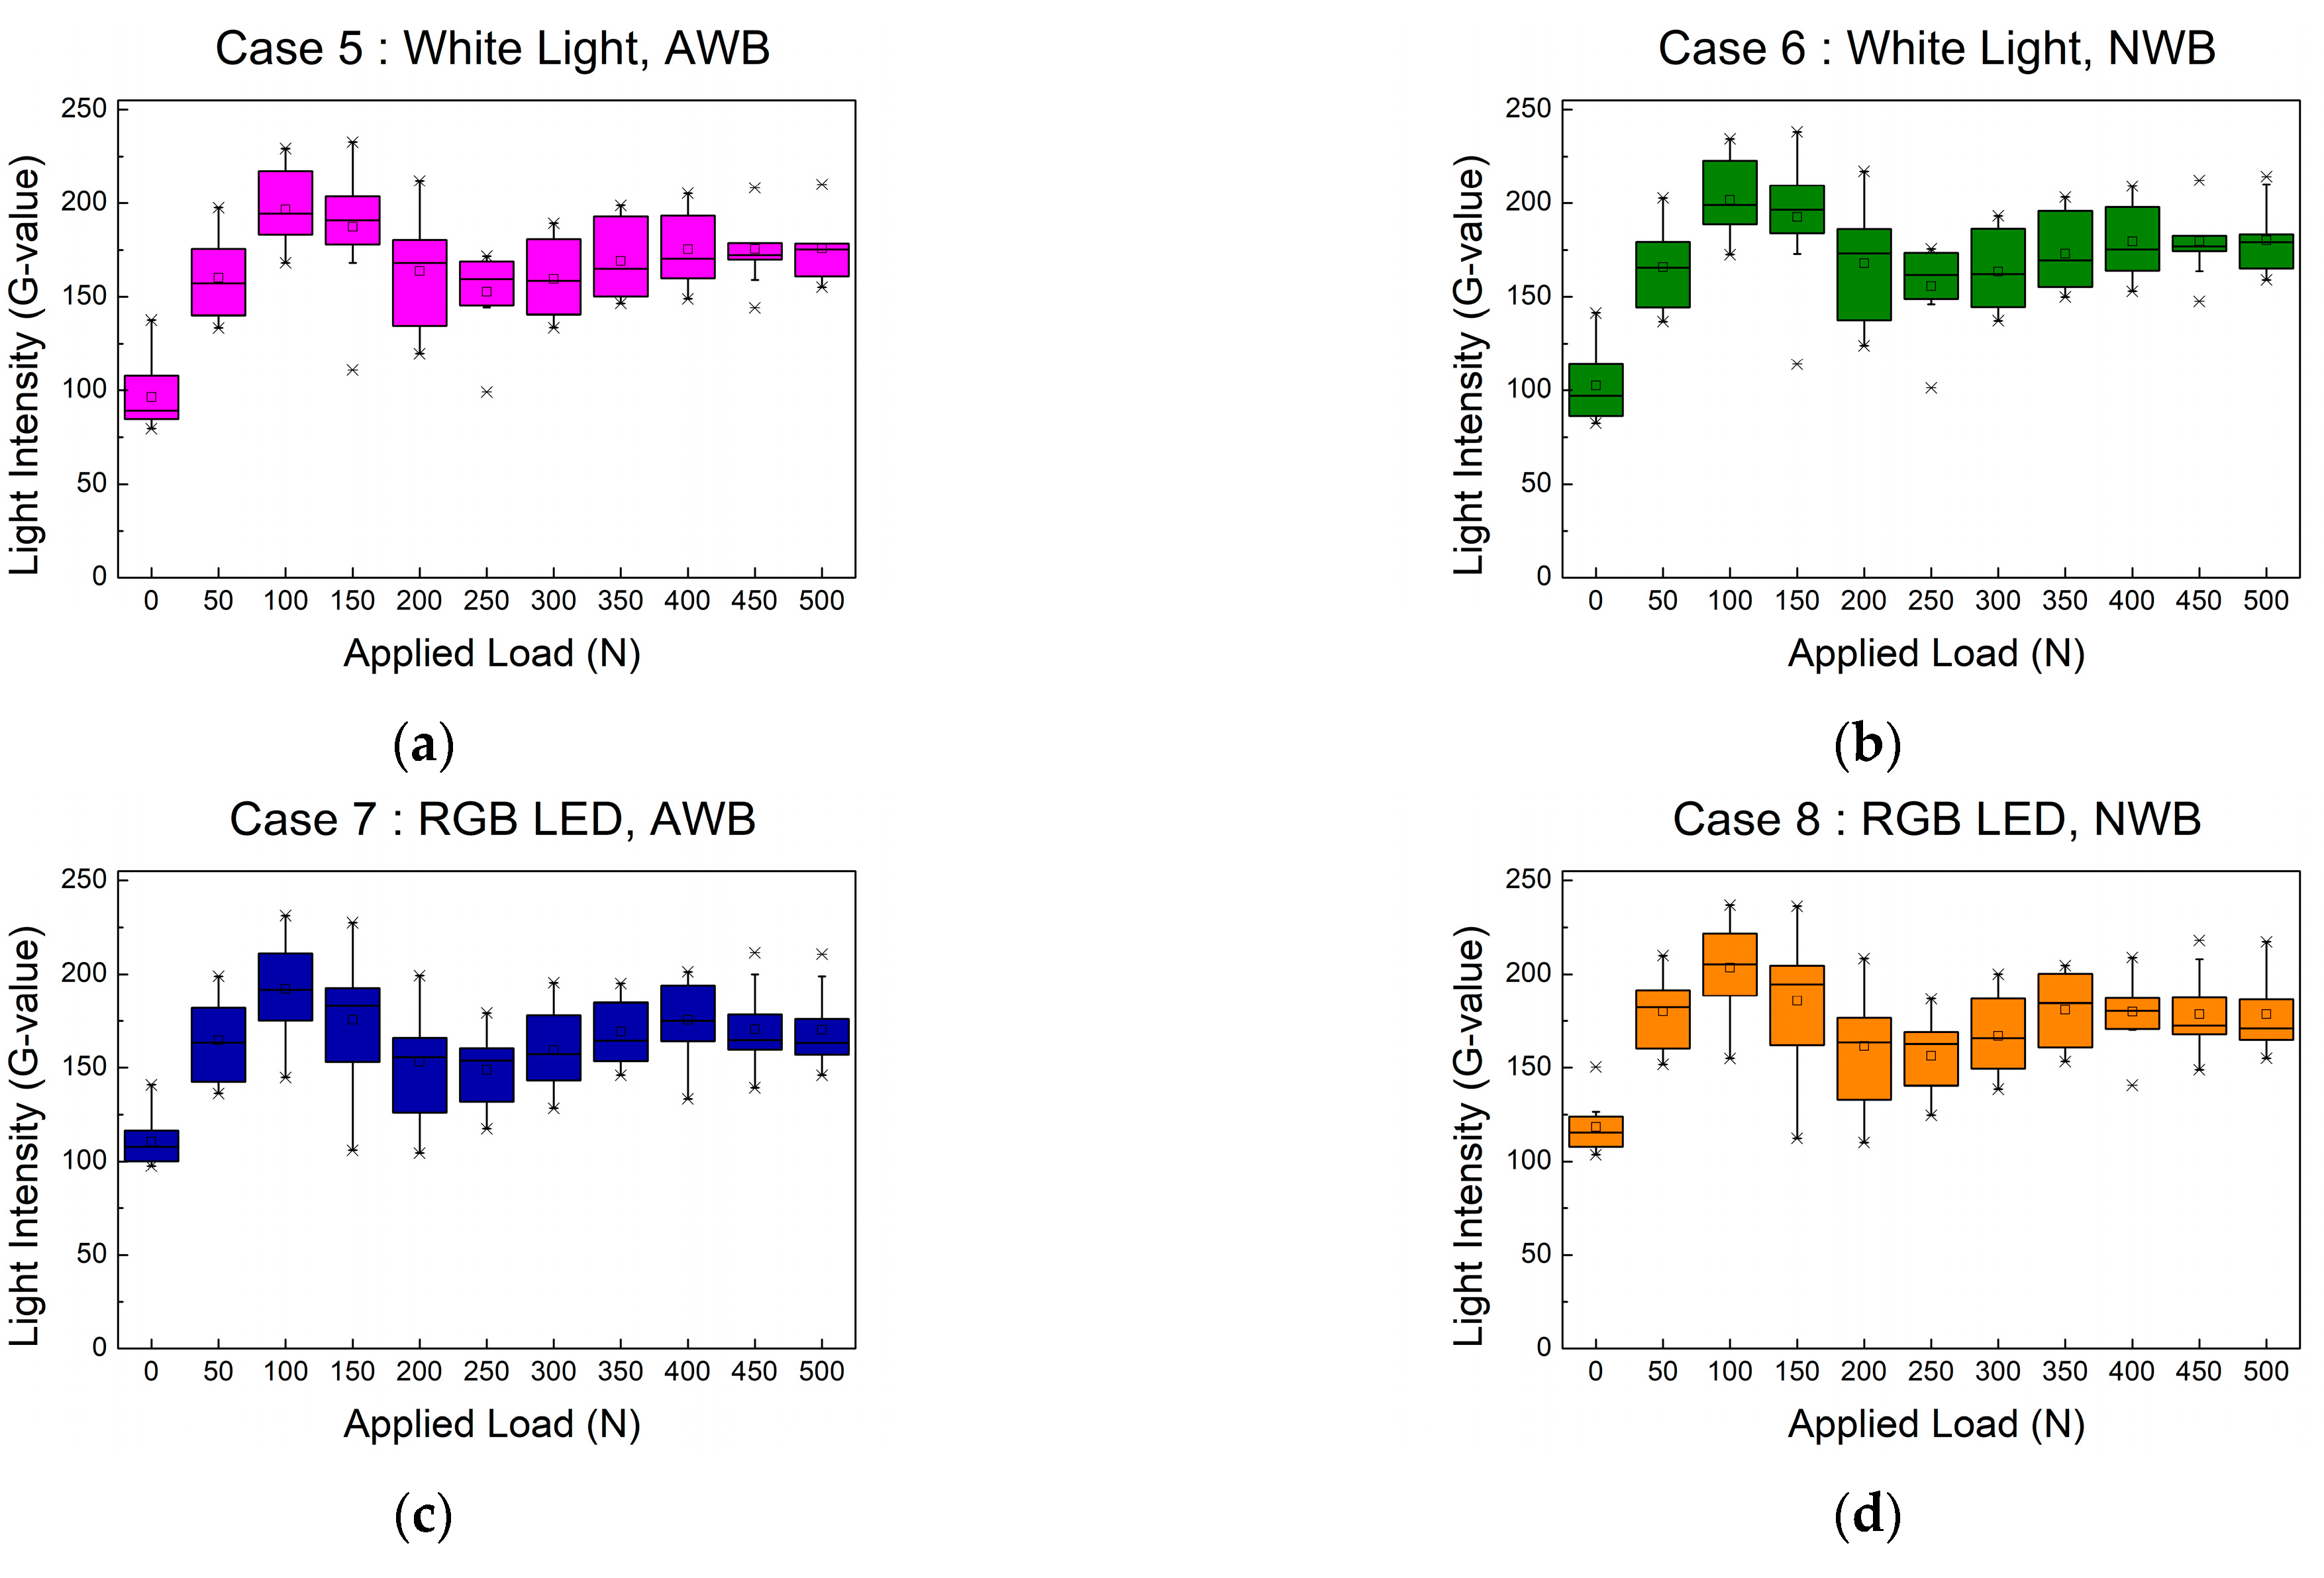
The evaluation of the impact of the light source and the application of a white balance function on the RGB intensity values was undertaken across different axial loadings. In this process, two different types of light sources were assessed, and an additional variable introduced was the use or non-use of the auto white balance function. These different scenarios yielded a varied range of RGB value distributions, which are clearly visualized in Figure 15, Figure 16 and Figure 17.
In particular, the R value presented a unique pattern. Upon application of a load exceeding 200 N, the R value intensity initially decreased before increasing again. This pattern was noticeably different from the B and G value responses. These values reached their maximum at lower load levels compared to the R values. Despite this difference in individual responses, the overall RGB value patterns maintained a similar sine wave-like pattern. This was especially noticeable at load levels of 300 N or higher. At these load levels, the waveform amplitude decreased, causing minimal changes in the RGB values.
Figure 18 offers another perspective by representing the median values extracted from the data sets depicted in Figure 15, Figure 16 and Figure 17. An interesting observation from this data was that the distribution of the R values demonstrated a greater degree of variability based on experimental conditions compared to the G and B values. This variability was even more pronounced in Cases 5 and 6. These cases, which employed white light as the source, exhibited greater R value intensities than those observed in Cases 7 and 8, which utilized the RGB LED as the light source.
The use of the white balance function also had a substantial influence on the R values. When used under white light, which is classified as a colder temperature light at 9259 K, the R value was significantly adjusted. This adjustment was also observed in Cases 7 and 8. Here, the RGB LED, having a cooler color temperature of 9641 K compared to white light, also led to a greater adjustment of the R value when the white balance function was applied.
Finally, the interquartile range of the data sets, summarized in Figure 19, provided an important observation. Cases 5 to 8 demonstrated similar interquartile ranges, without any large difference. As these experiments were conducted on the same soil particle model, the consistency of the photoelastic response seemed to remain largely unaffected by the light source and the digital camera’s white balance function. This observation underscores the fact that the variability in the results stemmed mainly from the differences in the adhesives used in creating the model particles and not from these other factors.

3.3. Key Findings

Our study led to several notable findings pertaining to the RGB intensity values under varying axial loadings. An integral aspect of our analysis involved the use of the interquartile range, which served as a performance indicator for our testing variables. The smallest average interquartile range was observed in Case 3, with the R value’s average interquartile range being 15.411; the G value’s, 7.899; and the B value’s, 19.280. Revisiting the experimental conditions for Case 3, epoxy B and white light were used, and the auto white balance function was not employed. This outcome, presented in Figure 20, indicated the most consistent photoelastic response across all R, G, and B values.
Interestingly, despite employing the same adhesive and light source and foregoing the white balance function in both Cases 3 and 6, the average interquartile range differed significantly between these two scenarios. This discrepancy can be attributed to the difference in the maximum applied load in each case, with Case 3 having a maximum load of 200 N and Case 6, 500 N.
When comparing the average interquartile range between Cases 1 to 4, which showcased variations according to the type of adhesive used, and Cases 5 to 8, the latter group demonstrated quite similar results to each other. From this observation, we inferred that the shear strength and viscosity of the adhesive appear to exert the most substantial influence on the consistency of the response in the reflective photoelastic method.
As previously mentioned, Case 3 was evaluated to show the most consistent photoelastic response. Under this condition, epoxy B was used, and among its key material properties, its shear strength was the highest at 30 MPa, tied with epoxy C, and the viscosities of the resin and hardener were the highest at 67.5 Pa.s and 7 Pa.s, respectively.
The viscosity of an adhesive is closely related to its adhesive performance. Generally, high viscosity is associated with high adhesive strength, but it has the drawback of slow curing and difficulty in spreading evenly on surfaces, leading to reduced usability. However, adhesives with excessively high viscosity can lead to the formation of bubbles due to the roughness of the material surface, which can actually decrease the adhesive quality [37]. Therefore, choosing an adhesive solely based on its high viscosity is not advisable.
Kumar et al. [38] utilized the reflective photoelastic coating technique to analyze stone masonry walls. They mentioned that attaching the photoelastic coating uniformly to the irregular specimen surface was a challenging task, requiring a significant amount of experience and skill. They emphasized that this step was the most critical in the application of the reflection photoelasticity method.
In summary, the study’s key findings indicate the pivotal role of the adhesive’s characteristics in shaping the photoelastic response. Although factors such as the light source and white balance function were explored, their impact on response consistency was notably less substantial. These insights enhance our understanding of how various experimental parameters influence the photoelastic method’s output and will undoubtedly guide future investigations in this domain.

4. Conclusions

In conclusion, our study offers critical insights into the factors affecting the consistency of photoelastic responses in model soil particles. The most striking finding is the significant role played by the adhesive’s shear strength and viscosity. Specifically, the scenario involving the use of epoxy B, white light, and the exclusion of the auto white balance function yielded the most homogeneous photoelastic response, as demonstrated by the smallest average interquartile range across all RGB values. This result not only validates the efficacy of our experimental setup but also highlights the robustness of the reflective photoelastic coating technique when subjected to varying conditions.
We also scrutinized the degree of variance in the contact force measurements through the application of the reflective photoelastic coating technique. Three primary variables were assessed: the adhesive type, the optical characteristics of the light source, and the procedural implementation in configuring the digital camera for color image analysis. Despite the variations in these parameters, it was the adhesive’s properties that emerged as the decisive factor in determining the consistency of the photoelastic response. Under the restricted experimental conditions, the most consistent photoelastic response was observed when the viscosities of the adhesive’s resin and hardener were at their highest, which were 67.5 Pa.s and 7 Pa.s, respectively.
Interestingly, additional factors like the type of light source and the application of the white balance function had a relatively small impact on the consistency of the response. While these variables are not to be overlooked, their lesser consequential impact underscores the prominence of the adhesive’s properties in governing the output of the reflective photoelastic method.
These findings enrich our understanding of the interplay between the experimental parameters and their influence on the output of the reflective photoelastic method. They provide valuable guidance for subsequent research, particularly in optimizing the choice of adhesive and lighting conditions to achieve consistent and reliable results.

Author Contributions

Conceptualization, B.-H.N. and Y.-H.J.; Data curation, B.-H.N.; Formal analysis, Y.-H.J.; Funding acquisition, Y.-H.J.; Investigation, B.-H.N.; Methodology, S.K.; Project administration, Y.-H.J.; Resources, Y.-H.J.; Software, S.K.; Supervision, B.-H.N. and Y.-H.J.; Validation, S.K., B.-H.N. and Y.-H.J.; Visualization, S.K. and B.-H.N.; Writing—original draft, S.K.; Writing—review & editing, B.-H.N. and Y.-H.J. All authors have read and agreed to the published version of the manuscript.

Funding

This work was supported by a National Research Foundation of Korea (NRF) grant funded by the Korea government (MSIT) (2019R1A2C1089155).

Institutional Review Board Statement

Not applicable.

Informed Consent Statement

Not applicable.

Data Availability Statement

Data available on request from the authors. The data that support the findings of this study are available from the corresponding author, Y.-H.J., upon request.

Conflicts of Interest

The authors declare that they have no conflict of interest.

References

  1. Frocht, M.M. Photoelasticity: The Selected Scientific Papers of MM Frocht; Pergamon: Oxford, UK, 1969. [Google Scholar]
  2. Brahtz, J.H.A. The stress function and photo-elasticity applied to dams. Trans. Am. Soc. Civ. Eng. 1936, 101, 1240–1277. [Google Scholar] [CrossRef]
  3. Durelli, A.J.; Parks, V.J.; Mok, C.K.; Lee, H.C. Photoelastic study of beams on elastic foundations. J. Struct. Div. 1969, 95, 1713–1725. [Google Scholar] [CrossRef]
  4. Bruki, N.K.; Richards, J.R. Photoelastic analysis of a cofferdam. J. Geotech. Eng. Div. 1975, 101, 129–145. [Google Scholar] [CrossRef]
  5. Dantu, P. Contribution à l’étude mécanique et géométrique des milieux pulvérulents. In Proceedings of the 4th International Conference on Soil Mechanics and Foundation Engineering, London, UK, 12–24 August 1957; 1, pp. 144–148. [Google Scholar]
  6. Wakabayashi, T. Photoelastic method for determination of stress in powdered mass. In Proceedings of the 7th Japan National Congress for Applied Mechanics; Science Council of Japan: Tokyo, Japan, 1957; Volume I-34, pp. 153–158. [Google Scholar]
  7. Drescher, A.; De Jong, G.D.J. Photoelastic verification of a mechanical model for the flow of a granular material. J. Mech. Phys. Solids 1972, 20, 337–340. [Google Scholar] [CrossRef]
  8. Dyer, M. Observation of the Stress Distribution in Crushed Glass with Applications to Soil Reinforcement. PhD Thesis, University of Oxford, Oxford, UK, 1985. [Google Scholar]
  9. Allersma, H.G.B. Optical Analysis of Stress and Strain in Photoelastic Particle Assemblies. PhD Thesis, Delft University of Technology, Delft, the Netherlands, 1987. [Google Scholar]
  10. Daniels, K.E.; Kollmer, J.E.; Puckett, J.G. Photoelastic force measurements in granular materials. Rev. Sci. Instrum. 2017, 88, 051808. [Google Scholar] [CrossRef]
  11. Takahashi, T.; Clark, A.H.; Majmudar, T.; Kondic, L. Granular response to impact: Topology of the force networks. Phys. Rev. 2018, 97, 012906. [Google Scholar] [CrossRef]
  12. Abed Zadeh, A.; Bares, J.; Brzinski, T.A.; Daniels, K.E.; Dijksman, J.; Docquier, N.; Everitt, H.O.; Kollmer, J.E.; Lantsoght, O.; Wang, D.; et al. Enlightening force chains: A review of photoelasticimetry in granular matter. Granul. Matter 2019, 21, 83. [Google Scholar] [CrossRef]
  13. Hartley, R.R.; Behringer, R.P. Logarithmic rate dependence of force networks in sheared granular materials. Nature 2003, 421, 928–931. [Google Scholar] [CrossRef]
  14. Hayman, N.W.; Ducloue, L.; Foco, K.L.; Daniels, K.E. Granular controls on periodicity of stick-slip events: Kinematics and force-chains in an experimental fault. Pure Appl. Geophys. 2011, 168, 2239–2257. [Google Scholar] [CrossRef]
  15. Behringer, R.P.; Chakraborty, B. The physics of jamming for granular materials: A review. Rep. Prog. Phys. 2018, 82, 012601. [Google Scholar] [CrossRef] [PubMed]
  16. Amini, N.; Tuohey, J.; Long, J.M.; Zhang, J.; Morton, D.A.; Daniels, K.E.; Hapgood, K.P. Photoelastic stress response of complex 3D-printed particle shapes. Powder Technol. 2022, 409, 117852. [Google Scholar] [CrossRef]
  17. Huang, S.; Mahabadi, N.; Tao, J. Penetration and Relaxation in Dry Granular Materials: Insights from Photoelasticity. Geo-Congr. 2022, 2022, 130–139. [Google Scholar] [CrossRef]
  18. Zhang, D.; Cui, H.; Lei, Z.; Zhang, X.; Wang, Z.; Bai, Y.; Zhao, H. Soil arching effect of composite piles supporting foundation pits based on mechanical model and photoelastic experiment. Opt. Lasers Eng. 2023, 168, 107644. [Google Scholar] [CrossRef]
  19. Mesnager, M. Sur la determination optique des tensions interieures dans les solides a trois dimensions. Comptes Rendus 1930, 190, 1249. [Google Scholar]
  20. Zandman, F.; Redner, S.S.; Riegner, E.I. Reinforcing effect of birefringent coatings. Exp. Mech. 1962, 2, 55–64. [Google Scholar] [CrossRef]
  21. Ramesh, K. Digital Photoelasticity: Advanced Techniques and Applications, 1st ed.; Springer-Verlag: Heidelberg, Germany, 2000. [Google Scholar]
  22. Ajovalasit, A.; Barone, S.; Petrucci, G. Towards RGB photoelasticity: Full-field automated photoelasticity in white light. Exp. Mech. 1995, 35, 193–200. [Google Scholar] [CrossRef]
  23. Ramesh, K.; Deshmukh, S.S. Three fringe photoelasticity-use of colour image processing hardware to automate ordering of isochromatics. Strain 1996, 32, 79–86. [Google Scholar] [CrossRef]
  24. Ajovalasit, A.; Petrucci, G.; Scafidi, M. Photoelastic analysis of edge residual stresses in glass by automated “test fringes” methods. Exp. Mech. 2012, 52, 1057–1066. [Google Scholar] [CrossRef]
  25. Ajovalasit, A.; Petrucci, G.; Scafidi, M. Review of RGB photoelasticity. Opt. Lasers Eng. 2015, 68, 58–73. [Google Scholar] [CrossRef]
  26. Briñez-de León, J.C.; Restrepo, M.A.; Branch, B.J.W. Computational analysis of Bayer colour filter arrays and demosaicking algorithms in digital photoelasticity. Opt. Lasers Eng. 2019, 122, 195–208. [Google Scholar] [CrossRef]
  27. Ramesh, K.; Sasikumar, S. Digital photoelasticity: Recent developments and diverse applications. Opt. Lasers Eng. 2020, 135, 106186. [Google Scholar] [CrossRef]
  28. Park, K.H.; Jung, Y.H.; Kwak, T.Y. Effect of initial granular structure on the evolution of contact force chains. Appl. Sci. 2019, 9, 4735. [Google Scholar] [CrossRef]
  29. Park, K.H.; Jung, Y.H. Quantitative detection of contact force chains in a model particle assembly using digital RGB photoelastic measurements. KSCE J. Civ. Eng. 2020, 24, 63–72. [Google Scholar] [CrossRef]
  30. Park, K.H.; Baek, S.H.; Jung, Y.H. Investigation of arch structure of granular assembly in the trapdoor test using digital RGB photoelastic analysis. Powder Technol. 2020, 366, 560–570. [Google Scholar] [CrossRef]
  31. Maxwell, J.C. On the equilibrium of elastic solids. Proc. R. Soc. Edinb. 1851, 2, 294–296. [Google Scholar] [CrossRef]
  32. Byeon, B.H.; Jung, J.H. Measurement of stress and displacement fields in particle assembly subjected to shallow foundation loading via photoelasticity technique. KSCE J. Civ. Environ. Eng. Res. 2013, 33, 1947–1955. [Google Scholar] [CrossRef]
  33. Jung, Y.H.; Jung, J.W. Visualizing force-chain buckling in stress and displacement fields of granular assembly using photoelastic measurement. In Geo-Congress 2014: Geo-Characterization and Modeling for Sustainability; ASCE: Reston, VA, USA, 2014; pp. 751–760. [Google Scholar] [CrossRef]
  34. Shin, S.Y.; Jung, J.H. Evaluation of the Effect of Initial Condition of the Granular Assembly on the Bearing Capacity of the Shallow Foundation using Photoelastic Measurement Technique. KSCE J. Civ. Environ. Eng. Res. 2016, 36, 471–491. [Google Scholar] [CrossRef]
  35. Shin, S.Y.; Jung, J.H.; Kim, T. Investigation of the Change of Soil Arch Structure in Model Particle Assembly Subjected to Displacing Trapdoor via Photoelastic Measurement Technique. J. Korean Geotech. Soc. 2016, 32, 31–40. [Google Scholar] [CrossRef]
  36. Copper and copper alloy rods and bars. KS D5101; Korean Industrial Standards: Seoul, Republic of Korea, 1986.
  37. Petrie, E.M. Handbook of Adhesives and Sealants; McGraw-Hill Education: New York, NY, USA, 2007. [Google Scholar]
  38. Kumar, P.; Hariprasad, M.P.; Menon, A.; Ramesh, K. Experimental study of dry stone masonry walls using digital reflection photoelasticity. Strain 2020, 56, e12372. [Google Scholar] [CrossRef]
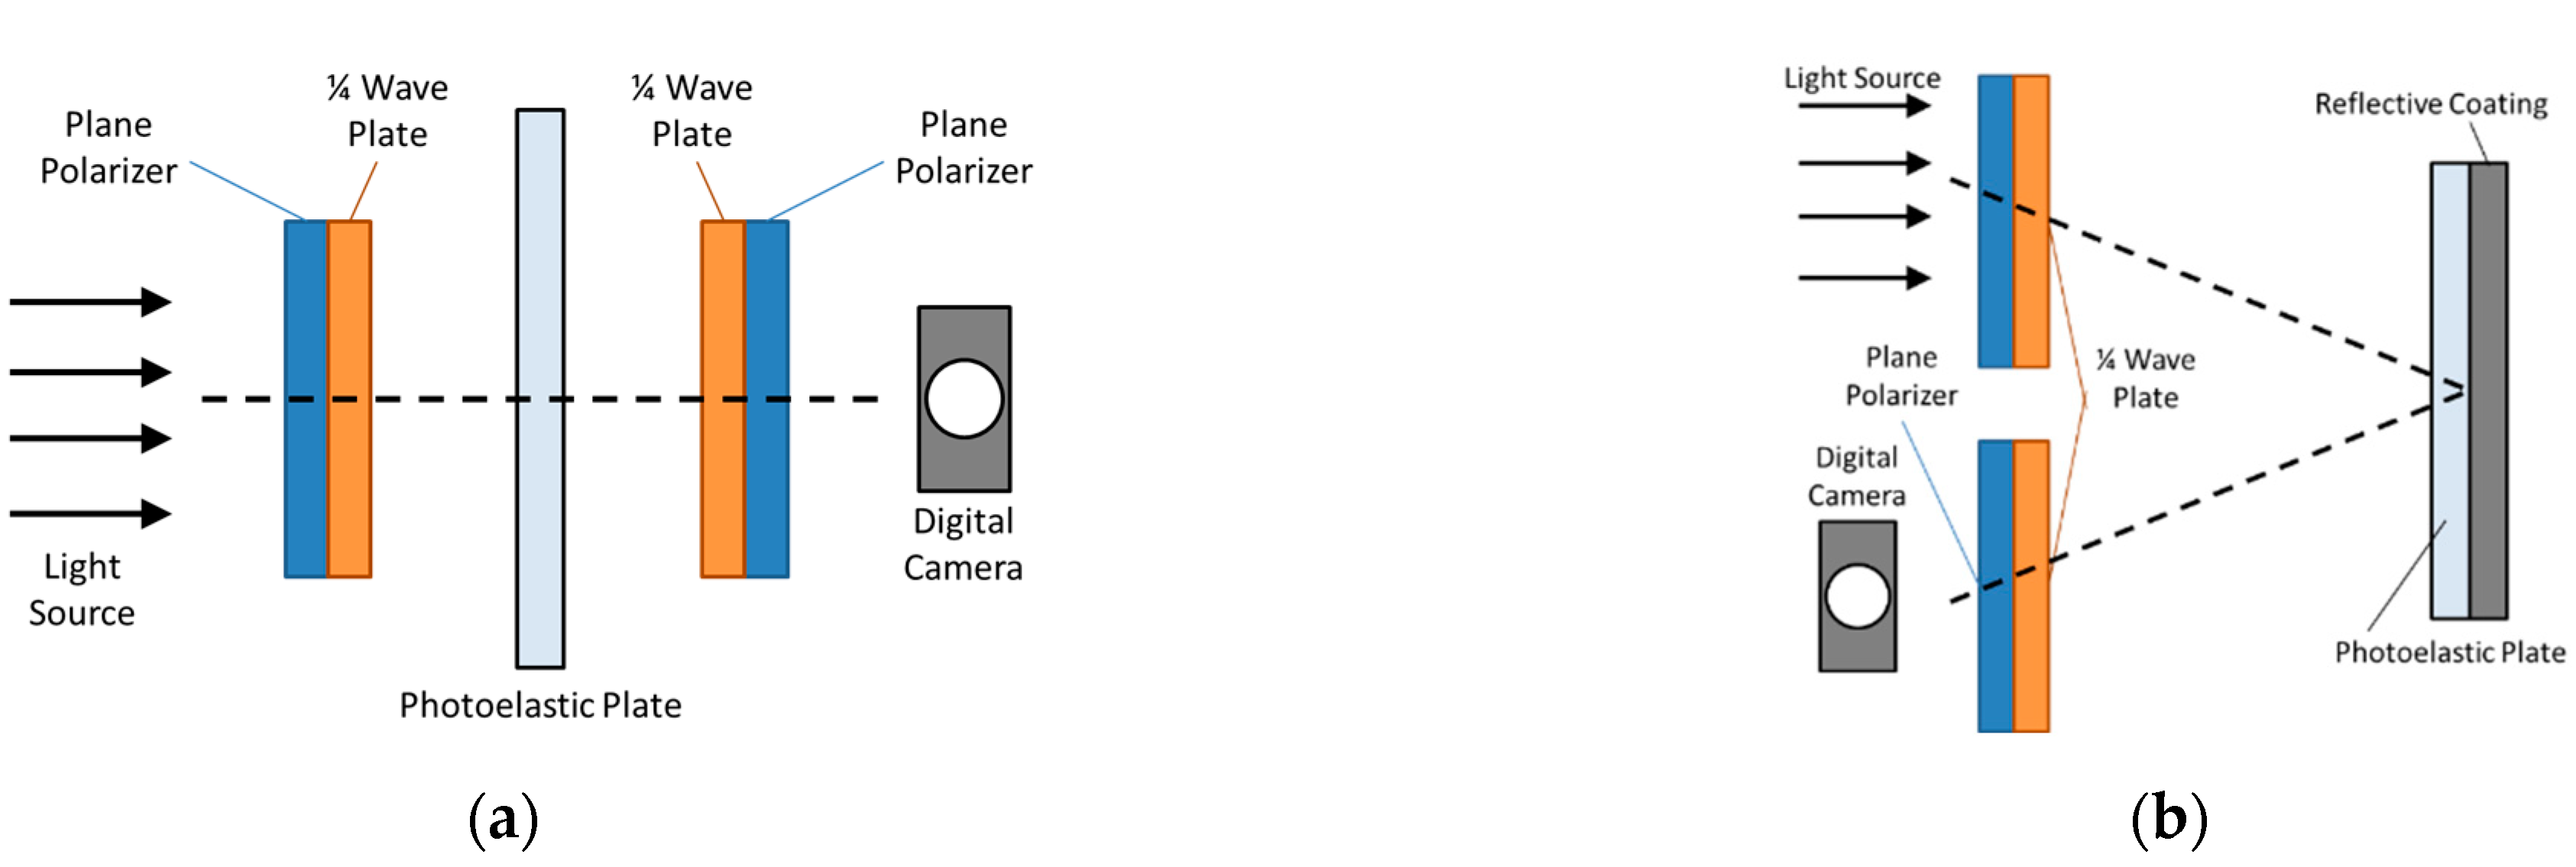
Figure 1. Different types of photoelastic measurement techniques: (a) transparent method; (b) reflective method.
Applsci 13 10628 g001
Figure 2. Photoelastic experiment flow chart.
Applsci 13 10628 g002
Figure 3. Spectral power distribution: (a) white light; (b) RGB LED.
Applsci 13 10628 g003
Figure 4. Dimension of the model particle with the reflective photoelastic sheet.
Applsci 13 10628 g004
Figure 5. Uniaxial compression test.
Applsci 13 10628 g005
Figure 6. The range to obtain the light intensity value.
Applsci 13 10628 g006
Figure 7. Change in the full color of the photoelastic sheet attached to the soil particle model.
Applsci 13 10628 g007
Figure 8. Change in the red color (R) intensity of the photoelastic sheet attached to the soil particle model.
Applsci 13 10628 g008
Figure 9. Change in the green color (G) intensity of the photoelastic sheet attached to the soil particle model.
Applsci 13 10628 g009
Figure 10. Change in the blue color (B) intensity of the photoelastic sheet attached to the soil particle model.
Applsci 13 10628 g010
Figure 11. R-value distribution of the photoelastic particles at various loading levels: (a) Instant glue; (b) Epoxy A; (c) Epoxy B; (d) Epoxy C.
Applsci 13 10628 g011
Figure 12. G-value distribution of the photoelastic particles at various loading levels: (a) Instant glue; (b) Epoxy A; (c) Epoxy B; (d) Epoxy C.
Applsci 13 10628 g012
Figure 13. B-value distribution of the photoelastic particles at various loading levels: (a) Instant glue; (b) Epoxy A; (c) Epoxy B; (d) Epoxy C.
Applsci 13 10628 g013
Figure 14. Interquartile ranges of the RGB values for the photoelastic particles with different types of adhesives: (a) R-value; (b) G-value; (c) B-value.
Applsci 13 10628 g014
Figure 15. R-value distribution of the photoelastic particles at various loading levels: (a) white light, AWB; (b) white light, NWB; (c) RGB LED, AWB; (d) RGB LED, NWB (AWB = auto white balance, NWB = non-white balance).
Applsci 13 10628 g015
Figure 16. G-value distribution of the photoelastic particles at various loading levels: (a) white light, AWB; (b) white light, NWB; (c) RGB LED, AWB; (d) RGB LED, NWB (AWB = auto white balance, NWB = non-white balance).
Applsci 13 10628 g016
Figure 17. B-value distribution of the photoelastic particles at various loading levels: (a) white light, AWB; (b) white light, NWB; (c) RGB LED, AWB; (d) RGB LED, NWB (AWB = auto white balance, NWB = non-white balance).
Applsci 13 10628 g017
Figure 18. Comparison of the RGB value distribution for the four cases: (a) R-value; (b) G-value; (c) B-value.
Applsci 13 10628 g018
Figure 19. Interquartile ranges of the RGB values for the photoelastic particles with different light sources and the white balance function: (a) R-value; (b) G-value; (c) B-value.
Applsci 13 10628 g019
Figure 20. Average interquartile ranges of the RGB values for the photoelastic particles according to the following cases: (a) R-value; (b) G-value; (c) B-value.
Applsci 13 10628 g020
Table 1. Material properties of the adhesives.
TypesTensile Strength
(MPa)
Tensile Elongation
(%)
Shear Strength
(MPa)
Specific Gravity
(g/L)
Viscosity
(Pa.s)
ResinHardener
Instant glue--15~251.10Non-drip gel
Epoxy A39822.61.0340~905.5~8
Epoxy B359301.0067.57
Epoxy C4110301.1041~612~4
Table 2. Specification of the photoelastic coating sheet.
Model
No.
Strain
Optical
Coefficient, K
Elongation
(%)
Elastic Modulus,
E
(GPa)
Poisson’s RatioThickness
(mm)
Max Usable Temperature
(°C)
PS-1 Sheet0.15052.50.381( ± 0.06)150
Table 3. Test conditions.
Test ConditionAdhesivesLight SourceAuto White Balance
Case 1Instant glueWhite lightOff
Case 2Epoxy AWhite lightOff
Case 3Epoxy BWhite lightOff
Case 4Epoxy CWhite lightOff
Case 5Epoxy BWhite lightOn
Case 6Epoxy BWhite lightOff
Case 7Epoxy BRGB LEDOn
Case 8Epoxy BRGB LEDOff
Disclaimer/Publisher’s Note: The statements, opinions and data contained in all publications are solely those of the individual author(s) and contributor(s) and not of MDPI and/or the editor(s). MDPI and/or the editor(s) disclaim responsibility for any injury to people or property resulting from any ideas, methods, instructions or products referred to in the content.