Abstract
Typically, emergency bells are security facilities that, when activated, trigger an alarm and immediately dispatch a police car to prevent crime. However, there currently exists an ambiguity in the criteria for emergency bell installation. Consequently, this study aims to find an optimal location for emergency bells whilst considering several factors like cumulative crime incidents. In particular, we exploited emergency bell location data, data on five major crimes, and the geographic information of administrative dongs (primary division of districts) in this study. Specifically, we performed correlation analysis, principal component analysis, and K-means clustering for exploratory data analysis. To effectively cover all 17,437 crimes, which are not covered by the existing emergency bells in Gwangju metropolitan city from 2018 to 2021, the results from the implementation of the emergency bell location set-covering problem revealed the need for about 6228 emergency bells. More precisely, the emergency bell maximal covering location problem was employed to derive the coverage percentage for 250, 500, 800, 1000, and 1500 emergency bells. The results showed that 2850 emergency bells were required to cover over 80% of crime occurrence coordinates, saving over half of the budget compared with covering them all. Overall, this study is noteworthy in its potential role as a roadmap for the optimal placement of emergency bells for future crime prevention.
1. Introductions
In Korea, emergency bells play a crucial role in crime prevention and are frequently deployed alongside closed-circuit television camera (CCTV, also known as surveillance camera) systems. With the growing installation of CCTV and emergency alarm systems in densely populated urban areas, there has been an increase in camera placement research [1]. Likewise, investigation on the optimal placement of emergency bells is also an urgent need.
Consistent with the Republic of Korea’s guidelines to create a safe street environment, the following criteria should be considered in the placement of emergency bells. First, street areas with high crime potential, such as school roads and blind alleys, should be identified and installed in an eye-catching place with an easily recognizable design. The emergency bell should link with police stations and CCTV cameras. Second, the emergency bell should be designed to operate with a warning light or alarm sound when the emergency bell is triggered, making it easily noticeable from a distance. Third, the emergency bell should be installed at a height accessible for children to reach and activate it easily [2].
Furthermore, studies have shown that CCTV cameras can be effective in preventing criminal activities [3,4]. However, the CCTV camera alone is not capable of promptly addressing crimes that occur in its field of view. In particular, while research on CCTV is actively being performed in the domain of crime prevention through environmental design (CPTED) [5,6,7], the research on emergency bells is still in its cradle.
Specifically, the emergency bell system comprises a communication box, a broadcasting terminal, a hub, a modem, a speaker, and a CCTV. The communication box is connected to a CCTV-integrated control center through a dedicated CCTV network. Additionally, the broadcasting terminal, which is a voice-over-internet protocol (VoIP) device, transmits the signal from the emergency bell to the 112 emergency response centers. Precisely, the hub connects the VoIP broadcasting device to the emergency bell, while the modem establishes the connection between the VoIP broadcasting device and the internet [8].
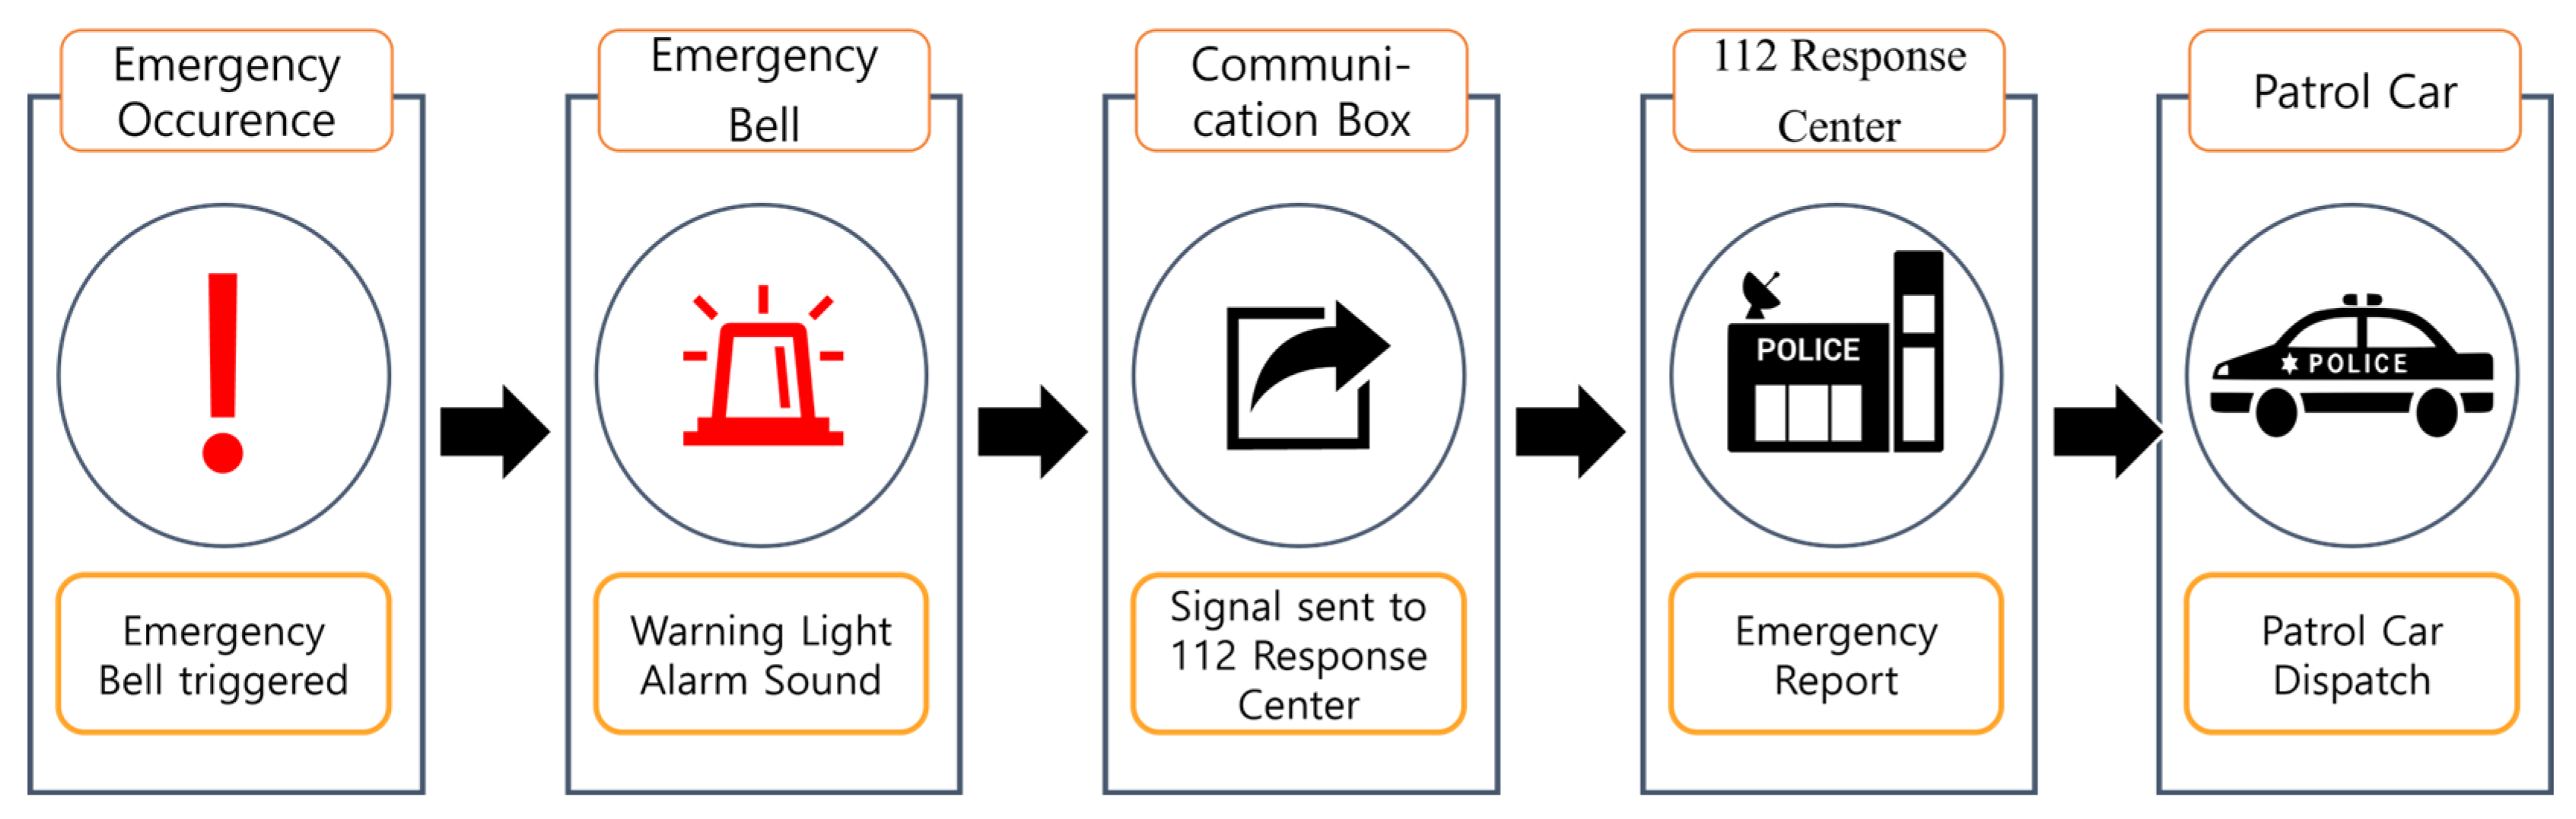
Interestingly, the installation of emergency bells is a critical component of crime prevention, as it enables immediate response through a system. An activation of the bell triggers a warning light or alarm with a report sent to the 112 emergency response centers, initiating the dispatch of a patrol car (Figure 1).
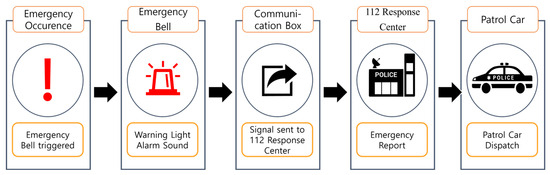
Figure 1.
Emergency bell operation process.
Meanwhile, the implementation of emergency bell systems to prevent crime is increasing in South Korea. Incheon City, for example, has been proactively installing emergency bells in crime-prone areas such as parks, public toilets, and civil complaint areas since 2014. Additionally, according to the revised act on public toilets, safety emergency bells must be installed in designated public restrooms starting from 20 July 2023 [9].
Furthermore, surveillance areas, applied to community safety planning activities, can effectively eliminate the possibility of criminal activity and reduce the fear of crime. Despite the establishment of individual guidelines by local governments for emergency bell installations, there is no clear strategy for their optimal placement.
Recently, several studies on optimal locations using spatial analysis techniques such as geographic information systems (GIS), spatial statistics, and spatial optimization are in progress. In this sense, studying the optimal location for emergency bell installations is necessary to effectively investigate the balance between the benefits and potential costs.
The objective of this study is to investigate the spatial distribution patterns of the emergency bells in Gwangju and subsequently employ a visibility analysis and spatial optimization method, utilizing actual data, to identify the most optimal location for emergency bells. This study highlights the importance of emergency bells and identifies the factors that influence their placement. By combining GIS with the mathematical models of maximal covering location problem (MCLP) and location set covering problem (LSCP), the optimal locations for emergency bells can be determined based on real-world data. Finally, this study compares the cost-effectiveness of installing emergency bells throughout the entire grid, as well as at optimal locations determined by the emergency bell maximal covering location problem (EBMCLP) and emergency bell location set covering problem (EBLSCP). Overall, this analysis provides valuable insights for policymakers and urban designers.
2. Related Work
In this section, an analysis of previous studies related to principal component analysis (PCA), K-means, MCLP and LSCP was conducted.
To consider the optimal placement of emergency bells, this study extracted ten significant variables from a pool of 27 variables, simplifying the complexity of the dataset. For the dimensionality reduction of the ten significant variables, PCA was conducted. PCA is a statistical methodology that has been actively employed in various fields for data analysis [10,11,12] since its inception by Karl Pearson in 1901 [13]. The PCA simplifies the complexity of high-dimensional data while preserving trends and patterns. It accomplishes this by transforming data into a lower dimension, serving the purpose of summarizing features [14].
K-means, introduced by MacQueen in 1967 [15], is a widely used unsupervised clustering method. It partitions a set of objects into k clusters, aiming for low intercluster similarity and high intracluster similarity, typically represented by the mean values of objects within each cluster [16]. In this study, PCA and K-means were utilized for dimensionality reduction and clustering of the data [17], allowing for analyzation of the administrative districts corresponding to the high-level cluster.
Meanwhile, unlike other types of sensors characterized by hierarchical interconnection [18] and data transmission techniques [19], CCTV cameras require a flat structure and do not employ data coding techniques. Interestingly, the optimization of coverage has remained the main concern in CCTV camera deployment. Optimal location problems determine the most efficient placement of facilities while considering budget constraints. For example, the LSCP, which was proposed by Toregas [20], and the MCLP, introduced by Church and ReVelle [21], have received significant attention due to their wide application range.
Although LSCP and MCLP models have existed for some time, recent advancements in computing power have enabled the application of these models to big data. Simultaneously, the availability of geographic visualization programs has facilitated their active and recent utilization.
These methodologies have been applied in various fields, including schools, police stations, fire stations, ambulances, hospitals, post offices, and even advertisements [22,23,24,25]. The objective of MCLP is to place a fixed number of facilities to maximize the coverage of demanded points. Meanwhile, LSCP aims to deploy the minimum number of facilities necessary to achieve the complete coverage of demanded points [25].
There has been a growing interest in analyzing location-based problems by utilizing GIS. In particular, Murray outlined the interconnections between location analysis and GIS, emphasizing how GIS has contributed to the field of location science in terms of data entry, visualization, problem-solving, and theoretical advancements [26]. In another study, Alexandris and Giannikos proposed the MCLP model, which incorporates the concept of complementary partial coverage [27]. Specifically, they utilized GIS to enhance the visual representation of locations. With the use of GIS, solutions for MCLP and LSCP can be displayed on a map, and various analyses can be conducted based on the visualizations.
The study of optimal location has garnered significant attention in the fields of geography and has progressed through the application of mathematical models. However, only a few studies have focused on the issue of emergency bell location for crime prevention. This highlights the necessity of this study.
3. Materials and Methods
In this section, emergency bell location data and crime data were collected from sources such as the Gwangju Metropolitan City Hall. Exploratory data analysis (EDA) was conducted through correlation analysis and PCA for dimension reduction. The EBMCLP/EBLSCP methods were then employed to determine the optimal locations for emergency bells.
We initially conducted a correlation analysis on the original 27 variables. Ten significant variables were extracted after excluding variables with significance levels exceeding 0.05. Subsequently, we performed PCA to reduce dimensionality, resulting in three principal components. Using these three principal components, we conducted K-means clustering to classify administrative districts into three groups: low-level, intermediate-level, and high-level. This classification was based on the number of crimes, which exhibited the highest correlation with the number of emergency bells. Therefore, to derive the weights (wi) for EBMCLP, we utilized the variable number of crimes. Moreover, we preassigned (F) as the number of new emergency bells with values of 250, 500, 800, 1000, and 1500.
The optimal location for installing a new emergency bell in Gwangju has been determined to be outside the current range of the emergency bell monitoring system. To determine the optimal location, we collected population data for a 100 × 100 (m2) grid of each administrative dong and performed data cleaning procedures. An administrative dong is a primary division of districts, which refers to the smallest administrative unit in South Korea, typically located in districts (gu). It plays a crucial role in various administrative functions, including population registration, address management, and electoral processes [28]. Specifically, EDA was conducted to select important variables. Meanwhile, PCA and correlation analysis were conducted to extract features relevant to the installation of emergency bells. Consequently, these variables were used to determine the optimal location through spatial optimization models EBMCLP and EBLSCP. The results were displayed on a map.
3.1. Data Collection and Processing
In this section, detailed descriptions of all datasets utilized in this study are provided.
Data used for this study are as shown in Table 1. Particularly, data was collected from various sources, including Gwangju metropolitan city hall, Korea Telecom (KT), the national land information platform, and the statistical geographic information service. More precisely, the data analysis was conducted using open-source tools, including Python (Ver 3.9.7), QGIS (Ver 3.16), and RStudio (Ver 4.2.1). The Gwangju city hall provided data on the location of emergency bells and the cumulative status of five major crimes. These data were collected as of January 2022 and contained information on the models of emergency bells, their installation locations, and corresponding coordinates. The cumulative status of five major crimes was recorded from 2015 to September 2021, including information about the type of crime and the specific location where it occurred.

Table 1.
List of dataset files and their descriptions.
Furthermore, since the address information provided in the five major crime datasets only allows for a limited specification of crime locations in the GIS program, geocoding was utilized to convert the address data into a coordinate form. Particularly, the transient population status is a dataset that can be purchased from KT, a leading mobile telecommunications service provider in South Korea. Precisely, the information on the transient population status is classified by time zones for each administrative dong, and data from 2021 were used for the analysis. In addition, the total transient population was stratified by transient population between 18:00 and 6:00 and transient population between 7:00 and 17:00.
Meanwhile, the data on resident population and building types were obtained from the national land information platform in the form of shp files. More precisely, the data for each 100 × 100 (m2) grid in five districts in Gwangju were provided and combined with the above data using QGIS. The combined data was exported as a csv file and preprocessed using the R programming language. Subsequently, the final datasets for each grid and administrative dong were extracted. Finally, the EBMCLP and EBLSCP were considered by utilizing the variables such as the cumulative total of crimes, crime locations, and existing emergency bell locations to determine the optimal location for the emergency bells with Python (Ver 3.9.7).
3.2. GIS (Geographic Information System)
In this section, the GIS software, tools used for coordinate extraction, and the method employed to calculate the surveillance range of CCTV and emergency bells are introduced.
In spatial data analysis, geocoding refers to the process of extracting latitude and longitude coordinates from address data. Particularly, the extracted data enable improved visualization and analysis. Python offers numerous geocoding techniques, such as Geocoder and GeoPy. Additionally, the use of the Pandas module also facilitates geocoding processing [29].
In this study, geocoding was used to convert the address information provided in the five major crime datasets into coordinates. More precisely, the GIS program, QGIS (Ver 3.16), was utilized to integrate the datasets for analysis based on the grid from the geographic information of the administrative dong. As a result, a 50 m buffer was realized based on the obtained coordinates of the CCTV cameras and emergency bells. Subsequently, the area of the buffer that fell within the 100 × 100 (m2) grid was calculated to determine the surveillance area.
3.3. Exploratory Data Analysis and Statistical Analysis
In this section, as part of EDA, we conducted a correlation analysis to extract ten significant variables with high correlations from the initial set of 27 variables. Additionally, using PCA, we obtained three principal components. Reflecting the results of PCA, we employed K-means clustering to divide administrative districts into three clusters based on the variables number of emergency bells and number of crimes.
3.3.1. Correlation Analysis
In this subsection, a correlation analysis was conducted to identify significant variables associated with the major crime incidence index as a part of the EDA. Additionally, descriptions for each variable were described.
Correlation analysis plays a crucial role in examining the relationships between different factors. By exploring these connections among variables, valuable insights into the decision-making process for selecting the ideal variable for bell location can be obtained.
The National Police Agency categorizes the five major crimes as murder, robbery, theft, violence, and sexual harassment [30,31]. Specifically, the major crime index was calculated by dividing the number of incidents of the five major crimes in each grid by the total number of the five major crimes in Gwangju.
The focus was initially on the number of crimes occurring within each grid, enabling the calculation of the Major Crime Index, which reflects the grid-level crime situation in comparison to the entire Gwangju Metropolitan City. Subsequently, a correlation analysis was conducted among 27 variables to elucidate their relationships. However, 17 variables, including the Major Crime Index, were found to be statistically insignificant and were thus excluded from the analysis. The results indicated that ten variables were significantly correlated with a p-value of less than 0.05. Consequently, an in-depth investigation was carried out into the correlations among these 10 variables.
The variable “Num.CCTV” represents the number of CCTV installations. The variable “Num.Bell” represents the number of emergency bell installations. The variable “Float.pop.D” denotes the sum of the transient population during daytime hours from 07:00 a.m. to 05:00 p.m. The variable “Float.pop.N” represents the sum of the transient population during nighttime hours from 06:00 p.m. to 06:00 a.m. The variable “Pop.Woman” stands for the total female population within the studied region. The variable “Fac.Build” represents the total number of buildings. The variable “Num.Crime” represents the total number of reported crimes. The variable “Request.CCTV” indicates the number of requests for the installation of additional CCTV systems. The variable “Area.Building” refers to the spatial extent of buildings within the study area. It was derived by summing up the spatial building area of each grid for administrative dongs. The variable “Area.CCTV” represents the coverage area or surveillance range of the installed CCTV systems. To determine the variable “Area.CCTV,” a 50 m buffer zone around each CCTV was created for each 100 × 100 (m2) grid cell. The corresponding percentage coverage for the entire administrative dong was then calculated. This area of CCTV surveillance within each grid was then calculated using QGIS.
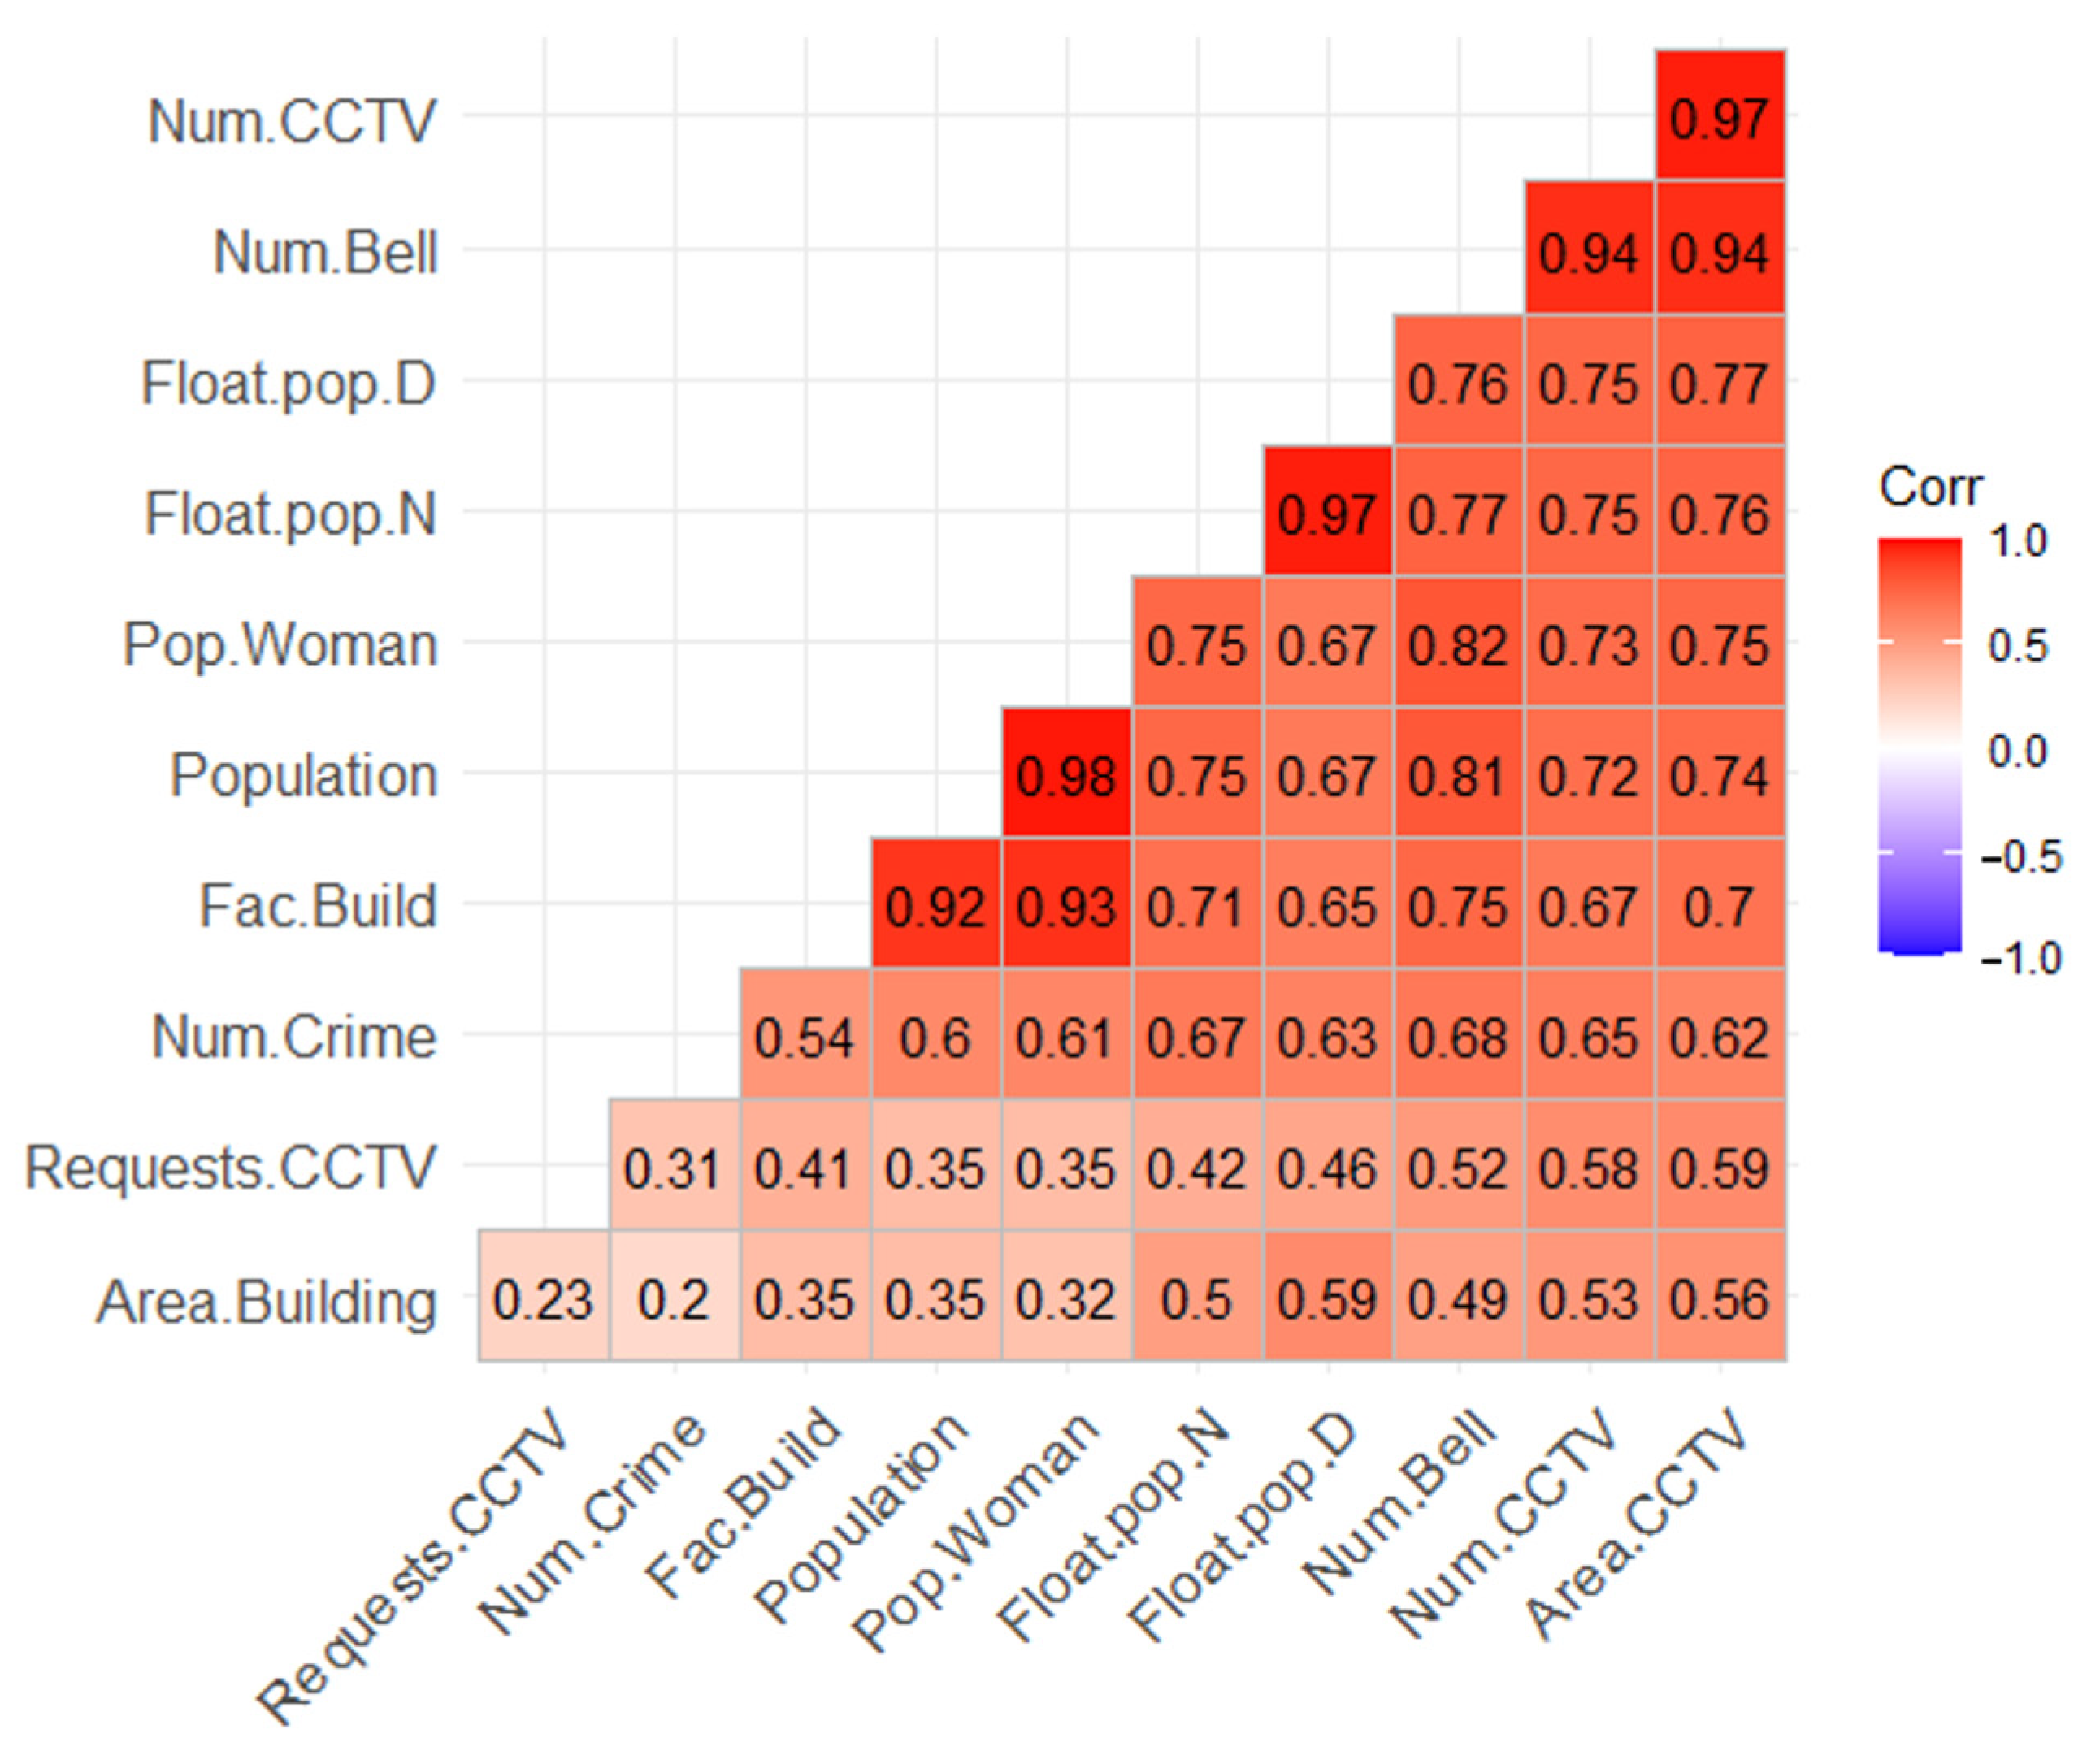
As shown in Figure 2, these variables included the number of emergency bells (r = 0.6836); the transient population during the hours of 06:00 p.m. to 06:00 a.m. (r = 0.6706); the number of CCTV cameras (r = 0.6537); the transient population during the hours of 07:00 a.m. to 05:00 p.m. (r = 0.6338); the CCTV surveillance area (r = 0.6176); total population (r = 0.6104); total female population (r = 0.6104); the number of communal buildings (r = 0.5412); building area (r = 0.2019); and the number of requests for CCTV camera installations (r = 0.3132).

Figure 2.
Heat Map (Correlation matrix). Num.CCTV: Number of CCTVs; Num.Bell: Number of emergency bells; Float.pop.D: Transient population during daytime (07:00 a.m. to 05:00 p.m.); Float.pop.N: Transient population during daytime (18:00 a.m. to 06:00 p.m.); Pop.Woman: Population of women; Fac.Build: Number of buildings; Num.Crime: Number of crimes; Request.CCTV: Requests for CCTVs; Area.Building: Building area; and Area.CCTV: Surveillance area of CCTV.
It was observed that the correlation between the number of emergency bells and the number of CCTV cameras (r = 0.94), and the correlation between the number of emergency bells and the CCTV surveillance area (r = 0.94) were found to be very high. This could be attributed to the frequent installation of emergency bells alongside the CCTV cameras.
3.3.2. Principal Component Analysis
In this subsection, prior to conducting K-means analysis, dimensionality reduction was carried out through PCA to obtain three principal components.
PCA is a statistical technique that reduces high-dimensional correlated data into lower-dimensional uncorrelated data to extract features. Specifically, this method identifies the problem of multicollinearity, which occurs when there is a correlation between independent variables and then aims to reduce dimensionality while minimizing the loss of information and maintaining the high explanatory power of the data.
In this subsection, PCA was employed to improve the efficiency of cluster analysis. The most important cluster derived from K-means clustering was then examined at the administrative dong level.
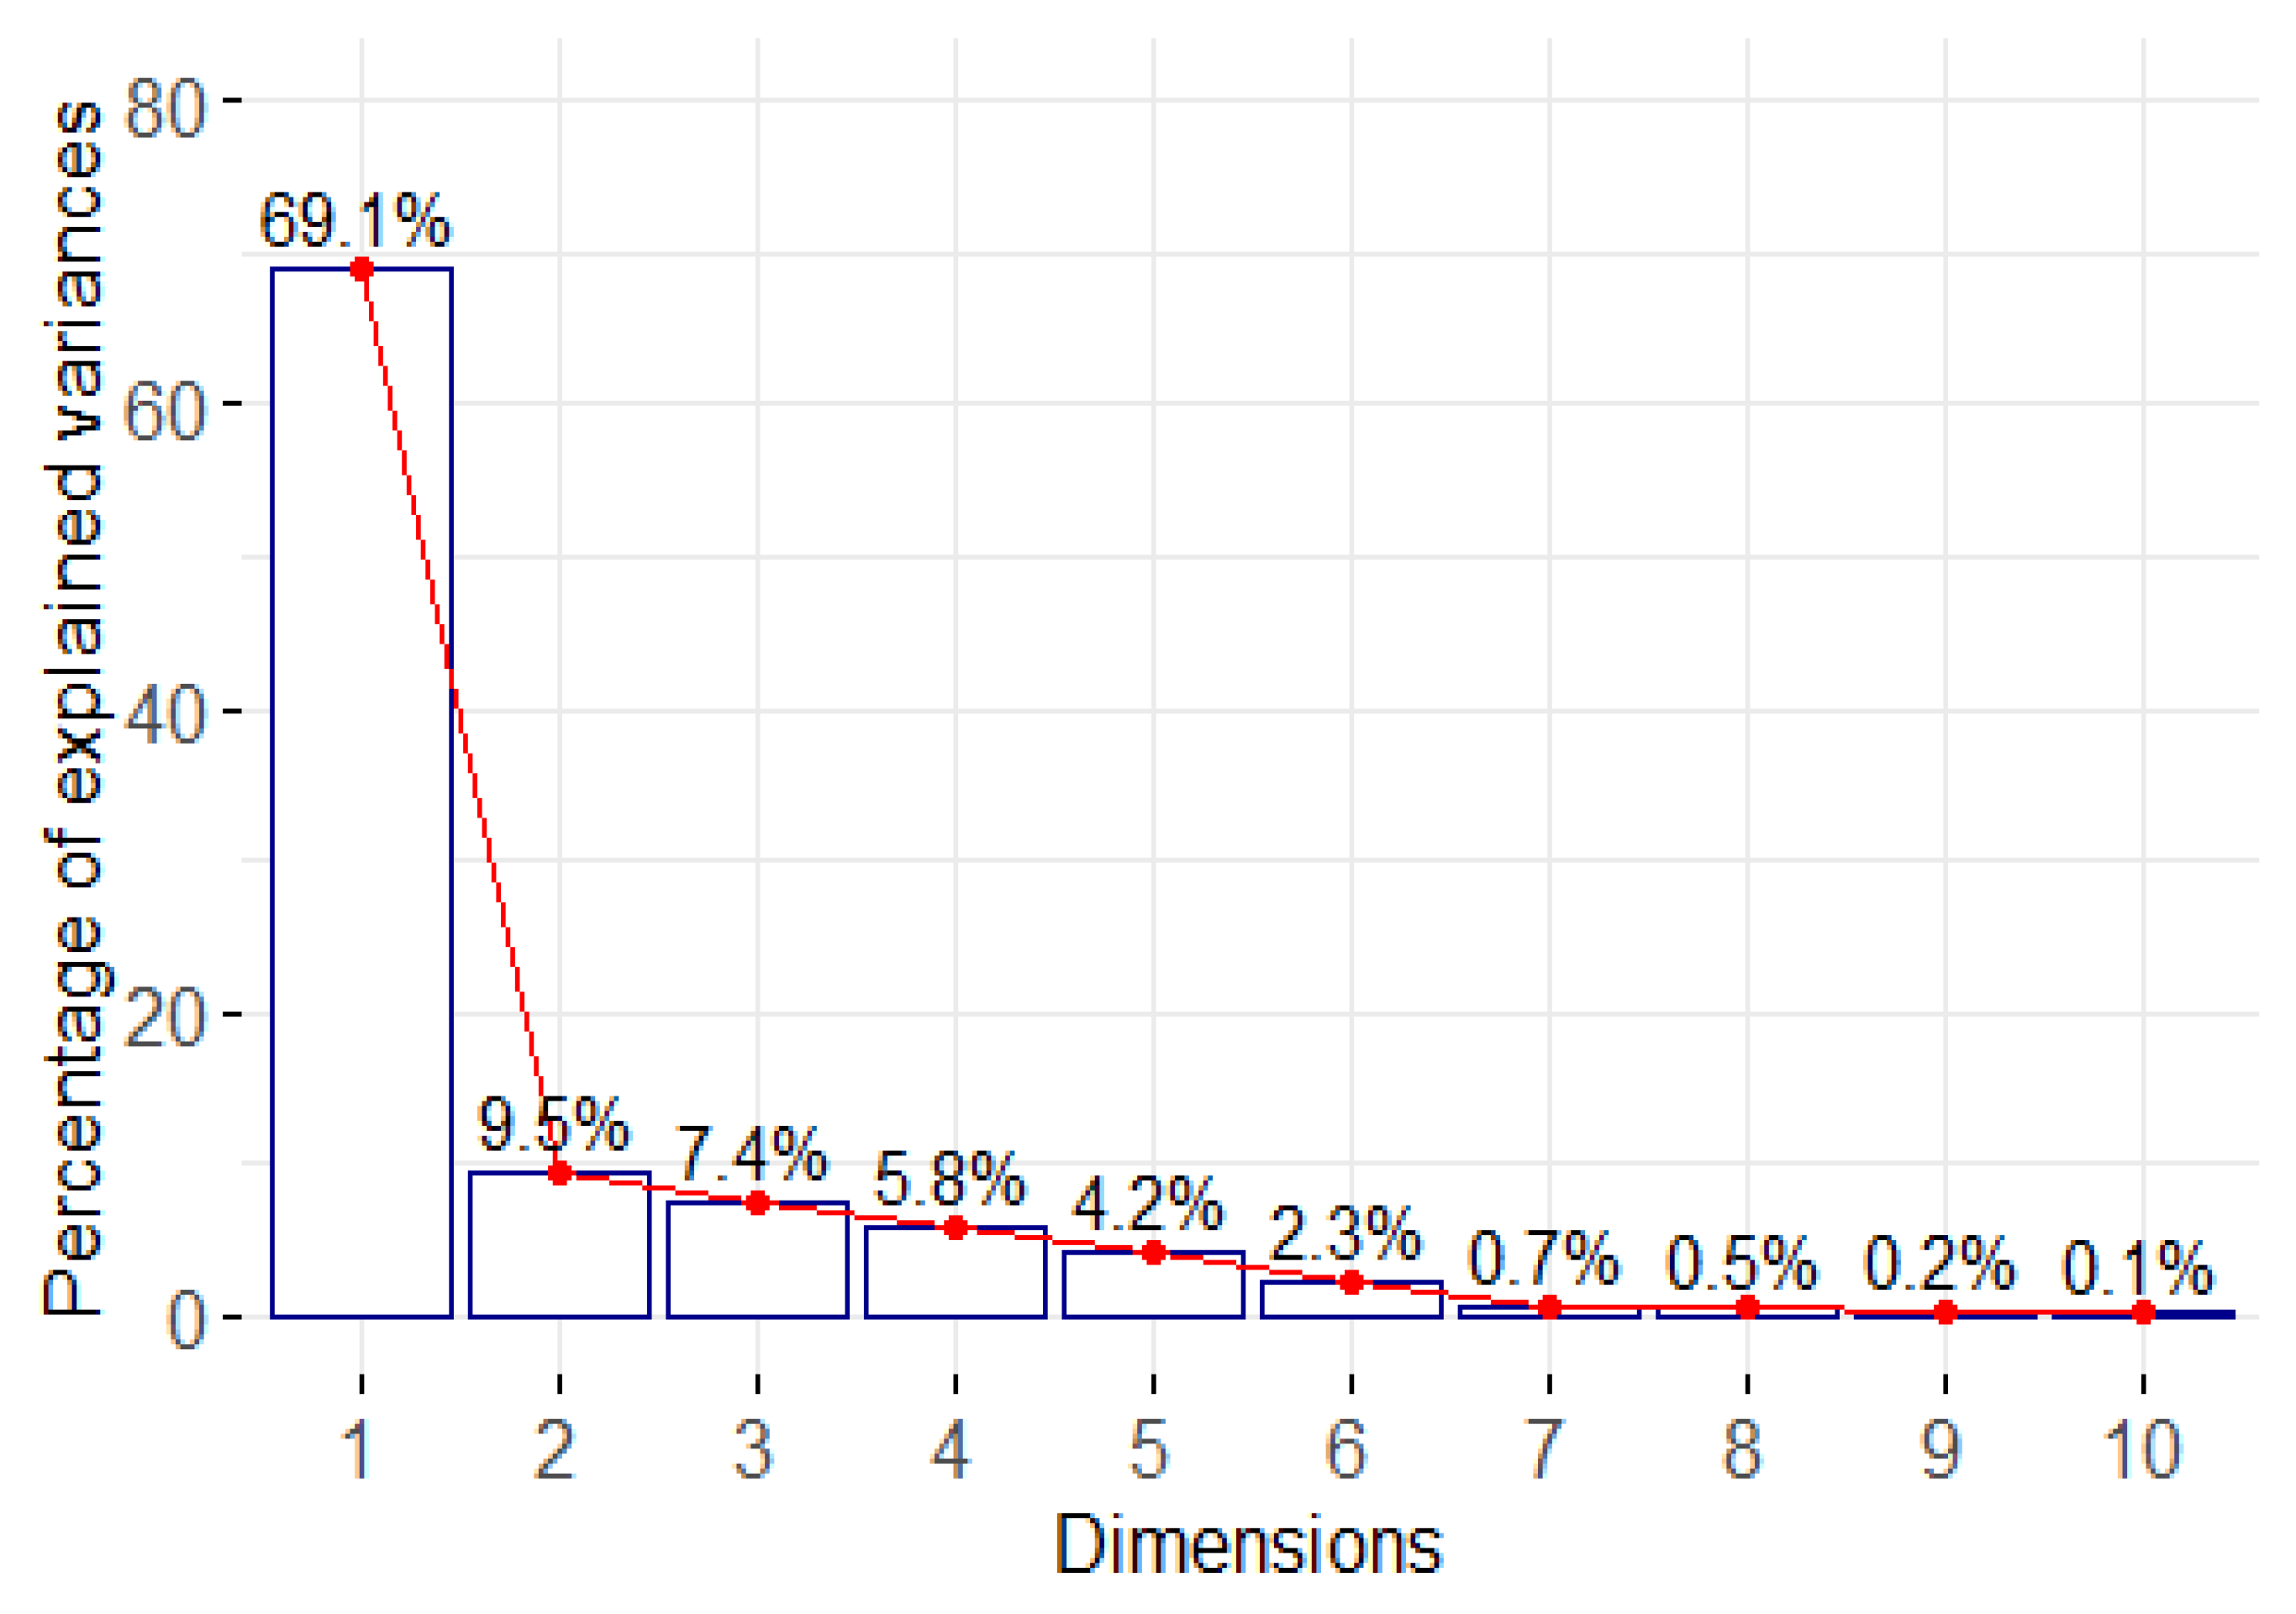
Further, to determine the optimal number of principal components for the analysis, a scree plot was utilized, as shown in Figure 3 and Table 2. The cumulative explained variance of the first three principal components amounted to 0.8602, and beyond this point, the slope of variance thereafter flattened. As a result, it was determined that three principal components were appropriate. In particular, to identify the variables that contribute to each principal component, only those variables with large absolute values of coefficients were selected for analysis.
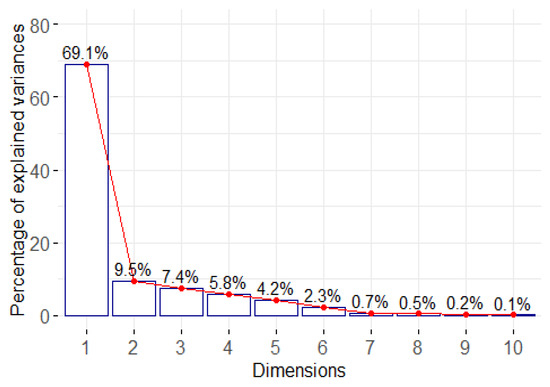
Figure 3.
Scree plot of eigenvalues for principal component analysis.
Table 2.
Importance of components.
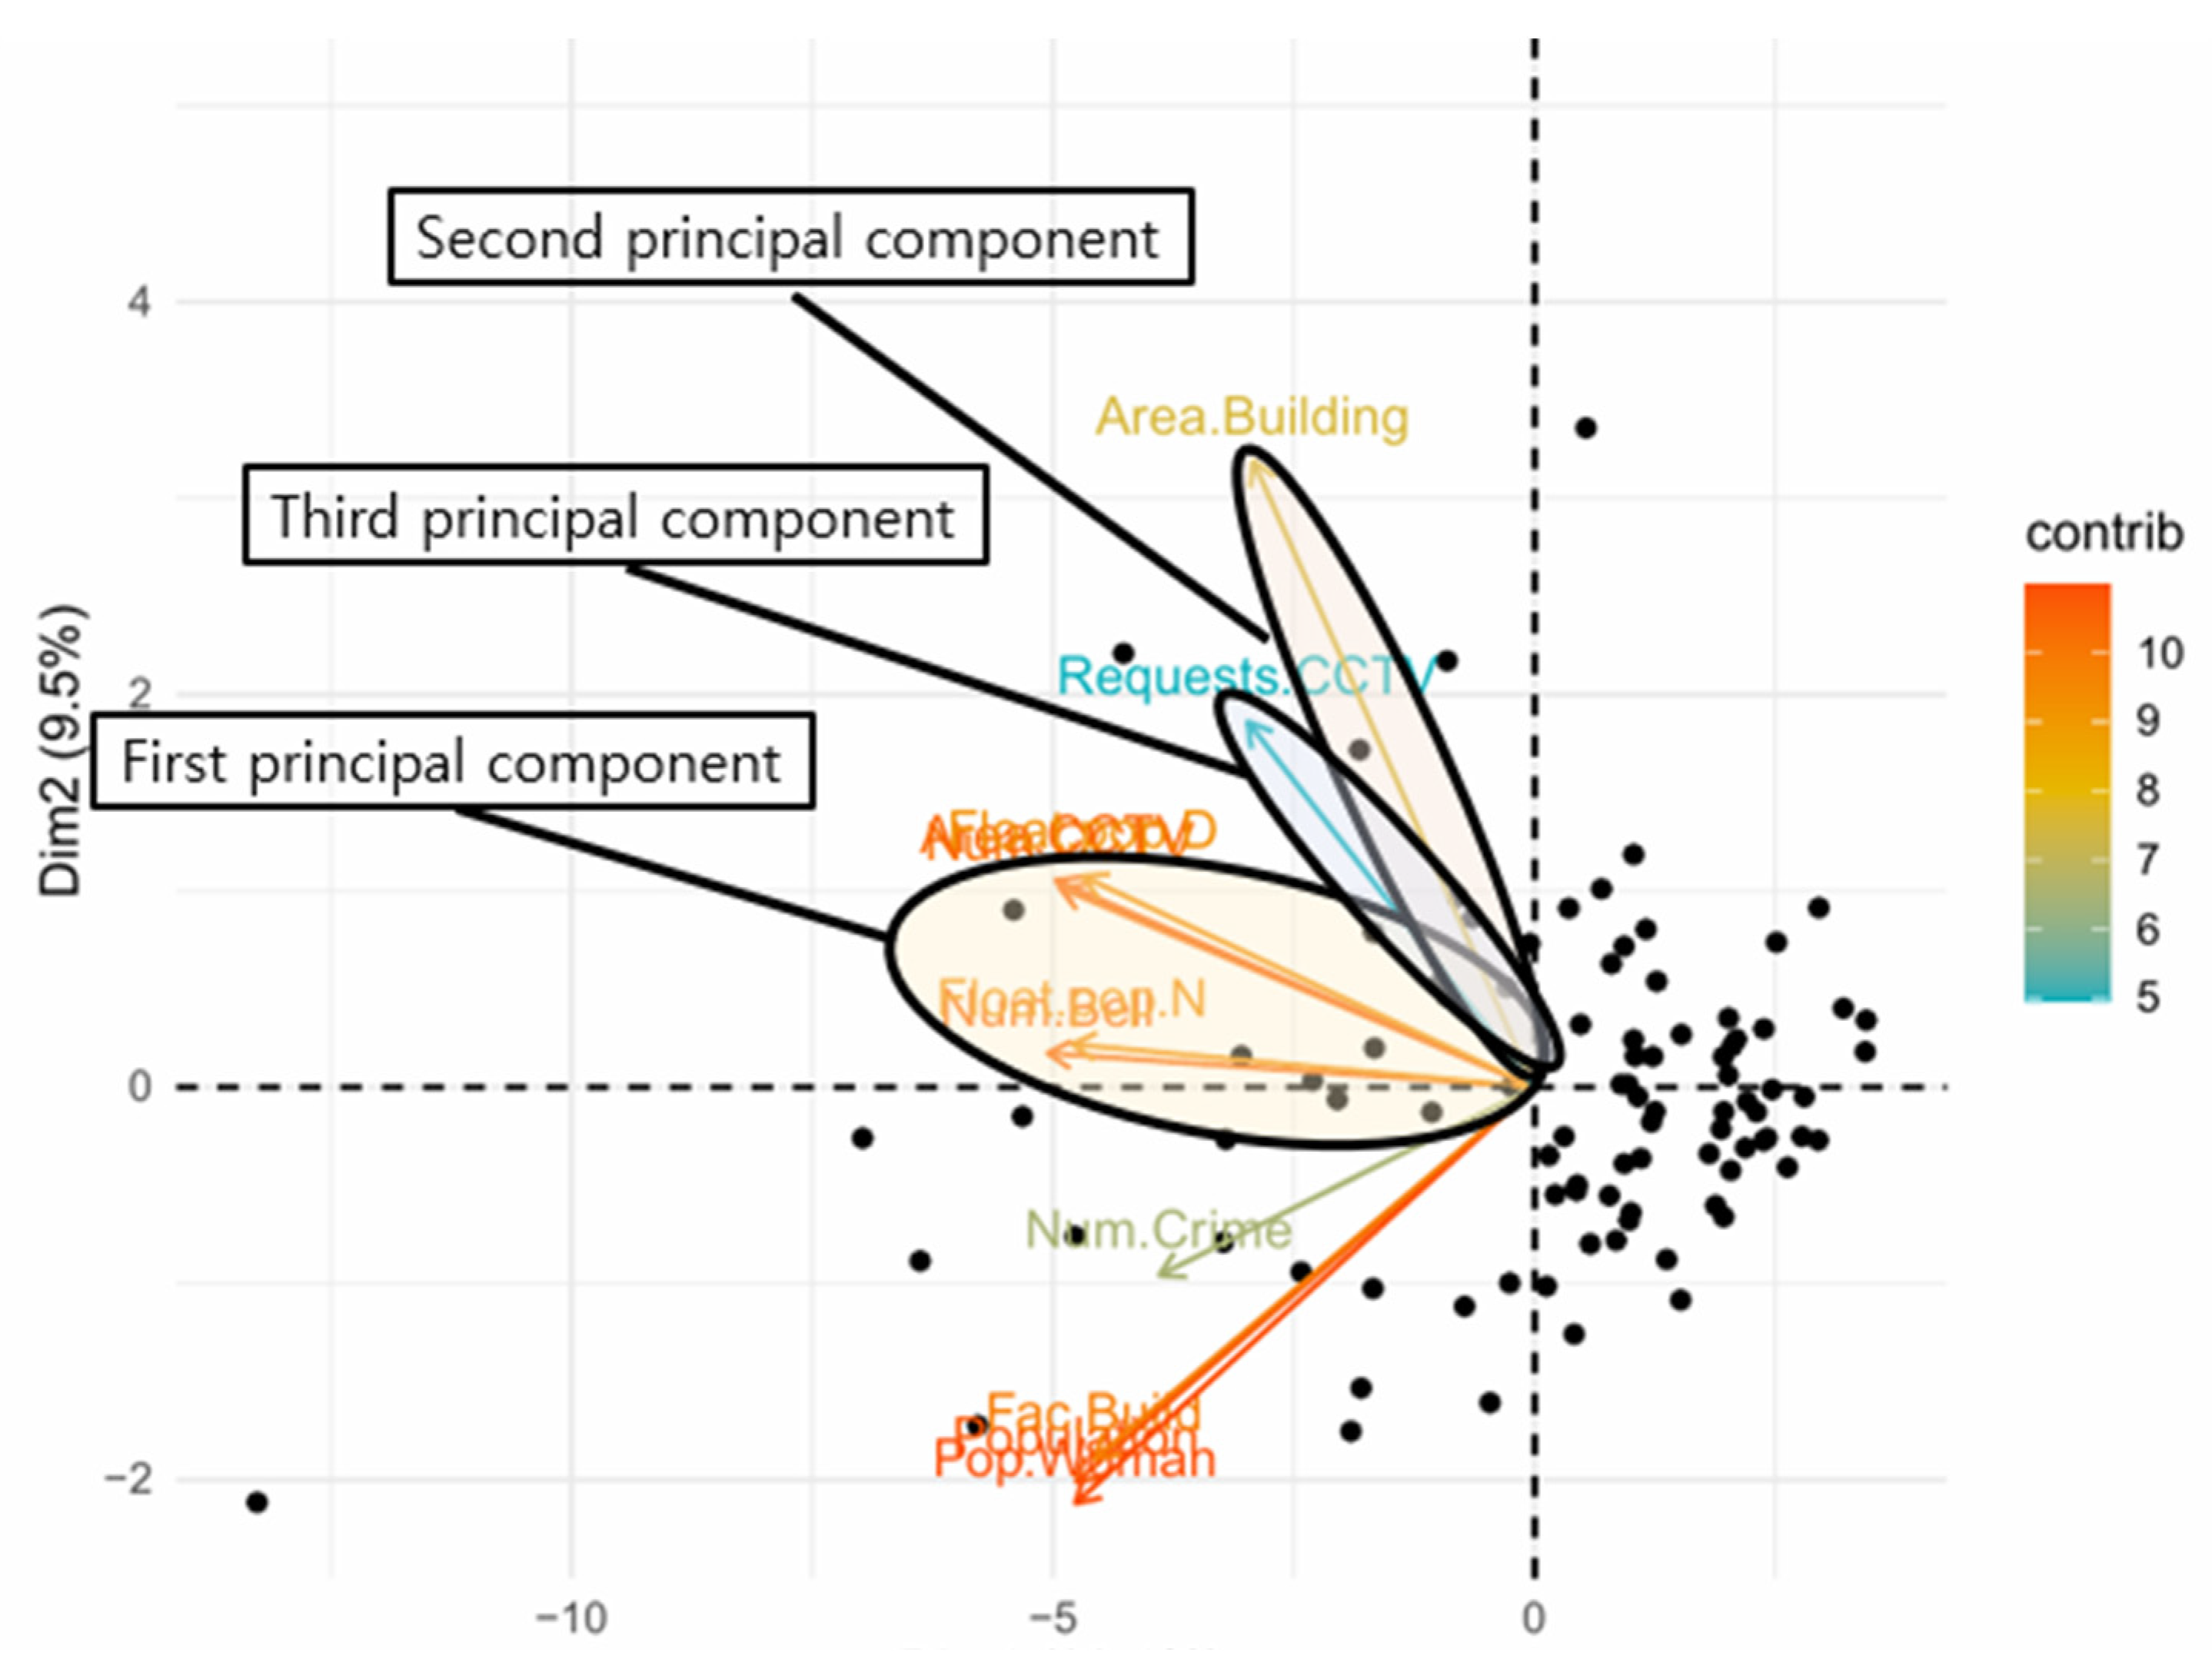
As shown in Figure 4, the first principal component comprised “Number of emergency bells (Num.Bell),” “CCTV surveillance area (Area.CCTV),” “Number of CCTV cameras (Num.CCTV),” “Transient population (07:00–17:00) (Float.pop.D),” and “Transient population (18:00–06:00) (Float.pop.N).” The second principal component comprised the variable “Building area (Area.Building).” The third principal component comprised the variable “Requests for CCTV (Request.CCTV),” and variables that were under zero (Num.Crime, Fac.Build, Population, Pop.Woman) of the Dim2 axis were excluded from the analysis.
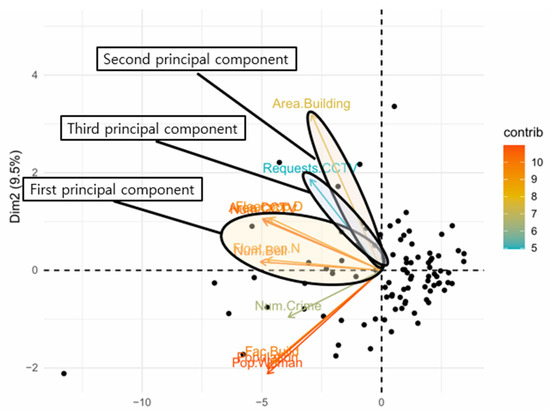
Figure 4.
Biplot of principal component analysis. First component: Num.Bell, Area.CCTV, Num.CCTV, Float.pop.D, Float.pop.N; Second component: Area.Building; Third component: Request.CCTV; Variables that were under zero (Dim2): Num.Crime, Fac.Build, Population, Pop.Woman.
3.3.3. K-Means Clustering
In this subsection, K-means clustering was performed to group by administrative dongs. K-means clustering is a widely adopted unsupervised clustering algorithm that partitions a dataset into K clusters based on the similarity of the data points’ features. Specifically, the algorithm works by minimizing the sum of squared distances between data points and their respective cluster centers. In this study, K-means clustering was performed by using variables derived from the PCA.
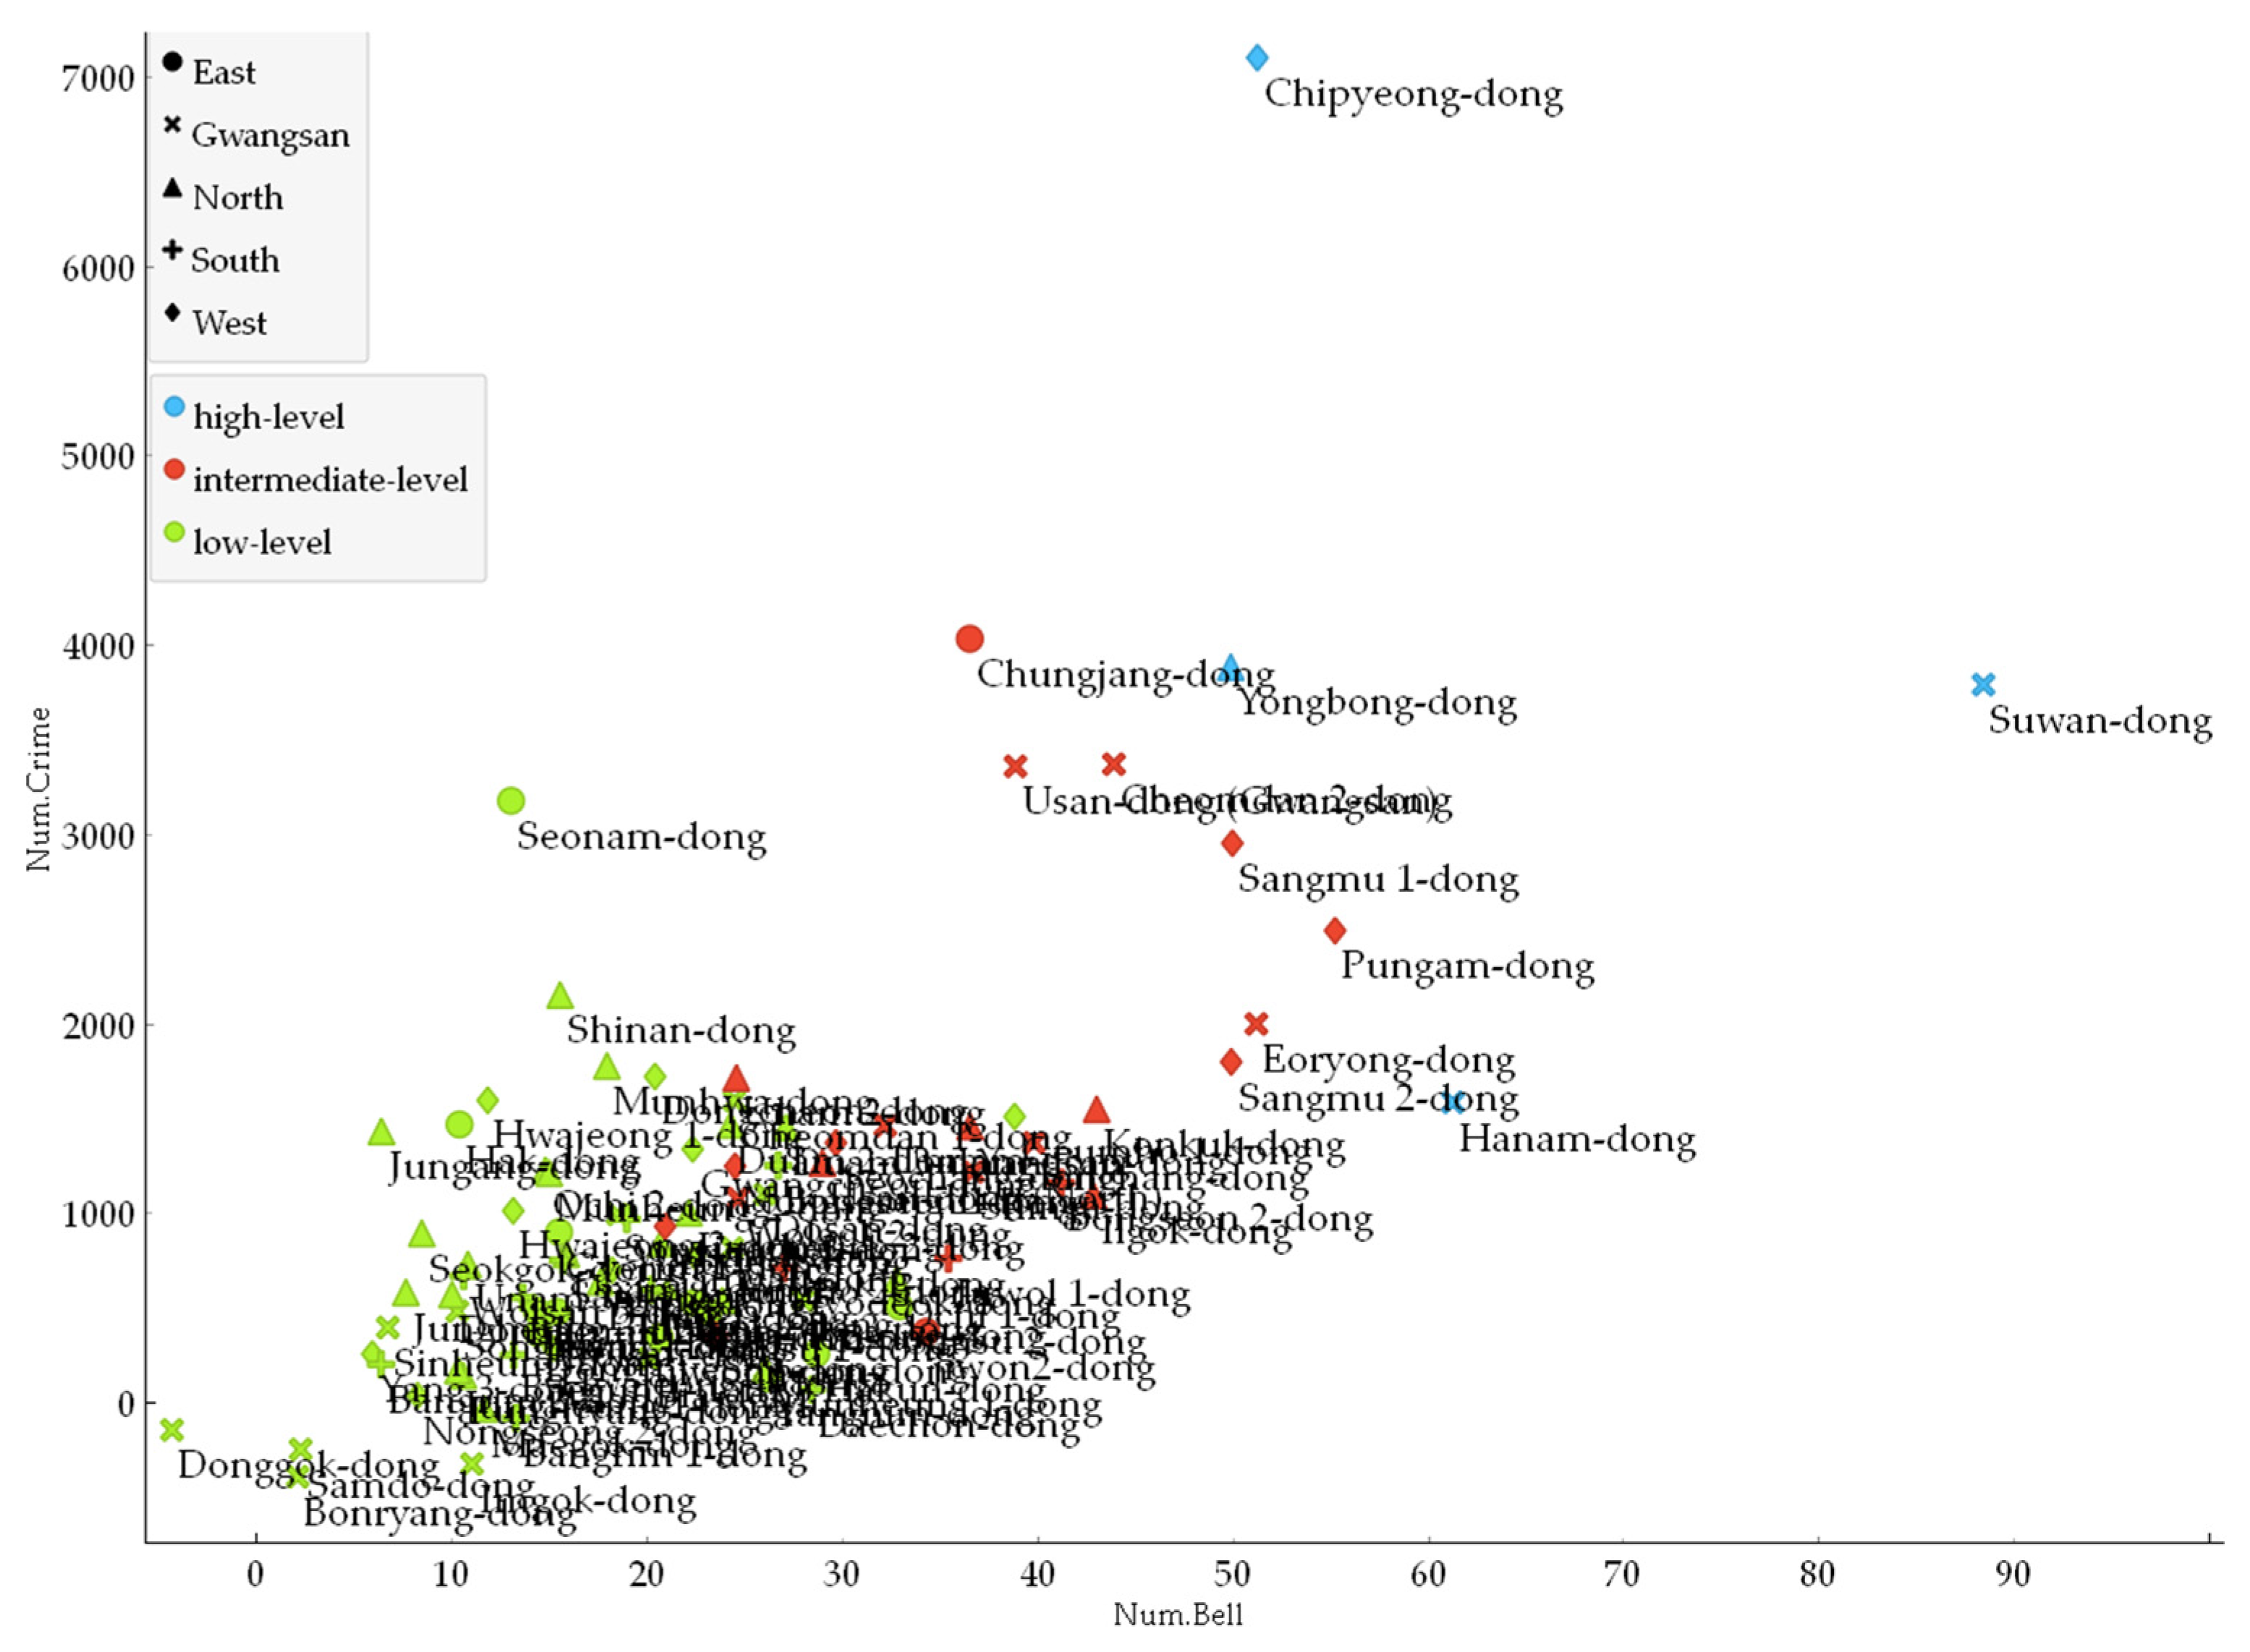
Interestingly, the results indicated that number of crimes and number of emergency bells, respectively, were the most discriminating factors in clustering data. Figure 5 illustrates the clusters divided into low-level, intermediate-level, and high-level based on the variables of number of crimes and number of emergency bells. While East and South districts were mainly located at the intermediate level, they did not appear at the high level.

Figure 5.
K-means cluster by number of crimes (Num.Crime) and number of emergency bells (Num.Bell).
3.4. EBLSCP & EBMCLP
In this subsection, we provide a description of the variables and formulas used for the EBLSCP and EBMCLP models, which were suitable for the optimal location of emergency bells. These models were derived from LSCP and MCLP.
Considering the limitations of the processing memory required to operate EBMCLP and EBLSCP, the scope of the criminal data was limited to crimes committed between 2018 and 2021. The variables used for EBLSCP and EBMCLP are described in Table 3.
Table 3.
The variables for EBMCLP and EBLSCP.
Index set I was generated by crime occurrence locations that were not covered by the existing emergency bells in each district. Set J was generated by regular points with a 25 m interval, intersecting horizonal and vertical lines to cover all possible coordinates in each district’s entire area. For this study, the coverage distance D was set as a 50 m buffer from new emergency bells.
Specifically, EBLSCP aims to determine the minimum number of new emergency bells required to cover all unmonitored crime occurrence coordinates.
Subject to
Equation (2) represents the objective function that minimizes the total number of emergency bells that need to be installed. The expression in Equation (3) explains the case when there is an emergency bell at each candidate location and the distance from the new emergency bell to the crime occurrence location falls within the 50 m buffer. The sum of such cases should be greater than or equal to 1. This constraint ensures that at least one new emergency bell, which covers crime location i, will be installed. Equation (4) defines the role of variable xj as a binary parameter, where xj takes the value of 1 if there is a new emergency bell installed in location j and 0 otherwise.
Meanwhile, EBMCLP aims to identify location alternatives that consider budget constraints and determine the optimal solution by limiting the number of emergency bells to provide the most efficient coverage. The model for EBMCLP applied in this study is as follows.
Subject to
The objective of function (5) is to maximize the number of unmonitored crime occurrences to be covered by the optimal installation of emergency bells. To find the optimal location, the cumulative number of crime occurrences for each I was multiplied as wi. The expression in Equation (6) explains the case when there is an emergency bell at each candidate location and the distance from the new emergency bell to the crime occurrence location falls within the 50 m buffer; The sum of such cases should be greater than or equal to yi. This statement indicates that if yi is 1, then unmonitored crime occurrence coordinates i must be covered by at least one new emergency bell. When yi is 0, in which none of the new emergency bells cover any unmonitored crimes i, the formula can still be maintained. The difference between constraints (3) and (6) arises from a characteristic of EBLSCP and EBMCLP. While EBLSCP seeks to minimize the number of emergency bells needed to cover all unmonitored crimes, EBMCLP aims to maximize the weighted number (frequency) of unmonitored crimes with a fixed number (F) of new emergency bells for cost-effectiveness. In other words, for EBMCLP, not all unmonitored crimes need to be covered by new emergency bells, while EBLSCP must cover all unmonitored crimes. Equation (7) describes the number of new emergency bells as F. Equation (8) serves the same purpose as Equation (4), and Equation (9) defines the role of variable yi as a binary parameter. In this case, yi takes the value of 1 if the distance from new emergency bell j to the location of crime occurrence i is equal to or less than the coverage of the 50 m buffer and 0 otherwise.
EBMCLP and EBLSCP do not significantly differ from traditional MCLP and LSCP models. However, in order to take into account the critical coverage area of emergency bells in this study, we added dij as constraints (3) and (6). Moreover, in contrast to the conventional MCLP model, which primarily considers population as weights, EBMCLP selected the number of crimes as its weights. In comparison to other papers that applied LSCP and MCLP, we have included additional detailed explanations for each variable and formula.
4. Results and Discussion
In this section, we analyze the top cluster of administrative dongs, obtained through the earlier k-means clustering process. We then explore the spatial characteristics of emergency bell installations throughout Gwangju Metropolitan City. GIS software was utilized for visualization and elucidates the ideal positions for emergency bells as determined by EBLSCP and EBMCLP.
4.1. Spatial Characteristics of Emergency Bell
In this subsection, the spatial characteristics of emergency bell installations across Gwangju Metropolitan City were examined by districts. Table 4 shows the installation status of five districts. Specifically, 2317 emergency bells have been previously installed in the metropolitan city of Gwangju. Gwangju is divided into five districts: North, South, West, East, and Gwangsan. Precisely, the North district had the highest number of installations with 600 units, while the East district had the lowest with 272. Because of its low population, the East district had the highest number of emergency bells per 10,000 people (25.89). Meanwhile, the Gwangsan district had a high number of emergency bells (598) but the lowest density of emergency bells per 1 km2 (2.68), considering the population and area characteristics. Despite a considerable budget being allocated for installation of emergency bells in the Gwangsan district, the comprehensive surveillance of the extensive area remained unattainable. Particularly, the low number of emergency bells per 1 km2 in the Gwangsan district indicated that the district should prioritize installing new emergency bells.
Table 4.
Spatial characteristics of emergency bell installation by district.
4.2. Result of K-Means Cluster Analysis
After reducing the number of variables using PCA, the K-means clustering method was employed to analyze the data. A group of administrative dongs with high values for both the number of bells and crime was derived as a high-level cluster from K-means clustering, as shown in Figure 5.
According to Table 5, Suwan-dong was found to have the highest number of emergency bells and CCTV cameras installed. While there was a high demand for CCTV cameras in the area, further examination revealed that Suwan-dong had a high volume of transient population during the daytime (07:00~17:00) and was also one of the districts with a high crime rate. Meanwhile, Hanam-dong, which had the highest volume of transient population during the daytime, was found to be the district with the second-highest number of emergency bells and CCTV cameras, as the transient population during the daytime had a high correlation with the number of emergency bells and CCTV cameras.
Table 5.
The high-level cluster derived through cluster analysis.
Furthermore, Chipyung-dong was identified as an area where crime occurred most frequently among the high-level cluster. Despite having a relatively high number of emergency bells and CCTV cameras in the cluster, the surveillance area received a rating of 0.29, which was relatively low considering the number of crimes committed in the area. Although the number of installation requests for CCTV cameras is the lowest among administrative dongs in the upper cluster, it is still important to consider additional installations of emergency bells and CCTV cameras.
Yongbong-dong was the district with the third highest crime occurrence, following Chipyung-dong and Suwan-dong. Despite the high crime rate of Yongbong-dong, it had the lowest number of emergency bells and CCTV cameras installed among high-ranking clusters. This suggests a potential need to consider installing additional emergency bells or CCTV cameras.
In summary, the analysis of the high-level cluster revealed variations in the installation of emergency bells and CCTV cameras among different administrative dongs. Some districts had a need for these systems more urgently due to their higher crime rates and larger transient populations. However, other factors, such as age demographics, may have also played a role in the implementation of these security measures. Additional research could offer valuable insights into the efficacy of security systems and help pinpoint areas where supplementary installations could bolster public safety.
Employing a clustering technique based on K-means, determining the optimal locations for the top clusters corresponding to administrative districts was considerable. However, restricting the optimal location solely to administrative districts would result in too limited of a scope. Therefore, this study conducted an analysis encompassing the entire city of Gwangju to identify the optimal placement of emergency bells.
4.3. Optimal Location of Emergency Bells
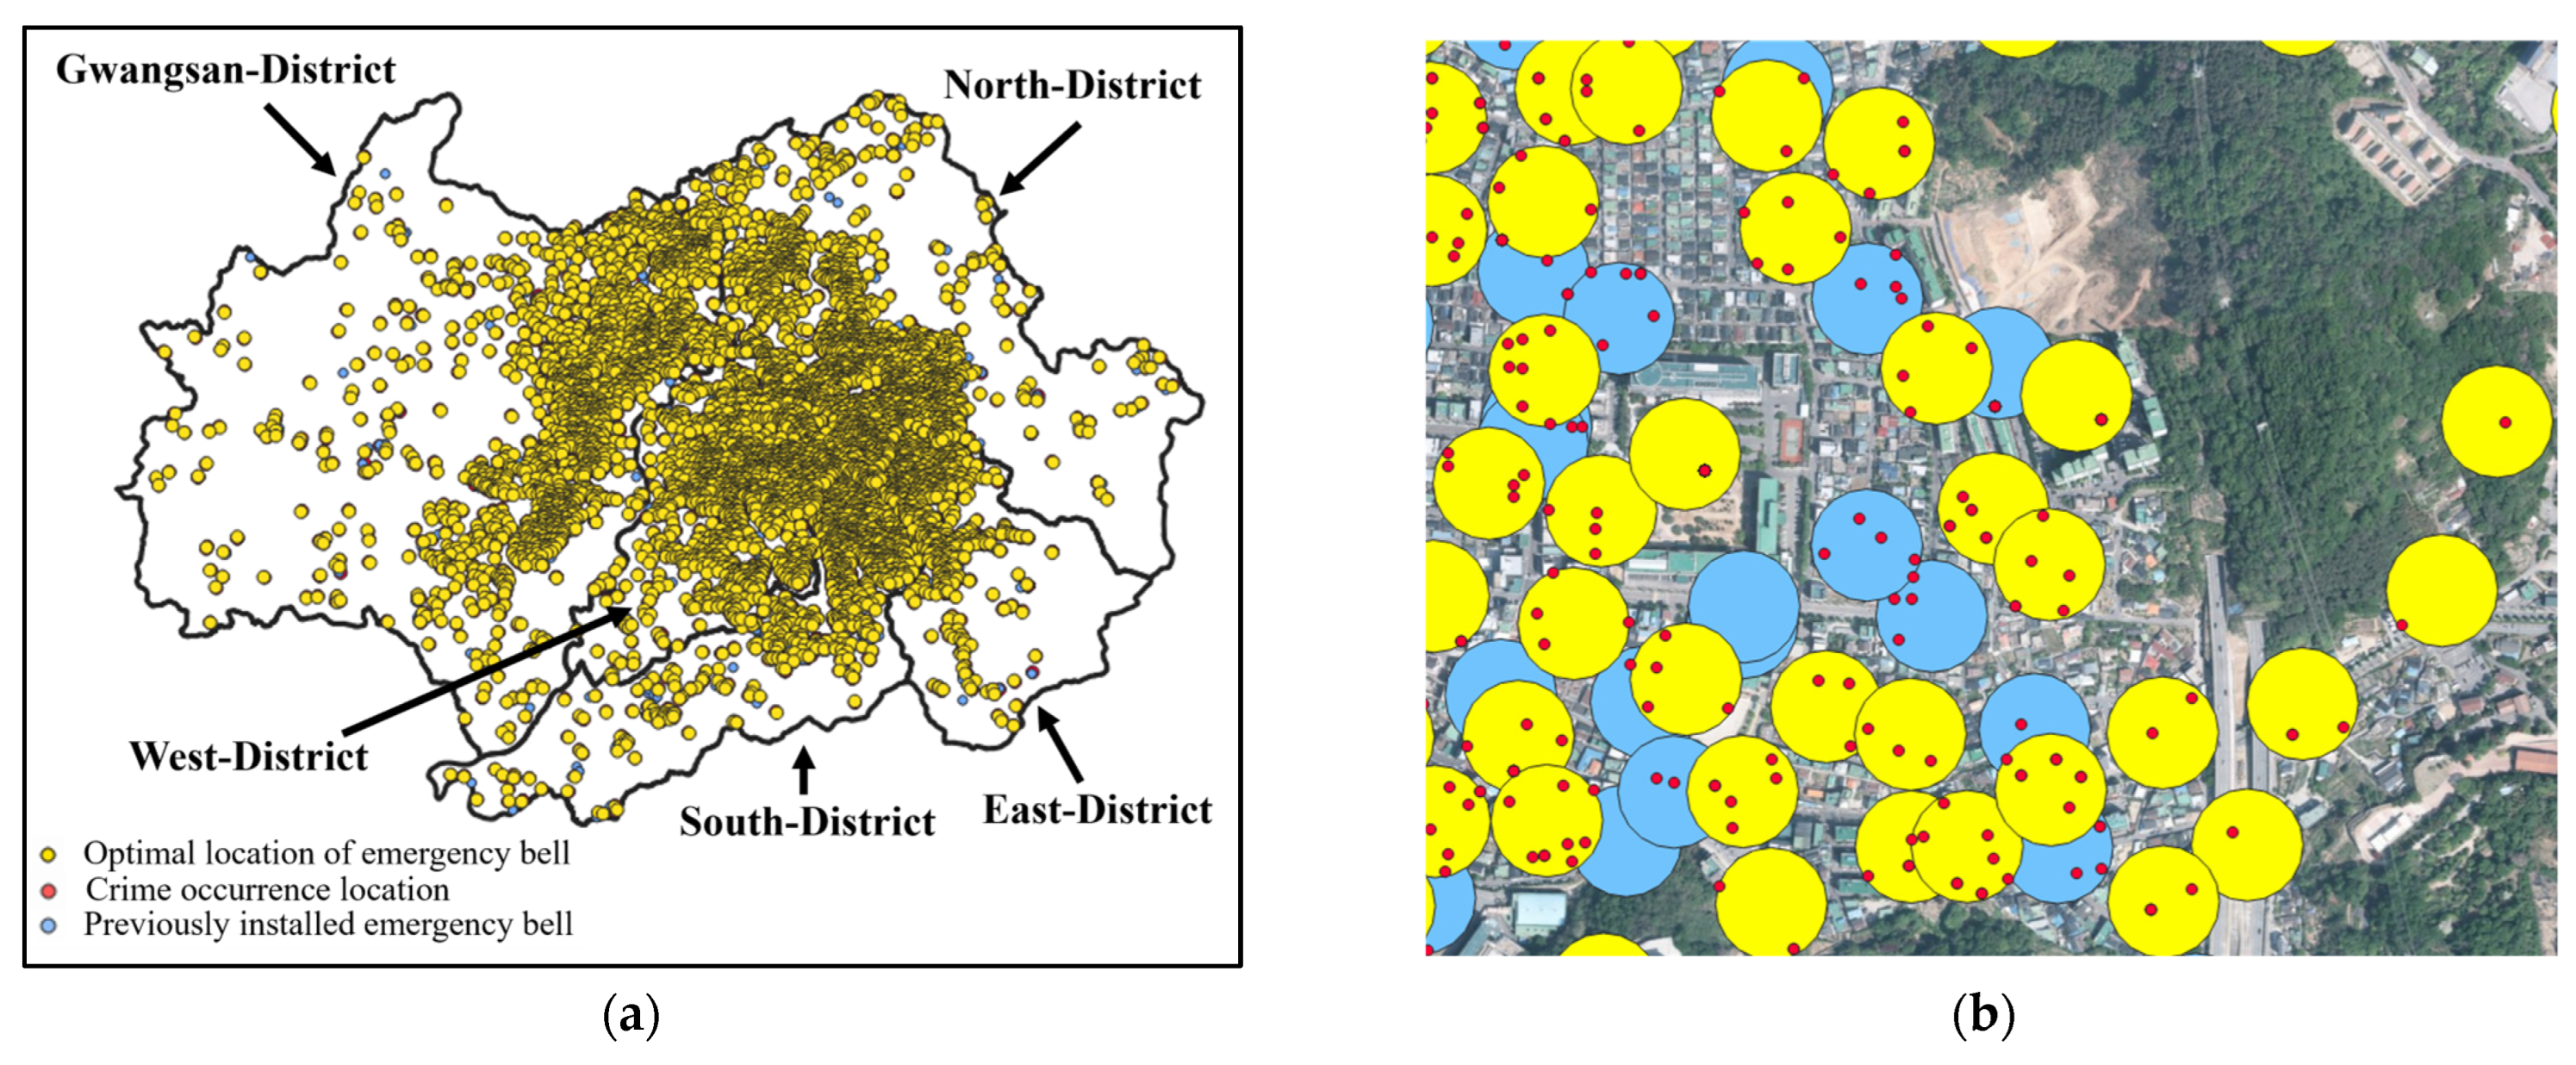
The optimal locations for new emergency bells were determined by considering the existing emergency bells. Based on a surveillance area of 50 m, 17,437 unmonitored crimes were targeted to determine optimal locations for new emergency bells. Precisely, the yellow dots indicate the ideal positions for emergency bells, the red dots represent the coordinates of crime incidents, and the blue dots show where emergency bells have already been installed (Figure 6b).

Figure 6.
(a) EBLSCP result; (b) coverage of existing emergency bells and the optimized bell locations.
4.3.1. EBLSCP
The result of the EBLSCP implementation to cover a cumulative total of 17,437 crimes as shown in Figure 6 is as follows. To achieve complete coverage of all unmonitored crime coordinates, the following numbers of new emergency bells are needed in each district: 1743 in Gwangsan District, 1741 in the North District, 1255 in the West District, 614 in the East District, and 875 in the South District. This totals 6228 newly installed emergency bells.
Meanwhile, the price of the HB-112, which is the most commonly used model in security emergency bells, is approximately 1,019,000 Korean won [32], equivalent to $771.67. If 6228 emergency bells were to be installed, it would require a budget of $4,805,960.76.
However, because of budget constraints, it is necessary to determine the most optimal locations using a methodology that allows for more efficient installation within the limited budget (Figure 6a).
4.3.2. EBMCLP
In this subsection, the budget is calculated based on a pre-determined number of emergency bells by using EBMCLP. Additionally, the number of emergency bells required to achieve 80% coverage for each district is determined.
EBMCLP was solved to derive the optimal locations for new emergency bells in each district of Gwangju. More precisely, based on the proposed formula (7), 250, 500, 1000, and 1500 new emergency bells (F) were pre-determined. Specifically, weights were assigned based on the cumulative number of crimes for each unmonitored crime coordinate. The results generated by GIS are shown in Figure 7 below.
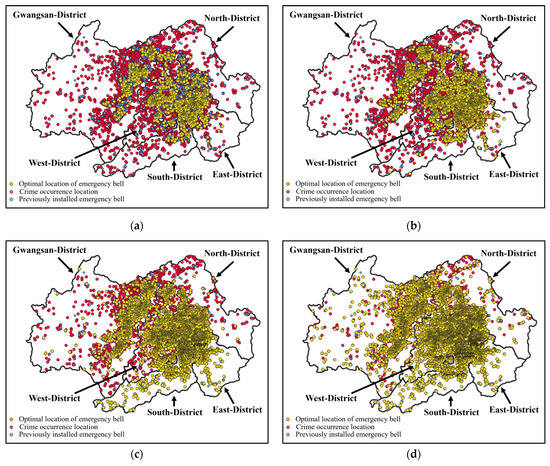
Figure 7.
(a) EBMCLP result (F = 250); (b) EBMCLP result (F = 500); (c) EBMCLP result (F = 1000); (d) EBMCLP result (F = 1500).
Following the results of EBMCLP as shown in Table 6, approximately 90% of crimes in each district could be covered with 1000 optimized new emergency bells.
Table 6.
Coverage percentages by numbers of new optimal emergency bell.
When installing 500 emergency bells in each district, the total installation cost is calculated as follows: $771.67 multiplied by 500 equals $385,835 for each district. Therefore, the total cost for all five districts would be $1,929,175. The East district would require 614 emergency bells with $473,805.38 () to cover all crimes, while with just 250 bells costing $192,917.50, it can still achieve 83% coverage. This brings out the advantage of obtaining the desired coverage for each district by considering the budgetary constraints.
To cover over 80% of crime occurrences, the following amounts of emergency bells were required for each district: 800 in the Gwangsan and North districts, with coverage percentages of 88% and 85%, respectively; 500 in the West and South districts, with 83% and 89% coverage rates, respectively; and 250 in the East district with an 83% coverage rate. The cumulative cost totaled $2,199,259.5 for the installation of 2850 new emergency bells. This represented a budget reduction of more than fifty percent when compared to the scenario of achieving 100% coverage as calculated by EBLSCP ($4,805,960.76).
The results of EBLSCP and EBMCLP can be utilized to obtain precise addresses by geocoding coordinates. In this paper, candidate locations were generated by creating regular points at 25 m intervals throughout the entire Gwangju Metropolitan City. This approach enabled the proposal of more refined installation candidates. An example of such optimized emergency bell addresses is presented in Table 7.
Table 7.
Detailed addresses derived from EBLSCP and EBMCLP.
5. Conclusions
This study aimed to identify the optimal locations for emergency bells in the city of Gwangju by analyzing the crime data of the entire area. After analyzing the current situation, the optimal location for emergency bells was derived for all districts of the city. This study offers valuable insights for policymakers in their crime prevention efforts. The application of this research with on-site inspections not only aids in effective budget management but also contributes to enhanced crime prevention measures.
This study provides a practical guide for effective crime prevention based on the actual cost of the commonly used emergency bell model (HB-112). It calculates the minimum required budget for installing emergency bells to cover all unmonitored crimes and the costs of installing 250, 500, 800, 1000, and 1500 emergency bells in each district. These findings contribute to a realistic approach towards crime prevention.
In future research, it would be possible to conduct a study that provides meaningful indicators for crime-prone areas by establishing a more sophisticated basis for calculating weights. Additionally, machine learning could be used to derive optimal facility sites for high-risk areas based on cumulative crime incidents.
Author Contributions
Conceptualization, S.-W.L., B.-G.C. and H.-J.L.; methodology, S.-W.L., B.-G.C. and H.-J.L.; software, S.-W.L.; validation, S.-W.L. and H.-J.L.; formal analysis, S.-W.L.; investigation, S.-W.L.; resources, H.-J.L.; data curation, S.-W.L. and B.-G.C.; writing—original draft preparation, S.-W.L.; writing—review and editing, S.-W.L. and H.-J.L.; visualization, S.-W.L.; supervision, H.-J.L.; project administration, H.-J.L.; funding acquisition, H.-J.L. All authors have read and agreed to the published version of the manuscript.
Funding
This work was supported by the National Research Foundation of Korea(NRF) grant funded by the Korea government(MSIT) (RS-2023-00242528). This research was supported by the MSIT(Ministry of Science and ICT), Korea, under the Innovative Human Resource Development for Local Intellectualization support program(IITP-2023-RS-2022-00156287) supervised by the IITP(Institute for Information & communications Technology Planning & Evaluation).
Institutional Review Board Statement
Not applicable.
Informed Consent Statement
Not applicable.
Data Availability Statement
The data presented in this study are available on request from the corresponding author. The data are not publicly available due to containing paid data.
Conflicts of Interest
The authors declare no conflict of interest.
References
- Liu, J.; Sridharan, S.; Fookes, C. Recent advances in camera planning for large area surveillance. ACM Comput. Surv. 2016, 49, 1–37. [Google Scholar] [CrossRef]
- Guidelines for Creating a Safe Street Environment. Available online: https://www.law.go.kr/LSW/admRulInfoP.do?admRulSeq=2000000118162 (accessed on 3 July 2023).
- Yu, K.-H.; Cho, Y.-J.; Ji, H.-R.; Son, D. An analysis of the effectiveness of crime prevention through environmental design project. J. Archit. Inst. Korea Plan. Des. 2017, 33, 13–20. [Google Scholar]
- Baek, Y.; Kim, K.; Park, H. The effect of perceived number of cctv cameras on community tesidents’ safety perception-focusing on the mediating role of belief in cctv’s crime-reduction effect. J. Police Sci. 2018, 18, 9–38. [Google Scholar]
- Murray, A.T.; Kim, K.; Davis, J.W.; Machiraju, R.; Parent, R. Coverage optimization to support security monitoring. Comput. Environ. Urban Syst. 2007, 31, 133–147. [Google Scholar] [CrossRef]
- Kweon, J.; Lee, K.-H. Proposed placement model for public cctv systems in student safety zones considering surveillance probability on pedestrian streets. J. Asian Archit. Build. Eng. 2016, 15, 231–238. [Google Scholar] [CrossRef]
- Socha, R.; Kogut, B. Urban video surveillance as a tool to improve security in public spaces. Sustainability 2020, 12, 6210. [Google Scholar] [CrossRef]
- Safe Emergency Bell: A New Social Safety Infrastructure. Available online: https://www.koit.co.kr/news/articleView.html?idxno=87377 (accessed on 31 May 2023).
- Law on Public Restrooms and Related Facilities. Available online: https://elaw.klri.re.kr/kor_service/lawView.do?hseq=55680&lang=ENG (accessed on 10 July 2023).
- Granato, D.; Santos, J.S.; Escher, G.B.; Ferreira, B.L.; Maggio, R.M. Use of principal component analysis (PCA) and hierarchical cluster analysis (HCA) for multivariate association between bioactive compounds and functional properties in foods: A critical perspective. Trends Food Sci. Technol. 2018, 72, 83–90. [Google Scholar] [CrossRef]
- Gárate-Escamila, A.K.; El Hassani, A.H.; Andrès, E. Classification models for heart disease prediction using feature selection and pca. Inform. Med. Unlocked. 2020, 19, 100330. [Google Scholar] [CrossRef]
- De Ketelaere, B.; Hubert, M.; Schmitt, E. Overview of PCA-based statistical process-monitoring methods for time-dependent, high-dimensional data. J. Qual. Technol. 2015, 47, 318–335. [Google Scholar] [CrossRef]
- Pearson, K. Liii. On lines and planes of closest fit to systems of points in space. Lond. Edinb. Dublin Philos. Mag. J. Sci. 1901, 2, 559–572. [Google Scholar] [CrossRef]
- Lever, J.; Krzywinski, M.; Altman, N. Principal component analysis. Nat. Methods 2017, 14, 641–642. [Google Scholar] [CrossRef]
- MacQueen, J. Some methods for classification and analysis of multivariate observations. In Proceedings of the Fifth Berkeley Symposium on Mathematical Statistics and Probability, Los Angeles, CA, USA, 21 June–18 July 1967. [Google Scholar]
- Yadav, J.; Sharma, M. A review of k-mean algorithm. Int. J. Eng. Trends Technol. 2013, 4, 2972–2976. [Google Scholar]
- Abdulhafedh, A. Incorporating k-means, hierarchical clustering and pca in customer segmentation. Int. J. Urban Plan. Dev. 2021, 3, 12–30. [Google Scholar]
- Park, I.; Kim, D.; Har, D. Mac achieving low latency and energy efficiency in hierarchical M2M networks with clustered nodes. IEEE Sens. J. 2014, 15, 1657–1661. [Google Scholar] [CrossRef]
- Park, J.; Hong, E.; Har, D. Low complexity data decoding for SLM-based OFDM systems without side information. IEEE Commun. Lett. 2011, 15, 611–613. [Google Scholar] [CrossRef]
- Toregas, C.; Swain, R.; ReVelle, C.; Bergman, L. The location of emergency service facilities. Oper. Res. 1971, 19, 1363–1373. [Google Scholar] [CrossRef]
- Church, R.; ReVelle, C. The maximal covering location problem. Pap. Reg. Sci. Assoc. 1974, 32, 101–118. [Google Scholar] [CrossRef]
- Farahani, R.Z.; Asgari, N.; Heidari, N.; Hosseininia, M.; Goh, M. Covering problems in facility location: A review. Comput. Ind. Eng. 2012, 62, 368–407. [Google Scholar] [CrossRef]
- Borba, B.F.d.C.; de Gusmão, A.P.H.; Clemente, T.R.N.; Nepomuceno, T.C.C. Optimizing police facility locations based on cluster analysis and the maximal covering location problem. Appl. Syst. Innov. 2022, 5, 74. [Google Scholar] [CrossRef]
- Huang, M.; Fang, Z.; Xiong, S.; Zhang, T. Interest-driven outdoor advertising display location selection using mobile phone data. IEEE Access 2019, 7, 30878–30889. [Google Scholar] [CrossRef]
- Xu, Y.; Zhang, Y.; Fu, C.; Deng, X.; Yang, Y. Optimizing the spatial location of street lights in belle isle, Michigan. ISPRS Int. J. Geoinf. 2022, 11, 115. [Google Scholar] [CrossRef]
- Murray, A.T. Advances in location modeling: Gis linkages and contributions. J. Geogr. Inf. Syst. 2010, 12, 335–354. [Google Scholar] [CrossRef]
- Alexandris, G.; Giannikos, I. A new model for maximal coverage exploiting gis capabilities. Eur. J. Oper. Res. 2010, 202, 328–338. [Google Scholar] [CrossRef]
- Yang, J.; Nam, S. A planning monitoring study on the community plan of seoul. Seoul Inst. 2015, 5, 237–249. [Google Scholar]
- Umair, A.; Sarfraz, M.S.; Ahmad, M.; Habib, U.; Ullah, M.H.; Mazzara, M. Spatiotemporal analysis of web news archives for crime prediction. Appl. Sci. 2020, 10, 8220. [Google Scholar] [CrossRef]
- Lee, J.-H. A study on urban crime and its prevention–focused on index crime in Cheong-ju. Han Yang Law Rev. 2018, 29, 249–271. [Google Scholar] [CrossRef]
- Lim, J.-T.; Kang, S.-Y. A study of the current ‘Korean index crime’ by police and its improvement. J. Soc. Sci. 2010, 17, 137–168. [Google Scholar]
- Excellent Product Option Items. Available online: http://www.e-coinet.com/default/sub4/sub44.php?sub=01 (accessed on 29 May 2023).

Disclaimer/Publisher’s Note: The statements, opinions and data contained in all publications are solely those of the individual author(s) and contributor(s) and not of MDPI and/or the editor(s). MDPI and/or the editor(s) disclaim responsibility for any injury to people or property resulting from any ideas, methods, instructions or products referred to in the content. |
© 2023 by the authors. Licensee MDPI, Basel, Switzerland. This article is an open access article distributed under the terms and conditions of the Creative Commons Attribution (CC BY) license (https://creativecommons.org/licenses/by/4.0/).