Article

The Use of Chlorophyll Fluorescence as an Indicator of Predicting Potato Yield, Its Dry Matter and Starch in the Conditions of Using Microbiological Preparations

by
Piotr Pszczółkowski
1,
Barbara Sawicka
2,*,
Dominika Skiba
2,
Piotr Barbaś
3 and
Ali Hulail Noaema
4
1
Experimental Station for Cultivar Assessment of Central Crop Research Center, 21-211 Dębowa Kłoda, Poland
2
Department of Plant Production Technology and Commodity Science, University of Life Sciences in Lublin, 20-950 Lublin, Poland
3
Department of Potato Agronomy, Plant Breeding and Acclimatization Institute, 05-140 Serock, Poland
4
Department of Field Crops, Agriculture College, Almuthana University, Samawah P.O. Box 30, Iraq
*
Author to whom correspondence should be addressed.
Appl. Sci. 2023, 13(19), 10764; https://doi.org/10.3390/app131910764
Submission received: 22 August 2023 / Revised: 19 September 2023 / Accepted: 26 September 2023 / Published: 27 September 2023
(This article belongs to the Section Applied Biosciences and Bioengineering)

Abstract

:
The paradigm shift toward ecological agriculture has spurred efforts to phase out the use of conventional pesticides, and researchers are actively seeking natural alternatives to replace these chemicals. Aim: This study aimed to introduce an innovative intervention to enhance potato yields in a non-invasive manner, thereby elevating the content of both dry matter and starch. Ultimately, this approach seeks to enhance the quality of raw materials destined for the production of potato-enriched products. A field experiment was conducted in central-eastern Poland that employed a randomized sub-block method within a dependent split-split-plot design replicated three times. The main factor was pre-planting treatments, which included the application of a microbiological preparation to seed potatoes for: (a) 10 min, (b) 15 min, and (c) no treatment (control). Another factor was the fourteen potato cultivars of different earliness groups. Qualitative analyses were carried out in laboratory conditions. The application of the microbiological preparation yielded positive outcomes on the physiological indicators of potato yield, while augmenting the production of dry matter and starch when compared to the control object. The analyzed cultivars had the most pronounced impact on both the content and yield of dry matter and starch, demonstrating a wide array of responses to pre-planting treatments that incorporated microbiological preparations. For the first time in studies concerning effective microorganisms, chlorophyll fluorescence analysis was employed. Alternative solutions in the form of employing microbiological preparations offer the potential to effectively substitute pesticides and synthetic fertilizers in potato production, consequently enhancing the quality of raw materials for food.

1. Introduction

Biopreparations, based on effective microorganisms (EM), are a versatile resource with a wide range of applications. Their usefulness includes environmental protection, agriculture, food industry, pharmaceuticals, and medicine. Specifically, EM biopreparations are exceptionally efficient in conditioning seeds, seedlings, and tubers and can be applied through various methods including seed dressing during the growing season and as soil applications [1,2,3,4,5,6]. According to Olle et al. [2], the impact of EM applied to the soil has been investigated in relation to vegetable growth, yield, quality, and protection. Their findings revealed that approximately 70% of the documented studies on EM indicated a favorable influence on plant growth. The researchers further concluded that EM interacts with the soil–plant ecosystem by means of various mechanisms including the suppression of plant pathogens and disease agents, mineral dissolution, energy conservation, the maintenance of soil microbial equilibrium, and the enhancement of plant photosynthesis. Currently, biotechnology using EM is used in various fields of agriculture including soil regeneration, plant production, animal husbandry, the agri-food industry, and storage. The diverse enzymatic specificity of these microorganisms enables them to survive in different environments [7,8,9,10]. Microbiological preparations are becoming an extremely useful tool in the correction and supervision of various ecosystems. In plant cultivation, EM biopreparations are widely used for comprehensive stubble spraying, thus supporting secondary and stubble crops before plowing. In addition, EM biopreparations are used to treat seeds, tubers and rhizomes, sugar beet seedlings, vegetables and ornamental plants as well as directly applied by foliar application to plants [1,2,4,5,6,11,12]. Microbial biopreparations are composed of various microorganisms, each of which performs unique functions [5]. These organisms engage in a continuous exchange of nutrients, fostering a symbiotic relationship among them [8]. EM preparations are live, beneficial microorganisms, and an important aspect is that they are not subject to a withdrawal period [8,13]. In plant cultivation, EM biopreparations replace or reduce the need for chemical pesticides to combat diseases and pests [8,10]. They are also employed in cold storage and warehouses to extend the freshness and quality of crops [6,7,8]. Incorporating microbiological biopreparations into agriculture represents a significant stride toward sustainable and eco-friendly food production, helping mitigate adverse effects on the environment, human health, and animal well-being [5,6].
Chlorophyll fluorescence represents a phenomenon in which chlorophyll molecules emit light with a longer wavelength than the light that hits them. This effect is the result of the incidental scattering of light that is not used by the plant in photosynthesis. During photosynthesis, plants absorb light energy through chlorophyll molecules, which are located in chloroplasts—structures responsible for carrying out photosynthesis [14,15,16]. These molecules convert energy into a chemical form, which is then utilized to produce organic compounds like glucose. However, some light energy is lost in the process of chlorophyll fluorescence. In addition, some of this energy is emitted in the form of light with a longer wavelength, which is observed as fluorescence [16,17,18,19,20]. During photosynthesis, units of solar radiation (photons) penetrate the potato leaf, reach the chlorophyll, and stimulate enzymes in rubisco. This energy is subsequently utilized to generate adenosine triphosphate (ATP) energy through the phosphorylation of adenosine diphosphate (ADP): ADP + P + energy -> ATP. As is well-known, ATP is produced from a phosphate ion (P) and ADP, either through solar energy or the energy released by respiring sugars. ATP is a molecule used to supply energy to other parts of the plant for the accumulation of substances necessary for growth and development such as enzymes, sugars, amino acids, and starch in the reverse reaction: ATP -> ADP + P + energy [14,15].
Chlorophyll fluorescence contributes significantly to the understanding and monitoring of plant photosynthetic activity. It is a useful tool in scientific research, allowing one to assess the efficiency of photosynthesis, identify environmental stress, analyze the impact of environmental factors on plants, and monitor the overall health of plants. In addition, chlorophyll fluorescence has great potential for predicting the dry matter yield and starch content in plants by analyzing changes in the chlorophyll fluorescence intensity. There are several methods that can be used for this purpose:
To measure the fluorescence of chlorophyll, a spectrofluorometer can be used, which allows one to analyze the fluorescence of chlorophyll in plant leaves. Analyzing changes in the chlorophyll fluorescence intensity enables the evaluation of photosynthesis status and overall plant efficiency [8,21,22];
Fluorometric measurements at the cellular level: There are also techniques such as single cell fluorescence imaging that allow for a more accurate analysis of chlorophyll fluorescence at the level of individual plant cells. These methods can provide more detailed information on the efficiency of photosynthesis and starch accumulation in different areas of the plant [23,24];
The assessment of fluorescence during plant development: Regular measurements of chlorophyll fluorescence at various stages of plant development can provide information on the rate of growth and accumulation of dry matter or starch [20];
Chlorophyll fluorescence measurements yield valuable insights into how stress affects the functionality of a plant’s photosynthetic apparatus. Recent research has resulted in the intensive development of chlorophyll photoluminescence measurement methods and the miniaturization of measuring devices. Fluorimeters are integrated with gas exchange measurement devices, allowing for a comprehensive, non-invasive assessment of the photosynthesis intensity. The use of chlorophyll fluorescence measurement techniques is becoming more and more common, starting from the study of single cells of plant tissues, and ending with the imaging of the photoluminescence of agricultural fields using satellite images [24].
A comparison of the measurement results between different plant cultivars or different growing conditions can help identify factors affecting the dry matter and starch yields [19,20]. Correlations with yield data, and in particular, a comparison of the chlorophyll fluorescence data with the dry matter yield and starch content data, can establish a relationship between chlorophyll fluorescence and yield. Long-term studies and statistical analysis may help to develop prognostic models based on chlorophyll fluorescence, which will predict the crop and its chemical components [20].
An innovative aspect was introduced in this study with a focus on the non-invasive potential for enhancing crop yield and improving its quality. The study aimed to evaluate the impact of the EM Farma Plus microbiological preparation on the crop and the selected chemical components of various potato cultivars representing all categories of earliness. Additionally, the study aimed to assess the potential influence of EM on enhancing the physiological indicators and consequently, the quality of potatoes suitable for both direct consumption and food processing.
The current literature highlights the importance of biopreparations based on EM as a versatile tool in agriculture, environmental protection, food industry, pharmaceuticals, and medicine [1,2,3,4,6,7,8,9,10,13,23,24], and the potential of chlorophyll fluorescence as a tool for monitoring and optimizing plant production [14,15,16,20,21].
The following alternative research hypotheses were proposed:
Treating seed potatoes with potential probiotic preparations can improve the quality of the raw material for both direct consumption and food processing;
The EM Farma Plus microbiological preparation enhances the biological and agrochemical properties of the soil. Consequently, it influences the potato cultivation technology and genetic characteristics of potato cultivars, impacting the accumulation of biologically active compounds;
The utilization of chlorophyll fluorescence as an indicator of crop yield and its components is a promising tool in agriculture. It facilitates the monitoring and optimization of plant production, to the null hypothesis that the application of the EM Farma Plus preparation will not affect the quantity and quality of potatoes, and that chlorophyll fluorescence will not provide valuable insights into the optimization of plant production.

2. Methodology

The research was conducted in a field experiment spanning from 2017 to 2019 in Parczew, which is located in central-eastern Poland at the coordinates 51°38′24″ N latitude and 22°54′02″ E longitude. The geographic region is the central European Plain. This area features relatively flat terrain. The climate in this region is moderate, characterized by distinct seasons. Winters are typically cold, while summers are moderately warm. Rainfall is evenly distributed throughout the year, which is advantageous for agriculture. The variety of soils in this region can influence the plant growth conditions and nutrient composition of the soil [22]. The experiment employed a randomized subblock design and adopted a dependent split-split-plot layout with three replications. The main factor in the experiment was the treatment of seed potatoes. This involved soaking them in an aqueous solution of the EM Farming preparation for (a) 10 min, (b) 15 min, or (c) a control object, where seed potatoes were soaked in distilled water. The secondary factor included fourteen potato cultivars representing various maturity groups. The experiment took place on sandy loam soil [22].

2.1. Characteristics of Microbial Preparation EM

Biopreparations such as EM encompass plant extracts and microbiological preparations.
EM comprises a mixture of naturally occurring microorganisms including lactic acid bacteria, yeast, actinomycetes, photosynthetic bacteria, and specific fungi. According to several authors, these microorganisms have the potential to partially substitute fungicides in potato production [6,24]. EM Farm Plus is a yellow-brown liquid with a pH range of 3.0 to 3.5. It contains various strains of common microorganisms including actinomycetes, photosynthetic bacteria, lactic acid bacteria, fermenting yeasts, and fungi. It possesses a distinct sweet and sour flavor. The detailed composition of this preparation is not disclosed on the label or the certificate as it is considered as a trade secret by its creators. This product is certified (Certificate No. PZH/HT—3112/2016). EM Farm Plus has received a favorable evaluation from the Department of Toxicology and Risk Assessment at the National Institute of Public Health—National Institute of Hygiene. This evaluation confirms its safety for both individuals and the environment when used according to its intended purpose and the instructions provided on the label. In the conducted research, the EM-Farming preparation was utilized to treat seed potatoes. Preparing the EM-Farming preparation for use involved diluting it with distilled water to the concentration recommended by the manufacturer.

2.2. Characteristics of the Cultivars

Eight edible potato cultivars from four early age groups were tested. Their characteristics are presented in Table 1.
These cultivars vary in terms of maturity, skin and flesh color, and culinary applications. The taste ratings, assessed on a 9-point scale, provide a subjective evaluation of each cultivar’s flavor. The choice of potato cultivar can be tailored to one’s culinary preferences and intended use [25].

2.3. Field Studies

Potatoes were grown in this field following a winter triticale crop. After harvesting the previous crop, residue cultivation was conducted, and in the autumn, 30 tons per hectare of manure was applied. This manure was mixed with the soil through deep plowing. In the spring, the field was leveled, and mineral fertilization was applied as follows: 450 kg of NPK per hectare (with a ratio of N:P:K = 1:1:1.5), equivalent to 90 kg of nitrogen (N), 90 kg of phosphorus (P), and 135 kg of potassium (K) per hectare. The fertilizers were applied once before planting the potatoes and were thoroughly mixed with the soil using a cultivation unit. Class A potato propagating material was manually planted at the end of April with a spacing of 67.5 cm × 37 cm. The designated harvesting plots had an area of 15 square meters. Maintenance work adhered to the Good Agricultural Practice principles [26]. Mechanical cultivation treatments were applied until potato emergence including single and double hoeing. Just before emergence, Plateen 41.5 WG (2.0 kg ha−1) was applied, and at the 3–5 leaf stage of monohedral weeds, Leopard Extra 05 EC (2.0 dm ha−1) + Olbras 88 EC (1.5 dm ha−1 per hectare) were used. When the Colorado potato beetle appeared, it was managed through two to three treatments with available preparations against this pest including Bulldock 025 EC at a rate of 0.3 dm ha−1, Karate Zeon 050 CS at a rate of 0.2 dm ha−1, and Mospilan 20 SP at a rate of 0.08 kg ha−1. Late blight was controlled using the following: Infinito 687.5 SC at a rate of 1.6 dm ha−1, Penncozeb 80WP at a rate of 2.0 kg ha−1, Curzate Top 72.5 WG at a rate of 2.0 kg ha−1, and Ekonom 72 WP at a rate of 2.0 kg ha−1 [26].
Potato harvesting was carried out in groups based on their ripening stage, specifically during the period of technological maturity. During the harvest, the tuber yield was estimated, and samples of tubers were collected from each plot for the determination of the tuber dry weight. In particular, 30 medium-sized tubers that were neither green nor damaged were selected for this purpose. Additionally, 5.5 kg of tubers were collected for starch content determination [27].

2.4. Assessment of Physiological Indicators

Physiological indicators of potato plants were assessed throughout the potato growing season. Leaf chlorophyll fluorescence induction was measured using a PAM-2000 fluorometer (Walz GmbH, Bad Waldsee, Germany) at three stages: full emergence, early flowering, and full flowering. However, for statistical analysis, only the results from the full flowering stage (BBCH 65) were considered due to their stability. The following chlorophyll fluorescence parameters were determined: minimum fluorescence yield (Fo), maximum fluorescence yield (Fm), maximum photochemical yield of PSII (Fv/Fm), actual photochemical yield of PSII (Y), photochemical fluorescence quenching factor (qP), and non-photochemical fluorescence quenching factor (qN). The measurement of maximum fluorescence (Fm) was conducted after inhibiting photosynthesis with intense light, when all reaction centers are closed, leading to the attainment of the maximum chlorophyll fluorescence [17].
The Y value was calculated using the formula:
Y = ( F m F o ) F m
where Fm represents the maximum fluorescence (measured after photosynthesis is blocked) and Fo represents the background fluorescence (measured under low light conditions).
All measurements were performed on the third true leaf in five replicates. Walz GmbH 2030-B clips were used to measure the physiological indicators. A light emission of 650 nm with a standard intensity of 0.15 µmol m−2 was employed. The dark adaptation period lasted for 20 min [17].

2.5. Determination of Selected Elements of the Chemical Composition of Tubers

Potato samples were carefully selected, cleaned of soil and other impurities, and properly cut into uniform pieces. The drying process was carried out in three stages: initial drying, monitoring and weighing as well as final drying and mass stabilization. The samples were placed in a laboratory dryer at a temperature of 90 °C. The samples were then weighed regularly at regular intervals to note changes in weight during drying. The monitoring allowed us to determine when the weight stopped changing, indicating that the dry state had been reached. Upon completion of the initial step, drying was continued at a lower temperature (60 °C). Drying was continued until the weight of the potato samples stopped changing during subsequent weighing [28]. The formula for calculating the dry weight of potatoes can be expressed as:
Dry   Mass = F r e s h   m a s s D r y   m a s s × 100 %
where dry mass refers to the weight of the potatoes after all moisture has been removed. Fresh mass is the initial weight of the potatoes before moisture removal. This formula allows one to calculate the percentage of dry weight in potatoes based on their mass before and after moisture removal. This value is useful for qualitative and quantitative analyses in agricultural cultivation and scientific research [28].
The starch content in potato tubers was assessed using the polarimetric method, specifically the Evers–Grossweld technique. The observed twist angle was then translated into the starch content within the sample [28,29].

2.6. Soil Conditions

In all of the research years, representative soil samples were collected prior to initiating the experiment to determine the key soil properties. The pH in 1 M KCl was assessed in accordance with the Polish Norm [30]. The organic carbon content (Corganic) was quantified using the Tiurin method [31], from which the humus content was derived [30]. The content of assimilable P2O5 and K2O forms was determined via the Egner–Riehm method [32,33]. Additionally, available magnesium in the soil was measured utilizing the Schachtschabel method [34]. A comprehensive overview of the soil’s physical and chemical properties is provided in Table 2.
The experiment was carried out on lessive soil, composed of light clay sands, belonging to the good rye complex with the classification value IVa [23,35]. The soil was characterized by a slightly acidic pH of 6.2 in a solution of 1 mole of KCl. It is significant that this soil had a high content of phosphorus at the level of 177 mg P2O5 kg−1 of soil, a moderate level of potassium of 135 mg of K2O kg−1 of soil, and a significant content of magnesium at the level of 52 mg kg−1 of soil. The arable layer of the soil contained 1.12 g kg−1 of humus of dry soil mass, which potentially affected its characteristics and agricultural abilities [35,36].

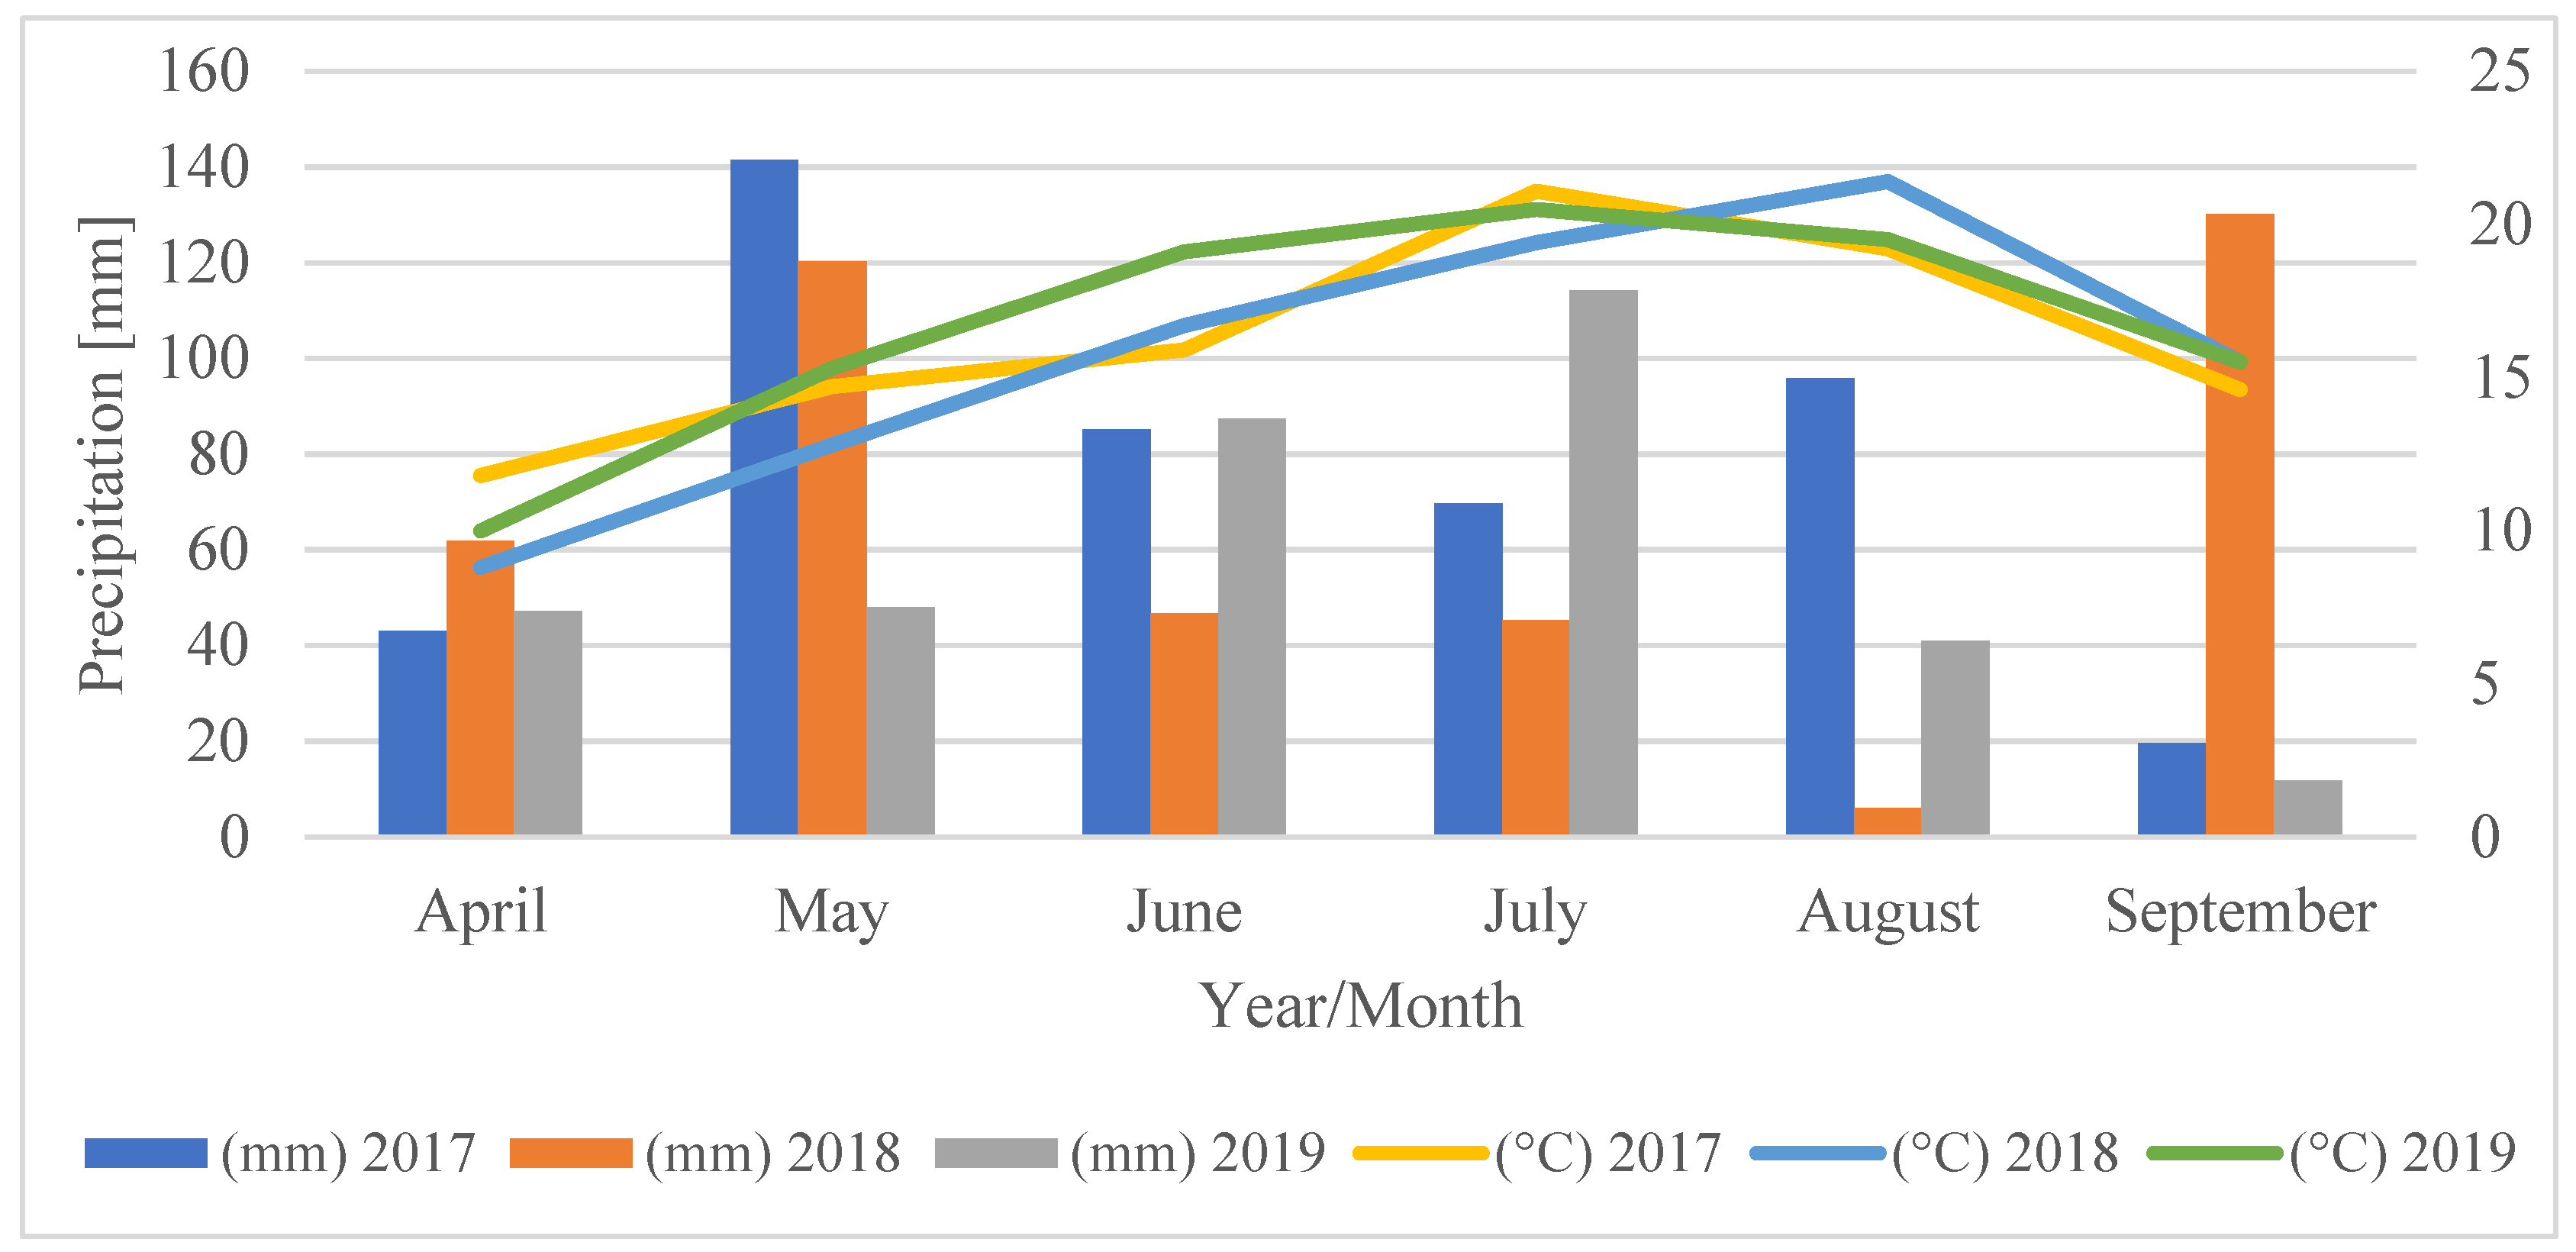
2.7. Meteorological Conditions

The meteorological conditions during the research years exhibited marked variability. In 2017, the initial three months of the vegetation period experienced a noteworthy surplus of precipitation, while July and September faced significant deficits. The following year, 2018, witnessed a surplus of rainfall in April and May, with the subsequent months of the growth season, especially during the intensive tuber harvesting phase, encountering notable shortages. The initial four months of the 2019 growing season (April–July) were marked by the optimal water supply, while the later months (August–September) exhibited soil drought [37]. Notably, 2019 boasted the most favorable meteorological conditions encompassing both precipitation and air temperature, as demonstrated in Figure 1.

2.8. Statistical Calculations

Statistical analysis was conducted through a two-factor analysis of variance, followed by multiple T-Tukey tests, with a significance level set at p ≤ 0.05. The analysis utilized variance models encompassing the primary effects of the studied factors as well as their interactions. The detailed assessment focused exclusively on the main effects. Calculations were performed using SAS Enterprise 4.2 [38]. Multiple T-Tukey comparison tests facilitated the comparison of means by segregating statistically homogeneous groups and establishing the least significant mean differences (HSD) [39]. The calculated p-values gauged the significance and magnitude of the impact of the investigated factors on the differentiation of the analyzed variables, in line with commonly accepted significance levels (p ≤ 0.05). Averaged letter indicators were employed to identify statistically homogeneous groups. When the means share the same letter indicator (at least one), it signifies the absence of a statistically significant difference among them. In this context, HSD values serve as auxiliary tools for quantifying differences between means in a numerical fashion. Moreover, descriptive statistics [40] and calculations of Pearson’s simple correlation coefficients [39] were used.

3. Results

3.1. Physiological Indicators of Yield

Fo is the fluorescence of chlorophyll in the resting state, with minimal light excitation. This indicator is related to the inactive Photosystem II (PSII) and the oxidative state of chlorophyll. The application of a biopreparation containing EM contributed to a significant increase in the initial (zero) fluorescence in the 10-min exposure, and in the 15-min exposure, the difference in Fo height compared to the control object turned out to be insignificant. The increase in the Fo value due to the shorter exposure to EM, compared to the control group, was 5.5% (Table 3).
The genetic characteristics of the tested cultivars had no significant impact on the initial fluorescence (Fo). The lowest value was found in the late starch cultivar ‘Kuras’, and the highest in the cultivar ‘Oberon’. On the other hand, the changing meteorological conditions over the years of the study significantly altered the value of the Fo parameter. The highest value of the initial fluorescence was observed during the full flowering phase in 2018, which was characterized by average air temperatures and a significant lack of precipitation during this period. In contrast, the lowest value of this parameter was recorded in 2019, which experienced a relatively humid period and the highest average air temperature during the potato flowering period (Table 3).
The Fm (maximum fluorescence of chlorophyll) is measured using the Kautsky test after irradiating the plant with intense light. Fm reflects the fluorescence of chlorophyll with full reduction of the electron acceptors in PSII. All factors of the experiment significantly influenced the value of this physiological indicator. A significant difference was observed in the influence of beneficial microorganisms for both the 10-min and 15-min exposures, with increases of 5.77% and 6.39%, respectively, compared to the control group.
Genetic characteristics of the tested cultivars played a significant role in determining the maximum fluorescence efficiency. Among them, two mid-early cultivars, ‘Oberon’ and ‘Satina’, exhibited the highest values, while the remaining cultivars in the same homogeneous group did not show significant differences (Table 4). The maximum fluorescence of chlorophyll was also significantly influenced by the meteorological conditions in the years of the study. In the first two years, a similar value of Fm was obtained. In 2019, with a wet period during flowering, the highest value of this indicator was obtained (Table 3).
Fo/Fm is the ratio of the quiescent fluorescence (Fo) to the maximum fluorescence (Fm). This ratio, known as Fo/Fm, is a measure of Photosystem II (PSII) efficiency and reflects the photosynthetic activity of plants. A higher Fo/Fm ratio indicates enhanced photosynthesis efficiency and PSII function. The application of EM significantly influenced this indicator at both exposure times (10 and 15 min) by 7.93% and 6.21%, respectively, compared to the control group.
Notably, the cultivars ‘Satina’, ‘Oberon’, and ‘Jelly’ displayed significantly higher Fo/Fm ratios, indicating superior photosynthetic performance in the resting state compared to the other cultivars. Interestingly, the meteorological conditions during the study years did not significantly impact this parameter (Table 3).
Fo′ represents the initial fluorescence measured immediately after turning off the actinic light or the zero (minimal) fluorescence under light conditions. This parameter is a measure of the fluorescence emission of chlorophyll when the first stable electron acceptors in PSII plastoquinone’s A (QA) are oxidized and non-photochemical quenching occurs. The value of this indicator was primarily influenced by EM and to a lesser extent by the genetic characteristics of the cultivars. A significant increase in the value of this feature (by 12.23%) occurred only in objects with a 10-min exposure to the pre-planting treatments using EM (Table 3).
The genetic traits of the studied cultivars enabled the categorization of cultivars into two distinct homogeneous groups that were significantly different from each other. The first group, characterized by a lower Fo′ value, included: ‘Denar’, ‘Bellarosa’, ‘Gwiazda’, ‘Ignacy’, ‘Owacja’, ‘Vineta’, and ‘Kuras’, while the other tested cultivars formed a separate group. The potato growing conditions during the study years did not significantly alter the value of this characteristic (Table 3).
Fm′, is, in other words, the maximum fluorescence on light (photochemical and non-photochemical quenching is then zero) of a material (e.g., plant tissue) adapted to light. All factors in the experiment had an impact on the value of this indicator. In the case of Fm′, a significantly greater increase in the value of this indicator was observed with a shorter, 10-min exposure time (by 17.59%) compared to a longer, 15-min exposure to EM (which resulted in an 8.02% increase) compared to the control group.
The cultivar ‘Oberon’ exhibited a significant difference in the Fm′ parameter compared to the other cultivars. Meteorological conditions during the research years significantly influenced the value of this feature. The lowest Fm′ value was recorded in 2018, which experienced a significant lack of precipitation during the months of June to August. In contrast, the highest Fm′ value was observed in 2019, characterized by ample and evenly distributed precipitation and high average temperatures during the summer months (Table 3).
The highest value of Fm′ was observed with a shorter exposure duration (i.e., 10 min). The cultivar ‘Oberon’ exhibited a significant difference in the Fm′ parameter compared to the other cultivars. Meteorological conditions during the research years significantly influenced the value of this feature. The lowest Fm′ value was recorded in 2018, which experienced a significant lack of precipitation during the months of June to August. In contrast, the highest Fm′ value was observed in 2019, characterized by ample and evenly distributed precipitation and high average temperatures during the summer months. The remaining cultivars were grouped together into a single homogeneous group based on the value of this feature. The highest Y value was obtained in 2018, with a high average air temperature in June–August, and the lowest in 2017, with a high hydrothermal coefficient in May–July (Table 3).
The Y parameter, in the context of this study, represents the actual photochemical efficiency of the plant’s photosynthetic system II (PSII). It is a measure of the ability of PSII to carry out the photosynthetic process and is important for assessing the photosynthetic efficiency of potato plants in various conditions. The value of this parameter can indicate how effectively plants convert sunlight into chemical energy in the process of photosynthesis. A significant increase in the value of the Y parameter (by 10.44%) compared to the control group was achieved only with a shorter, 10-min exposure of seed potatoes to the pre-planting EM treatment (Table 3).
Among the examined varieties, the highest Y value was obtained by the ‘Syrena’ cultivar, but the same homogeneous group also included the following cultivars: ‘Satina’, ‘Tajfun’, ‘Jelly’, and ‘Mondeo’. The cultivar ‘Kuras’ was characterized by the lowest value of this parameter, but in the same homogeneous group, there were very early, early, and medium early cultivars: ‘Denar’, ‘Bellarosa’, ‘Gwiazda’, ‘Ignacy’, ‘Owacja’, ‘Vineta’, and ‘Oberon’. The highest Y value was obtained in 2019 with the most optimal growing conditions, and the lowest in 2017 with the least favorable meteorological conditions. Higher values of this parameter suggest a better ability of plants to carry out photosynthesis compared to lower values, which may be the result of the influence of various factors such as the type of crop, type of cultivar, or environmental conditions. The value of this parameter can help scientists understand how plants respond to various stress factors and what factors influence their photosynthetic efficiency (Table 3).
Qp (quantum efficiency of Photosystem II) is one of the indicators that are used to assess the efficiency of photosynthesis. It represents the portion of light-excited fluorescence associated with Photosystem II (PSII) in photosynthesis. It is the ratio of the number of photons emitted by PSII to the number of photons absorbed by PSII. qP measures the photosynthetic efficiency of Photosystem II. The utilization of the EM biopreparation significantly enhanced the photosynthetic efficiency (i.e., quantum yield of the photosystem) during both the 10-min and 15-min exposure periods, resulting in increases in this indicator of 16.43% and 6.01%, respectively, compared to the control group (Table 3).
The genetic factor significantly modified the value of this indicator. The cultivars: ‘Vineta’, ‘Oberon’, ‘Satina’, ‘Jelly’, and ‘Mondeo’ were characterized by significantly higher photosynthetic efficiency than the other cultivars that were included in one homogeneous group. The highest quantum efficiency Qp was recorded in 2019, characterized by higher air temperatures than in the other years of research and the most optimal Sielianionov’s hydrothermal coefficient, while the lowest photosynthetic efficiency Qp was recorded in 2017, with high rainfall and a high hydrothermal coefficient in May–July (Table 3).
Qn is the fluorescence emitted by other photosynthetic components outside Photosystem II. This is a fluorescence that is not directly related to the photosynthesis process in PSII. Qn can be caused by various factors such as the oxidative states of chlorophyll, other photosynthetic complexes, or alternative ways of converting light energy. A significantly higher fluorescence emitted by other photosynthetic components (Qn) was observed only with the shorter, 10-min EM application on potato tubers before planting, showing an increase of 11.3% compared to the control group (Table 3).
The analysis of variance (ANOVA) divided the tested cultivars into three homogeneous groups. The first cultivar group with the lowest Qn value included ‘Denar’, ‘Bellarosa’, ‘Owacja’, ‘Tajfun’, ‘Jelly’, ‘Syrena’, and ‘Kuras’. The second homogeneous group, with medium Qn fluorescence, consisted of the cultivars ‘Ignacy’, ‘Vineta’, ‘Finezja’, and ‘Oberon’. The third group with the highest fluorescence coefficient Qn included the cultivars ‘Gwiazda’, ‘Satina’, and ‘Mondeo’. The highest fluorescence emitted by other photosynthetic components was recorded in 2019,a characterized by the most optimal hydrothermal coefficient, and the lowest in 2018 with wet April and an extremely wet May (Table 3).

3.2. Analyzing Dry Matter and Starch in Potato Tubers

The application of EM during both the 10-min and 15-min exposure of potato tubers did not result in a significant impact on the content of dry matter and starch in potato tubers compared to the control object. However, there was an observed tendency toward an increase in the concentration of both dry matter and starch due to this treatment (Table 4).
Genetic traits had a significant impact on the starch and dry matter content in the tubers of the examined cultivars. The late cultivar ‘Kuras’ exhibited the highest levels of both dry matter and starch, while very early and early cultivars such as ‘Denar’, ‘Bellarosa’, ‘Gwiazda’, ‘Ignacy’, ‘Owacja’, and ‘Vineta’ had the lowest content of dry matter and starch. The cultivars ‘Oberon’, ‘Satina’, ‘Jelly’, ‘Mondeo’, ‘Syrena’, and ‘Tajfun’ as well as ‘Oberon’ and ‘Satina’ were grouped together in terms of their dry matter and starch content (Table 4).
The variable weather conditions during the study years did not significantly affect the dry matter content, but they did have a significant impact on the starch content in the tubers. The highest starch content was observed in tubers harvested in 2018, which experienced a wet May followed by a dry and sunny June, July, and August. In contrast, a significantly lower starch content was found in tubers harvested in 2017 and 2019, which had optimal rainfall in June and July (Table 4).

3.3. Total Potato Yield and Yield of Dry Matter and Starch

Treating potato tubers with EM microorganisms before planting, both with 10-min and 15-min exposures, led to a substantial increase in the total tuber yield, dry matter yield, and starch yield per unit area compared to the control object. Pre-planting treatments had a significant positive impact on key parameters, resulting in the following improvements: the yield of fresh tuber mass increased by 23.43%, dry matter yield increased by 25.89%, and the starch yield specifically increased by 24.78% with a shorter 10-min exposure. With a longer 15-min exposure to effective microorganisms, there were increases of 19.35% in the fresh tuber mass yield, 22.59% in the dry matter yield, and 21.47% in the starch yield. These results indicate the positive effects of pre-planting treatments on the crop yield and quality (Table 5).
Genetic features of the examined cultivars significantly affected the tuber yield values and their quantitative and qualitative structure. The cultivar ‘Ignacy’ achieved the highest yield of fresh tuber weight, while the cultivars ‘Denar’, ‘Mondeo’, ‘Satina, and ‘Syrena’ were homogeneous in terms of this parameter. In the next homogeneous group, based on yield, were the cultivars ‘Finezja’, ‘Gwiazda’, ‘Jelly’, ‘Kuras’, ‘Oberon’, ‘Owacja’, and ‘Tajfun’. Cultivars ‘Owacja’, and ‘Bellarosa’ had the lowest tuber yield (Table 5).
Among all of the cultivars tested, ‘Kuras’ exhibited the highest yield of dry matter and starch. ‘Mondeo’ and ‘Satina’ were grouped together in the same homogeneous group of cultivars (Table 5).
In terms of the dry matter yield, the following cultivars formed the next group: ‘Denar’, ‘Ignacy’, ‘Jelly’, ‘Oberon’, and ‘Vineta’. The cultivars with the lowest dry matter yield were ‘Bellarosa’, ‘Gwiazda’, and ‘Owacja’. Regarding the starch yield, three primary homogeneous groups were also identified. Cultivars with the highest and homogeneous starch yield included ‘Kuras’, ‘Satina’, ‘Tajfun’, ‘Mondeo’, and ‘Finezja’. Cultivars with the lowest starch yield comprised ‘Bellarosa’ and ‘Owacja’. The remaining cultivars fell into the category of average starch yield (Table 5).
Certainly, the lowest total tuber yield, dry matter yield, and starch yield per unit area were documented in 2018, a year marked by a significant deficiency of precipitation during the months critical for yield accumulation. The highest yields of the discussed traits were significantly obtained in 2019, characterized by well-distributed precipitation and higher average daily air temperatures compared to the other research years (Table 5).

3.4. Descriptive Analysis of the Yield, Its Most Important Economic Features, and the Physiological Indicators of Potato

Table 6 contains the measures describing the characteristics of the distribution and the variability of the examined features. These values were used to assess the distribution of the data and to identify outliers or trends in the dataset.
The mean value for each variable represents the average of the respective measurements. For instance, the average total yield of tubers (y1) was 43.17, while the average dry matter content (y2) was 20.38. Utilizing the mean value is crucial in comprehending the characteristics of a dataset and facilitating the comparison of various groups or the analysis of trends in the data. However, the mean can be influenced by outliers, whether large or small, within the dataset. Therefore, it is advisable to consider other measures such as the standard deviation or median to obtain a more comprehensive understanding of the feature’s distribution (Table 6).
The median represents the central value within the dataset, effectively dividing it into two equal parts. For example, the median starch content (y4) was 15.10. Conversely, the standard deviation measures the dispersion of data around the mean. A higher standard deviation value indicates greater variability in the data relative to the mean. As an example, the standard deviation for total tuber yield (y1) was 8.52 (Table 6).
Table 6 shows the results of measuring the standard errors (SE—standard error) for various variables or features (y1, y2, y3, y4, y5, x1, x2, x3, x4, x5, x6, x7, x8). The standard error is a measure of the variability or uncertainty of the measurement results for each of these variables. For y1, the standard error was 0.45. This means that the measurement results for the total tuber yield were relatively scattered around the average value. In the case of dry matter content (y2), the standard error was 0.15. This is a relatively low standard error, suggesting that the measurement results for y2 were less scattered and more precise. For y3 (dry matter yield), the standard error was 0.13. As with y2, a low standard error indicates less variability in measurement results for y3. For starch content (y4), the standard error was 0.11. This is another low standard error, which means that the measurement results for y4 were precise and had less variability. In the case of starch yield (y5), the standard error was 0.10. This was the lowest standard error of all variables, which indicates very precise and low-variability measurement results for y5. All independent variables, x1, x2, x3, x4, x5, x6, x7, x8, regarding chlorophyll fluorescence had very low standard errors, often equal to 0.00. This means that the measurement results for these variables were very precise and almost constant, suggesting little variability. In summary, standard errors helped assess the precision and variability of the measurement results for various variables. The lower the standard error, the more precise and less variable the results.
Kurtosis, meanwhile, is a metric to determine whether the distribution of data is more peaked (positive kurtosis) or flatter (negative kurtosis) than a normal distribution. In the case of the total tuber yield (y1), the kurtosis was −0.69, indicating a slight flattening of the distribution. The skewness as a measure of the asymmetry of the data distribution means that a positive value indicates a greater weight of the tail of the distribution on the right side, and a negative value on the left side. For ex ample, the skewness of the dry matter content (y2) was 0.68, which may indicate some asymmetry to the right (Table 6).
The minimum (Minimum) and maximum (Maximum) values are the smallest and largest values in the dataset. For example, the lowest dry matter content (y2) was 14.53 and the highest was 29.07 (Table 6).
The coefficient of variation (V %) represents the percentage variation of a feature relative to its mean. A lower value of this coefficient indicates greater stability of the respective feature. Table 6 illustrates the variability within the research traits. The highest variability was found in the yield of dry matter (V = 28.86%), whereas the lowest variability, and consequently the highest stability of the trait, was associated with the maximum chlorophyll fluorescence value (Fm) (V = 12.39%).

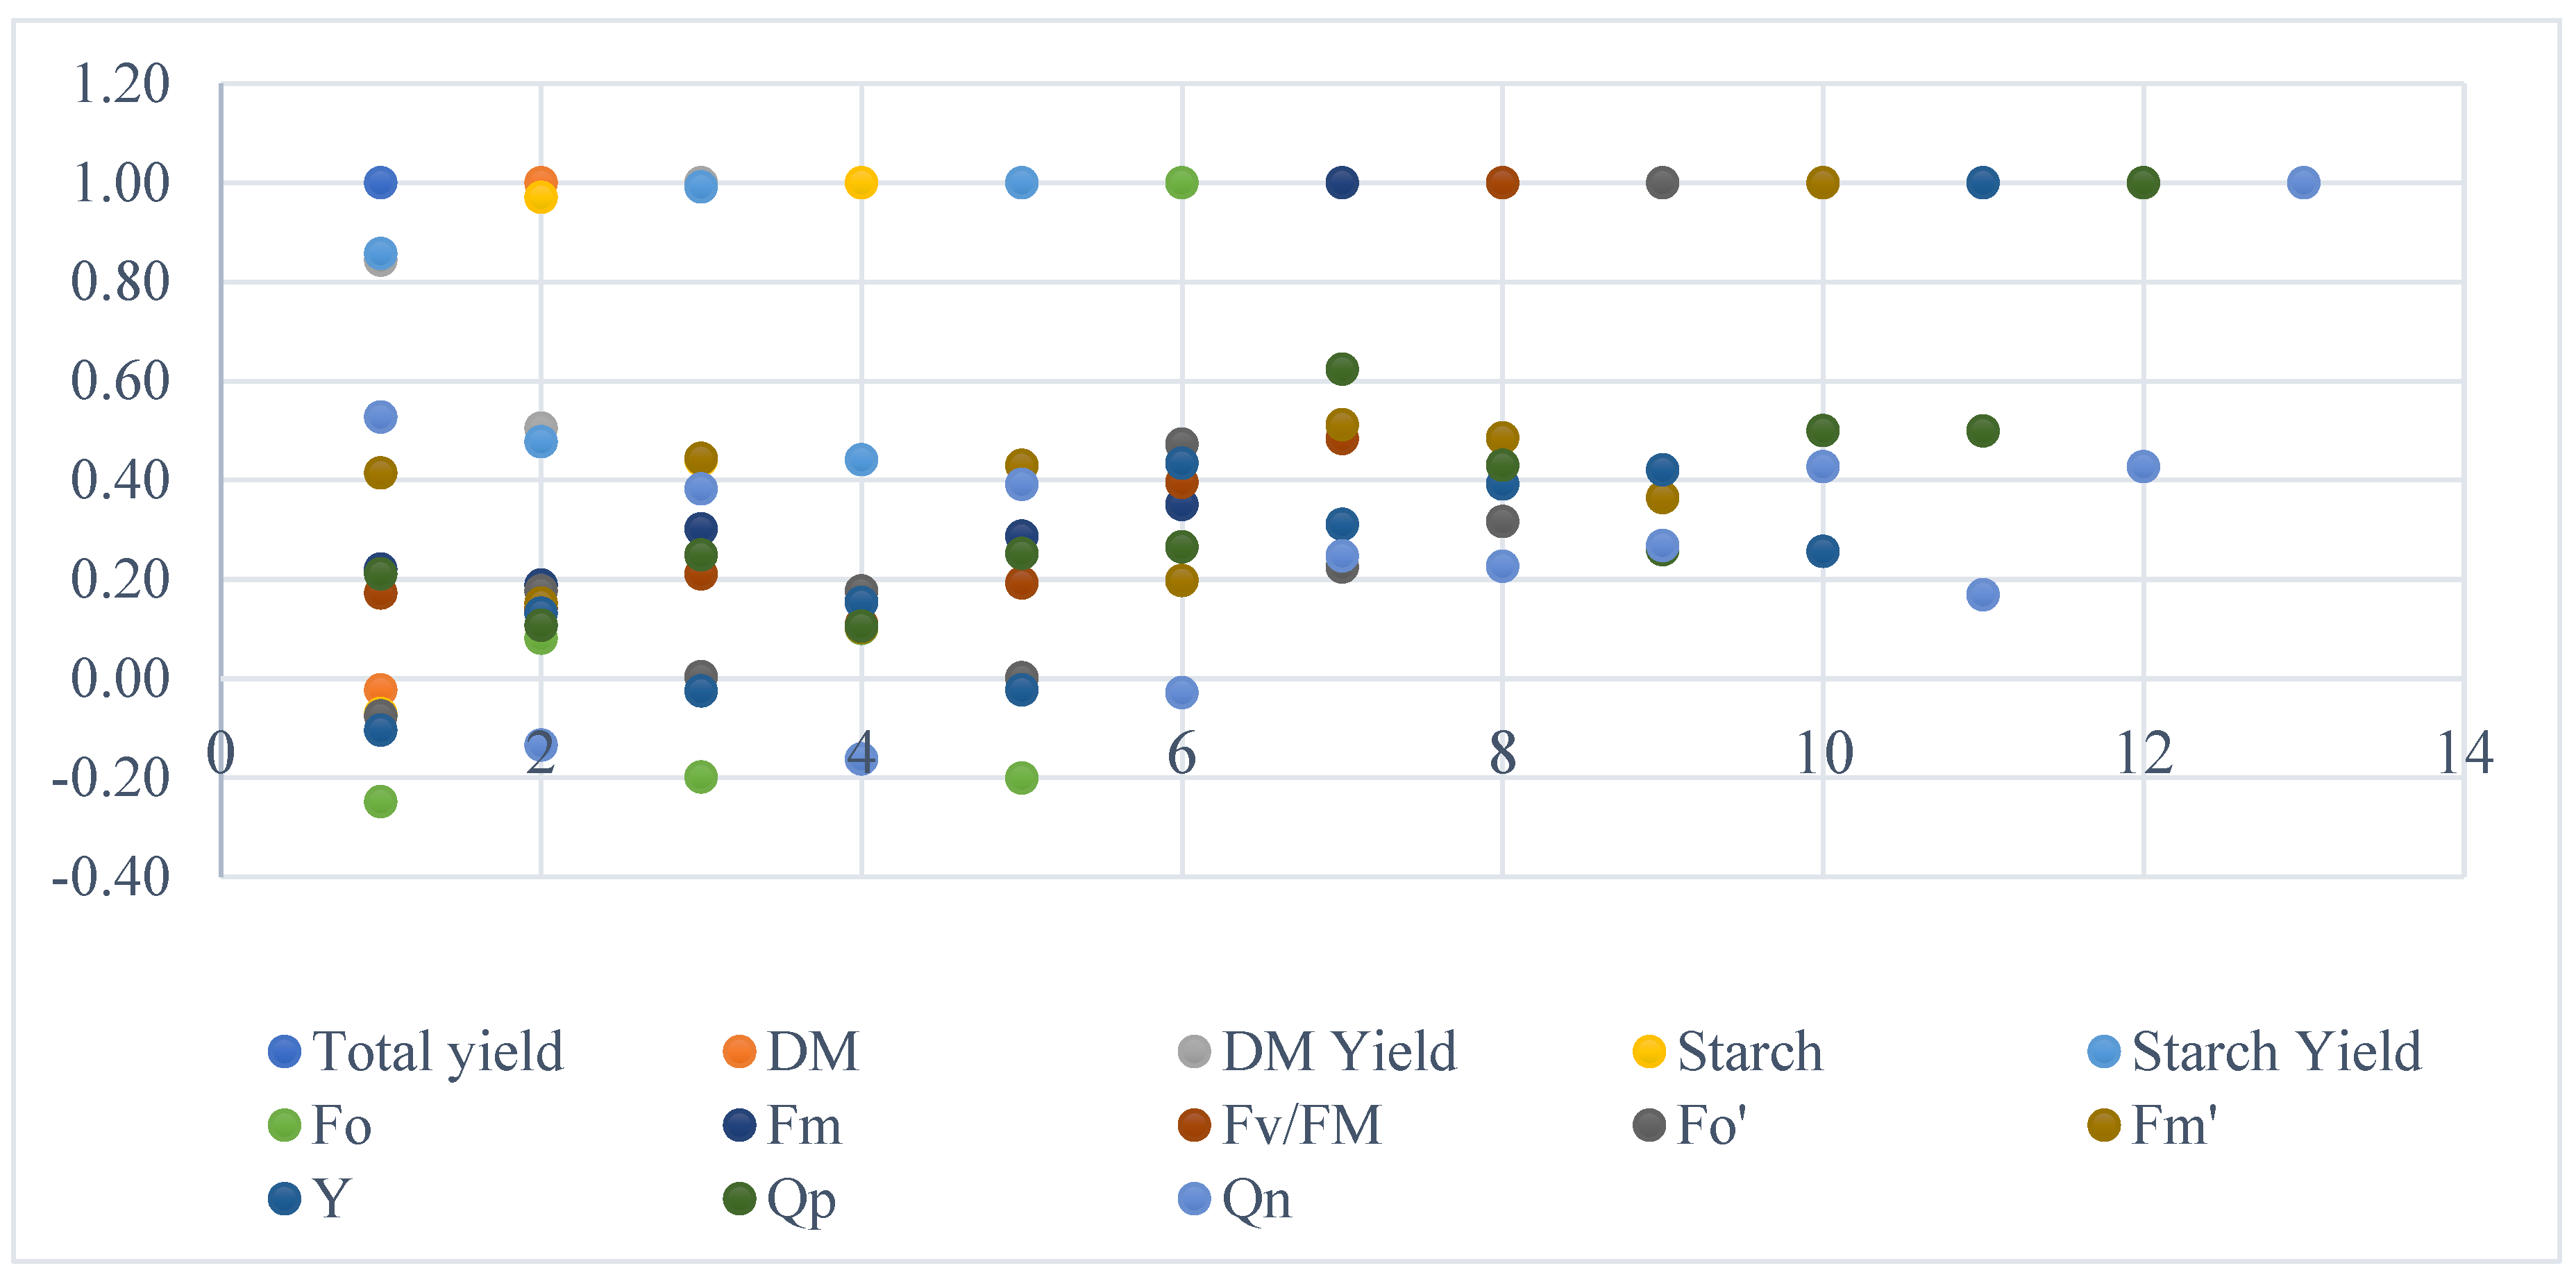
3.5. Influence of Physiological Indicators of Chlorophyll Fluorescence on Tuber Yield, Dry Matter, and Starch Content

The correlation between the potato yield, selected economic characteristics, and potato physiological indices is presented in Figure 2.
The summary presented in the table above contains correlations between various variables related to the potato yield and their physiological features (total yield and other variables). A score of “1.00” on the diagonal means that each variable has a perfect correlation with itself. Values outside the diagonal indicate the degree of correlation between individual variables.
Dry weight of tubers (DM) and total yield of tubers—the correlation coefficient between these features was r= −0.02.
This suggests a minimal, negative relationship between the dry matter content and total yield. A higher dry weight may slightly reduce the yield. In contrast, the dry matter yield of tubers and total yield exhibited a strong positive relationship, with a high value Pearson’s simple correlation coefficient of r = 0.84. This means that when the overall yield is higher, the dry matter yield tends to also increase (Figure 2).
Starch content and other variables: Correlation values were close to zero or low, indicating weak or missing relationships between the starch content and independent variables. This also suggests that the independent variables analyzed in the research did not have a significant impact on the value of this feature; perhaps these may be environmental factors. The high positive correlation between the starch yield and the total yield of tubers (r = 0.86) suggests that there is a strong relationship between these two variables in the study sample or population. The high correlation may also result from the fact that both variables (starch yield and total tuber yield) are shaped by the same external factors such as weather conditions, fertilization, cultivation, etc. An increase in one variable may be the result of the same factors that affect the second variable. However, correlation alone does not allow us to determine the direction of this relationship. Further research, statistical analysis, and/or experimentation are needed to better understand the nature of this correlation and to understand exactly what is going on between the starch yield and total tuber yield. In other words, when the overall yield increases, the starch yield also tends to increase. This strong correlation may suggest that there is some common cause or mechanism affecting both variables. In addition, it has been demonstrated that there exists a fairly high, positive correlation between starch yield and the maximum chlorophyll fluorescence in the light (r = 0.43) as well as between the starch yield and the non-photochemical quenching coefficient of chlorophyll fluorescence (r = 0.39). This suggests that there is some connection between the ability of plants to quench fluorescence and starch production. A higher non-photochemical quenching factor may indicate a more efficient use of light energy by plants, which contributes to increased starch production (Figure 2).
Fo (fluorescence intensity Fo) and other variables: low or missing correlations with other variables were seen, indicating a limited relationship between Fo fluorescence intensity and other parameters. Fm (fluorescence intensity Fm) and other variables: a positive correlation with starch yield was found (r = 0.43), which may suggest that a high correlation between starch yield and total yield may indicate an internal intercorrelation between them. This means that these variables can be related to each other through the joint influence of other factors such as environmental conditions or biological processes.
Fv/Fm (efficiency of Photosystem II) and other variables: visible, small positive correlations were found, which may indicate some relationships between the efficiency of Photosystem II and other parameters.
Fo′ (fluorescence intensity of Fo after inhibition) and other variables: as in the case of Fo, low or missing correlations with other variables were seen (Figure 2).
Fm′ (Fm fluorescence intensity after inhibition) and other variables: a strong correlation (r = 0.51) was found with starch yield, indicating that Fm fluorescence intensity after inhibition may be related to higher starch yield. Y (photosynthetic efficiency) and other variables: correlation values were observed to be low or close to zero, indicating no clear relationship between photosynthesis efficiency and other parameters of chlorophyll fluorescence and dependent variables (Figure 2).
Qp (coefficient of photochemical fluorescence quenching) with other variables. A strong, positive correlation (r = 0.62) with fluorescence intensity Fm was found. This may suggest a link between pentacarbonyl acid production and photosynthesis (Figure 2).
Qn (non-photochemical fluorescence quenching coefficient) with other variables: a strong, positive correlation was found (r = 0.53) with the total yield, which indicates a strong relationship between nucleic acid production and plant yield. Furthermore, it is worth noting that correlations indicate patterns, but do not necessarily imply causality between variables. Interpretation of these results requires further, more detailed analyses and research (Figure 2).

4. Discussion

4.1. Influence of Microbiological Organisms on Yield and Its Components as Well as Physiological Indicators of Chlorophyll Fluorescence

The variability of physiological indicators among potato, including leaf area, plant photosynthetic potential, chlorophyll a content in leaves, a maximum fluorescence under light, or quantum efficiency of Photosystem II, has been documented by several authors [41,42,43,44,45,46]. Our own research has also corroborated these findings. The application of EM had varying effects on chlorophyll fluorescence and photosynthetic efficiency:
Fo (initial fluorescence): EM increased Fo after 10 min but not after 15 min compared to the control group.
Fm (maximum fluorescence): EM significantly increased Fm in both exposure periods.
Fo/Fm (quiescent to maximum fluorescence ratio): EM enhanced Fo/Fm, indicating improved photosynthetic performance, especially in the ‘Satina’, ‘Oberon’, and ‘Jelly’ cultivars.
Fo′ (initial fluorescence under light): EM influenced Fo′, with the shortest exposure (10 min) resulting in higher values.
Fm′ (maximum fluorescence on light): EM treatment increased Fm′, particularly with a 10-min exposure.
Qp (quantum efficiency of Photosystem II): EM significantly improved Qp in both exposure periods, with the most notable enhancement after 10 min.
Qn (fluorescence from other components): higher Qn was observed with the 10-min EM application (Table 3).
Brestic and Zivcak’s [47] research on fluorescence techniques confirmed our results. Zamana et al. [4], using biopreparations containing beneficial microorganisms in potato cultivation including bacteria such as Bacillus subtilis, Bacillus megaterium, Bacillus thuringiensis, Azotobacter chroococcum and the fungi Trichoderma harzianum, Trichoderma viride, Paecilomyces lilacinus, and Beauveria bassiana achieved an improvement in physiological indicators. In summary, EM treatment can significantly impact chlorophyll fluorescence and photosynthetic efficiency, with effects varying based on exposure duration, cultivar traits, and environmental conditions. Further research is needed to fully understand the mechanisms and practical implications of these findings in agriculture.
As a result of the conducted research, it was found that the application of EM during both the 10-min and 15-min exposures to potato tubers did not lead to a significant impact on the content of dry matter and starch in the tubers compared to the control group. However, there was an observed tendency toward an increase in the concentration of both dry matter and starch as a result of this treatment (Table 4).
The most significant and promising outcome of the experiment was the observation that treating potato tubers with EM microorganisms before planting, both with 10-min and 15-min exposures, resulted in a substantial increase in the total tuber yield, dry matter yield, and starch yield per unit area compared to the control group (Table 5).
These findings suggest that the application of EM microorganisms may have a significant impact on potato yields, especially in terms of the dry matter and starch production per unit area. Although there was no significant effect on the starch content within the tubers themselves, the use of EM microorganisms appears to influence the overall crop yield. Further research is warranted to better understand the mechanisms and processes responsible for these observed effects and to consider their practical application in agriculture. Zamana et al. [4], using biopreparations containing beneficial microorganisms in potato cultivation, achieved an improvement in the quality indicators of tubers, which showed an increase in the content of starch, vitamin C, polyphenols, increased antioxidant activity, and a decrease in the content of nitrates compared to the control variant.
Research conducted by Olle and Williams [2,6] demonstrated that the application of microbiological preparations to soil–plant ecosystems can have a substantial positive impact on soil quality, plant health, growth, and crop quality. According to their findings, these applications introduce beneficial microorganisms directly into both the soil and plant leaves, fostering favorable conditions for interactions between plants and microorganisms.
Additionally, studies conducted by Piotrowska et al. [7] highlighted the advantages of using EM Naturally Active preparations, which contain beneficial microorganisms. These preparations promote an environment conducive to plant development by enhancing access to essential micro- and macroelements. This, in turn, enables plants to more effectively absorb nutrients, potentially increasing their value from the consumer’s perspective [48,49,50,51,52]. According to Pilarska et al. [53], the use of EM preparations is, above all, an effective method for enriching and rejuvenating soil through natural biochemical processes. The high activity of lactic acid bacteria (Lactobacillus casei, Streptococcus lactis) contributes to improving the sterility of the soil conditions by preventing the spread of fungi (Fusarium sp.), bacteria (Escherichia coli, Salmonella sp.), and enterococci. Photosynthetic bacteria (Rhodopseudomonas palustrus, Rhodobacter sp.) engage in partial photosynthesis, producing organic compounds including free amino acids. These compounds are subsequently utilized by yeast (Saccharomyces albus, Candida utilis). These yeast strains, in turn, produce active substances that stimulate the activity of lactic acid bacteria and actinomycetes (Streptomyces albus, S. griseus) with natural antibiotic properties. Fungi (Aspergillus oryzae, Mucor hiemalis) significantly enhance soil quality by accelerating the decomposition of organic matter. Therefore, the selection of microorganisms for microbiological preparations is not random; these microorganisms often exhibit symbiotic interactions [49,51,52,53]. According to Sajid et al. [3], Olle and Williams [6], Piotrowska et al. [7], and Brock et al. [8], biodynamic technologies can be effectively and economically employed to enhance the productivity of agricultural systems, particularly organic systems, and reduce environmental pollution. Consequently, microbiological preparations hold significant potential in agriculture. However, it is important to note that they do not provide a one-size-fits-all solution to all plant production challenges.
These results indicate that the influence of pre-planting treatments on potato plants is intricate and may be influenced by numerous factors. To obtain a more comprehensive understanding of these effects and harness the full yield potential of potatoes, further investigation into various aspects of these interactions is necessary. In a study conducted by Polivanova et al. [54], the impact of the prolonged exposure of Jerusalem artichoke tubers to pre-planting procedures was examined. The study revealed that the activity of antioxidant defense enzymes such as catalase and peroxidase exhibited a weak correlation with the duration of exposure to these pre-planting treatments. Our research, which encompassed 14 potato cultivars, can provide valuable insights into the mechanisms governing the adaptive responses of plants when subjected to extended exposure to pre-planting treatments.
In the study by Polivanova et al. [54], the impact of the prolonged exposure of Jerusalem artichoke tubers to pre-planting procedures was investigated, with a noted weak correlation in the activity of antioxidant enzymes such as catalase and peroxidase with the duration of exposure before planting.
Our study focused on 14 potato cultivars from various maturity groups. We demonstrated that the influence of pre-planting treatments on potato plants is complex and depends on various factors including cultivars, weather conditions, and soil properties. Our findings provide valuable insights into the mechanisms guiding the adaptive responses of plants during prolonged exposure to pre-planting treatments.
In summary, both our research and the studies by Polivanova et al. [54], Vaitkaviciene [55], and others [56,57,58,59] confirm that understanding the impact of pre-planting treatments on potato plants is intricate and influenced by multiple factors. Therefore, it is worthwhile continuing to investigate various aspects of these interactions to effectively harness the yield potential of potatoes.

4.2. Genetic Variability Vs. Physiological and Yield Characteristics

Understanding the role of genetic diversity in plant productivity is fundamental to many fields including agriculture, plant breeding, environmental protection, and food security. The impact of genetic diversity on plant performance is complex and covers many aspects, and analyzing the physiological indicators and yield characteristics allows us to better understand this relationship. The genetic features of the tested potato cultivars influenced the chlorophyll fluorescence parameters to varying degrees (Table 3). Here are the most important findings:
The genetic features of the cultivars did not significantly affect the Fo parameter, but played a significant role in determining the Fm values. The highest Fm values were characterized by the medium-early cultivars “Oberon” and “Satina”, while the remaining cultivars from the same group did not differ significantly. High Fm values for the ‘Oberon’ and ‘Satina’ cultivars may suggest that these cultivars have a more efficient photosynthetic mechanism or a higher ability to transfer light energy to chlorophyll in leaf cells. Other cultivars may have lower photosynthetic efficiency or other limitations in the transfer of light energy, leading to lower Fm values.
The Fo/Fm ratio, which reflects the efficiency of photosynthesis, was influenced by the genetic characteristics of the tested cultivars compared to the control group. ‘Satina’, ‘Oberon’, and ‘Jelly’ showed significantly higher Fo/Fm ratios, indicating better photosynthetic efficiency (Table 3). Higher Fo/Fm values in the case of ‘Satina’, ‘Oberon’, and ‘Jelly’ may suggest that these cultivars have a better ability to receive and transmit light energy to the photosynthetic process. This means that they have the potential for more efficient photosynthesis than other cultivars. The control group may have lower photosynthetic efficiency, leading to a lower Fo/Fm ratio. Fo′ and Fm′ (parameters after adaptation): the division of cultivars into two groups based on Fo′ and Fm′ values suggests differences in the ability to adapt to changing light conditions, which was also suggested by Xu et al. [15] and Brestik and Zivcak [47].
The parameters Fo′ and Fm′ divided the potato cultivars into two separate groups. The first group with lower Fo′ values included “Denar”, “Bellarosa”, “Gwiazda”, “Ignacy”, “Owacja”, “Vineta”, and “Kuras”. The second group, led by ‘Oberon’, showed a significant difference in the Fm′ parameter compared to the other cultivars. The division of cultivars into two groups based on the Fo′ and Fm′ values suggests differences in the ability to adapt to changing light conditions. The group in which the “Oberon” cultivar achieved the highest values of these indicators may have a better ability to adapt to changes in light intensity or recover faster after adaptation than the first group, which may be less effective in adapting to changes in the light environment.
The results of our research (Table 3) unequivocally confirm the substantial influence of genetic factors on photosynthetic efficiency, as measured by Qp (quantum efficiency of Photosystem II), within the examined potato cultivars. The notably higher photosynthetic efficiency observed in ‘Vineta’, ‘Oberon’, ‘Satina’, ‘Jelly’, and ‘Mondeo’, in comparison to the remaining nine cultivars, implies significant disparities in their genetic traits related to photosynthesis. This suggests that these particular cultivars may possess more effective photosynthetic mechanisms or structures that are better suited for light absorption and the execution of photosynthesis.
Furthermore, this underscores the potential for selecting appropriate cultivars. The identification of plants with enhanced photosynthetic efficiency holds paramount importance in potato cultivation. Cultivars such as “Vineta”, “Oberon”, “Satina”, “Jelly”, and “Mondeo” represent promising candidates for further selection and the development of cultivars with heightened photosynthetic capabilities. This, in turn, has the potential to bolster crop yields and overall efficiency. This assertion carries both scientific and practical significance, underscoring the pivotal role of genetics in shaping the photosynthetic efficiency of the studied potato cultivars. Additionally, it paves the way for future research endeavors and the refinement of cultivation methodologies.
Photosynthetic efficiency (Qn): Several cultivars including ‘Vineta’, ‘Oberon’, ‘Satina’, ‘Jelly’, and ‘Mondeo’ showed significantly higher photosynthetic efficiency compared to the other cultivars. Three homogeneous groups of cultivars were distinguished based on Qn values. Therefore, the genetic characteristics of the studied potato cultivars played a significant role in determining the various fluorescence parameters related to photosynthetic efficiency. These findings may be valuable for understanding and selecting cultivars with desirable photosynthetic traits for potato cultivation (Table 3). The high photosynthetic efficiency of cultivars such as ‘Vineta’, ‘Oberon’, ‘Satina’, ‘Jelly’, and ‘Mondeo’ may mean that these cultivars have a better ability to convert sunlight into chemical energy through photosynthesis. Dividing cultivars into three groups based on Qn may suggest that different cultivars have different mechanisms for regulating photosynthesis or different levels of efficiency, depending on their genetic characteristics.
The results obtained in the conducted research suggest that differences in the genetic characteristics of potato cultivars affect their ability to carry out photosynthesis and adapt to changing light conditions. These differences may result from different mechanisms of transmitting light energy to chlorophyll, the efficiency of the photosynthesis process, and the ability to adapt to changes in the light environment. The values of these parameters may be useful when selecting potato cultivars for cultivation, especially in the context of photosynthesis efficiency and yield [42].
The results obtained from the conducted research indicate that genetic factors primarily determine the key physiological indicators, which include: Fm, Fv/Fm, Fo′, Fm′, Y, Qp and Qn as well as the tuber yield, their dry weight, starch as well as dry matter yield and starch yield. The relationships regarding physiological indicators confirm the work of Zsom-Muha et al. [14], Xu et al. [15], Kalaji et al. [16], and Brestic and Zivcak [47], and the varietal relationships regarding tuber yield, dry matter yield and starch were confirmed by the research of Schreiber et al. [17], Zarzyńska and Pietraszko [18], Loayza et al. [20], Sulkowicz and Ciereszko [22], Figueroa et al. [42].
The study of the relationship between genetic diversity, physiological indicators, and tuber yield, DM yield, and starch yield will provide a better understanding of the mechanisms affecting plant performance. This knowledge is essential for improving agriculture, environmental protection, food security, and adaptation to changing global conditions [59,60,61].
Understanding the genetic variability of potato traits is critical to developing effective breeding strategies, improving crop yields, food quality, and adapting crops to changing environmental conditions [60,61,62,63,64].
To compare the variability of the physiological indicators and economic characteristics of potatoes, the coefficient of variation (V) was used (Table 6). Its lower value indicates the greater stability of a given feature, as it represents less dispersion of results around the average value. When analyzing the assessed physiological indicators of the studied potato cultivars, their generally small variability was observed, especially in the case of the maximum chlorophyll fluorescence (Fm) efficiency. The coefficient of variation for Fm was only 12.3%, which proves the high stability of this feature, as the measurement results were consistently similar. However, for qP, the coefficient of variation was 19.38%, which indicates a greater variability of results for this feature. The designation Qp refers to the quantum yield of Photosystem II photochemistry. It is a measure of the efficiency of photosynthesis in Photosystem II, which is one of two types of chloroplast photosystems responsible for capturing light energy and converting it into chemical energy, which is in turn used to produce glucose and other organic compounds. Qp measures the ratio of the amount of light energy entering the photosynthesis process to the amount of light energy used to produce chemical energy (in triggering photosynthesis). This means that Qp determines how efficiently Photosystem II converts light into chemical energy. A higher value indicates a higher efficiency of photosynthesis, which means that more light energy is converted into chemical energy, which in turn can contribute to more efficient plant growth.
The analysis of the coefficient of variation allows for a better understanding of the degree of variability of the examined features and their possible stability in the tested sample. A similar opinion on this matter has been expressed by Kalaji et al. [16] and Koronacki [39]. The tested potato physiological parameters showed variability, but usually low variability. The coefficient of variation was lower for traits that showed greater stability, suggesting that these traits had less variability among the tested genotypes. The practical implications of these relationships for plant breeding, cultivar selection, and agricultural practices concern genetic variability in potatoes, which will enable breeders to more closely monitor the stability and variability of traits in the cultivars studied. The selection of genotypes with stable traits can lead to the development of more productive, resistant, and environmentally adapted potato cultivars. Selecting cultivars with stable characteristics for cultivation can help in the more efficient use of resources such as water, fertilizers, and energy. Appropriate adaptation of agricultural practices to the genetic characteristics of plants may contribute to the creation of sustainable agriculture [44,55,62].
Genes involved in photosynthesis such as genes encoding enzymes involved in converting light into chemical energy can influence the physiological indicators related to photosynthesis. Changes in these genes may affect the efficiency of photosynthesis, and consequently crop yield [44]. Genes that control plant hormone signaling and regulation can influence genotypic diversity and physiological indicators. Plant hormones affect developmental processes, stress responses, and other aspects of physiology, which may affect the yield characteristics [60,62]. The genes regulating these metabolic pathways may affect the availability of nutrients and the efficiency of their use by plants [63,64]. Genes responsible for regulating the development of roots, stems, leaves, and other plant organs can influence the plant’s capacity to absorb water, nutrients, and the efficiency of photosynthesis [65]. These genes can interact with each other and with the plant environment, leading to changes in gene expression and metabolic function. These interactions may affect physiological indices and yield characteristics depending on the environmental conditions [62,63,64,65]. Analysis of the genetic variability of potato traits could help identify cultivars more resistant to environmental stresses such as drought or cold. Cultivars with stable physiological indicators may be better able to survive in difficult conditions.
Therefore, the analysis of the genetic variability of potato traits using the index of variation (V) has important implications for plant breeding, cultivar selection, and agricultural practices. It can help develop more fertile, resistant, and adapted potato cultivars, and optimize farming practices. Relationships between cultivar variability, physiological indices, and yield characteristics are a key area of analysis that allows us to draw conclusions about the impact of plant genetic diversity on their yield and yield characteristics. Knowledge of genetic variability can significantly facilitate the selection of cultivars with the greatest possible stability of the desired trait for cultivation in different aspects of potato use.

4.3. The Impact of Abiotic Conditions on the Physiological Indicators of Potato

Meteorological conditions in the years of study had a significant impact on the various parameters of photosynthesis and chlorophyll fluorescence (Table 3). High chlorophyll fluorescence occurred in 2018. The highest initial fluorescence (Fo) occurred in 2018, when the meteorological conditions were favorable for plant development and the photosynthesis process. The Fm parameter, which measures the maximum chlorophyll fluorescence, and photosynthetic efficiency (Qp) were significantly related to air humidity during the flowering period and the air temperature being higher than in other years. This may indicate that the higher temperature favored the photosynthesis process. In 2017, when there was high rainfall and the hydrothermal coefficient was high from May to July, the lowest photosynthetic efficiency (Qp) was recorded (Table 3). This suggests that excessive humidity may negatively affect the photosynthesis process. Also, fluorescence emitted by other photosynthetic components was related to meteorological conditions, with the highest fluorescence occurring in 2019, when meteorological conditions were the most optimal. The obtained results suggest that weather conditions may have a significant impact on the efficiency of photosynthesis and chlorophyll fluorescence parameters in potato crops. Understanding these relationships may be important for farmers who can adapt cropping practices to changing weather conditions to achieve better photosynthetic efficiency.
Practically all dependent (y) and independent (x) variables were significantly associated with the environmental conditions during the study years. Starck [41] suggests that during periods of stress, one of the survival conditions is the efficient reception of signals (often unfavorable) from the external environment and the making of “adaptive decisions”. These processes largely involve coordinating the production of nutrients and their distribution throughout the plant. Stressors almost always not only limit photosynthetic production, but also impose the necessity of initiating energy-consuming processes related to acclimatization and adaptation to adverse environmental conditions [18,44]. In unfavorable atmospheric conditions, there is a need for “adaptive changes” in the hierarchy of acceptor needs, where increased activity can prevent or at least limit the negative effects of stress [41,60]. Physiological traits are important indicators of stress or disease in plants. Boguszewska et al. [66] showed the influence of photosynthesis and other physiological and economic parameters of potatoes on the climatic water balance.

4.4. Interdependence of Feature

The results of the Pearson correlation analysis between potato yield, dry matter yield, starch yield, and physiological traits indicate certain relationships (Figure 2):
Dry matter content vs. total potato yield: A minimal, negative relationship was observed between the dry matter content and total potato yield, suggesting that higher dry matter content may slightly reduce the yield. However, a strong positive correlation was found between the dry matter yield in tubers and total yield, indicating that a higher total potato yield corresponds to a greater dry matter content in tubers. Similar relationships were confirmed by Burgos et al. [5] and Sawicka et al. [61].
Starch content vs. independent variables: It was found that the starch content exhibited weak or no correlations with the analyzed independent variables. Nevertheless, a strong positive correlation was observed between the starch yield and the total tuber yield, emphasizing a significant connection between these variables. Similar results were obtained in the study by Vaitkevičienė et al. [55]. The research also revealed a strong correlation between the fluorescence intensity Fm′ (maximum fluorescence in light) and starch yield. A higher Fm′ fluorescence intensity was positively correlated with a higher starch yield, suggesting a significant relationship between the Fm′ fluorescence intensity and starch production. This indicates potential associations between photosynthesis and starch accumulation processes [41].
Chlorophyll fluorescence (Fo, Fm, Fv/Fm, Fo′, Fm′) vs. other variables: Most variables related to chlorophyll fluorescence displayed weak or no correlations with other parameters. An exception is the positive correlation between starch yield and Fm fluorescence, indicating some intrinsic interdependencies. This is a notable observation since Fm fluorescence intensity measures the maximum chlorophyll fluorescence response to light, and the starch yield reflects the amount of starch produced by the plant. The correlation suggests a strong connection between photosynthesis and starch accumulation, which impacts the overall plant yield [14,41].
Efficiency of Photosystem II (Fv/Fm) vs. other variables: Slight positive correlations were found between the efficiency of Photosystem II (Fv/Fm) and other parameters, suggesting potential relationships between photosynthesis efficiency and other potato characteristics. However, the correlation between the Fo fluorescence intensity (a measure of the initial reaction of chlorophyll to light before it is excited) and the analyzed dependent variables was weak or non-existent, suggesting limited dependence between these variables [15].
Photosynthetic parameters (Y, Qp, Qn) vs. other variables: Correlations between the photosynthetic parameters and other variables varied. The analysis of chlorophyll fluorescence in relation to photosynthesis efficiency (Y) and other variables generally revealed low or near-zero correlations. The parameter Y represents the quantum efficiency of photosynthesis, indicating the proportion of absorbed photons by chlorophyll to those reaching the plant. Higher Y values signify better photosynthetic efficiency, while lower values may indicate potential metabolic issues [20,47]. However, it is important to note that the absence of strong relationships in the correlation analysis does not necessarily imply a complete lack of connections. There could be other unexplored factors or complex interactions at play. To delve deeper into the relationships between photosynthesis efficiency and plant characteristics, more advanced statistical techniques or additional experiments may be needed. Therefore, Y is just one of many indicators used to assess the photosynthesis efficiency. Further investigations considering additional parameters and factors are essential to gain a comprehensive understanding of the photosynthesis process.
Pentacarbonyl and nucleic acid production: Strong positive correlations were observed between pentacarbonyl parameters (Qp) and Fm fluorescence intensity as well as between nucleic acid production (Qn) and total yield. These correlations suggest potential links between photosynthesis processes, pentacarbonyl acid production, and nucleic acid production [16,20]. However, it is important to note that correlations alone do not establish causality, and further research is needed to confirm and elucidate these relationships.
In summary, chlorophyll fluorescence analysis can provide valuable insights into plant health, photosynthesis efficiency, environmental stress, and other factors affecting plants. These results suggest various relationships between the physiological traits of potatoes and yield, but a comprehensive understanding requires further detailed analysis and research. These findings point to potential research directions for a better understanding of how biotic and abiotic factors influence the potato yield and characteristics, and how these factors may interact.

5. Conclusions

The conducted research highlights the importance of using microbiological preparations in agriculture and their effectiveness as well as the possibility of using chlorophyll fluorescence as a tool for monitoring and optimizing the processes of photosynthesis and plant production. Further field and laboratory studies are recommended to better understand these compounds and their potential impact on potato production.

Author Contributions

Conceptualization, P.P. and B.S.; Methodology: P.P., P.B., D.S. and A.H.N.; Validation: D.S. and P.B.; Formal analysis: P.P. and B.S.; Resources: D.S., A.H.N. and P.B.; Data curation: P.B. and D.S.; Writing—original draft preparation: P.P. and P.B.; Writing—review and editing: B.S. and P.P.; Visualization: D.S., A.H.N. and P.B.; Supervision: B.S.; Project administration, B.S. and P.P.; Funding acquisition: B.S. All authors have read and agreed to the published version of the manuscript.

Funding

This research received no external funding.

Institutional Review Board Statement

Not applicable.

Informed Consent Statement

Not applicable.

Data Availability Statement

No new data were created or analyzed in this study. Data sharing does not apply to this article.

Acknowledgments

We thank the University of Life Sciences in Lublin and the Cultivar Testing Center in Słupia Wielka for the administrative and technical support.

Conflicts of Interest

The authors declare no conflict of interest.

Abbreviations

EMEffective microorganisms
EMASMicrobiologically activated solution
ETRElectron transport rate
ETR(II)Absolute rate of PS II turnover, electrons
FmDark-acclimated maximal fluorescence yield
Fm′Maximal fluorescence yield during illumination
FoDark-acclimated minimal fluorescence yield
Fo′Initial (minimal) fluorescence on the light
FvVariable fluorescence yield
Fv/FmMaximum photochemical efficiency of PSII
HSDHonestly significant difference
PS IIPhotosystem II
qNNon-photochemical fluorescence quenching coefficient
qPPhotochemical fluorescence quenching coefficient
YActual photochemical efficiency of PSII

References

  1. Kosicka, D.; Wolna-Maruwka, A.; Trzeciak, M. Influence of microbiological preparations on soil and plant growth and development. Kosmos 2015, 64, 332. (In Polish) [Google Scholar]
  2. Olle, M.; Williams, I. The influence of effective microorganisms on the growth and nitrate content of vegetable transplants. J. Adv. Agric. Technol. 2015, 2, 25–28. [Google Scholar] [CrossRef]
  3. Sajid, M.; Butt, S.J.; Haq, Z.U.; Naseem, I.; Iqbal, A.; Khan, Q.A.; Ali, H. Effects of organic substrates and effective microorganisms (EM) on growth and yield of tomato (Lycopersicon esculentum Mill.) in greenhouse condition. Pure Appl. Biol. 2023, 2, 116–127. [Google Scholar] [CrossRef]
  4. Zamana, S.P.; Papaskiri, T.V.; Kondratieva, T.D.; Shapovalov, D.A.; Fedorovsky, T.D. The Influence of Beneficial Microorganisms on the Quality Indicators and Antioxidant Properties of Potatoes. In Proceedings of the 2nd International Scientific and Practical Conference: Improving Energy Efficiency, Environmental Safety and Sustainable Development in Agriculture 2022, Dushanbe, Tajikistan, 24–27 October 2022; Volume 1154. [Google Scholar] [CrossRef]
  5. Burgos, G.; Zum Felde, T.; Andre, C.; Kubow, S. The Potato and Its Contribution to the Human Diet and Health. In The Potato Crop; Campos, H., Ortiz, O., Eds.; Springer: Cham, Switzerland, 2020. [Google Scholar] [CrossRef]
  6. Yap, C.K.; Al-Mutairi, K.A. Effective Microorganisms as Halal-Based Sources for Biofertilizer Production and Some Socio-Economic Insights: A Review. Foods 2023, 12, 1702. [Google Scholar] [CrossRef]
  7. Piotrowska, A.; Boruszko, D. Analysis of the potential of effective microorganisms in plant production. Econom. Environ. 2023, 83, 180–195. (In Polish) [Google Scholar] [CrossRef]
  8. Brock, C.; Geier, U.; Greiner, R.; Olbrich-Majer, M.; Fritz, J. Research in biodynamic food and farming—A review. Open Agric. 2019, 4, 743–757. [Google Scholar] [CrossRef]
  9. Bhandari, B.K.; Babasaheb, B.; Pravin, N.; Shubham, S.; Nikhil, S. Review on domestic waste water treatment by using effective microorganisms’ technology. IJSART 2021, 6, 792–796. [Google Scholar]
  10. Santoni, M.; Ferretti, L.; Migliorini, P.; Vazzana, C.; Pacini, G.C. A review of scientific research on biodynamic agriculture. Org. Agric. 2022, 12, 373–396. [Google Scholar] [CrossRef]
  11. Ramírez, E.; Prin, J.L.; de Astudillo, L.R. Evaluación del Efecto de los Microorganismos eficientes en el suelo usando Microscopía Electrónica de Barrido Analítica. Acta Microsc. 2022, 31, 63–71. [Google Scholar]
  12. Zhang, D.; Zhang, Q.S.; Yang, X.Q. Seasonal dynamics of photosynthetic activity in the representative brown macroalgae Sagrassum thunbergii (Sargassaceae phaeophyta). Plant Physiol. Biochem. 2017, 120, 88–94. [Google Scholar] [CrossRef]
  13. Higa, T. Effective Microorganisms—Technology of the 21st Century. In Proceedings of the Conference “Effective Microorganisms in the World”, London, UK, 23 July 2005; pp. 20–24. (In Polish). [Google Scholar]
  14. Zsom-Muha, V.; Le Phuong Lien, N.; Baranyai, L.; Hitka, G.; Horváth-Mezőfi, G.; Szabó, G.; Zsom, T. An attempt to the nondestructive investigation of photo-induced potato postharvest quality degradation—Preliminary results. Prog. Agric. Eng. Sci. 2021, 17, 99–109. [Google Scholar] [CrossRef]
  15. Xu, S.; Atherton, J.; Riikonen, A.; Zhang, C.; Oivukkamäki, J.; MacArthur, A.; Honkavaara, E.; Hakala, T.; Koivumäki, N.; Liu, Z.; et al. Structural and photosynthetic dynamics mediate the response of SIF to water stress in a potato crop. Remote Sens. Environ. 2021, 263, 112555. [Google Scholar] [CrossRef]
  16. Kalaji, H.M.; Bąba, W.; Gediga, K.; Goltsev, V.; Samborska, I.A.; Cetner, M.D.; Dimitrova, S.; Piszcz, U.; Bielecki, K.; Karmowska, K.; et al. Chlorophyll fluorescence as a tool for nutrient status identification in rapeseed plants. Photosynth Res. 2018, 136, 329–343. [Google Scholar] [CrossRef]
  17. Schreiber, U.; Klughammer, C.; Kolbowski, J. Assessment of wavelength-dependent parameters of photosynthetic electron transport with a new type of multi-color PAM chlorophyll fluorometer. Photosynth. Res. 2012, 113, 127–144. [Google Scholar] [CrossRef] [PubMed]
  18. Zarzyńska, K.; Pietraszko, M. Possibility to predict the yield of potatoes grown under two crop production systems on the basis of selected morphological and physiological plant indicators. Plant Soil Environ. 2017, 63, 165–170. [Google Scholar] [CrossRef]
  19. Kwambai, T.K.; Griffin, D.; Nyongesa, M.; Byrne, S.; Gorman, M.; Struik, P.C. Dormancy and Physiological Age of Seed Tubers from a Diverse Set of Potato Cultivars Grown at Different Altitudes and in Different Seasons in Kenya. Potato Res. 2023, 66, 1–25. [Google Scholar] [CrossRef]
  20. Loayza, H.; Moya, I.; Quiroz, R.; Ounis, A.; Goulas, Y. Active and passive chlorophyll fluorescence measurements at canopy level on potato crops. Evidence of similitude of diurnal cycles of apparent fluorescence yields. Photosynth. Res. 2023, 155, 271–288. [Google Scholar] [CrossRef]
  21. Sulkiewicz, M.; Ciereszko, I. Fluorescence of chlorophyl a—History of discovery and application in plant research. Cosmos. Probl. Biol. Sci. 2016, 65, 103–115. (In Polish) [Google Scholar]
  22. WRB. World Reference Base for Soil Resources 2014 International Soil Classification System for Naming Soils and Creating Legends for Soil Maps. In World Soil Resources Reports 106; Food and Agriculture Organization of The United Nations: Rome, Italy, 2014. [Google Scholar]
  23. Iriti, M.; Scarafoni, A.; Pierce, S.; Castorina, G.; Vitalini, S. Soil application of effective microorganisms (EM) Maintains leaf photosynthetic efficiency, increases seed yield and quality traits of bean (Phaseolus vulgaris L.) plants grown so different substrates. Int. J. Mol. Sci. 2019, 20, 2327. [Google Scholar] [CrossRef] [PubMed]
  24. Gałązka, A.; Kocoń, A. Evaluation of the effectiveness of preparations with beneficial microorganisms on the enzymatic activity of soil. Stud. I Rap. 2015, 45, 143–154. [Google Scholar]
  25. Lenartowicz, T. Descriptive List of Agricultural Cultivars. Potato; COBORU Publishing House: Słupia Wielka, Poland, 2022; p. 38. (In Polish) [Google Scholar]
  26. Duer, I.; Fotyma, M.; Madej, A. Code of Good Agricultural Practice, 2nd revised ed.; Foundation of Assistance Programs for Agriculture: Warsaw, Poland, 2004. (In Polish) [Google Scholar]
  27. Roztropowicz, S.; Czerko, Z.; Głuska, A.; Goliszewski, W.; Gruczek, T.; Lis, B.; Lutomirska, B.; Nowacki, W.; Rykaczewska, K.; Sowa-Niedziałkowska, G.; et al. Methodic of Observation, Measurements and Sample Take in Agricultural Experiments with Potato; Plant Breeding Acclimatization Institute: Jadwisin, Poland, 1999; p. 50. (In Polish) [Google Scholar]
  28. Krełowska-Kułas, M. Badanie Jakości Produktów Spożywczych; Państ. Wydaw. Ekonomiczne: Warszawa, Poland, 1993; (Krak.: DNar.). 554 ss. Identyfikator; Available online: http://polona.pl/item/1555918 (accessed on 25 September 2023). (In Polish)
  29. Tajner-Czopek, A. Methodology for determining the technological value and consumer quality of potato. Zeszyty Problemowe Postępów Nauk Rolniczych. Adv. Agric. Sci. 2006, 511, 95–103. (In Polish) [Google Scholar]
  30. Scope of Accreditation for Testing, PCA Scope of Accreditation No. AB 128. Available online: https://www.bosmal.com.pl/userfiles/plik/1525079239.pdf (accessed on 25 September 2023).
  31. ISO 10390:2005; Soil Quality—Determination of pH. ISO: Geneva, Switzerland, 2005. Available online: https://www.iso.org/standard/40879.html (accessed on 9 June 2023).
  32. Polish Standard PN-R-04023:1996; Chemical and Agricultural Analysis of Soil. Determination of Available Phosphorus Content in Mineral Soils. Polish Committee for Standardization: Warsaw, Poland, 1996. (In Polish)
  33. Polish Standard PN-R-04022: 1996 + AZ1: 2002; Chemical and Agricultural Analysis of Soil. Determination of Available Potassium Content in Mineral Soils. Polish Committee for Standardization: Warsaw, Poland, 2002.
  34. Polish Standard PN-R-04020 1994 + AZ1: 2004; Chemical and Agricultural Analysis of Soil. Polish Committee for Standardization: Warsaw, Poland, 2004. (In Polish)
  35. Mocek, A. Soil Science; State Scientific Publisher: Warsow, Poland, 2015; p. 571. [Google Scholar]
  36. Nawrocki, S. Fertilizer Recommendations. Limit Numbers for Valuation of Macro- and Micronutrient Content in Soils; IUNG Publishing House: Pulawy, Poland, 1985; p. 38. (In Polish) [Google Scholar]
  37. Skowera, B. Changes of hydrothermal conditions in the Polish area (1971–2010). Fragm. Agron. 2014, 31, 74–87. [Google Scholar]
  38. SAS Institute Inc. SAS/STAT®9.2 User’s Guide; SAS Institute Inc.: Cary, NC, USA, 2008. [Google Scholar]
  39. Koronacki, J.; Mielniczuk, J. Statistics for Students of Technical and Natural Sciences; Scientific and Technical Publishing House: Warsaw, Poland, 2009; p. 491. (In Polish) [Google Scholar]
  40. IBM. SPSS Statistics 28 User’s Guide—IBM Core System. Available online: https://www.ibm.com/docs/en/SSLVMB_28.0.0/pdf/IBM_SPSS_Statistics_Core_System_User_Guide.pdf (accessed on 25 September 2023).
  41. Starck, Z. The role of aquaporins in water transport in plants. Zesz. Probl. Postępów Nauk Rol. Adv. Agric. Sci. 2010, 1, 9–26. (In Polish) [Google Scholar]
  42. Figueroa, F.L.; Conde-Álvarez, R.; Gómez, I. Relations between electron transport rates determined by pulse amplitude modulated chlorophyll fluorescence and oxygen evolution in macroalgae under different light conditions. Photosynth. Res. 2003, 75, 259–275. [Google Scholar] [CrossRef] [PubMed]
  43. Strihz, I.G.; Lysenko, G.G.; Neverov, K.V. Photoreduction of molecular oxygen in preparation of photosystem II under photoinhibitors conditions. Rus. J. Plant Physiol. 2005, 52, 717–723. [Google Scholar]
  44. Eyvazov, E.G. The Evaluation of the Potato Collection Samples According to Some Physiological Indicators and the Choosing of the Primary Donors for the Selection. Adv. Stud. Biol. 2023, 15, 137–147. [Google Scholar] [CrossRef]
  45. Kaczmarek, Z.; Jakubus, M.; Grzelak, M.; Mrugalska, L. Impact of the addition of various doses of Effective Microorganisms to arable-humus horizons of mineral soils on their physical and water properties. J. Res. Appl. Agric. Eng. 2008, 53, 118–121. [Google Scholar]
  46. Janas, R. Possibilities of using Effective Microorganisms in ecological crop production systems. Probl. Inżynierii Rol. 2009, 3, 111–119. (In Polish) [Google Scholar]
  47. Brestic, M.; Zivcak, M. PSII Fluorescence techniques for measurement of drought and Hight temperature stress signal in crop plants: Protocols and applications. In Molecular Stress Physiology of Plants; Springer: Dordrecht, Switzerland, 2013; pp. 81–131. [Google Scholar]
  48. Li, X.; Guo, Q.; Wang, Y.; Xu, J.; Wei, Q.; Chen, L.; Liao, L. Enhancing Nitrogen and Phosphorus Removal by Applying Effective Microorganisms to Constructed Wetlands. Water 2020, 12, 2443. [Google Scholar] [CrossRef]
  49. Okumoto, S.; Shintani, M.; Higa, T. The use of effective microorganisms and biochar inhibits the transfer of radioactive cesium from soil to plant during continuous Komatsu cultivation. In Proceedings of the International Scientific Conference “Radiobiology: Present”, Gomel, Belarus, 26–27 September 2019. [Google Scholar]
  50. Van Vliet, P.C.J.; Bloem, J.; de Goede, R.G.M. Microbial diversity. nitrogen loss and grass production after addition of Effective Micro-organisms (EM) to slurry manure. Appl. Soil Ecol. 2006, 32, 188–198. [Google Scholar] [CrossRef]
  51. Martyniuk, S.; Księżak, J. Evaluation of the impact of pseudo-microbial biopreparations used in plant cultivation. Pol. J. Argonomy 2011, 6, 27–33. (In Polish) [Google Scholar]
  52. Małuszyńska, E.; Szydłowska, A.; Martyniak, D.; Dziamba, S.; Dziamba, J. Effect of preparations containing effective microorganisms on the germination capacity of seeds from organic farming. Bull. IHAR 2012, 263, 33–42. (In Polish) [Google Scholar] [CrossRef]
  53. Pilarska, A.A.; Pilarski, K.; Wolna-Maruwka, A. The Influence of Effective Microorganisms on the Content of Selected Nutrients in Vegetables. In Current Trends in Quality Science–Design, Quality and Safety of Products; Institute of Quality Science, Poznań University of Economics & Business: Poznań, Poland, 2021; pp. 104–110. [Google Scholar]
  54. Polivanova, O.B.; Tiurin, K.N.; Sivolapova, A.B.; Goryunova, S.V.; Zhevora, S.V. Influence of Increased Radiation Background on Antioxidative Responses of Helianthus tuberosus L. Antioxidants 2023, 12, 956. [Google Scholar] [CrossRef] [PubMed]
  55. Vaitkevičienė, N.; Kulaitiene, J.; Jariene, E.; Levickiene, D.; Danilcenko, H.; Średnicka-Tober, D.; Rembiałkowska, E.; Hallmann, E. Characterization of Bioactive Compounds in Colored Potato (Solanum tuberosum L.) Cultivars Grown with Conventional, Organic, and Biodynamic Methods. Sustainability 2020, 12, 2701. [Google Scholar] [CrossRef]
  56. Dighton, J.; Tugay, T.; Zhdanova, N. Fungi and Ionizing Radiation from Radionuclides: Fungi and Ionizing Radiation. FEMS Microbiol. Lett. 2008, 281, 109–120. [Google Scholar] [CrossRef] [PubMed]
  57. Sharma, P.; Kalita, M.C.; Thakur, D. Broad Spectrum Antimicrobial Activity of Forest-Derived Soil Actinomycete, Nocardia sp. PB-52. Front. Microbiol. 2016, 18, 347. [Google Scholar] [CrossRef]
  58. Chęciński, G.; Czernaś, K. Beneficial microorganisms “ProBio-Emy” and their practical application. Gas Water Sanit. Technol. 2012, 2, 58–61. (In Polish) [Google Scholar]
  59. FAO. FAOO Chart—The State of Food Security and Nutrition in the World 2023. In Urbanization, Agrifood Systems Transformation and Healthy Diets across the Rural–Urban Continuum; FAO: Rome, Italy, 2023; Available online: https://www.fao.org (accessed on 7 August 2023).
  60. Kondhare, K.R.; Kumar, A.; Patil, N.S.; Malankar, N.N.; Saha, K.; Banerjee, A.K. Development of aerial and belowground tubers in potato are governed by photoperiod and epigenetic mechanism. Plant Physiol. 2021, 187, 1071–1086. [Google Scholar] [CrossRef]
  61. Sawicka, B.; Hulail Noaema, A.; Hameed, S.T.; Skiba, D. Genotype and environmental variability of chemical elements in potato tubers. Acta Sci. Pol. Agric. 2016, 15, 79–91. [Google Scholar]
  62. Seid, E.; Tessema, L.; Abebe, T.; Solomon, A.; Chindi, A.; Hirut, B.; Negash, K.; Shunka, E.; Mogse, Z.; Burgos, G.; et al. Genetic Variability for Micronutrient Content and Tuber Yield Traits among Biofortified Potato (Solanum tuberosum L.) Clones in Ethiopia. Plants 2023, 12, 2625. [Google Scholar] [CrossRef]
  63. Ahmad, D.; Zhang, Z.; Rasheed, H.; Xu, X.; Bao, J. Recent Advances in Molecular Improvement for Potato Tuber Traits. Int. J. Mol. Sci. 2022, 1, 9982. [Google Scholar] [CrossRef]
  64. Yan, W.; Qin, J.; Jian, Y.; Liu, J.; Bian, C.; Jin, L.; Li, G. Analysis of Potato Physiological and Molecular Adaptation in Response to Different Water and Nitrogen Combined Regimes. Plants 2023, 12, 1671. [Google Scholar] [CrossRef] [PubMed]
  65. Levina, A.V.; Hoekenga, O.A.; Gordin, M.; Broeckling, C.; De Jong, W.S. Applying network and genetic analysis to the potato metabolome. Front. Plant Sci. 2023, 14, 10. [Google Scholar] [CrossRef] [PubMed]
  66. Boguszewska-Mańkowska, D.; Ruszczak, B.; Zarzyńska, K. Classification of Potato Varieties Drought Stress Tolerance Using Supervised Learning. Appl. Sci. 2022, 12, 1939. [Google Scholar] [CrossRef]
Figure 1. Distribution of precipitation and air temperature during the potato growing season at the meteorological station in Uhnin in 2017–2019.
Applsci 13 10764 g001
Figure 2. Values of the Pearson’s correlation coefficients. y1—total tuber yield, y2—dry matter content, y3—tuber dry matter yield, y4—starch content, y5—starch yield, x1—minimum chlorophyll fluorescence yield (Fo), x2—maximum chlorophyll fluorescence yield (Fm), x3—maximum photochemical efficiency of Photosystem II (Fv/Fm), x4—actual photochemical efficiency of Photosystem II (Y), x5—Fo′—zero, initial (minimal) fluorescence on light, x6—Fm′—maximum fluorescence on light, x7—Y—actual photochemical efficiency of Photosystem II, x8—qP—photochemical fluorescence quenching coefficient, x9—qN—non-photochemical fluorescence quenching coefficient.
Applsci 13 10764 g002
Table 1. Description of the potato cultivars grown in the experiment.
CultivarsMaturity GroupColor of SkinColor of the FleshShape of the
Tubers
Type
Consumption
Taste
9° Scale *
‘Denar’Very earlyYellowLight YellowRound OvalAB7
‘Bellarosa’EarlyRedYellowRound OvalB7
‘Gwiazda’EarlyYellowYellowRound OvalB7
‘Ignacy’EarlyYellowLight YellowRound OvalB6.5
‘Owacja’EarlyYellowLight YellowRound OvalB-BC7
‘Vineta’EarlyYellowYellowRoundAB7
‘Finezja’Medium earlyYellowLight YellowRound OvalBC6.5
‘Oberon’Medium earlyRedLight YellowOvalAB7
‘Satina’Medium earlyYellowYellowRound OvalB7.5
‘Tajfun’Medium earlyYellowYellowOvalB-BC7
‘Jelly’Medium lateYellowYellowOvalB7.5
‘Mondeo’Medium lateYellowCreamyRound OvalB-BC6.7
‘Syrena’Medium lateYellowYellowOvalB7
‘Kuras’lateYellowCreamyRoundB6
* Depth of the tuber meshes (in the 9° scale) 1°—very deep, 9°—very shallow; consumable type: AB—salad, B—general, BC—slightly floury, C—floury.
Table 2. Physical and chemical properties of the soil in Parczew (2017–2019).
Years of StudyAssimilable Macronutrient Content
[mg kg−1 of soil]
Humus Content
[g kg−1 of soil]
pH in KCl
P2O5K2OMg
2017172138491.116.10
2018184126541.146.20
2019176141521.126.30
Average177135521.126.20
Source: Own study derived from data provided by the Regional Chemical and Agricultural Station in Lublin.
Table 3. Influence of pre-planting treatments, cultivars, and years of research on the values of the physiological indicators of potatoes.
Experimental FactorsPhysiological Indicators of Plant Growth
FoFmFv/FMFo′Fm′YQpQn
Pre-plantingtreatmentsControl object0.218 a0.814 a0.580 a0.188 b0.324 a0.363 a0.499 a0.130 a
Exposition I *0.230 b0.861 b0.626 b0.211 c0.381 c0.402 b0.581 c0.145 b
Exposition II **0.227 a0.866 b0.616 b0.178 a0.350 b0.361 a0.529 b0.125 a
HSD *** p≤0.050.0110.0430.0310.0100.0180.0170.0280.007
Cultivars‘Denar’0.205 a0.836 a0.586 a0.155 a0.329 a0.341 a0.489 a0.120 a
‘Bellarosa’0.217 a0.777 a0.542 a0.165 a0.311 a0.331 a0.460 a0.128 a
‘Gwiazda’0.204 a0.749 a0.548 a0.160 a0.318 a0.337 a0.470 a0.140 b
‘Ignacy’0.210 a0.786 a0.583 a0.172 a0.347 a0.376 a0.509 a0.139 ab
‘Owacja’0.208 a0.756 a0.559 a0.161 a0.323 a0.335 a0.484 a0.128 a
‘Vineta’0.225 a0.856 a0.592 a0.181 a0.349 a0.380 a0.590 b0.138 ab
‘Finezja’0.226 a0.835 a0.610 a0.204 b0.343 a0.401 ab0.556 a0.134 ab
‘Oberon’0.254 a0.975 b0.672 b0.210 b0.397 b0.372 a0.604 b0.134 ab
‘Satina’0.252 a0.985 b0.687 b0.225 b0.375 a0.408 b0.641 b0.152 b
‘Tajfun’0.228 a0.857 a0.615 a0.214 b0.357 a0.404 b0.548 a0.135 a
‘Jelly’0.242 a0.899 a0.670 b0.213 b0.390 ab0.405 b0.591 b0.137 a
‘Mondeo’0.240 a0.887 a0.629 a0.217 b0.371 a0.420 b0.570 b0.141 b
‘Syrena’0.230 a0.861 a0.641 a0.221 b0.372 a0.421 b0.551 a0.131 a
‘Kuras’0.203 a0.800 a0.575 a0.188 a0.338 a0.327 a0.445 a0.110 a
HSD p≤0.05ns ****0.2020.1250.0460.0840.0770.1250.030
Years20170.228 b0.823 a0.627 a0.194 a0.356 b0.345 a0.490 a0.138 b
20180.244 c0.842 a0.592 a0.194 a0.324 a0.403 c0.541 b0.115 a
20190.202 a0.876 b0.605 a0.187 a0.375 c0.379 b0.578 c0.147 c
HSD p≤0.050.0130.050ns ****ns ****0.0180.0220.0320.008
Mean0.2250.8470.6080.1920.3510.3760.5360.133
Fo—minimum fluorescence yield, Fm—maximum fluorescence yield, Fv/Fm—maximum photochemical efficiency of PSII, Fo’—zero, initial (minimal) fluorescence under light, Fv—variable fluorescence yield, Y—actual photochemical efficiency of PSII, qP—photochemical fluorescence quenching coefficient, qN—non-photochemical fluorescence quenching coefficient; * 10-min exposure; ** 15-min exposure; HSD ***—honestly significant difference; **** No significant differences at the level of p < 0.05; letter indicators (a, b, c, etc.) next to the mean values indicate homogeneous (statistically homogeneous) groups. The presence of the same letter indicator next to the means signifies that there were no statistically significant differences at the p < 0.05 level between them.
Table 4. Dry matter and starch content variation based on the pre-treatment methods, cultivars, and years.
Experimental FactorsDry Matter
(%)
Starch
(%)
Pre-planting
treatments
Control object20.2 a15.2 a
Exposition I *20.4 a15.4 a
Exposition II **20.6 a15.4 a
HSD *** p≤0.05ns ****ns ****
Cultivars‘Denar’16.3 a12.4 a
‘Bellarosa’18.0 a13.8 a
‘Gwiazda’16.5 a13.3 a
‘Ignacy’18.0 a13.6 a
‘Owacja’17.7 a13.8 a
‘Vineta’19.3 a14.5 a
‘Finezja’23.9 c18.0 bc
‘Oberon’20.8 b15.6 ab
‘Satina’21.5 b15.7 ab
‘Tajfun’23.0 bc17.4 bc
‘Jelly’20.2 b14.8 b
‘Mondeo’22.1 b16.2 b
‘Syrena’21.0 b15.5 b
‘Kuras’28.0 d20.3 c
HSD p≤0.053.82.9
Years201720.1 a15.1 a
201820.7 a15.7 b
201920.3 a15.2 a
HSD p≤0.05ns ****0.6
Mean20.415.4
* 10-min exposure, ** 15-min exposure, HSD ***—Honestly Significant Difference; **** No significant differences at the p < 0.05 level. Letter indicators (a, b, c) next to the mean values denote homogeneous (statistically homogeneous) groups. The presence of the same letter indicator next to the means indicates that there were no statistically significant differences at the p ≤ 0.05 level between them.
Table 5. Yield of fresh mass, dry matter, and starch in potato tubers under the influence of pre-planting treatments, cultivars, and years.
Experimental Factors *Yield (t ha−1)
Yield of Fresh MassDry Mass YieldStarch Yield
Pre-planting
treatments
Control object37.78 a7.57 a5.73 a
Exposition I46.63 b9.53 b7.15 b
Exposition II45.09 b9.28 b6.96 b
HSD *** p≤0.052.370.420.33
Cultivars‘Denar’48.57 c7.98 b6.05 b
‘Bellarosa’38.09 a6.88 a5.23 a
‘Gwiazda’43.56 b7.35 a5.71 b
‘Ignacy’48.58 c8.79 b6.63 b
‘Owacja’36.46 a6.56 a5.02 a
‘Vineta’40.86 b7.86 b5.92 b
‘Finezja’40.18 b9.56 bc7.20 c
‘Oberon’39.88 b8.26 b6.21 b
‘Satina’48.48 c10.33 c7.66 c
‘Tajfun’42.97 b9.88 c7.46 c
‘Jelly’41.42 b8.31 b6.17 b
‘Mondeo’48.14 c10.49 c7.82 c
‘Syrena’45.63 c9.42 bc7.05 c
‘Kuras’41.56 b11.41c8.48 c
HSD p≤0.054.541.971.54
Years201745.47 b9.10 b6.84 b
201835.66 a7.35 a5.57 a
201948.22 c9.89 c7.43 c
HSD p≤0.052.370.420.33
Mean43.178.796.61
* The notations remain consistent with those in Table 3.
Table 6. Descriptive characteristics of the yield, its most important economic features, and the physiological indicators of potato.
Specificationy1y2y3y4y5x1x2x3x4x5x6x7x8
Mean43.1720.388.7915.366.610.220.850.610.190.350.370.540.13
Median43.5120.138.7415.106.570.220.850.600.190.350.370.520.14
Standard error0.450.150.130.110.100.000.010.000.000.000.000.010.00
Standard deviation8.523.002.542.181.860.040.100.080.040.060.060.100.02
Kurtosis−0.690.48−0.460.44−0.50−0.661.960.292.327.27−0.730.000.00
Skewness−0.090.680.260.690.250.410.770.151.031.610.390.300.11
Range49.3814.5311.5510.908.600.150.650.440.250.500.270.550.14
Minimum19.5214.533.7810.902.900.160.600.370.100.230.260.320.07
Maximum68.9029.0715.3321.8011.500.311.250.800.350.730.530.870.21
V (%)24.9914.7028.8514.2228.1215.7412.3912.9920.4015.7216.6319.3818.37
y1—total yield of tubers, y2—dry matter content, y3—tuber dry matter yield, y4—starch content, y5—starch yield, x1—minimum chlorophyll fluorescence yield (F0), x2—maximum chlorophyll fluorescence yield (Fm), x3—maximum photochemical efficiency of photosystem (PS) II (Fv/Fm), x4—Fo′—zero, initial (minimal) fluorescence on the light, x5—Fm′—maximum fluorescence on light, x6—Y—actual photochemical efficiency of PSII, x7—qP—photochemical fluorescence quenching coefficient, x8—qN—nonphotochemical fluorescence quenching coefficient.
Disclaimer/Publisher’s Note: The statements, opinions and data contained in all publications are solely those of the individual author(s) and contributor(s) and not of MDPI and/or the editor(s). MDPI and/or the editor(s) disclaim responsibility for any injury to people or property resulting from any ideas, methods, instructions or products referred to in the content.

