Abstract
With the recent development of drone technology, drones are being used in various fields. Drones have the advantage of being equipped with various devices to move freely and perform various tasks. In the field of inventory management, many studies have been conducted into management automation based on the drone. Drones scan a marker, such as a quick response code (QR code), attached to the shelves to obtain location information of the shelves on which the inventory is loaded. At the same time, drones perform inventory management by scanning the marker attached to the inventory to obtain inventory information. However, unlike indoor warehouses, where grids or shelves are well-defined, a storage yard is not fixed in the location where the inventory is stored. It is difficult to recognize the loading position from the marker for a storage yard without shelves and grids. Furthermore, the loading position of the inventory is not fixed. For the automation of inventory management of warehouses where shelves and grids are undefined, this paper proposes a framework that estimates the inventory 3D position in the video frame based on a deep learning model. The proposed framework uses the image segmentation model to detect and decode the marker in the video frame to estimate the 3D position of a drone and inventory. In addition, the estimated inventory 3D position is corrected using the continuity of the video frame. Experiment results on the video dataset verified that the proposed framework improved the 3D position estimation performance of the inventory. Consequently, efficient inventory management based on drones can be performed through the proposed framework for the 3D position estimation of inventory in all types of warehouses.
1. Introduction
This paper is an extension of the work originally presented in [1]. We extend our previous work from images of two viewpoints to the video frame. Furthermore, we propose a novel method for improving the accuracy of estimating the 3D position of inventory in the video frame. Finally, we validate the proposed framework using our generated datasets. In recent years, drones have become common throughout the world, and have been used in various fields [2]. Efficient routing with drones was proposed to minimize the time to serve all customers respecting all priority constraints [3]. The prevalence of drones has reduced the risk of accidents in hazardous work environments, and has enabled extensive exploration and long-term monitoring [4]. The traceability and monitoring of inventory in warehouses, one of the areas where drones are utilized, are essential factors in the durability of a company [5]. Several studies on drone-based inventory management have been conducted to improve the efficiency of inventory management [6,7]. Recently, as the performance of deep learning models has improved, vision-based inventory management research using a drone-mounted monocular camera has been conducted.
The vision-based position estimation technology is divided into feature point-based position estimation in the environment and marker-based position estimation [8]. Feature point-based position estimation has the advantage of being able to be used without additional work, such as attaching markers for application to the environment. However, its limitations are that complex operations for feature point recognition are required and that the application is limited in spaces with fewer feature points [9]. On the other hand, marker-based position estimation is not significantly affected by spatial characteristics. Recently, the drone-based inventory management automation method using the recognition of markers attached to inventory, such as barcodes and quick response codes (QR codes), has been proposed. Markers attached to shelves, floors, and walls guide the current position and movement path of a drone. For the inventory management of the warehouse, the drone moves along the guided route and scans the markers attached to the inventory. In the case of an indoor warehouse, the storage area of the inventory is clearly divided in the 3D space using shelves and grids. The position of the marker attached to the inventory may be specified using the information of the markers attached to shelves and grids in the same frame. However, in a storage yard without shelves and grids, the storage area of the inventory is not clearly classified. In other words, in a storage yard, the storage area of the inventory is flexible. In particular, it is difficult to obtain the height of the location where the inventory is stored in a warehouse without shelves. Most often, inventory management studies using drones have been conducted in warehouses with shelves and grids [6,7]. Therefore, 3D positional estimation of inventory, including height, is necessary for inventory management automation in a storage yard. The inventory 3D position should be able to be estimated using the video of the warehouse or storage yard taken by a drone along the path of movement. Therefore, a method for 3D position estimation in the video frame is required. To solve this, a framework is proposed for 3D position estimation of the inventory QR code attached to the inventory in the video frame, using the ground QR code attached to the floor and the drone-mounted monocular camera, as shown in Figure 1. The proposed framework does not require shelves and grids for 3D position estimation of inventory. Furthermore, if drones could capture the QR code regardless of the presence of shelves and grids, the proposed framework is available in warehouses or storage yards with and without shelves and grids. Furthermore, a method for error correction of the estimated inventory 3D position in the video frame is proposed. The segmentation model [10] was trained to detect the area of an object in an image. Then, the QR code area was detected from the video frame. The dataset for segmentation model learning was generated by synthesizing the QR code with size, rotation, and perspective distortion in the background image [11]. The generated dataset was used to fine-tune the segmentation model pre-trained with ImageNet [12]. Decoding is performed after detecting the QR code area in the video frame with the fine-tuned segmentation model and correcting the QR code distortion. In the case of ground QR codes as a result of decoding, the drone’s 3D position is estimated using the 3D positional information stored in the QR code. Furthermore, the 2D coordinates of the QR code is detected from the image. An equation of a straight line in 3D space passing through the inventory is derived from a drone’s position at the time of frame shooting estimated through the ground QR code and the 2D coordinates of the inventory QR code detected in the image. After deriving equations of the straight line from all the video frame, frames in which the estimated drone position were determined to be outliers are detected. Then, the outlier frames are removed to minimize errors in 3D inventory position estimation. The inventory 3D position was estimated with pairs of straight lines derived from the video frame other than the outliers. Finally, the 3D position estimation result of the inventory is corrected using the angle between the straight pairs. The proposed framework consists of deep-learning-based QR code recognition, drone 3D position estimation, outlier frame removal, inventory 3D position estimation, and error correction. Deep-learning-based QR code recognition shows that a high level of marker recognition is possible by combining the segmentation model and the computer vision algorithm. Outlier frame removal and error correction shows the relationship between the angles between epipolar lines and the estimated inventory 3D position. It also shows that it is possible to correct the estimated 3D position error using this relationship. The contributions of our study can be summarized as follows:
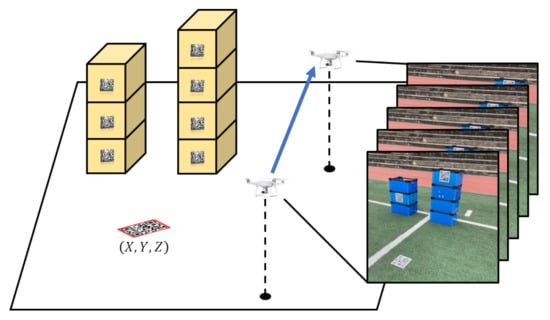
Figure 1.
Illustration of 3D position estimation of objects in the video frame for inventory management automation.
- 3D position estimation of inventory based on the deep learning model using a drone. We propose the 3D position estimation framework for the inventory based on the deep learning model using the QR code and drone-mounted monocular camera. The proposed framework estimates the 3D position of the inventory from the video frame using the deep learning model trained from our generated dataset.
- Estimated inventory 3D position correction method. We improved the performance of the inventory 3D position estimation by removing frames where the estimated drone position is an outlier. In addition, the method of correcting the estimated inventory 3D position through the relationship between the captured video frame is proposed.
- Performance analysis and comparison of the proposed model through the ablation study. We performed the ablation study about the proposed framework to verify that the proposed correction method improves the performance of 3D position estimation of the inventory. The 3D position estimation performance of the inventory was evaluated using videos captured in various real environments.
Although inventory management automation studies using drones have been conducted, the 3D position estimation of the inventory based on deep learning model and the error correction method using the characteristics of the video frame are new to the best of the authors’ knowledge. The rest of our research is structured as follows. Section 2 describes the background and reviews previous studies on drone-based inventory management, position estimation, and image segmentation. Section 3 details the proposed 3D position estimation framework of inventory, including the overall architecture. Section 4 describes the generated dataset and evaluates the QR code decoding performance of the trained segmentation model and the 3D position estimation performance of the proposed framework. Furthermore, Section 4 discusses the results of the study in detail. Finally, Section 5 summarizes and concludes the paper, and describes future research directions to extend the proposed framework.
2. Literature Review
Recently, studies for inventory management automation using drones in various fields have been conducted. These studies mainly searched the movement path of drones, or scanned the product by recognizing the marker with the drone-mounted monocular camera. Section 2.1 reviews previous inventory management studies based on drones. Section 2.2 reviews studies of the QR code recognition and position estimation, which are mainly used for inventory management automation. Section 2.3 reviews the studies of semantic segmentation used for QR code recognition.
2.1. Inventory Management Using Drones
As drone technology develops, drones are being used in various fields. For inventory management automation, studies using drones have also been conducted. Cho et al. [13] proposed a framework that uses the Histogram of Gradient and Local Binary Pattern to extract the feature map of the warehouse and finally detect the two-dimensional location of QR codes by classifying them via a support vector machine (SVM). Ramaswamy et al. [14] proposed the frame stitching method for images taken with the camera mounted on a drone to obtain data by restoring the corrupted context of images taken from the indoor warehouse. Anand et al. [15] proposed a grid localization framework based on image-processing algorithms, such as thick line detection, using the drone-mounted low-cost camera for large-scale warehouse system automation. Almalki [16] proposed a remote aviation autonomous sensing model that combines radio frequency identification (RFID) sensors with drones for food safety and security. In addition, research has been conducted to estimate the relative position between RFID sensors attached to the product by mounting an RFID sensor on a drone [17]. For inventory management using drones, Cristiani et al. [18] proposed and implemented the generic architecture that scans products along a given movement path. Manjrekar et al. [19] proposed a cost-friendly solution by using a drone that scans barcodes attached to products and stores product information in the database to regularly manage inventory in warehouses. Martinez et al. [20] estimated the position of a drone using the ArUco marker attached to shelves for book inventory management. Radácsi et al. [6] proposed an inventory management model using drones that is effective for exploring shelf systems structure of the warehouse. Gubán and Udvaros [7] presented a mathematical model and a solution for a multi-user warehouse inventory using drones, relying on its own movement and the pre-planned path. In the field of drone-based inventory management automation, research was conducted based on warehouses where shelves and grids were defined. Therefore, as shown in Figure 2 (left), the position of the inventory was determined by the marker attached to the shelf. However, it is difficult to apply to the warehouse where shelves and grids are not defined, such as a storage yard. Yoon et al. [1] estimated the object 3D position using two pictures taken of four ground markers and one object marker without shelves and grids. However, it is practically difficult to put more than four ground markers in a single picture. In this study, as shown in Figure 2 (right), it was improved to use only one ground marker. Furthermore, the framework has been improved to use the video frame rather than two pictures. In addition, to improve the performance of 3D position estimation, the proposed framework includes outlier frame removal and error correction utilizing continuity of the video frame.
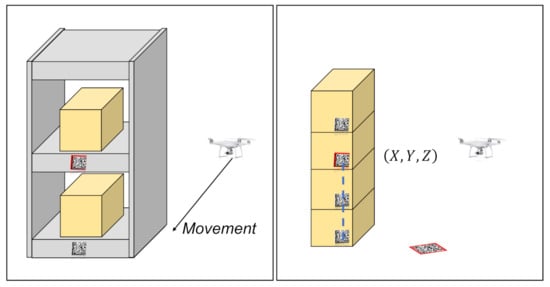
Figure 2.
Previous work in drone-based inventory management (left). Proposed framework (right).
2.2. Position Estimation Based on the QR Code Recognition
The QR code is one of the typical markers used for the inventory management. QR codes are used to provide information about the product through scanning by attaching to the product, or to navigate unmanned vehicles and unmanned aircraft. Studies have been conducted to recognize QR codes in noisy environments, such as a warehouse. Blanger and Hirata [21] improved QR code detection performance by learning to detect the finder patterns (FIPs, a squared pattern present at three corners of the QR code) of the QR code by utilizing a single-shot detector architecture, a deep-learning-based object detection model. Yuan et al. [22] proposed a method to improve the performance of the QR code positioning by combining AdaBoost-SVM with Binarized Normed Gradients to solve the real-time positioning problem [23], which yields fast calculations, but provides low recovery rates. Yuan et al. [24] proposed MU R-CNN, which is a QR code detection model applicable to both low-definition and high-definition images, by combining Mask R-CNN [25], an object detection model, and U-Net [26], a segmentation model. Li et al. [27] proposed a method of correcting the QR code using the radius of cylinder to recognize the QR code whose curvature distortion occurred from being attached to the cylinder. Peng et al. [28] corrected the distortion of the QR code by applying affine transformation to the contour of the QR code detected by the edge detection algorithm as the minimum bounding box surrounding the QR code.
Studies have been conducted to estimate the position of drones and cameras using QR code recognition models. Choi et al. [29] implemented autonomous navigation based on self-localization to calculate 2D coordinates and rotation angles using QR codes and a monocular camera. Li and Huang [30] proposed an indoor positioning method based on a monocular camera and depth sensor using QR codes as a landmark. For position estimation of unmanned aerial vehicles, Lee et al. [31] proposed the monocular camera-based position estimation method using the SolvePnP algorithm and Kalman filter. Taketani and Kobayashi [32] implemented a self-localization system that performs self-position and self-orientation estimation of the mobile robot in 2D space using the sensor and QR code. Pan et al. [33] proposed a 3D position estimation method based on the monocular camera using two QR codes from an image. Martinez et al. [20] estimated 3D coordinates of remaining markers without 3D coordinates using 3D coordinates and images taken from multiple perspectives of initial markers. Furthermore, Kim et al. [34] proposed position estimation of the camera using FIPs and alignment patterns of a single QR code. Kang et al. [35] estimated the relative position of a drone with a fixed-sized QR code attached to the floor.
2.3. Image Segmentation
Image segmentation is a computer vision task that aims to label pixel-level corresponding categories. Image segmentation involves segmenting an image into multiple objects or segments [10]. Long et al. [36] first proposed an approach that adopted full convolutional networks (FCNs) for semantic segmentation. Long et al. proposed architecture that combines semantic information on the deep layer with appearance information on the shallow layer. However, FCN can ignore useful semantic context [37]. Methods of incorporating probabilistic models into the deep learning architecture proposed to improve FCN [38,39]. Popular deep model architectures for image segmentation are based on the encoder–decoder structure. Most deep-learning-based segmentation tasks use a kind of encoder–decoder model [37]. U-Net [26] is an encoder–decoder model that improves upon the FCN architecture using the skip connection which makes the feature map contain local information by skipping some layers. Zhou et al. [40] proposed U-Net++, which improved the performance of U-Net by redesigning the skip connection to reduce the semantic difference between the feature maps of encoder and decoder layers. Chen et al. [41] proposed DeepLab, a segmentation model based on the atrous convolution that explicitly control the resolution at which the feature response is calculated within deep learning model. Chen et al. [42] proposed DeepLabv3 based on modules which employ the atrous convolution to capture multi-scale context by adopting multiple atrous rates. Chen et al. [43] proposed DeepLabv3+, which combines the advantages of each of the spatial pyramid pooling module and the encode-decoder structure. Zhao et al. [44] proposed the pyramid scene parsing network (PSPNet), which exploits the capability of global context information using the pyramid pooling module. Recently, the segmentation study using high-spatial-resolution satellite images has been proposed. For an efficient land-cover semantic segmentation in high-spatial-resolution satellite images, Khan et al. [45] developed a hybrid segmentation model that combined the benefits of DenseNet [46] and U-Net. DSMSA-Net [47], an encoder–decoder network integrated with attention units, was proposed to handle road segmentation tasks in high-space resolution satellite images. Furthermore, Khan et al. [48] proposed a segmentation framework that extracts building footprints from satellite images.
3. Methodology
Previous inventory management automation studies have recognized the marker attached to shelves and grids where the inventory is placed without estimating the inventory 3D position by attaching the marker to well-defined shelves and grids. However, in a warehouse where shelves and grids are flexible, such as a storage yard, the marker for the position estimation of the inventory cannot be attached in advance. To solve this, it is necessary to estimate the inventory 3D position for the storage yard. Therefore, our research goal is to estimate the inventory 3D position. In this study, QR codes attached to the floor and inventory were used as markers to estimate the 3D position of a drone and inventory. In addition, we assumed that the drone is mounted with only a monocular camera, without expensive sensors, such as LiDAR. The proposed framework aims to utilize the QR code to estimate the inventory 3D position in the video frame.
3.1. Architecture
To estimate the inventory 3D position, we propose a novel 3D position estimation framework that includes QR code segmentation, outlier removal of estimated drone position, and error correction methods utilizing the characteristics of the video frame. Figure 3 represents the overall architecture of the proposed framework. The drone-mounted monocular camera capture QR codes attached to the floor and inventory, without a fixed path. The QR code decoding is performed after detecting and correcting the QR code area using the segmentation model on all the captured video frame. The drone’s 3D position is estimated using the 3D position information stored in the ground QR code and the 2D coordinates of the ground QR code detected from the frame. The outlier of the estimated position is detected, and removed by utilizing the characteristics of the video frame in the estimated 3D position set of the drone. A straight line is derived that simultaneously passes through the drone’s estimated 3D position and the inventory 3D position using the estimated 3D position set of the drone and the 2D coordinates of the inventory QR code detected from the image. The inventory 3D position is estimated from a pair of derived straight lines. Afterwards, the final inventory 3D position is derived by correcting the estimated inventory 3D position through an error correction method using the angle between the straight-line pairs. We detail the module of the proposed framework in the following subsections.
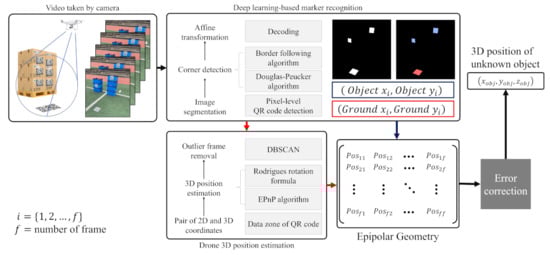
Figure 3.
Architecture framework of the proposed 3D position estimation model of the object in the video frame.
3.2. QR Code Segmentation and Decoding
In this study, the QR code area in the video taken with the monocular camera mounted on the drone is detected using the segmentation model. If the QR code is detected using the object detection model, the minimum bounding box containing the QR code is detected [24,28]. The bounding box, which is a result of the object detection model, includes a background. The background in the bounding box hinders distortion correction and decoding of the QR code. On the other hand, since the segmentation model is detected in units of pixels, the detailed edge of the detected object can be easily obtained. Thus, we used the segmentation model to detect the QR code area, and to obtain the edge. UNet, UNet++, PSPNet, DeepLabV3, and DeepLabV3+ were compared as the segmentation model for the proposed framework. Finally, UNet++, which had the best QR code decoding performance, was used.
The QR code attached to the floor and inventory is square, but perspective transformation occurs due to the photographed angle. To perform decoding by correcting the perspective transformation, four vertices of the detected QR code area are required. However, since the edge of the detected QR code contains noise, unlike the actual edge, the edge is approximated as a square using the Douglas–Peucker algorithm [49]. The approximation level of Douglas–Peucker algorithm is determined by a predefined epsilon. In this paper, the epsilon is set to 2% of the outline length. It is assumed that the ground QR code has information on the 3D position, while the inventory QR code has only information on the inventory, but not position. The type of detected QR code is determined as a result of decoding. In addition, the vertex of the data zone corresponding to the inside of the green line in Figure 4 was obtained through decoding, while the orientation of the QR code was obtained using the alignment pattern corresponding to the inside of the red line in Figure 4.

Figure 4.
Alignment patter (red) and data zone (green) of the QR code.
Errors may occur in the vertex coordinates of the QR code area detected by the segmentation model, depending on the performance of the model. However, as shown in Figure 5, if QR code decoding is possible, the coordinates of the vertex of the data zone can be obtained relatively uniformly, even if the error occurs in the vertex coordinates of the detected QR code area. Therefore, the drone’s 3D position estimated using the vertex of the data zone is smaller in error than the drone’s 3D position estimated using the vertex of the QR code detected by the segmentation model.
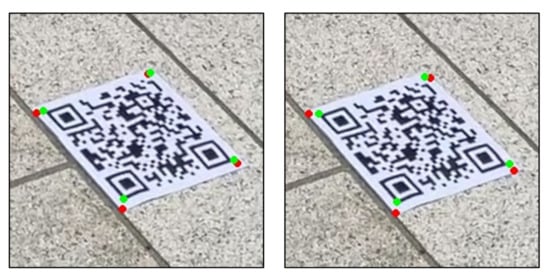
Figure 5.
Estimated vertices of QR code (red) detected by the segmentation model and data zone (green).
3.3. Drone 3D Position Estimation and Outlier Frame Removal
Only frames in which both ground QR code and inventory QR code were detected in all captured frames were used in the subsequent process. The drone’s 3D position is estimated using ground QR codes. The problem of solving the camera pose using the 3D–2D correspondence point relationship is called the Perspective-n-Point (PnP) problem [50]. To solve the PnP problem, several algorithms, such as Perspective-Three-Point [51], Direct Least-Squares [52], and Effective PnP (EPnP) [53], have been proposed. To estimate the drone’s 3D position from the image, among them, we use an EPnP algorithm with both high accuracy of camera pose calculation and robustness. EPnP is an algorithm that computes the rotation vector and translation vector from four or more pairs of 2D coordinates in image and 3D coordinates in the real world. However, it is very restrictive, in that more than four ground QR codes are photographed in one frame. To solve this problem, we used the vertices and orientation of the data zone obtained through the QR code decoding. 3D coordinates for the vertex of the data zone were derived using the 3D coordinates of the QR code stored in the ground QR code and orientation information. The rotation vector and translation vector t were derived from one ground QR code by utilizing the orientation of the QR code. Then, the rotation transformation matrix R was derived using the Rodrigues rotation and the rotation vector. The estimated drone 3D position is defined as below:
where corresponds to the 3D coordinates of the drone. However, due to several possible sources of noise in the process of estimating the drone’s 3D position, the estimated 3D positions of the drone may be outliers. Accordingly, the outlier was detected and removed from the estimated 3D positions of the drone using the continuity of the video frame. Since the video is continuously photographed, the estimated 3D positions of the drone are densely distributed along the movement path of the drone. If the estimated 3D position is the outlier, they are widely distributed and relatively low in density, because they move away from the movement path of the drone. We performed clustering of the estimated 3D positions of the drone using density-based spatial clustering of applications with noise (DBSCAN) [54]. The DBSCAN algorithm should predefine the minimum number of samples and epsilon, which means the distance between samples. In this paper, the epsilon is set to 0.2 and the minimum number of samples is set to 3. Algorithm 1 presents the detailed pseudocode for DBSCAN. After removing frames determined to be outliers, the cluster containing the largest number of frames was used to estimate the inventory 3D. Algorithm 2 presents the detailed pseudocode for outlier frame removal.
| Algorithm 1 DBSCAN pseudocode |
Require: set, D; minimum point, ; radius, |
Ensure: clustered C and un-clustered |
1: for each sample point in D do |
2: if is not visited then |
3: mark as visited |
4: sample points in of |
5: if then |
6: mark as |
7: else |
8: add to new cluster C |
9: for each sample point in do |
10: if is not visited then |
11: mark as visited |
12: sample points in |
13: of |
14: if then |
15: |
16: end if |
17: end if |
18: if is not yet member of any cluster then |
19: add to cluster C |
20: end if |
21: end for |
22: end if |
23: end if |
24: end for |
| Algorithm 2 Outlier frame removal pseudocode |
Require: Video frame, ; clustered C |
Ensure: Extracted frame, |
1: 0 |
2: for each clusterc in C do |
3: if () then |
4: |
5: |
6: end if |
7: end for |
8: for each video frame to do |
9: if then |
10: |
11: end if |
12: end for |
13: return |
3.4. Epipolar Geometry-Based Object 3D Position Estimation with Error Correction
In Section 3.3, R and t were derived using EPnP and the Rodrigues rotation formula. We derived straight lines on a per-frame basis, using R, t, and 2D coordinates corresponding to the center of the inventory QR code detected in the video frame.
where s is the scale, corresponds to the 2D coordinates, K is the camera-inherent parameter, is the projection, [] is the ridge transformation composed of R and t, and corresponds to the 3D coordinates of the inventory QR code. Thus, the formula for defining 3D coordinates of the inventory QR code was derived with (2) and the 2D coordinate of the inventory QR code. K can be derived through camera calibration, and [] is derived from the previous step. Thus, the matrix product of K, , and [] is a constant matrix as follows:
Using the 2D coordinate of the inventory QR code detected in the segmentation step, two planes in the 3D space can be derived as follows:
The intersection of the two planes is the straight line that passes through the inventory. Therefore, the inventory 3D position can be estimated by epipolar geometry using the set of straight lines that pass through the inventory. However, even though frames in which the drone’s estimated 3D positions are determined to be outliers are removed, the two straight lines may not intersect, due to the direction vector noise of the derived straight lines. Therefore, we estimated the inventory 3D position as the center of coordinates on two straight lines with the minimum distance between the two straight lines. The inventory 3D position was estimated for all possible straight pairs. Only pairs of straight lines with mismatched direction vectors of straight lines and the drone’s 3D positions estimated from two different frames were used to estimate the inventory 3D position.
We corrected the estimated inventory 3D position by using the angle between the straight lines used to estimate the inventory 3D position as weights. The direction vector of the derived straight line may have an error with the actual direction vector, due to noise that may occur in the previous step. The error of the direction vector could potentially introduce additional errors into the final 3D position estimation. We propose the error correction method to minimize errors in 3D position estimation due to the error in direction vector. The range of the angle between the combined straight lines is between 0 and . Figure 6 shows the positions of the inventory estimated from each other when the same level of direction vector error occurs for the straight pair for estimating the position of the inventory . The is closer to than , while is smaller than . In other words, as approaches , the error of the estimated 3D position at the same level of direction vector error decreases. Thus, the weighted average for can correct the 3D position estimation results of the inventory. We used weights based on to make the weights larger as approaches , and smaller as it approaches 0 or .
where are the direction vector of lines to estimate the object 3D position. The mean of calculated from all combinable straight-line pairs may not be 1. With a weighted sum, is always less than or equal to 1, so the inventory 3D position is estimated close to the origin, which increases the error.
where is a set of combinations for line pairs that can be combined. The , adjusted by the average of , was used as the weighting, as shown in (7). The inventory 3D position estimated using the proposed framework is as follows:
where is the object 3D position estimated from the line pair.
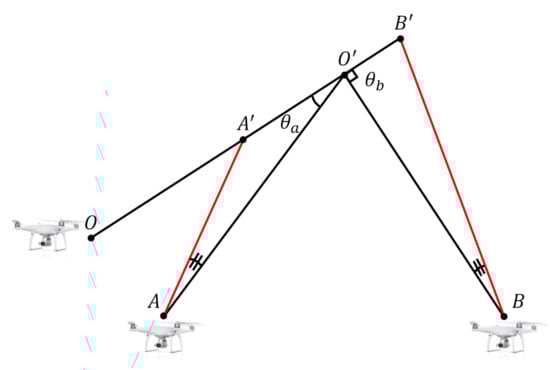
Figure 6.
Results of the position estimation based on the angle between line pairs for the same direction vector error. The red line means the estimated direction vector.
4. Results and Discussions
In this study, we generated a QR code image dataset for training the segmentation model. Furthermore, we generated the video dataset for performance evaluation of the proposed framework. Section 4.1 describes the generated datasets. Section 4.2 presents the results for the decoding test of the QR code detected by the trained segmentation model. Section 4.3 evaluates and compares the position estimation performance of the proposed framework using the video dataset generated with ground QR codes and inventory QR codes in real-world environments.
4.1. Dataset
When photographed with the drone-mounted monocular camera, the QR code attached to the floor and product is distorted, due to perspective transformation. Accordingly, the segmentation model should be able to detect the QR code in which distortion due to perspective transformation occurs in the video frame. We generated the train dataset of the segmentation model to detect QR code for which perspective transformation had occurred. The QR code is generated based on the Reed–Solomon code, which has the ability to restore images, even if some areas are missing or damaged. There are four levels of error recovery: L, M, Q, and H. The H with the best recovery performance can recover up to 30% of misses and losses. Warehouse, the inventory management space to use the QR code as the marker, is an environment where the QR code is prone to contamination and damage. Therefore, in this study, the experiment was performed using the QR code of the H level. The QR code generated in the form of square was randomly resized, perspective transformation was applied, and it was rotated randomly within . In order to apply the perspective transformation that can occur in reality, we adjusted the degree of distortion so that the order of the QR code vertices does not change.
We used the Places365 dataset for the background, which consists of scene categories [11]. The dataset for training the segmentation model was constructed by distorting the QR code and synthesizing them into the background image. In this, two to five QR codes were synthesized in one image. The QR codes attached as the markers for inventory management do not overlap each other. Thus, the QR codes that are synthesized onto the background image do not overlap one another. Furthermore, we generated the mask image representing the QR code area for the training of segmentation model. We synthesized the area of the QR code into white on the black background to generate the mask image. Figure 7 shows the dataset generation process. The size of the generated segmentation dataset is 640 × 640. The dataset was divided into 4000, 1000, and 1000 pieces of train, validation, and test datasets.
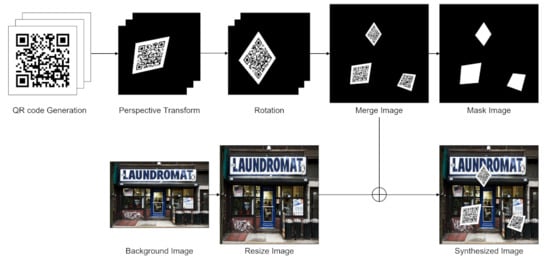
Figure 7.
Image synthesis for dataset generation.
For performance evaluation of the proposed framework, we generated the video dataset by photographing the ground QR code and inventory QR code in the real environment. Only one ground QR code was attached to the ground, and the 3D position of the center was defined as (0, 0, 0). The 3D positions of inventory QR codes were determined based on the actual distance from the ground QR code. In this study, 1 in 3D space means 1 m. The alignment pattern of the QR code is provided only in version 2 and later QR codes. The proposed framework uses the alignment pattern of the QR code to estimate the drone’s 3D position using one ground QR code. As shown in Figure 8, we built the version 3 QR code to a size of 0.2 m, and used it as the ground QR code and inventory QR code. We photographed the QR codes attached to the floor and inventory, and generated the video dataset for 50 inventory QR codes. The frame size of the generated video dataset is 1440 × 1440. In addition, the generated video dataset was shot at 30 frames per second.
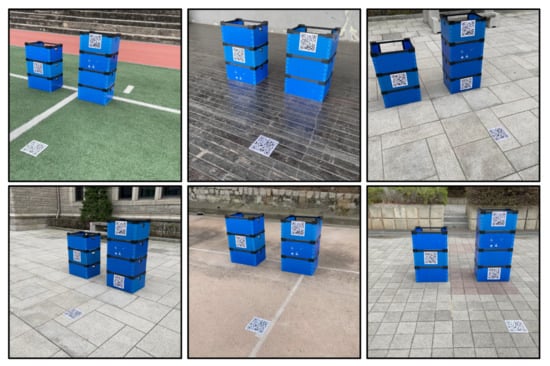
Figure 8.
Example of test videos for the verification of the proposed model.
4.2. Segmentation-Based QR Code Decoding Test
We used the generated dataset to train the segmentation model to detect the QR code area in the video frame. The QR code decoding tests were performed by training UNet, UNet++, PSPNet, DeepLabV3, and DeepLabV3+ to select the optimal segmentation model. ResNet101 [55] and Xception [56] were used as the encoder for the segmentation model. A total of eight segmentation models were generated using five architectures and two encoders. In every experiment, we employ the Adam optimizer [57]. The generated segmentation models were trained for 50 epochs. Initial learning rate was used (). The learning rate was adjusted to after 25 epochs. Input batches are randomly sampled during training. The batch size is 8. The Dice Loss function [58] was adopted for segmentation model training.
Intersection over Union (IoU) was used as a metric to evaluate the training results of the segmentation models. IoU is a measure of the overlap between the area predicted by segmentation model and ground truth. The segmentation model aims to detect the QR code area in the video frame, correct the perspective transformation, and then perform decoding to obtain the information of the QR code. In other words, the better the decoding results of the detected QR code areas, the more suitable the segmentation model is for our framework. Therefore, the decoding success rate of the QR code area detected from the segmentation model selected by the IoU was used as an evaluation index of the segmentation models. We used 0.5 as a threshold of the metric. The segmentation model was trained on the generated train dataset. Then, the decoding test was performed using the segmentation model with the highest IoU score on the generated validation dataset. The decoding test was performed on the generated test dataset of the segmentation image dataset. The test dataset contains 1931 QR codes that can be decoded through distortion correction. Table 1 shows that the segmentation model combining Xception and UNet++ achieved the highest IoU score and decoding performance. Figure 9 shows the results for the input image of the trained segmentation model. As a result of the segmentation model experiment, the model combining Xception and UNet++ was the most suitable model for our framework. In subsequent experiments, the segmentation model was used for QR code area detection in our framework.

Table 1.
Results of the QR code recognition based on the segmentation model.

Figure 9.
Results of the segmentation model (right), input image (left), and ground truth (center).
We performed the segmentation and the QR code decoding of the video dataset using the trained segmentation model. As shown in Figure 10, we confirm that the trained segmentation model performs well on the video dataset. We proposed the method of decoding the QR code with distortion using segmentation-model-based area detection of the QR code and the computer vision algorithm. However, the QR code decoding is difficult if the segmentation is not performed well due to various noises. Therefore, if the performance of the segmentation model is improved, the decoding performance of the QR code may also be improved in the real-world.
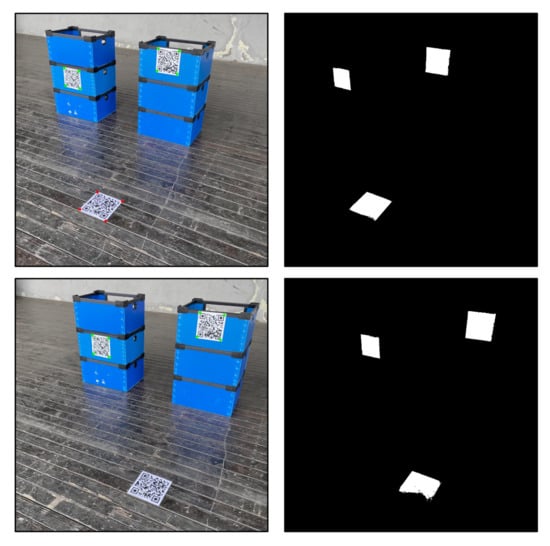
Figure 10.
Results of the QR code segmentation and decoding.
4.3. Comparison of 3D Position Estimation Results
The purpose of the proposed framework is to estimate the 3D inventory position in a storage yard for management automation. Therefore, we conducted an experiment by filming the inventory and QR code as the video in an environment without shelves and grids, such as a storage yard. The ablation study of the proposed framework was performed for module performance evaluation. First, we compared the position estimation performance of the proposed framework with the base framework removing the DBSCAN module and angle-based correction module. Table 2 shows that the proposed framework has smaller errors and deviations in estimating the inventory 3D position than the base framework. When each of the proposed error correction methods was applied one by one, the performance was similar to or decreased compared to the baseline. If the drone’s 3D position estimation result is noise, the angle between the epipolar line of noise and the other epipolar lines increases, so the angle-based error correction method gives a greater weight to the noise frame. Therefore, our proposed error correction methods must be used together to have an effect. In addition, we compared the results of the 3D position estimation of the inventory using the quadrangle, and the results of the 3D position estimation of the inventory using the data zone. The quadrangle is the QR code area detected by the segmentation model. The data zone is the detected area by decoding the QR code, as shown in Figure 4. It was confirmed that the error and deviation of the 3D position estimation of the inventory decreased, compared to the case of using the quadrangle when using the data zone. As a result of the experiment, the proposed framework estimated the inventory 3D position in small errors in the video taken in the real-world environment. Thus, we confirmed that the proposed framework is capable of estimating inventory 3D position in the storage yard. Furthermore, we verified the effectiveness of the error correction method. This means that the performance of the object 3D position estimation can be improved by using the outlier frame removal and the angle between epipolar lines. Therefore, if the outlier frame removal method is improved or a better correction method using the angle between epipolar lines is applied, the performance of the object 3D position estimation can also be improved. Additionally, for comparison with the deep learning model, we performed object 3D position estimation based on the monocular depth estimation deep learning model [59]. The epipolar line for the object was estimated using the segmentation model, and the distance between the drone and object was estimated using the depth estimation deep learning model. Three-dimensional position estimation of the object was performed through the epipolar line and the distance between the drone and the object estimated from deep learning models. However, the deep-learning-based depth estimation model had a distance error of several meters as shown in Figure 11. As a result, the error in the distance between the object and the drone increased, and the error in the object 3D position was very large. Furthermore, we performed a comparison of the added the computational running time due to the added outlier frame removal and the error correction method. The experiment on the running time for outlier frame removal confirmed that it took very little time, i.e., within 0.01 s from 50 to 250 frames. Furthermore, we confirmed that the error correction method took less time than outlier frame removal.
Table 2.
Results of the ablation study.
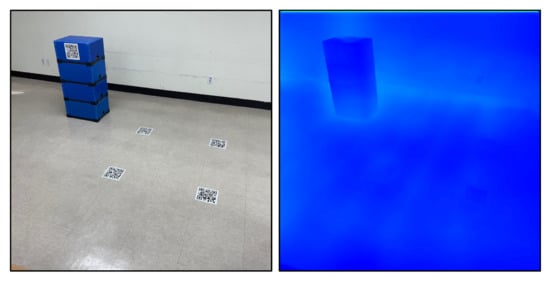
Figure 11.
Results of the depth estimation for the distance between the drone and the object. Bright colors mean a longer distance than dark colors.
The most important contribution of this study is to propose a novel framework for the 3D position estimation of inventory with a drone-mounted monocular camera for inventory management automation. Unlike the need for four ground QR codes in our previous work, the proposed framework estimates the 3D position of object with one ground QR code by using the alignment pattern of the QR code. Furthermore, the proposed framework improves the performance of 3D position estimation by using the data zone of the QR code. The proposed framework uses only a monocular camera mounted on a drone for 3D position estimation without LiDAR. While the proposed framework is cost-effective, the performance of 3D position estimation may be less than using LiDAR. To solve this, we proposed the error correction method. We evaluated the 3D position estimation performance of the proposed framework, and validated the effectiveness of the error correction method using the video dataset taken in a real-world environment. We detected and decoded the QR code in the video frame for the 3D position estimation of the drone, which is the shooting point. The results of the QR code decoding test in Section 4.2 suggest that the trained segmentation model can successfully detect the QR code in the video frame. Sometimes, the QR code may not be easily readable or visible in certain lighting conditions or at certain angles. As shown in Figure 12, decoding may fail if noise occurs in the data zone of the QR code even if segmentation is performed well. Recently, research related to image denoising based on deep learning models has been proposed [60]. If noise that may occur outdoors is removed with such a deep learning model for denoising, the difficulty of QR code segmentation can be eased. Furthermore, if the hyperparameter of the computer vision algorithm that post-processes the result value of the segmentation model is adjusted or the improved post-processing method is applied, decoding performance of the QR code may be improved. The proposed framework uses the video frame captured along the path of the drone, rather than a single image. Accordingly, the QR code is captured at various angles and situations. As a results, the possibility that the QR code is not detected by certain lighting conditions or at certain angle can be reduced than when using a single image.
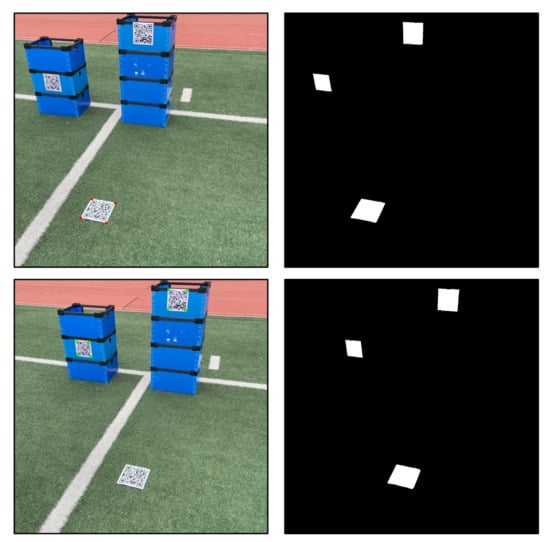
Figure 12.
Results of the QR code decoding according to noise.
After performing the QR code decoding, the estimated drone 3D positions and straight lines for the inventory were derived to estimate the inventory 3D position based on epipolar geometry. The ablation study in Section 4.3 suggests that the DBSCAN module, the error correction module, and the utilization of the data zone of the QR code are effective in estimating the inventory 3D position. The inventory 3D position estimated by epipolar geometry was corrected using the angle between the straight-line pairs used for the estimation. We performed visualization to present the relationship between the angle and the errors of the estimated inventory 3D position. As shown in Figure 13, as the value of between straight-line pairs increases, the error decreases; conversely, as the sine value decreases, the error increases. In other words, the sine value of the angle between straight-line pairs and the error of the estimated 3D position are inversely proportional. Visualization results suggest that the inventory 3D position estimated with all straight-line pairs can be corrected for error by using the sin value as a weight.
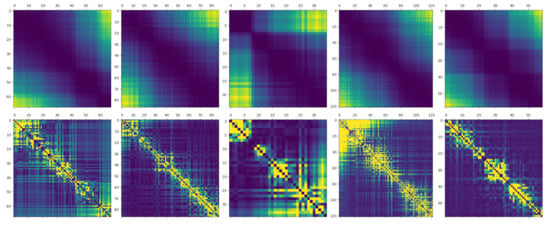
Figure 13.
Visualization of the sine value between line pairs (first row) and the error of the estimated position (second row). A bright color means a value greater than a dark color.
Unlike previous studies using markers attached to shelves and grids [20], this paper proposes a novel framework for inventory management automation in all warehouses, including shelves and gridless warehouses. Furthermore, the proposed framework is available for the low-cost drone-mounted monocular camera, unlike previous studies using expensive RFID sensors [16,17]. Kang et al. [35] proposed a method of estimating the 3D position of the drone using a QR code attached to the floor. The method proposed in this paper can estimate the drone’s 3D position regardless of the attachment location of the QR code. In addition, the proposed method estimates the object 3D position using the estimated position of the drone. Kang et al. [35] provided an experiment on an image that synthesized the QR code without distortion. There is no object other than a QR code in the synthesized image. They proposed finding all contours in the image and predicting the contour with the largest range as the QR code. However, in a real environment, various contours occur due to various objects and noise, and the largest contours are rarely the QR code. In addition, several QR codes may be photographed in a single image, as in our experiment. Therefore, their proposed method cannot be used for the real-world data that we photographed. We performed the QR code decoding based the segmentation model. Therefore, the QR code decoding is possible without the need to set arbitrary contours. As a result, our proposed framework works on an image from the real world, where multiple contours occur. We further estimate the object 3D position through the 3D position estimation of the drone. For this, we proposed two new error correction for improving of the object 3D position performance. In our previous work [1], we conducted the experiment on the drone’s 3D position estimation of the proposed method in a real-world environment. The QR code that was taken has a shape distortion similar to the working environment. Nevertheless, our proposed method estimated the drone’s 3D position with an error of about 4.7%. We estimated the drone’s 3D position from the four markers and estimated the object 3D position using the estimated two-point drone 3D position [1]. However, it is difficult for four markers to be photographed on one image in a real environment. Furthermore, it is difficult to accurately shoot the QR code at the desired position due to various noises. To solve this problem, this paper proposed the object 3D position estimation using continuously filmed video frames. Unlike previous work, the proposed method is designed to be practically usable by estimating the object 3D position through one marker. To drastically reduce the number of markers for object 3D position estimation, we proposed a method utilizing the alignment pattern of the QR code. We also proposed novel two error correction methods for improving the performance of the object 3D position estimation. We eliminated the outlier frame of estimated drone 3D position utilizing continuity to improve the performance of object 3D position estimation. Furthermore, we proposed an epipolar line-based error correction method for the object 3D position estimation from drone 3D positions estimated in the video frame. As a result of the experiment on the video taken in an outdoor environment, it was confirmed that it was possible to estimate the object 3D position using one marker. In addition, it was confirmed that the performance of object 3D position estimation was improved by the proposed error correction methods.
A new correction method is proposed through the relationship between the video frames for the error of the estimated inventory 3D position to improve the accuracy of inventory 3D position estimation. The proposed correction method can itself be used as a method of correcting the position of the object photographed in the video. In summary, this paper proposes a novel framework that improves the estimated 3D position accuracy of the inventory based on deep learning and DBSCAN to the error correction method available in the video frame. However, the following additional attempts may be made to improve the performance. The U-Net++ and Xception models were used in our framework as a backbone to detect the QR code area for the QR code decoding in the video frame. We continue to develop the deep learning field, including the segmentation model, and expect that the improved segmentation model and backbone will improve the 3D position estimation performance. Moreover, the association with the estimated position error of the inventory and the position of the drone may be further studied. In addition, DBSCAN was used in the proposed framework to detect the outliers of estimated drone positions. DBSCAN can be used to detect the incorrectly estimated drone 3D position in the video frame because of continuity. Our framework can estimate 3D position for all types of objects regardless shapes or surfaces if the QR code is attachable. We used the ground QR code for 3D position estimation of the inventory QR code. Even if the QR code used to estimate the 3D position of the inventory QR code is attached to the wall or somewhere else, the proposed framework can perform the 3D position estimation of the inventory QR code. Instead, the QR code used for position estimation should have a 3D coordinate for the attached position. However, the proposed framework has a limitation in that it cannot estimate the 3D position of the invisible object, since only the 3D position of the object within the video frame captured by the drone’s camera can be estimated. Furthermore, because of the limitations of the segmentation model, it does not guarantee 100% accuracy of outlier detection, due to the detection and decoding error of the QR code in certain frames, or errors in the estimated drone 3D position. We proposed the error correction method of 3D position estimation utilizing the continuity of the video frame. However, the proposed framework requires segmentation results of all video frames. In addition, 3D position estimation is performed for all pairs of time points at which the QR code is recognized. As a result, as the video frame increases by n times, the time consumption on segmentation increases by n times and the time spent on position estimation increases by times. In the proposed framework, the performance of deep-learning-based QR code segmentation is very important. We constructed the synthesized QR code dataset for training the QR code segmentation model. High-quality data are required for training the deep learning model. Research related to efficient data augmentation has been conducted [61]. In addition, a hyperparameter optimization method has been proposed to improve the performance of deep learning models [62]. If the data augmentation and hyperparameter optimization methods are applied in the future, the performance of the QR code segmentation model may be improved. Although this study focused more on inventory management automation using the QR code and the drone-mounted monocular camera, it can be supplemented with additional efforts, such as existing studies and solutions for object detection.
5. Conclusions
Recently, drones have been used in various fields, and studies have been conducted using drones for inventory management. In some cases, a warehouse does not employ shelves and grids, such as a storage yard, so that the location of loading the inventory is not fixed. In this paper, we propose a 3D position estimation framework of the inventory based on the drone-mounted monocular camera and the QR code for inventory management automation, even in a storage yard without shelves or grids. We trained the segmentation model using our generated QR code dataset for the QR code area detection. We estimated the drone’s 3D position through the ground QR code in which the positional information was stored. Furthermore, we derived the straight line passing through the 3D position of the inventory QR code attached to the inventory. Then, we selected the frame other than the outlier from the video frame, to estimate the inventory 3D position. In addition, we corrected the error in the estimated inventory 3D position by utilizing the continuity of the video frame. As a result of error correction, it was verified that the 3D position estimation performance of the inventory was improved. We confirmed that using the monocular camera mounted on the drone can estimate the inventory 3D position in a storage yard where the loading position of the inventory is not clearly distinguished. The proposed framework is also cost-effective by estimating the inventory 3D position using only a monocular camera. As a result of this study, we propose a framework that can estimate the 3D inventory position regardless of warehouse type. This means that inventory management automation can be applied to all types of warehouses. In addition, we have confirmed that it is possible to improve the 3D position estimation performance of the object through the angle between the epipolar lines and outlier detection of the drone’s estimated 3D position.
In future research, various types of QR code segmentation datasets will be additionally generated and applied to the model to improve the performance of the segmentation model. Furthermore, it is expected that the proposed framework and object detection model can be combined to estimate the 3D position of unmarked objects in the video frame. We evaluated the proposed framework with an ablation study. If we find other base models that can apply the proposed error correction methods in the future, we can evaluate the proposed methods by performing additional ablation studies in combination with them.
Author Contributions
Conceptualization, B.Y.; Methodology, B.Y.; Software, B.Y. and G.Y.; Formal Analysis, B.Y.; Data Curation, B.Y. and H.K.; Writing—Original Draft Preparation, B.Y.; Visualization, B.Y. and H.K.; Supervision, J.R. All authors have read and agreed to the published version of the manuscript.
Funding
This research was financially supported by the Ministry of Trade, Industry and Energy (MOTIE) and Korea Institute for Advancement of Technology(KIAT) through the International Cooperative R&D program (Project No. P0016096).
Institutional Review Board Statement
Not applicable.
Informed Consent Statement
Not applicable.
Data Availability Statement
The datasets used and/or analysed during the current study available from the corresponding author on reasonable request.
Conflicts of Interest
The authors declare no conflict of interest.
References
- Yoon, B.; Kim, H.; Youn, G.; Rhee, J. 3D position estimation of drone and object based on QR code segmentation model for inventory management automation. In Proceedings of the 2021 IEEE International Symposium on Safety, Security, and Rescue Robotics (SSRR), New York, NY, USA, 25–27 October 2021; pp. 223–229. [Google Scholar]
- Saggiani, G.; Persiani, F.; Ceruti, A.; Tortora, P.; Troiani, E.; Giuletti, F.; Amici, S.; Buongiorno, M.; Distefano, G.; Bentini, G.; et al. A UAV System for Observing Volcanoes and Natural Hazards. American Geophysical Union, Fall Meeting 2007, Abstract ID. GC11B-05, 2007. Available online: https://ui.adsabs.harvard.edu/abs/2007AGUFMGC11B..05S/abstract (accessed on 26 September 2023).
- Bai, X.; Cao, M.; Yan, W.; Ge, S.S. Efficient routing for precedence-constrained package delivery for heterogeneous vehicles. IEEE Trans. Autom. Sci. Eng. 2019, 17, 248–260. [Google Scholar] [CrossRef]
- Shakhatreh, H.; Sawalmeh, A.H.; Al-Fuqaha, A.; Dou, Z.; Almaita, E.; Khalil, I.; Othman, N.S.; Khreishah, A.; Guizani, M. Unmanned aerial vehicles (UAVs): A survey on civil applications and key research challenges. IEEE Access 2019, 7, 48572–48634. [Google Scholar] [CrossRef]
- Rhiat, A.; Chalal, L.; Saadane, A. A Smart Warehouse Using Robots and Drone to Optimize Inventory Management. In Proceedings of the Future Technologies Conference, Vancouver, BC, Canada, 28–29 October 2021; Springer: Berlin/Heidelberg, Germany, 2021; pp. 475–483. [Google Scholar]
- Radácsi, L.; Gubán, M.; Szabó, L.; Udvaros, J. A Path Planning Model for Stock Inventory Using a Drone. Mathematics 2022, 10, 2899. [Google Scholar] [CrossRef]
- Gubán, M.; Udvaros, J. A Path Planning Model with a Genetic Algorithm for Stock Inventory Using a Swarm of Drones. Drones 2022, 6, 364. [Google Scholar] [CrossRef]
- Mur-Artal, R.; Tardós, J.D. Orb-slam2: An open-source slam system for monocular, stereo, and rgb-d cameras. IEEE Trans. Robot. 2017, 33, 1255–1262. [Google Scholar] [CrossRef]
- Gao, X.; Wang, R.; Demmel, N.; Cremers, D. LDSO: Direct sparse odometry with loop closure. In Proceedings of the 2018 IEEE/RSJ International Conference on Intelligent Robots and Systems (IROS), Madrid, Spain, 1–5 October 2018; pp. 2198–2204. [Google Scholar]
- Szeliski, R. Computer Vision: Algorithms and Applications; Springer Science & Business Media: Berlin/Heidelberg, Germany, 2010. [Google Scholar]
- Zhou, B.; Lapedriza, A.; Khosla, A.; Oliva, A.; Torralba, A. Places: A 10 million Image Database for Scene Recognition. IEEE Trans. Pattern Anal. Mach. Intell. 2017, 40, 1452–1464. [Google Scholar] [CrossRef] [PubMed]
- Deng, J.; Dong, W.; Socher, R.; Li, L.J.; Li, K.; Fei-Fei, L. Imagenet: A large-scale hierarchical image database. In Proceedings of the 2009 IEEE Conference on Computer Vision and Pattern Recognition, Miami, FL, USA, 20–25 June 2009; pp. 248–255. [Google Scholar]
- Cho, H.; Kim, D.; Park, J.; Roh, K.; Hwang, W. 2D barcode detection using images for drone-assisted inventory management. In Proceedings of the 2018 15th International Conference on Ubiquitous Robots (UR), Honolulu, HI, USA, 26–30 June 2018; pp. 461–465. [Google Scholar]
- Ramaswamy, A.; Gubbi, J.; Raj, R.; Purushothaman, B. Frame stitching in indoor environment using drone captured images. In Proceedings of the 2018 25th IEEE International Conference on Image Processing (ICIP), Athens, Greece, 7–10 October 2018; pp. 91–95. [Google Scholar]
- Anand, A.; Agrawal, S.; Agrawal, S.; Chandra, A.; Deshmukh, K. Grid-based localization stack for inspection drones towards automation of large scale warehouse systems. arXiv 2019, arXiv:1906.01299. [Google Scholar]
- Almalki, F.A. Utilizing Drone for Food Quality and Safety Detection using Wireless Sensors. In Proceedings of the 2020 IEEE 3rd International Conference on Information Communication and Signal Processing (ICICSP), Shanghai, China, 12–15 September 2020; pp. 405–412. [Google Scholar]
- Li, C.; Tanghe, E.; Suanet, P.; Plets, D.; Hoebeke, J.; De Poorter, E.; Joseph, W. ReLoc 2.0: UHF-RFID Relative Localization for Drone-Based Inventory Management. IEEE Trans. Instrum. Meas. 2021, 70, 1–13. [Google Scholar] [CrossRef]
- Cristiani, D.; Bottonelli, F.; Trotta, A.; Di Felice, M. Inventory Management through Mini-Drones: Architecture and Proof-of-Concept Implementation. In Proceedings of the 2020 IEEE 21st International Symposium on “A World of Wireless, Mobile and Multimedia Networks” (WoWMoM), Cork, Ireland, 31 August–3 September 2020; pp. 317–322. [Google Scholar]
- Manjrekar, A.; Jha, D.; Jagtap, P.; Yadav, V. Warehouse Inventory Management with Cycle Counting Using Drones. In Proceedings of the 4th International Conference on Advances in Science and Technology (ICAST2021), Bahir Dar, Ethiopia, 27–29 August 2021. [Google Scholar]
- Martinez-Martin, E.; Ferrer, E.; Vasilev, I.; Del Pobil, A.P. The UJI Aerial Librarian Robot: A Quadcopter for Visual Library Inventory and Book Localisation. Sensors 2021, 21, 1079. [Google Scholar] [CrossRef]
- Blanger, L.; Hirata, N.S. An evaluation of deep learning techniques for QR code detection. In Proceedings of the 2019 IEEE International Conference on Image Processing (ICIP), Taipei, Taiwan, 22–25 September 2019; pp. 1625–1629. [Google Scholar]
- Yuan, B.; Li, Y.; Jiang, F.; Xu, X.; Zhao, J.; Zhang, D.; Guo, J.; Wang, Y.; Zhang, S. Fast QR code detection based on BING and AdaBoost-SVM. In Proceedings of the 2019 IEEE 20th International Conference on High Performance Switching and Routing (HPSR), Xi’an, China, 26–29 May 2019; pp. 1–6. [Google Scholar]
- Cheng, M.M.; Zhang, Z.; Lin, W.Y.; Torr, P. BING: Binarized normed gradients for objectness estimation at 300fps. In Proceedings of the IEEE Conference on Computer Vision and Pattern Recognition, Columbus, OH, USA, 23–28 June 2014; pp. 3286–3293. [Google Scholar]
- Yuan, B.; Li, Y.; Jiang, F.; Xu, X.; Guo, Y.; Zhao, J.; Zhang, D.; Guo, J.; Shen, X. MU R-CNN: A two-dimensional code instance segmentation network based on deep learning. Future Internet 2019, 11, 197. [Google Scholar] [CrossRef]
- He, K.; Gkioxari, G.; Dollár, P.; Girshick, R. Mask r-cnn. In Proceedings of the IEEE International Conference on Computer Vision, Venice, Italy, 22–29 October 2017; pp. 2961–2969. [Google Scholar]
- Ronneberger, O.; Fischer, P.; Brox, T. U-net: Convolutional networks for biomedical image segmentation. In Proceedings of the International Conference on Medical Image Computing and Computer-Assisted Intervention, Munich, Germany, 5–9 October 2015; Springer: Berlin/Heidelberg, Germany, 2015; pp. 234–241. [Google Scholar]
- Li, K.; Meng, F.; Huang, Z.; Wang, Q. A correction algorithm of QR code on cylindrical surface. J. Phys. Conf. Ser. 2019, 1237, 022006. [Google Scholar] [CrossRef]
- Peng, L.; Wen, L.; Qiang, L.; Min, D.; Yue, D.; Yiying, N. Research on QR 2-D Code Graphics Correction Algorithms Based on Morphological Expansion Closure and Edge Detection. In Advances in 3D Image and Graphics Representation, Analysis, Computing and Information Technology; Springer: Berlin/Heidelberg, Germany, 2020; pp. 197–209. [Google Scholar]
- Choi, J.H.; Choi, B.J. Design of self-localization based autonomous driving platform for an electric wheelchair. In Proceedings of the 2017 11th Asian Control Conference (ASCC), Gold Coast, QLD, Australia, 17–20 December 2017; pp. 465–466. [Google Scholar]
- Li, Z.; Huang, J. Study on the use of QR codes as landmarks for indoor positioning: Preliminary results. In Proceedings of the 2018 IEEE/ION Position, Location and Navigation Symposium (PLANS), Monterey, CA, USA, 23–26 April 2018; pp. 1270–1276. [Google Scholar]
- Lee, D.H.; Lee, S.S.; Kang, H.H.; Ahn, C.K. Camera Position Estimation for UAVs Using SolvePnP with Kalman Filter. In Proceedings of the 2018 1st IEEE International Conference on Hot Information-Centric Networking (HotICN), Shenzhen, China, 15–17 August 2018; pp. 250–251. [Google Scholar]
- Taketani, R.; Kobayashi, H. A Proposal for Improving Estimation Accuracy of Localization Using QR codes and Image Sensors. In Proceedings of the IECON 2019—45th Annual Conference of the IEEE Industrial Electronics Society, Lisbon, Portugal, 14–17 October 2019; Volume 1, pp. 6815–6820. [Google Scholar]
- Pan, G.; Liang, A.; Liu, J.; Liu, M.; Wang, E.X. 3-D Positioning System Based QR Code and Monocular Vision. In Proceedings of the 2020 5th International Conference on Robotics and Automation Engineering (ICRAE), Singapore, 20–22 November 2020; pp. 54–58. [Google Scholar]
- Kim, J.I.; Gang, H.S.; Pyun, J.Y.; Kwon, G.R. Implementation of QR Code Recognition Technology Using Smartphone Camera for Indoor Positioning. Energies 2021, 14, 2759. [Google Scholar] [CrossRef]
- Kang, T.W.; Choi, Y.S.; Jung, J.W. Estimation of Relative Position of Drone using Fixed Size QR Code. In Proceedings of the 2022 IEEE International Conference on Systems, Man, and Cybernetics (SMC), Prague, Czech Republic, 9–12 October 2022; pp. 442–447. [Google Scholar]
- Long, J.; Shelhamer, E.; Darrell, T. Fully convolutional networks for semantic segmentation. In Proceedings of the IEEE Conference on Computer Vision and Pattern Recognition, Boston, MA, USA, 7–12 June 2015; pp. 3431–3440. [Google Scholar]
- Minaee, S.; Boykov, Y.Y.; Porikli, F.; Plaza, A.J.; Kehtarnavaz, N.; Terzopoulos, D. Image segmentation using deep learning: A survey. IEEE Trans. Pattern Anal. Mach. Intell. 2021, 44, 3523–3542. [Google Scholar] [CrossRef]
- Chen, L.C.; Papandreou, G.; Kokkinos, I.; Murphy, K.; Yuille, A.L. Semantic image segmentation with deep convolutional nets and fully connected crfs. arXiv 2014, arXiv:1412.7062. [Google Scholar]
- Liu, Z.; Li, X.; Luo, P.; Loy, C.C.; Tang, X. Semantic image segmentation via deep parsing network. In Proceedings of the IEEE International Conference on Computer Vision, Santiago, Chile, 7–13 December 2015; pp. 1377–1385. [Google Scholar]
- Zhou, Z.; Siddiquee, M.M.R.; Tajbakhsh, N.; Liang, J. Unet++: A nested u-net architecture for medical image segmentation. In Deep Learning in Medical Image Analysis and Multimodal Learning for Clinical Decision Support; Springer: Berlin/Heidelberg, Germany, 2018; pp. 3–11. [Google Scholar]
- Chen, L.C.; Papandreou, G.; Kokkinos, I.; Murphy, K.; Yuille, A.L. Deeplab: Semantic image segmentation with deep convolutional nets, atrous convolution, and fully connected crfs. IEEE Trans. Pattern Anal. Mach. Intell. 2017, 40, 834–848. [Google Scholar] [CrossRef]
- Chen, L.C.; Papandreou, G.; Schroff, F.; Adam, H. Rethinking atrous convolution for semantic image segmentation. arXiv 2017, arXiv:1706.05587. [Google Scholar]
- Chen, L.C.; Zhu, Y.; Papandreou, G.; Schroff, F.; Adam, H. Encoder-decoder with atrous separable convolution for semantic image segmentation. In Proceedings of the European Conference on Computer Vision (ECCV), Munich, Germany, 8–14 September 2018; pp. 801–818. [Google Scholar]
- Zhao, H.; Shi, J.; Qi, X.; Wang, X.; Jia, J. Pyramid scene parsing network. In Proceedings of the IEEE Conference on Computer Vision and Pattern Recognition, Honolulu, HI, USA, 21–26 July 2017; pp. 2881–2890. [Google Scholar]
- Khan, S.D.; Alarabi, L.; Basalamah, S. Deep hybrid network for land cover semantic segmentation in high-spatial resolution satellite images. Information 2021, 12, 230. [Google Scholar] [CrossRef]
- Huang, G.; Liu, Z.; Van Der Maaten, L.; Weinberger, K.Q. Densely connected convolutional networks. In Proceedings of the IEEE Conference on Computer Vision and Pattern Recognition, Honolulu, HI, USA, 21–26 July 2017; pp. 4700–4708. [Google Scholar]
- Khan, S.D.; Alarabi, L.; Basalamah, S. DSMSA-Net: Deep Spatial and Multi-scale Attention Network for Road Extraction in High Spatial Resolution Satellite Images. Arab. J. Sci. Eng. 2022, 48, 1907–1920. [Google Scholar] [CrossRef]
- Khan, S.D.; Alarabi, L.; Basalamah, S. An encoder–decoder deep learning framework for building footprints extraction from aerial imagery. Arab. J. Sci. Eng. 2023, 48, 1273–1284. [Google Scholar] [CrossRef]
- Douglas, D.H.; Peucker, T.K. Algorithms for the reduction of the number of points required to represent a digitized line or its caricature. Cartogr. Int. J. Geogr. Inf. Geovis. 1973, 10, 112–122. [Google Scholar] [CrossRef]
- Wang, P.; Xu, G.; Cheng, Y.; Yu, Q. A simple, robust and fast method for the perspective-n-point problem. Pattern Recognit. Lett. 2018, 108, 31–37. [Google Scholar] [CrossRef]
- Gao, X.S.; Hou, X.R.; Tang, J.; Cheng, H.F. Complete solution classification for the perspective-three-point problem. IEEE Trans. Pattern Anal. Mach. Intell. 2003, 25, 930–943. [Google Scholar]
- Hesch, J.A.; Roumeliotis, S.I. A direct least-squares (DLS) method for PnP. In Proceedings of the 2011 International Conference on Computer Vision, Barcelona, Spain, 6–13 November 2011; pp. 383–390. [Google Scholar]
- Lepetit, V.; Moreno-Noguer, F.; Fua, P. Epnp: An accurate o (n) solution to the pnp problem. Int. J. Comput. Vis. 2009, 81, 155–166. [Google Scholar] [CrossRef]
- Ester, M.; Kriegel, H.P.; Sander, J.; Xu, X. A density-based algorithm for discovering clusters in large spatial databases with noise. In Proceedings of the Second International Conference on Knowledge Discovery and Data Mining (KDD-96), Portland, OR, USA, 2–4 August 1996; pp. 226–231. [Google Scholar]
- He, K.; Zhang, X.; Ren, S.; Sun, J. Deep residual learning for image recognition. In Proceedings of the IEEE Conference on Computer Vision and Pattern Recognition, Las Vegas, NV, USA, 27–30 June 2016; pp. 770–778. [Google Scholar]
- Chollet, F. Xception: Deep learning with depthwise separable convolutions. In Proceedings of the IEEE Conference on Computer Vision and Pattern Recognition, Honolulu, HI, USA, 21–26 July 2017; pp. 1251–1258. [Google Scholar]
- Kingma, D.P.; Ba, J. Adam: A method for stochastic optimization. arXiv 2014, arXiv:1412.6980. [Google Scholar]
- Milletari, F.; Navab, N.; Ahmadi, S.A. V-net: Fully convolutional neural networks for volumetric medical image segmentation. In Proceedings of the 2016 Fourth International Conference on 3D Vision (3DV), Stanford, CA, USA, 25–28 October 2016; pp. 565–571. [Google Scholar]
- Kim, D.; Ka, W.; Ahn, P.; Joo, D.; Chun, S.; Kim, J. Global-local path networks for monocular depth estimation with vertical cutdepth. arXiv 2022, arXiv:2201.07436. [Google Scholar]
- Zheng, M.; Zhi, K.; Zeng, J.; Tian, C.; You, L. A hybrid CNN for image denoising. J. Artif. Intell. Technol. 2022, 2, 93–99. [Google Scholar] [CrossRef]
- Fang, B.; Jiang, M.; Shen, J.; Stenger, B. Deep generative inpainting with comparative sample augmentation. J. Comput. Cogn. Eng. 2022, 1, 174–180. [Google Scholar] [CrossRef]
- Wang, Y.Q.; Li, J.Y.; Chen, C.H.; Zhang, J.; Zhan, Z.H. Scale adaptive fitness evaluation-based particle swarm optimisation for hyperparameter and architecture optimisation in neural networks and deep learning. CAAI Trans. Intell. Technol. 2022, 8, 849–862. [Google Scholar] [CrossRef]
Disclaimer/Publisher’s Note: The statements, opinions and data contained in all publications are solely those of the individual author(s) and contributor(s) and not of MDPI and/or the editor(s). MDPI and/or the editor(s) disclaim responsibility for any injury to people or property resulting from any ideas, methods, instructions or products referred to in the content. |
© 2023 by the authors. Licensee MDPI, Basel, Switzerland. This article is an open access article distributed under the terms and conditions of the Creative Commons Attribution (CC BY) license (https://creativecommons.org/licenses/by/4.0/).