Abstract
Clutch pressure plate temperature prediction is crucial for the structural design and performance evaluation of the clutch. However, due to the complexity of the clutch structure and the non-linear characteristics of temperature changes, accurate temperature prediction of the pressure plate has always been a difficult task, especially when considering cost factors. Aiming at this problem, this paper proposes a pressure plate temperature prediction method based on Bi-directional Long Short-Term Memory (Bi-LSTM) and transfer learning. First, the actual temperature data of the pressure plate under different experimental conditions is collected to establish a Bi-LSTM neural network temperature model, and then, a migration learning method is introduced to migrate the temperature experimental data to obtain a migration model. The migration model is finally applied to predict the pressure plate temperature using three samples and validated by the test. The results show that for the temperature prediction of the same type of pressure plate under different experimental conditions, the MSE (Mean Squared Error) of the approach is 7.08 °C, the R2 (R-squared) is 0.90, the maximum error is 8.47 °C, and the maximum relative error is 3.14%. For the temperature prediction of different types of pressure plates, the MSE of the approach is 3.64 °C, the R2 is 0.97, the maximum error is 5.94 °C, and the maximum relative error is 1.78%. It shows that the proposed approach achieves high-precision prediction of the clutch pressure plate temperature in the case of small samples, which is difficult to achieve with previous methods. The proposed approach can be used for the temperature prediction of the other clutches of models and working conditions and has broad application prospects.
1. Introduction
The clutch is an important component in the automotive transmission system [1], which enables connecting and disconnecting the driving and driven parts. During operation, engine torque is transmitted through the relative sliding of the pressure and friction plates. The friction-induced heat increases the temperature of the pressure plate, which usually increases the thermal stress and deformation of the pressure plate, sometimes leading to clutch failure [2,3]. As shown in Figure 1, the surface of the pressure plate shows severe ablation at high temperatures. Clutch failures due to high temperatures often exceed half of the total number. Consequently, the investigation of pressure plate temperature in clutches holds immense significance.
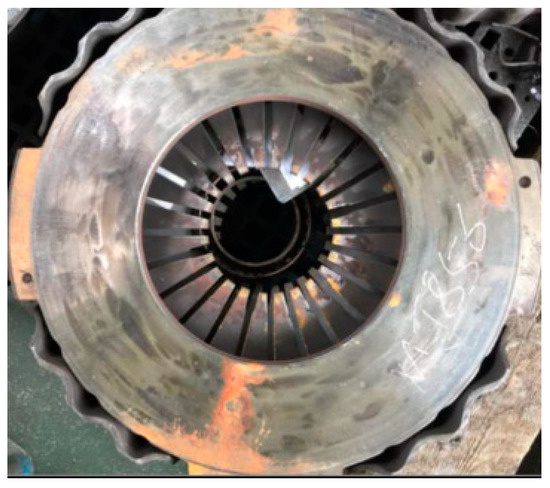
Figure 1.
Clutch pressure plate faulty parts.
Gong YB [4] conducted a comprehensive investigation using a finite element method based on thermal buckling theory to analyze the thermal buckling characteristics of automotive dry clutch pressure plates under two typical thermal loads. The effects of temperature distribution along the pressure plate thickness direction and boundary constraints on the thermal buckling characteristics of the pressure plate were investigated. In a subsequent study, Gong YB established a simplified model of the pressure plate assembly. This model simulated the deformation field of the plate under continuous sliding and natural cooling to room temperature. The mechanism leading to the undercutting deformation of the pressure plate was proposed based on equivalent von Mises stresses [5]. Hu Dong-fang [6] addressed the problems of clutch pressure plate, which often suffers from thermal abrasion and thermal cracking, in the Solid Works software to establish a complete pressure plate solid model of the phi 280 clutch pressure plate. Then, a finite element model was established for analysis to calculate the thermal stress coupling to analyze the thermal and stress conditions of the pressure plate. Schneider T [7] established a parametric two-dimensional finite element model and verified the validity of the model, which can be used for damage prevention and thermomechanical behavior analysis of clutches during transient operation. Abdullah, Oday I [8] established a friction clutch system (single plate clutch) mathematical model, solved the temperature field during the slipping phase (single plate engagement), and used an axisymmetric model of force generation to simulate the analysis of the friction clutch system during the engagement process.
The experiment method of the clutch temperature faces the problems of high experimental cost, time-consuming data acquisition, and limited experimental conditions. Although the simulation calculation provides a cost-effective and controllable experimental environment, it still depends on the model’s accuracy and the data input’s reliability.
Yiwen Wang [9] introduced an enhanced sparrow search algorithm to optimize the slope safety coefficient prediction model (ISSA-BP) in BP neural networks. The proposed model was improved by incorporating dynamic weighting factors and an inverse learning strategy, enabling adaptive search in both aspects. Chakrapani G [10] attempted to use a deep learning technique (transfer learning) to diagnose various clutch faults, such as pressure plate breakage and pressure plate wear. Vibration signals were collected from a test rig operating at different clutch states under different load conditions and further processed and stored as vibration maps. Various hyper-parameters in migration learning such as train–test split ratio, learning rate, optimizer, and batch size were varied and the optimal hyper-parameters suitable for achieving high classification accuracy were found for each pre-trained network. Liu W J [11] constructed a predictive analytics research framework for train braking systems, integrating machine learning, migration learning, and lifelong learning techniques. Based on train braking process principles and timing data collected from an intelligent experimental platform, a baseline was established to solve the timing prediction problem with fixed grouping and multiple grouping. Additionally, a prediction algorithm for model validation and updating, oriented towards lifelong learning, was proposed. Van Vaerenbergh K [12] employed a machine learning approach to learn optimal methods for engaging a transmission clutch, seeking fast and smooth engagement with minimal torque loss. An open-loop control signal was learned using an approximation model and then applied to an actual wet clutch to determine the optimal engagement method. Jia X [13] developed a systematic approach for detecting degradation in Thermoelectric Cooler Controller (TCC) systems using machine learning techniques and domain expert knowledge. Validation using vehicle data showed the effectiveness of the method. Early detection of TCC degradation may help to extend the life of the TC, protect transmission components from further damage, and avoid limping and walking home incidents. BZ A [14] proposed a new Particle Swarm Optimization-Extreme Learning Machine (PSO-ELM) hybrid model for estimating day-by-day crop evapotranspiration in the Northwest Arid Zone with limited input data by optimally determining the parameters of the extreme learning machine model using a particle swarm optimization algorithm. Bellagarda, Andrea [15] placed some neural networks first trained on an artificial but realistic dataset based on BIM simulations of real weather data. Then, an inference phase was performed on a second dataset collected with IoT devices. Finally, transfer learning techniques were utilized to improve prediction performance. Tian, S [16] improved the initial parameter assignment method of KELM by using the GASA algorithm and established a GASA-KELM prediction model to predict the gas content. Zihan Ma [17] proposed a method combining the asynchronous optimization of a two-dimensional deep convolutional generative adversarial network and a two-dimensional convolutional neural network for the intelligent diagnosis of advanced threaded connections.
The general neural network needs a large number of samples. For the case of small sample provided, the transfer learning is brought out to construct the migrating neural networks where a pre-trained model is reused as the starting point for a model on a new task. By applying transfer learning to a new task, one can achieve significantly higher performance than training with only a small number of sample.
In this paper, a method of clutch pressure plate temperature prediction based on a neural network model and migration learning is proposed. First, the Bi-LSTM neural network algorithm is used to train the clutch pressure plate temperature data to obtain a model. Although the model trained by the neural network algorithm performs better in fitting the training data, the model is only applicable to the data used in training and is unable to make future temperature predictions. Then, a transfer learning technique is introduced to train a new model on the new data based on the existing model to obtain a new model, which can integrate the features of the old and new data. To verify the feasibility and effectiveness of the method, the experiment of clutch engagement and disengagement under different operation conditions is performed, and the temperature profiles of the clutch pressure plate is measured by the thermal coupling installing on the pressure plate. The temperature data from the same model of the platen and temperature data from different models of the platen are analyzed, respectively. Three sets of experimental data throughout the entire process are used for training the neural network. For instance, the 0–840 s experimental data from one source platen and 0–840 s experimental data from two target platens are measured and trained, which are in line with the practical condition in the industry for small samples that is provided for the consideration of the test cost. The temperature prediction of the clutch by the proposed method is compared and validated with that of the experiment.
2. Clutch Temperature Prediction Model Construction Based on Bi-LSTM and Migration Learning
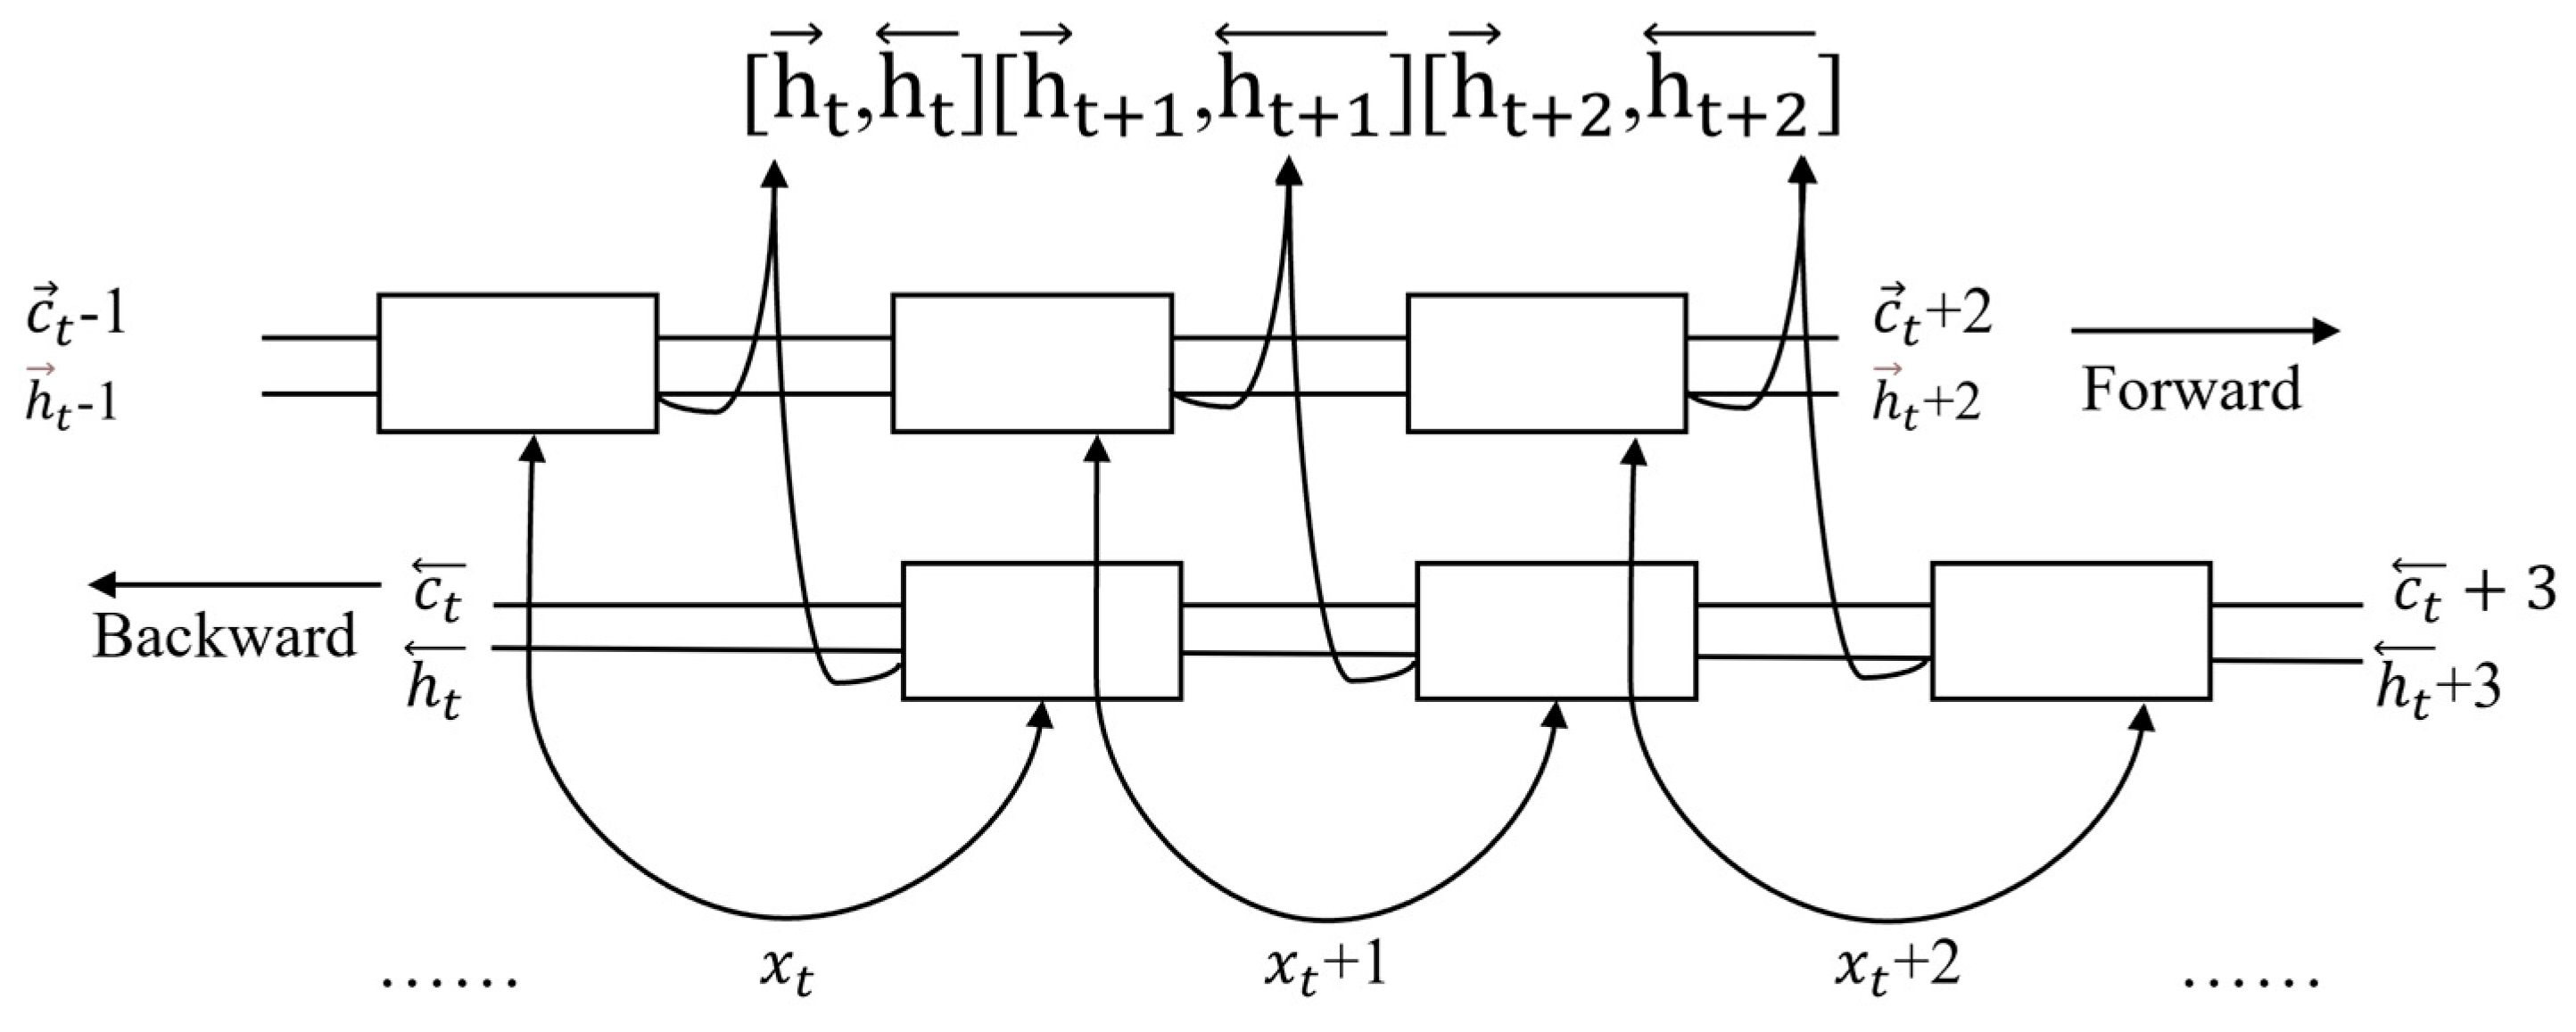
2.1. Bi-LSTM Neural Network
Bi-LSTM (Bidirectional Long Short-Term Memory Network) is a deep learning model for processing sequential data. It is a variant of LSTM (Long Short-Term Memory Network) that introduces two LSTM layers, forward and backward, in the network.
This bi-directional structure allows the model to capture both forward and backward contextual information, thus providing a more comprehensive sequence modeling capability, as shown in Figure 2. In terms of clutch temperature prediction, Bi-LSTM more accurately predicts future platen temperature scenarios by capturing past trends; in addition, long-term dependencies are effectively established through a gating mechanism; platen data intervals may be variable, and Bi-LSTM can be dynamically adapted to use different time scales for modeling.
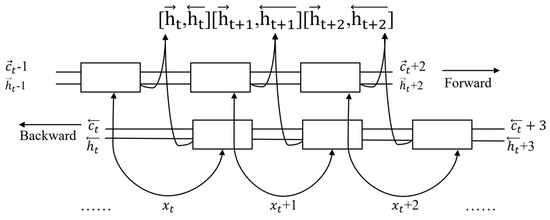
Figure 2.
Schematic representation of Bi-LSTM.
2.2. Data Acquisition and Processing
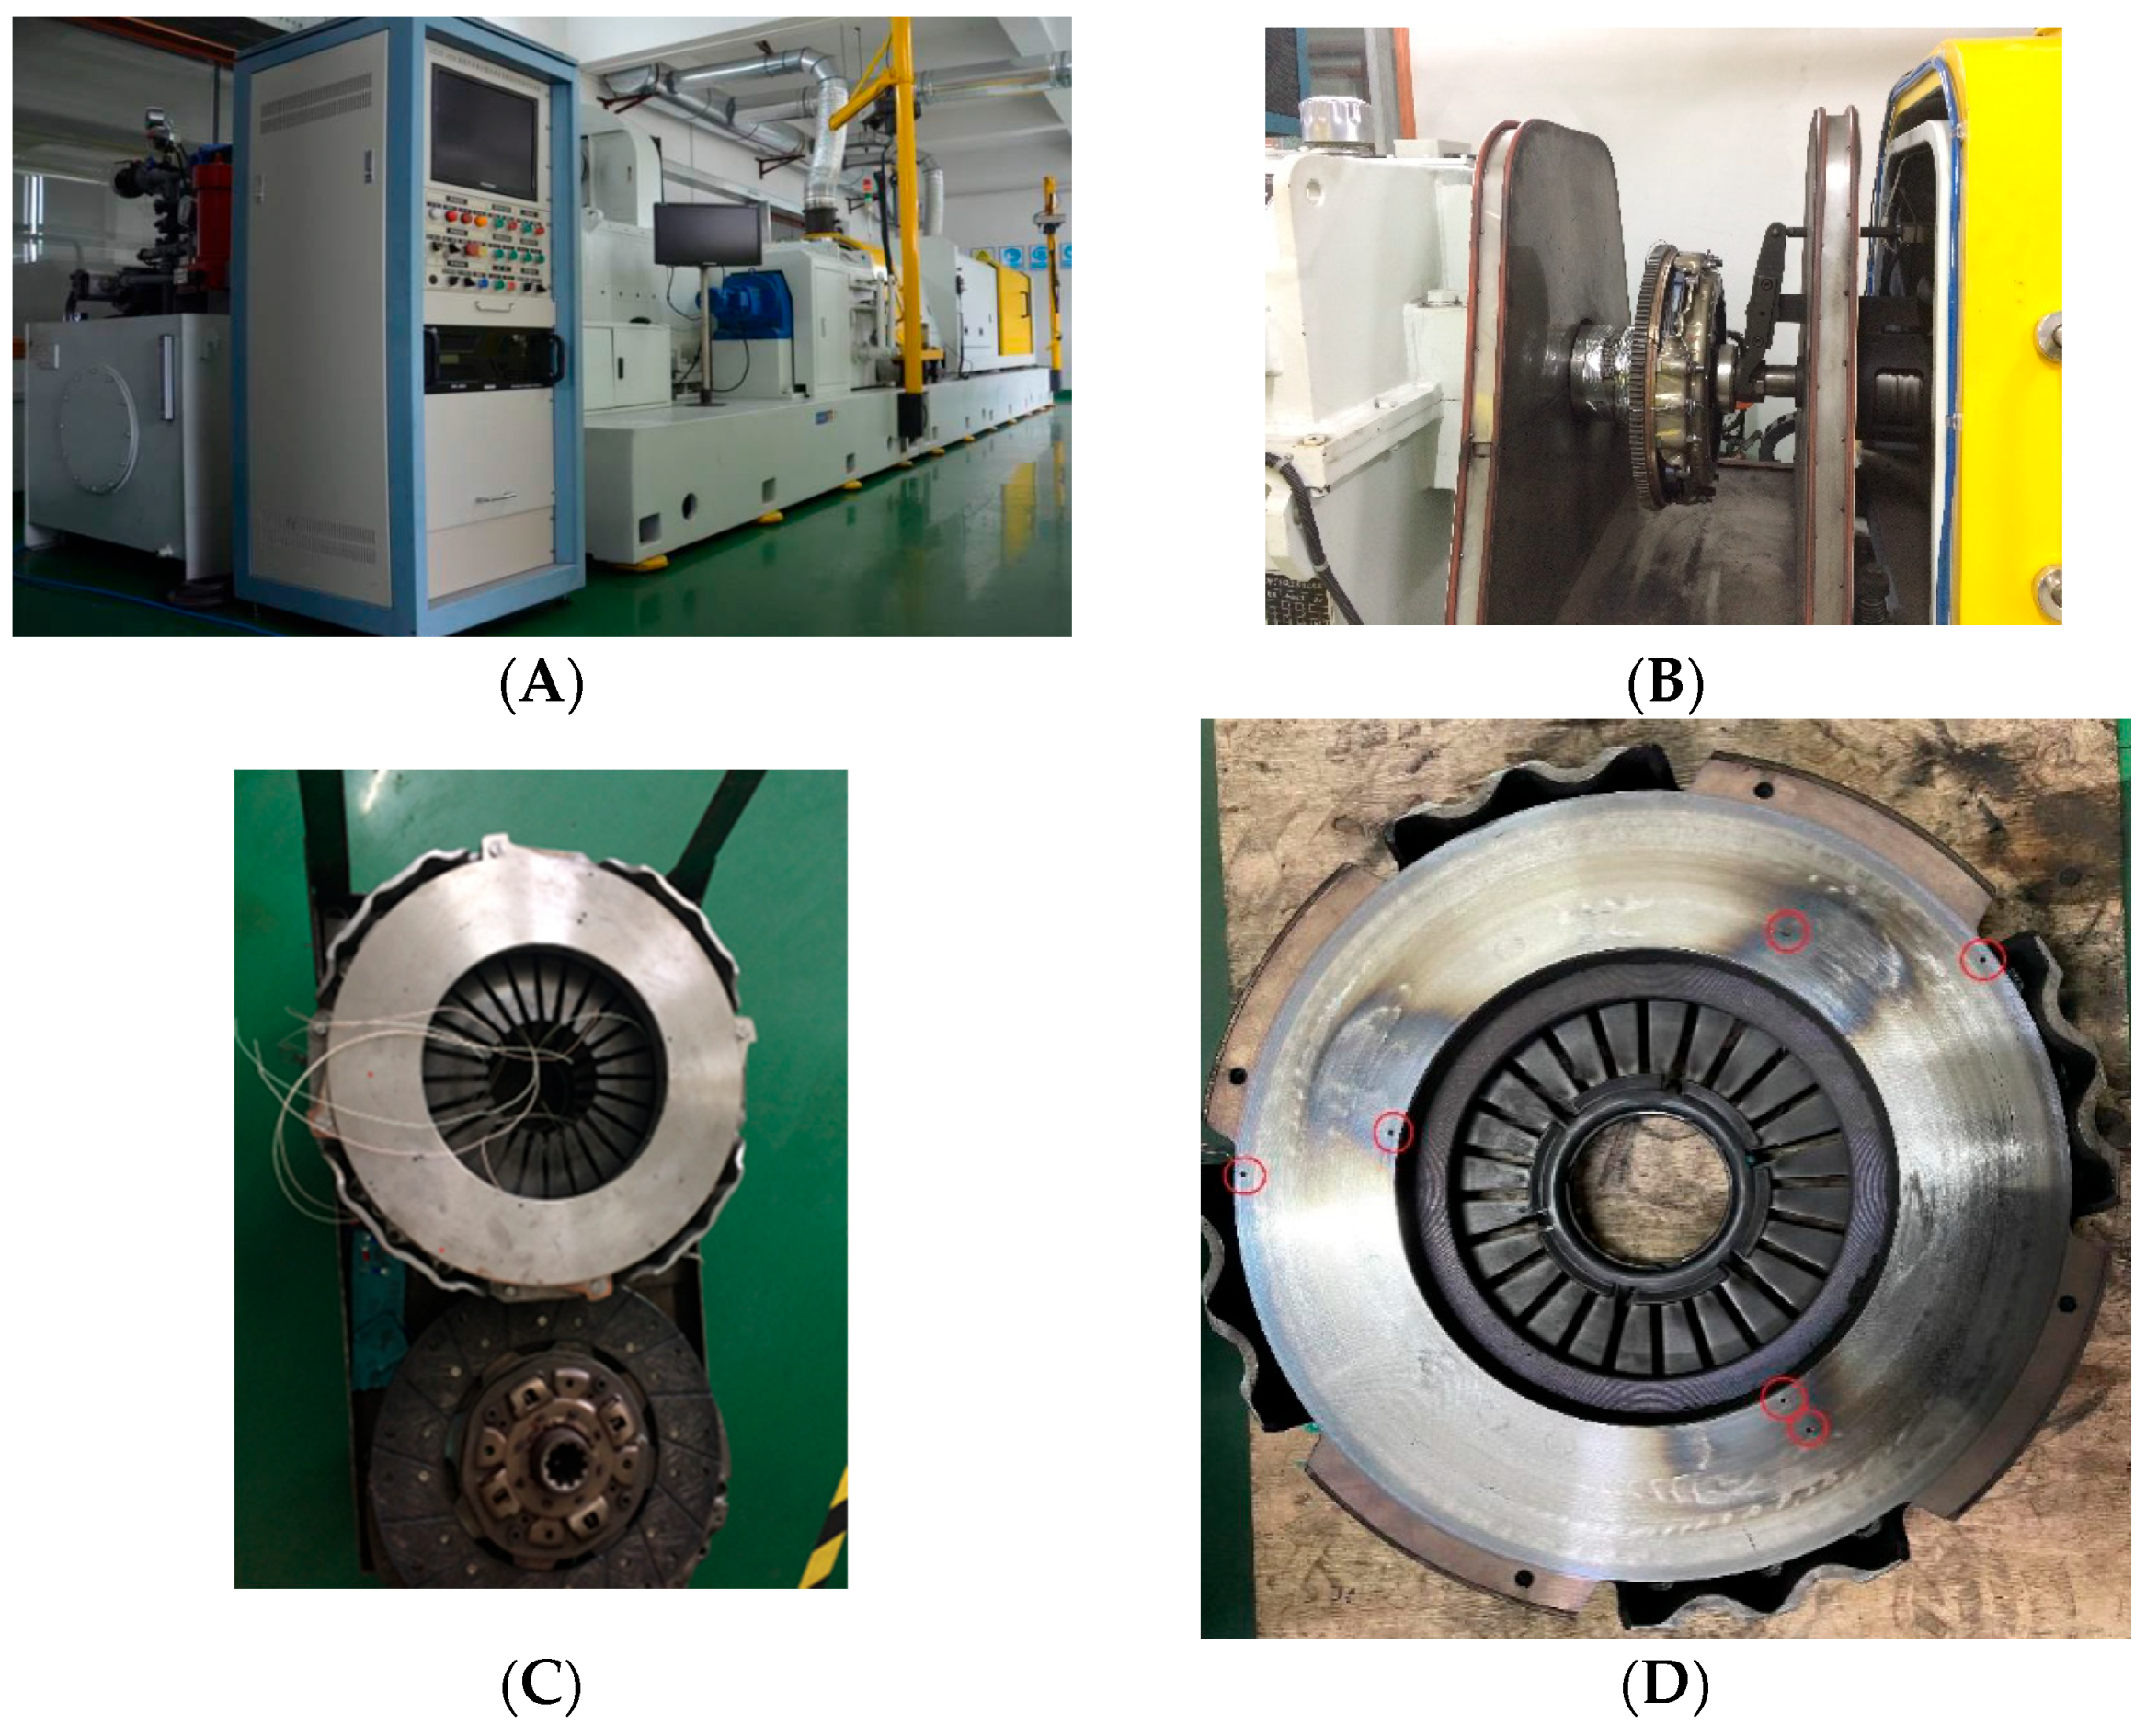
In this paper, experimental data are obtained by using the comprehensive clutch test rig model LZDZX-430A, which is mainly used to simulate and test the working performance of clutches under different operating conditions. It can evaluate the durability, friction characteristics, wear, and ability to transmit the torque of the clutch by simulating the actual operating condition. Temperature measurement is carried out by taking points at different locations on the surface of the clutch pressure plate, as depicted in Figure 3.
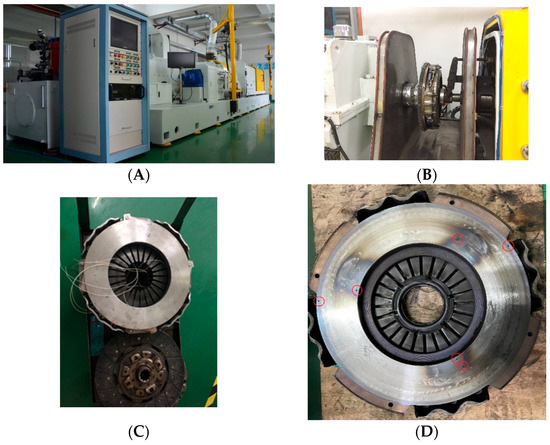
Figure 3.
Experimental equipment: (A) Physical drawing of LZDZX-430A table; (B) platen installation diagram; (C) platen assembly diagram; and (D) thermocouple punching location diagram.
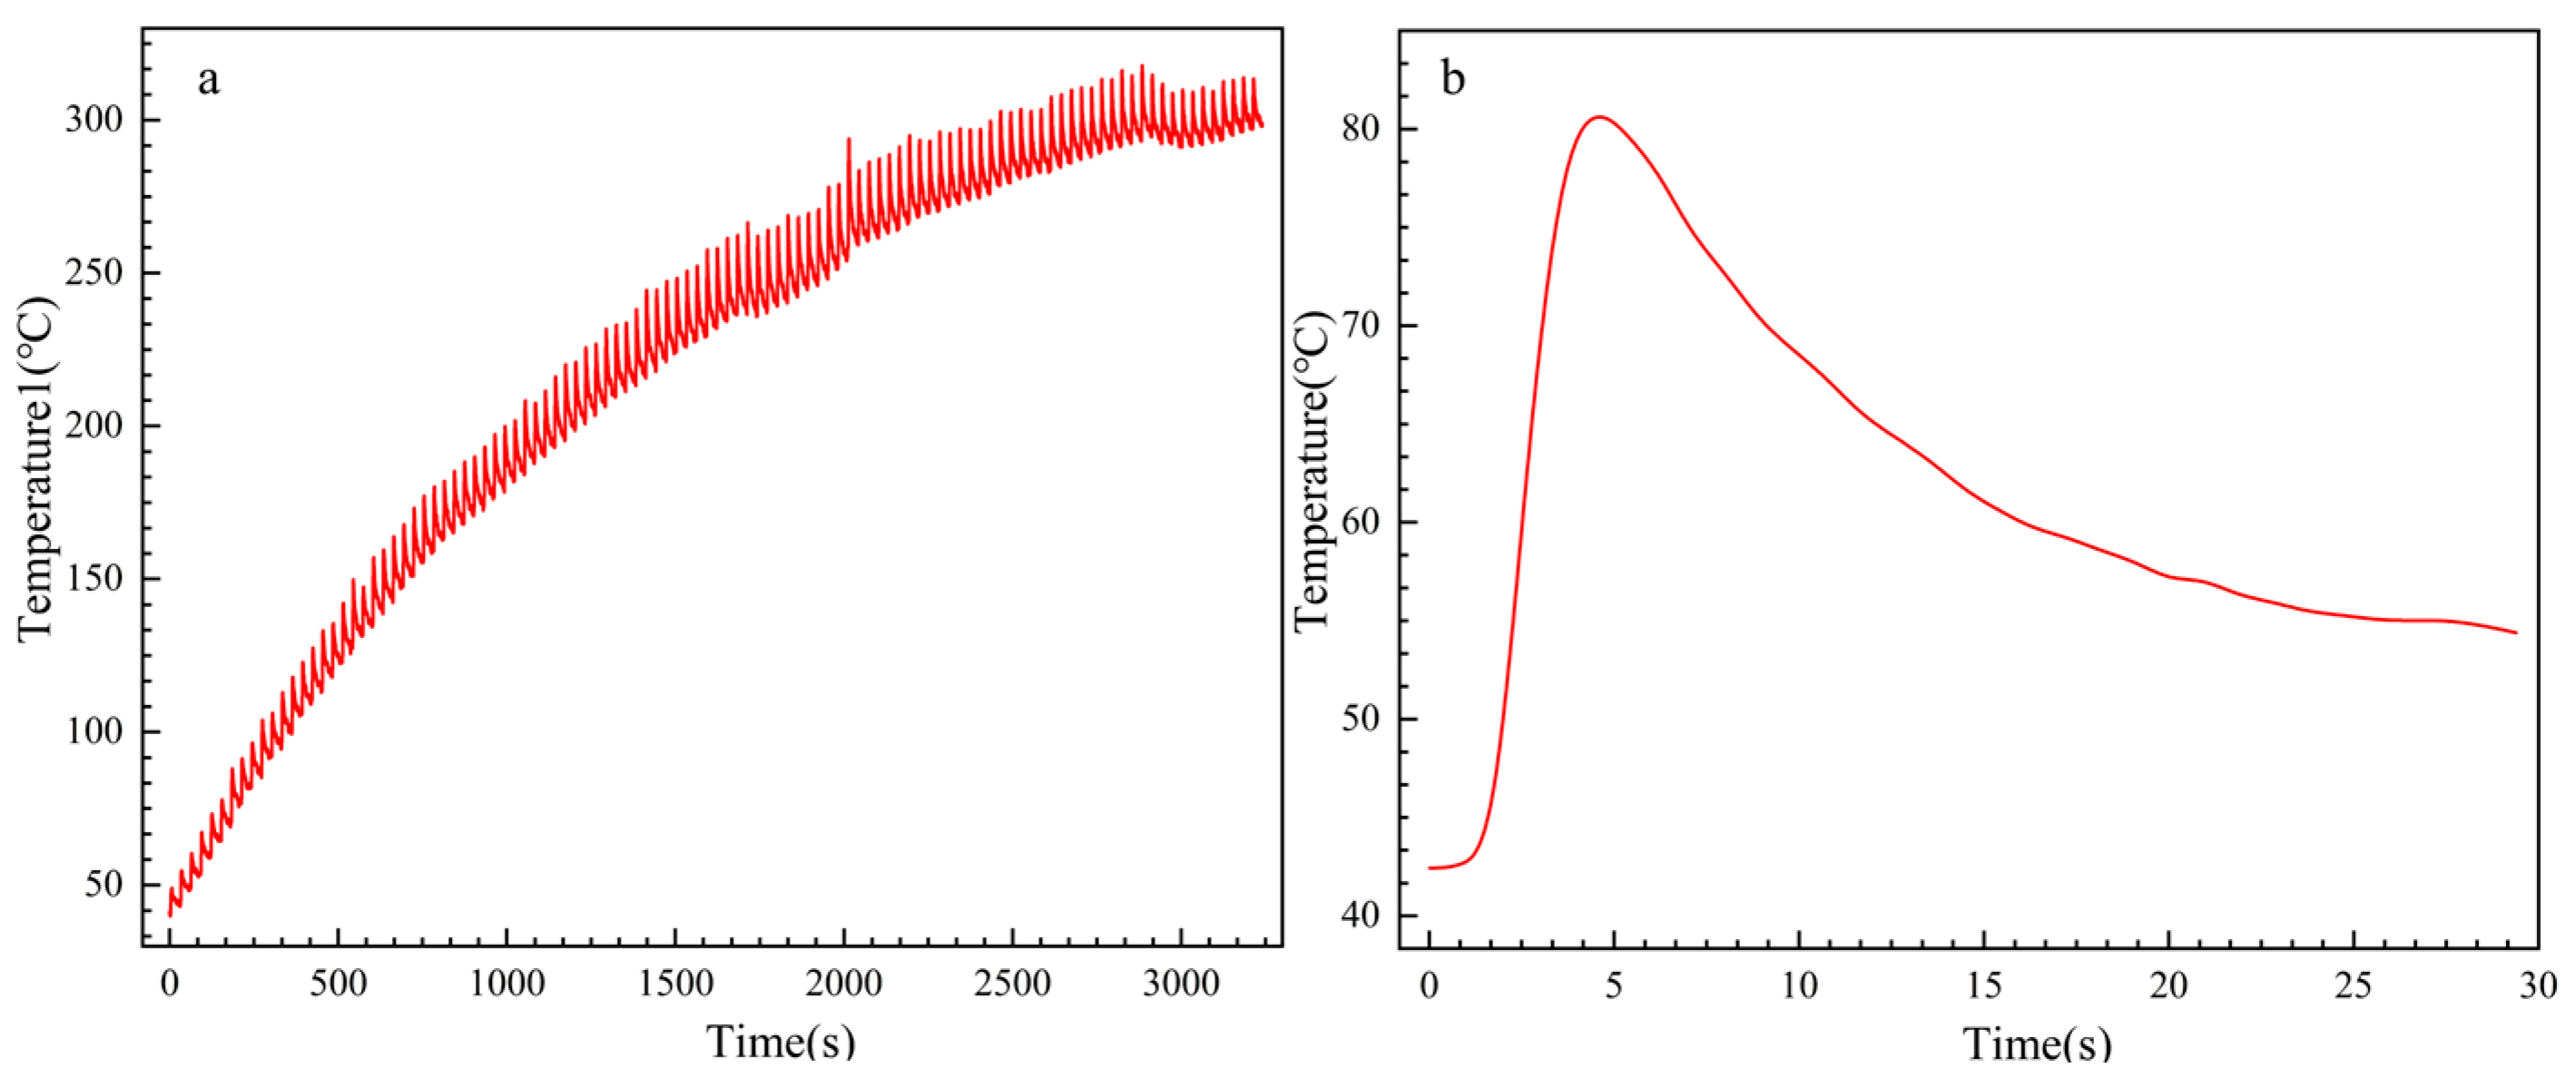
In this paper, a cycle of 30 s, i.e., a complete slip-grinding, is used, and the temperature data of three different positions of a platen are obtained. The platen temperature profile is shown in Figure 4.
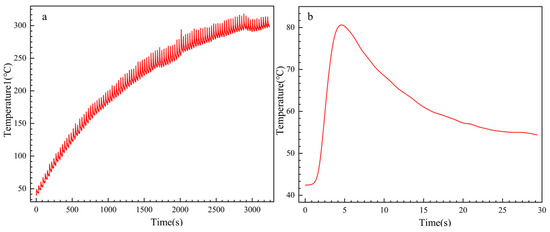
Figure 4.
Platen temperature profile (a) is the complete temperature profile, and (b) is one cycle temperature profile.
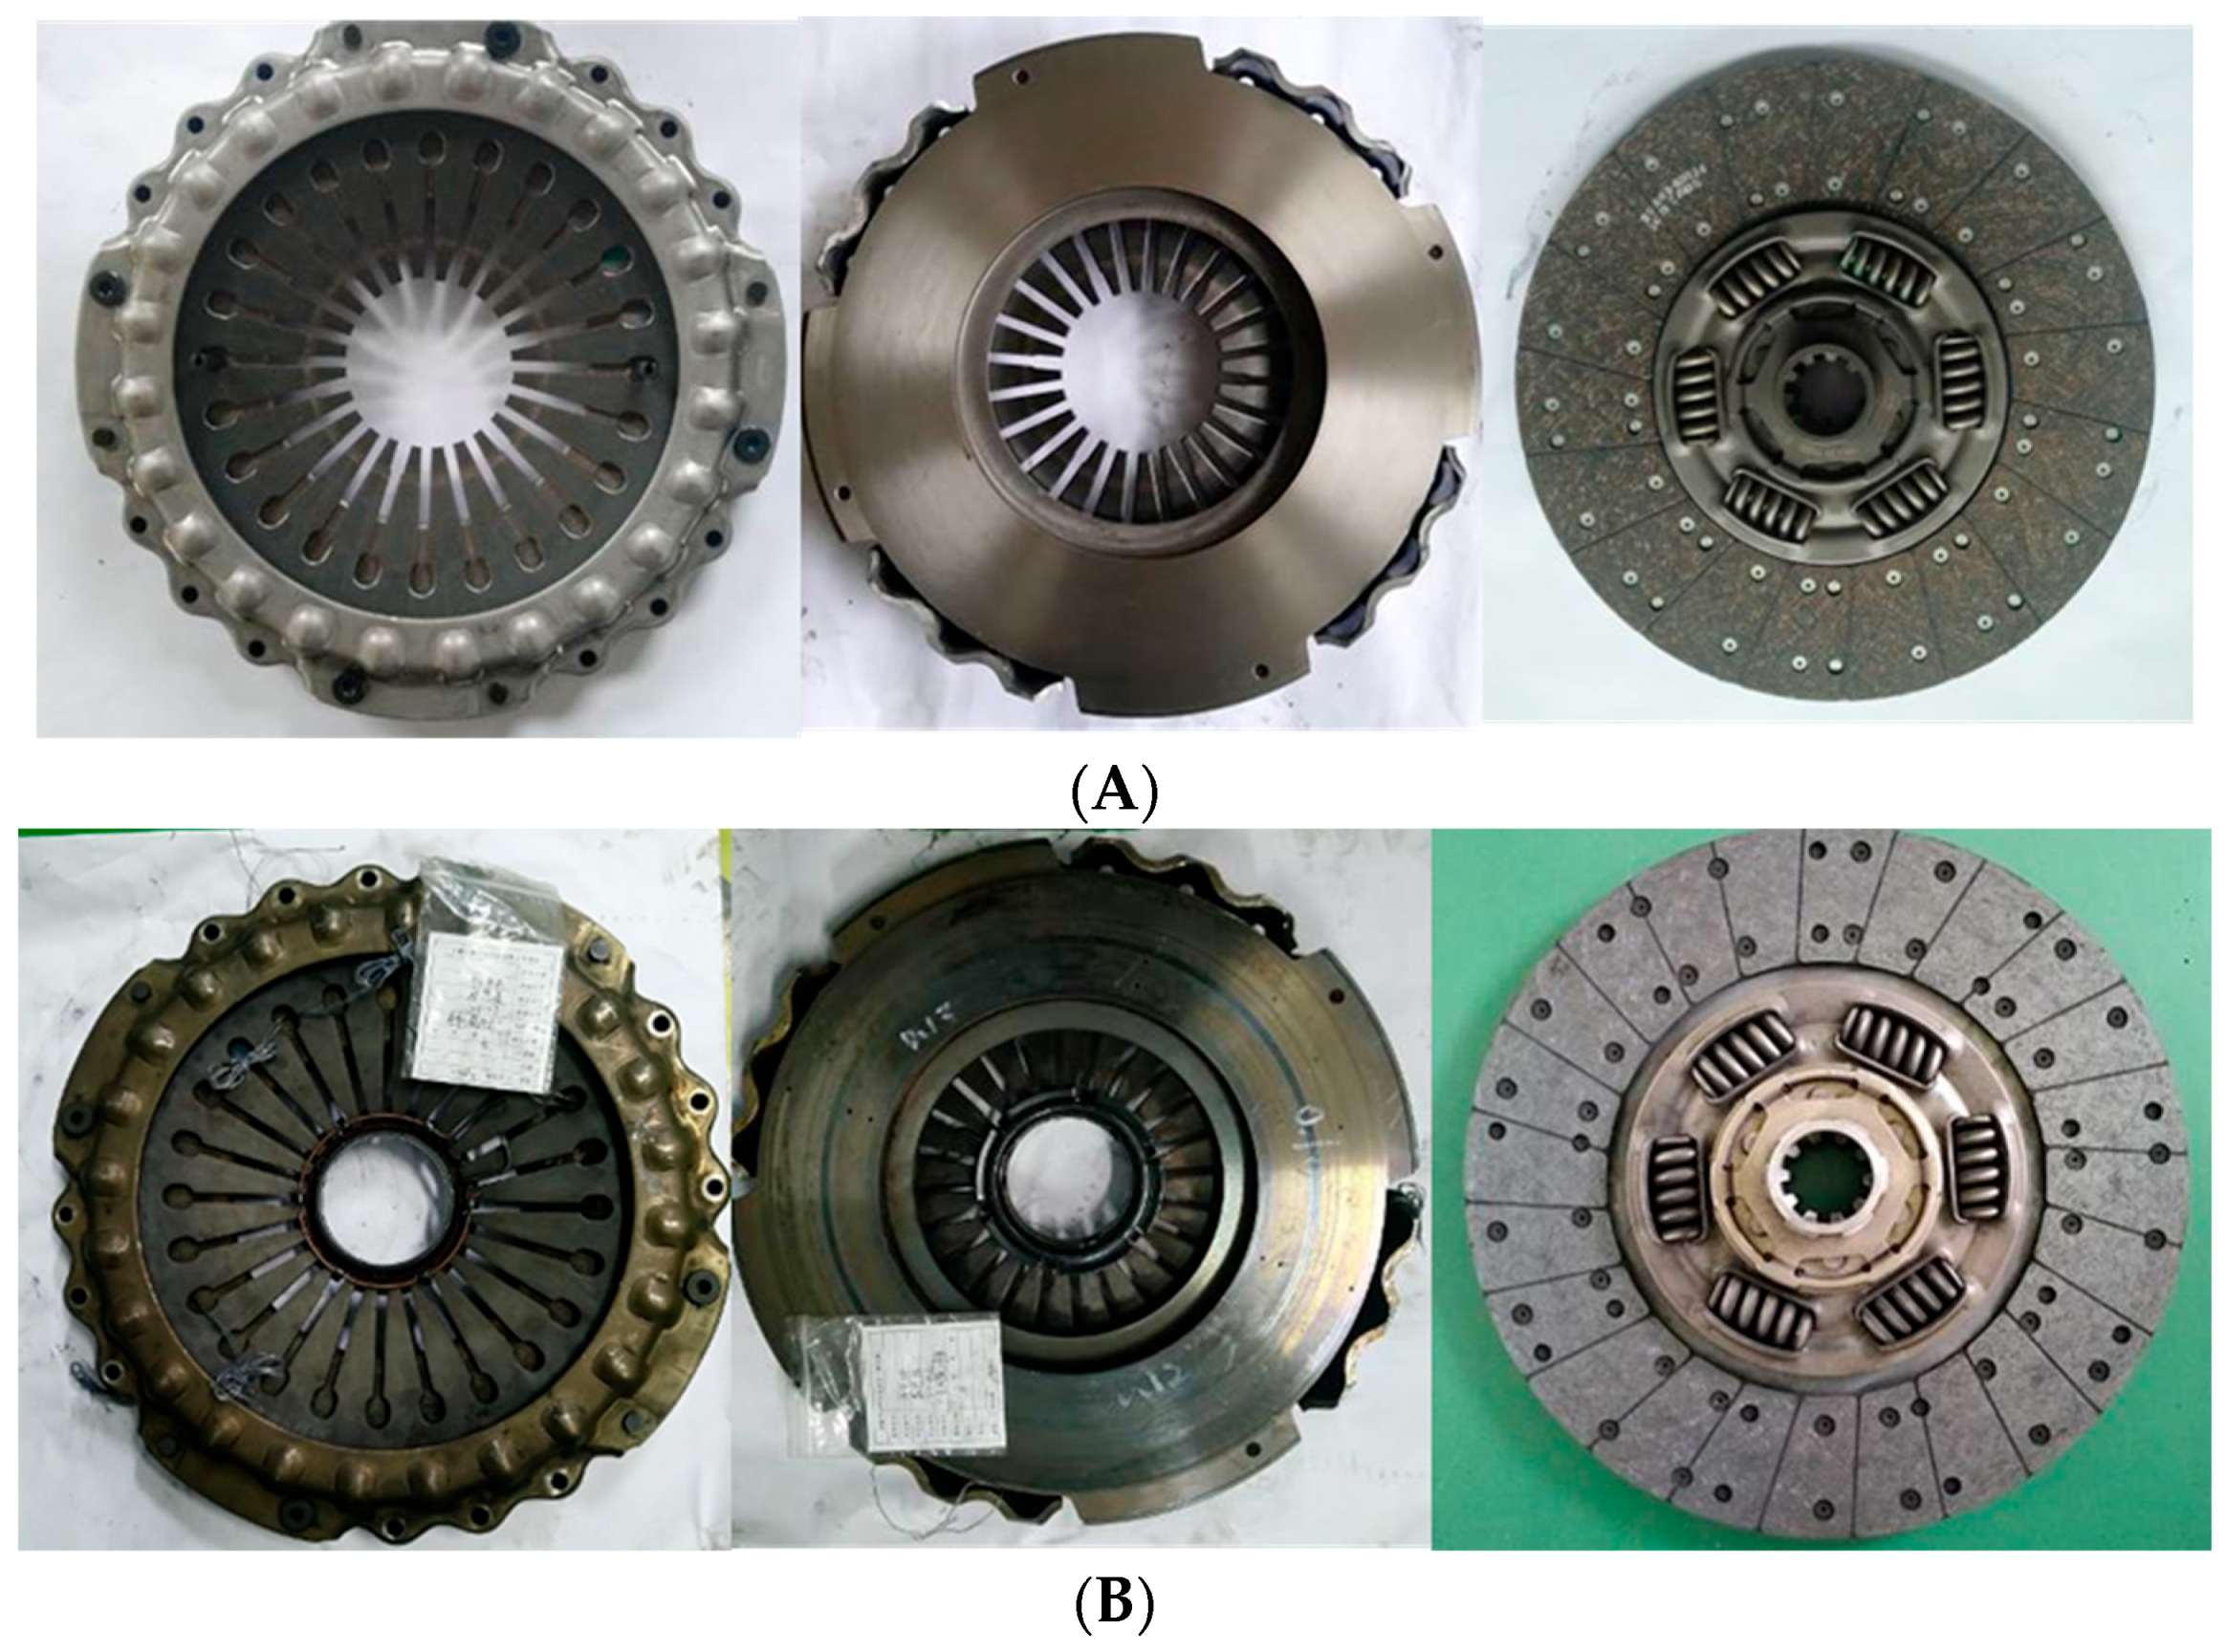
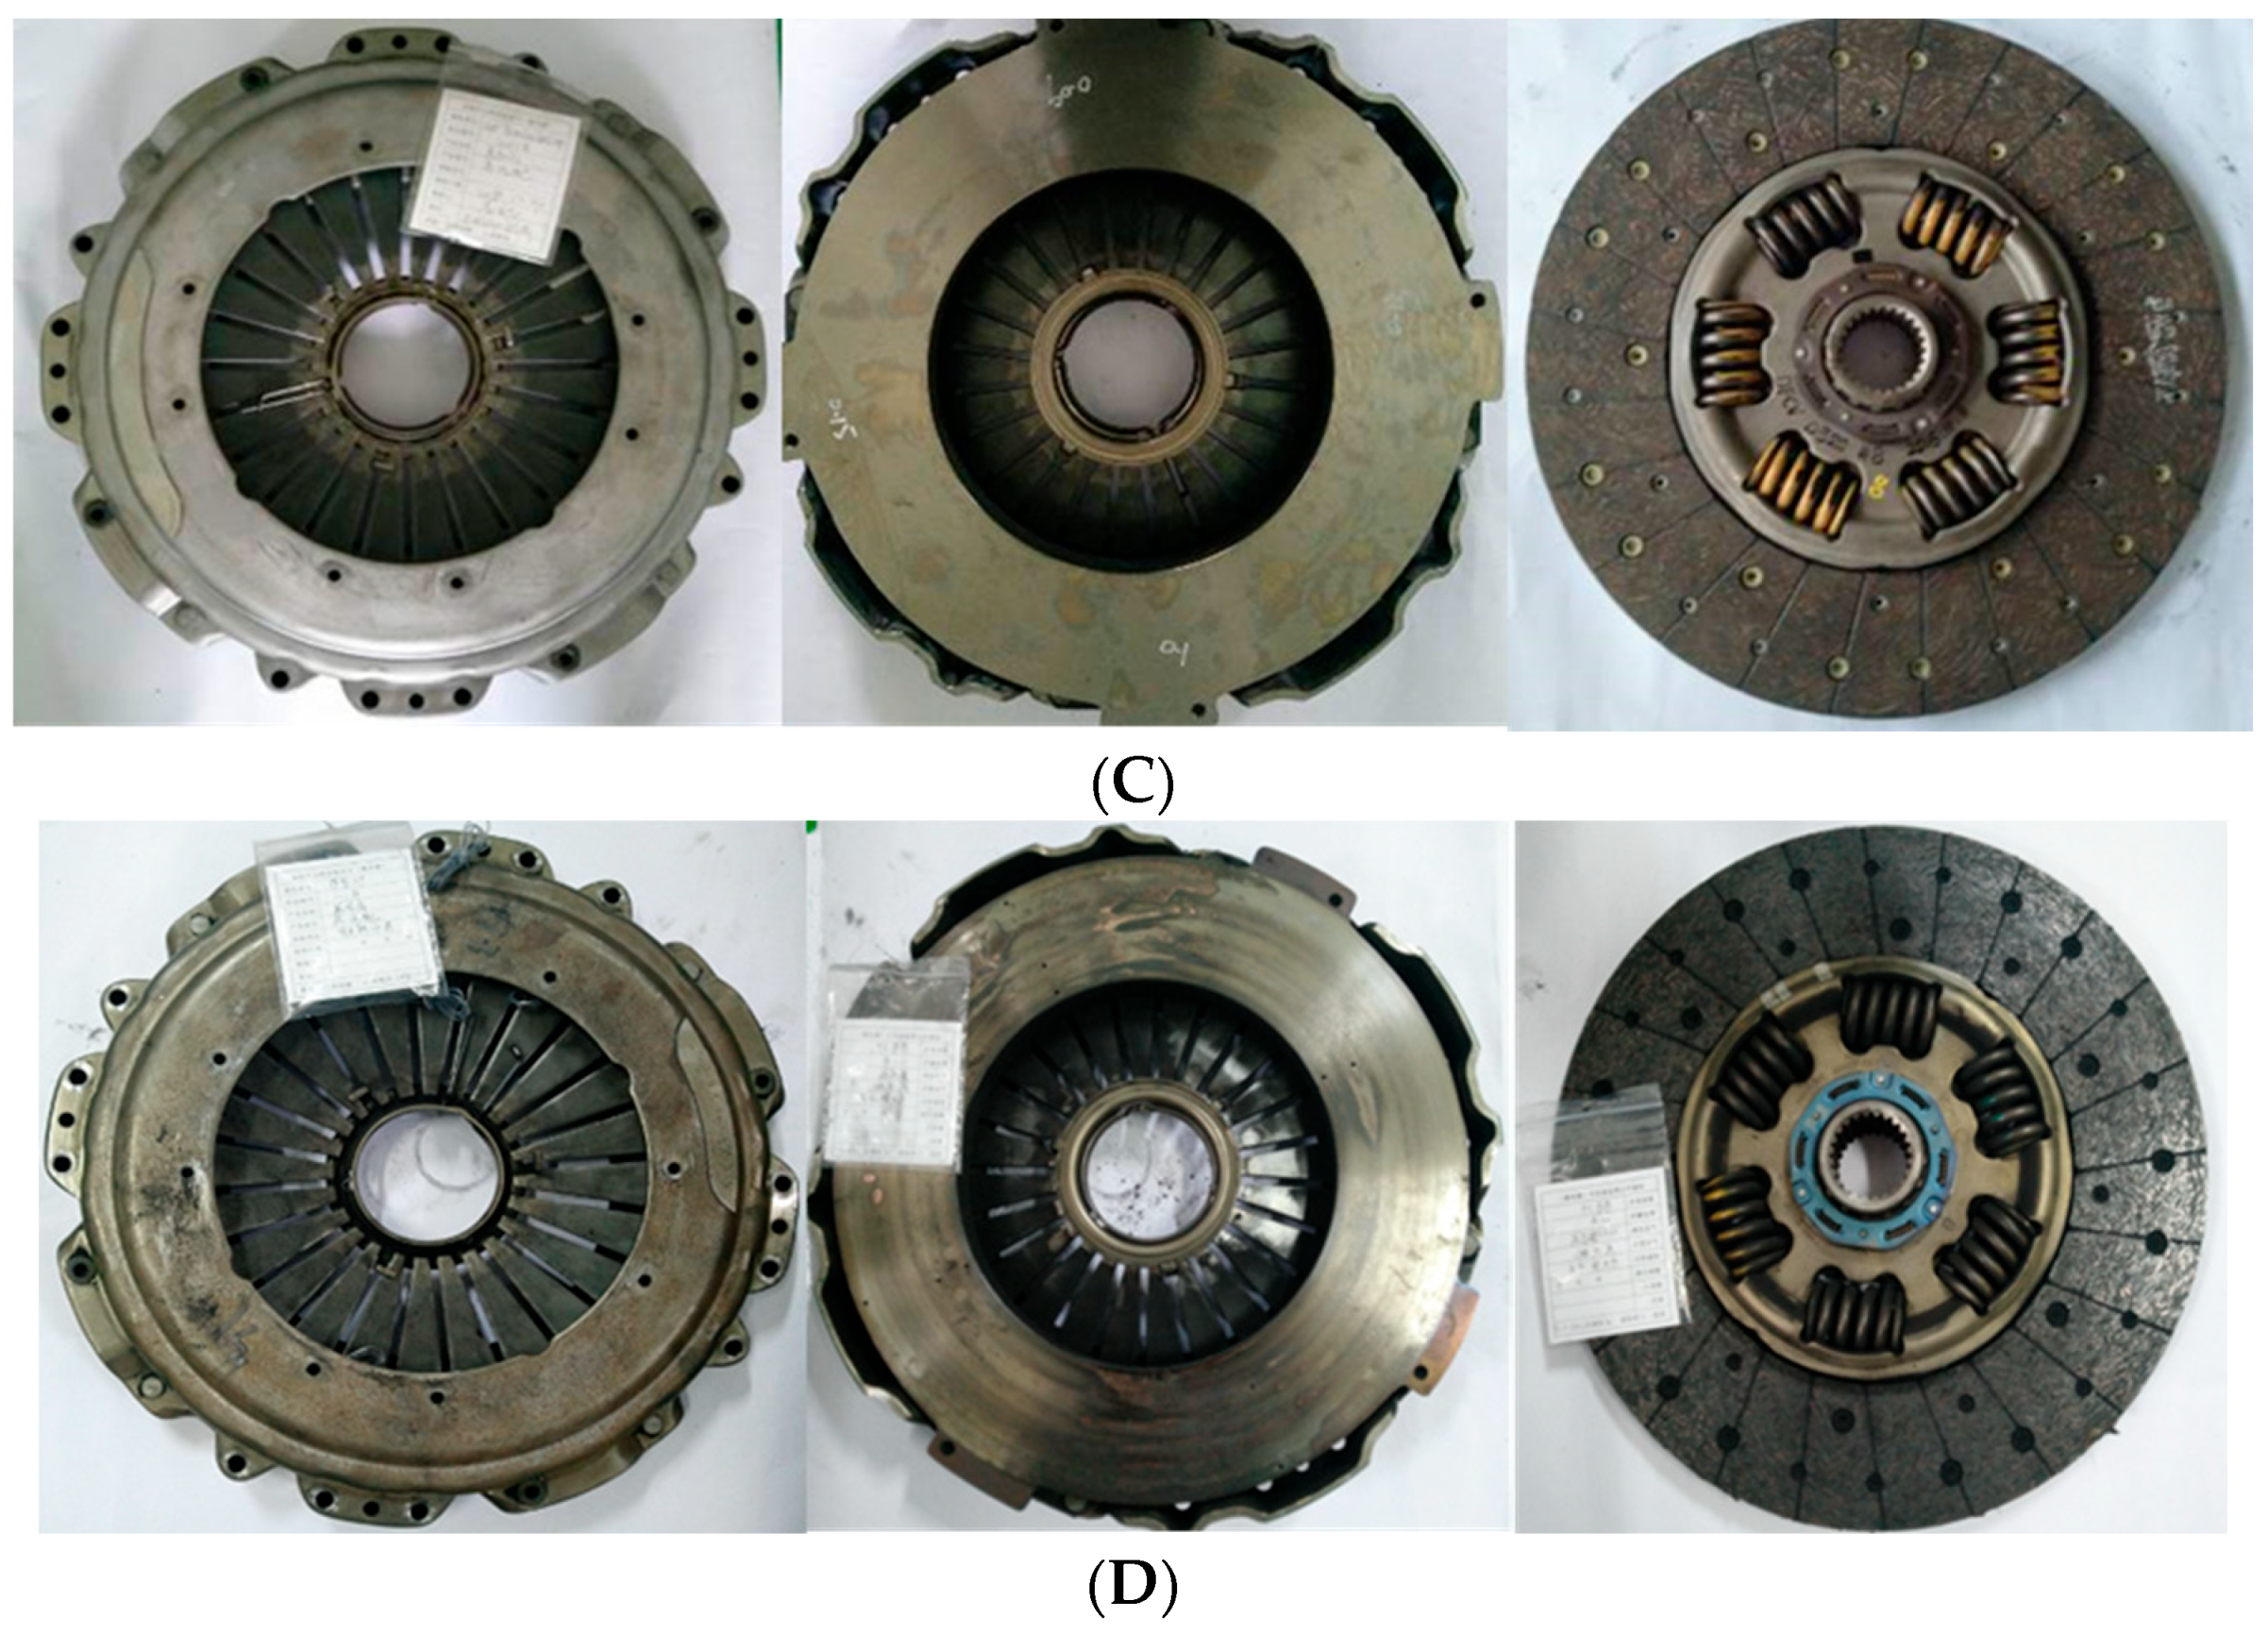
The clutch pressure plate selected in this paper is Fuda (FD) and Valeo clutch pressure plate. The weight of the pressure plate of FD is 28.5 kg, the inner hole of the pressure plate is φ240, the pressure is 32,000 N, the inner hole of the friction plate is φ240, and the amount of waveform is 0.7. The weight of Valeo’s platen is 28.5 kg, the inner hole of the platen is φ260, the pressure is 41,000 N, the inner hole of the friction plate is φ260, and the amount of waveform is 0.7. The platen is shown in Figure 5.

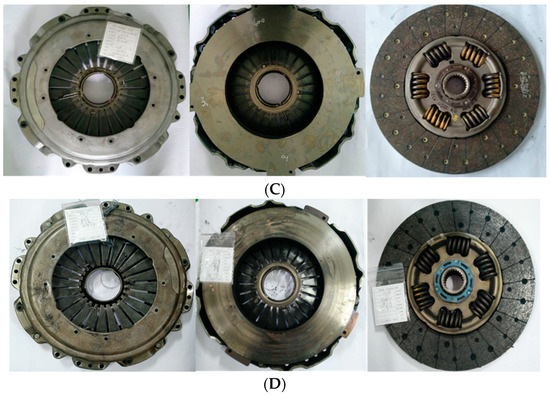
Figure 5.
Clutch pressure plate: (A) Fuda platen and follower plate before experimentation; (B) Fuda platen and follower plate after experimentation; (C) Valeo platen and follower before experimentation; and (D) Valeo platen and follower after experimentation.
Since this paper is designed to predict the temperature profile at a future time, a previous 30 s is used as a basis for predicting the temperature for the next 30 s. Therefore, parameters such as time, termination time, pressure (N), waveform sheet, and platen temperature of the previous cycle are taken as inputs, and the temperature of the platen in the next 30 s is taken as output. The first 6 s is taken as the slip-grinding time and its time interval is taken as 0.05 s; to reduce the computation time, the remaining 24 s is taken as the cooling time, and its time interval is taken as 1 s.
2.3. Model Construction
The model construction involves the following steps:
(1) Data Preprocessing: Experimental data from the Fuda (FD) clutch pressure plate are utilized. The data is divided into 10 parts, with 9 parts assigned to the training set and 1 part to the validation set. The data is also normalized to ensure consistent scaling.
(2) Interactive Slider Implementation: During model training, sliders are introduced as an interactive approach to finely adjust parameter values and step sizes. This method enables precise control over parameter changes and leverages the correlation between data before and after clutch operations, thereby enhancing model accuracy.
(3) Dropout Layer Integration: To prevent overfitting, a dropout layer is incorporated into the network architecture. This layer facilitates learning multiple independent sub-networks, reducing co-adaptation between neurons, and enhancing the model’s generalization capability.
(4) Loss Function and Evaluation Metrics: Mean_squared_error is chosen as the loss function, quantifying the difference between predicted and actual values through squared errors. This choice ensures a smoother loss value and avoids the cancellation of positive and negative errors. The model’s performance is evaluated using metrics such as MSE (Mean Squared Error), RMSE (Root Mean Squared Error), MAE (Mean Absolute Error), and R2 (R-squared). Mathematical expressions for these metrics are shown in Equations (1)–(4).
where is the number of data, and is the mean of .
(5) Model Validation and Output: Finally, the model parameters are fine-tuned using the validation set, and the optimized model is generated. This optimized model is then used to generate the fitted image for further analysis.
2.4. Comparison
The fitting results of three neural networks, BP, LSTM, and Bi-LSTM, on the validation set, are compared. The performance evaluation metrics such as MSE, RMSE, MAE, R2, maximum error, and maximum relative error are used for evaluation, as shown in Table 1.

Table 1.
Predicted total indicators by models (°C).
According to Table 1, for the Bi-LSTM model, its maximum error is below 10 °C, and the MSE, RMSE, and MAE metrics are more convergent to 0, R2 is convergent to 1, the maximum error is 9.3 °C, and the maximum relative error is 3.15%. The metrics accuracy of the Bi-LSTM model is significantly higher than that of the BP model and the LSTM model.
The temperature fitting results of the BP, LSTM, and Bi-LSTM models at three different locations on the platen are shown in Table 2, with a, b, and c being three different locations on the platen. The fitting results on the validation set are shown in Figure 6.
Table 2.
Indicators for each model at each position (°C).
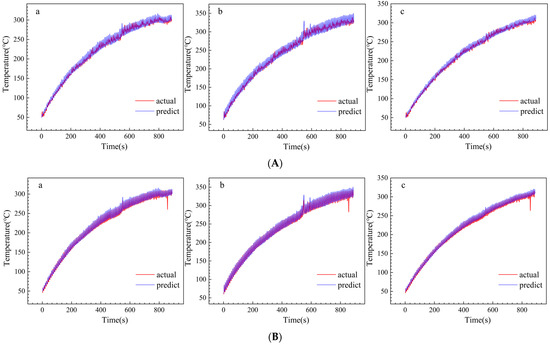
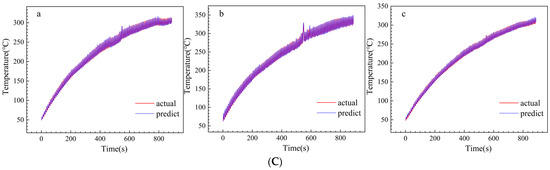
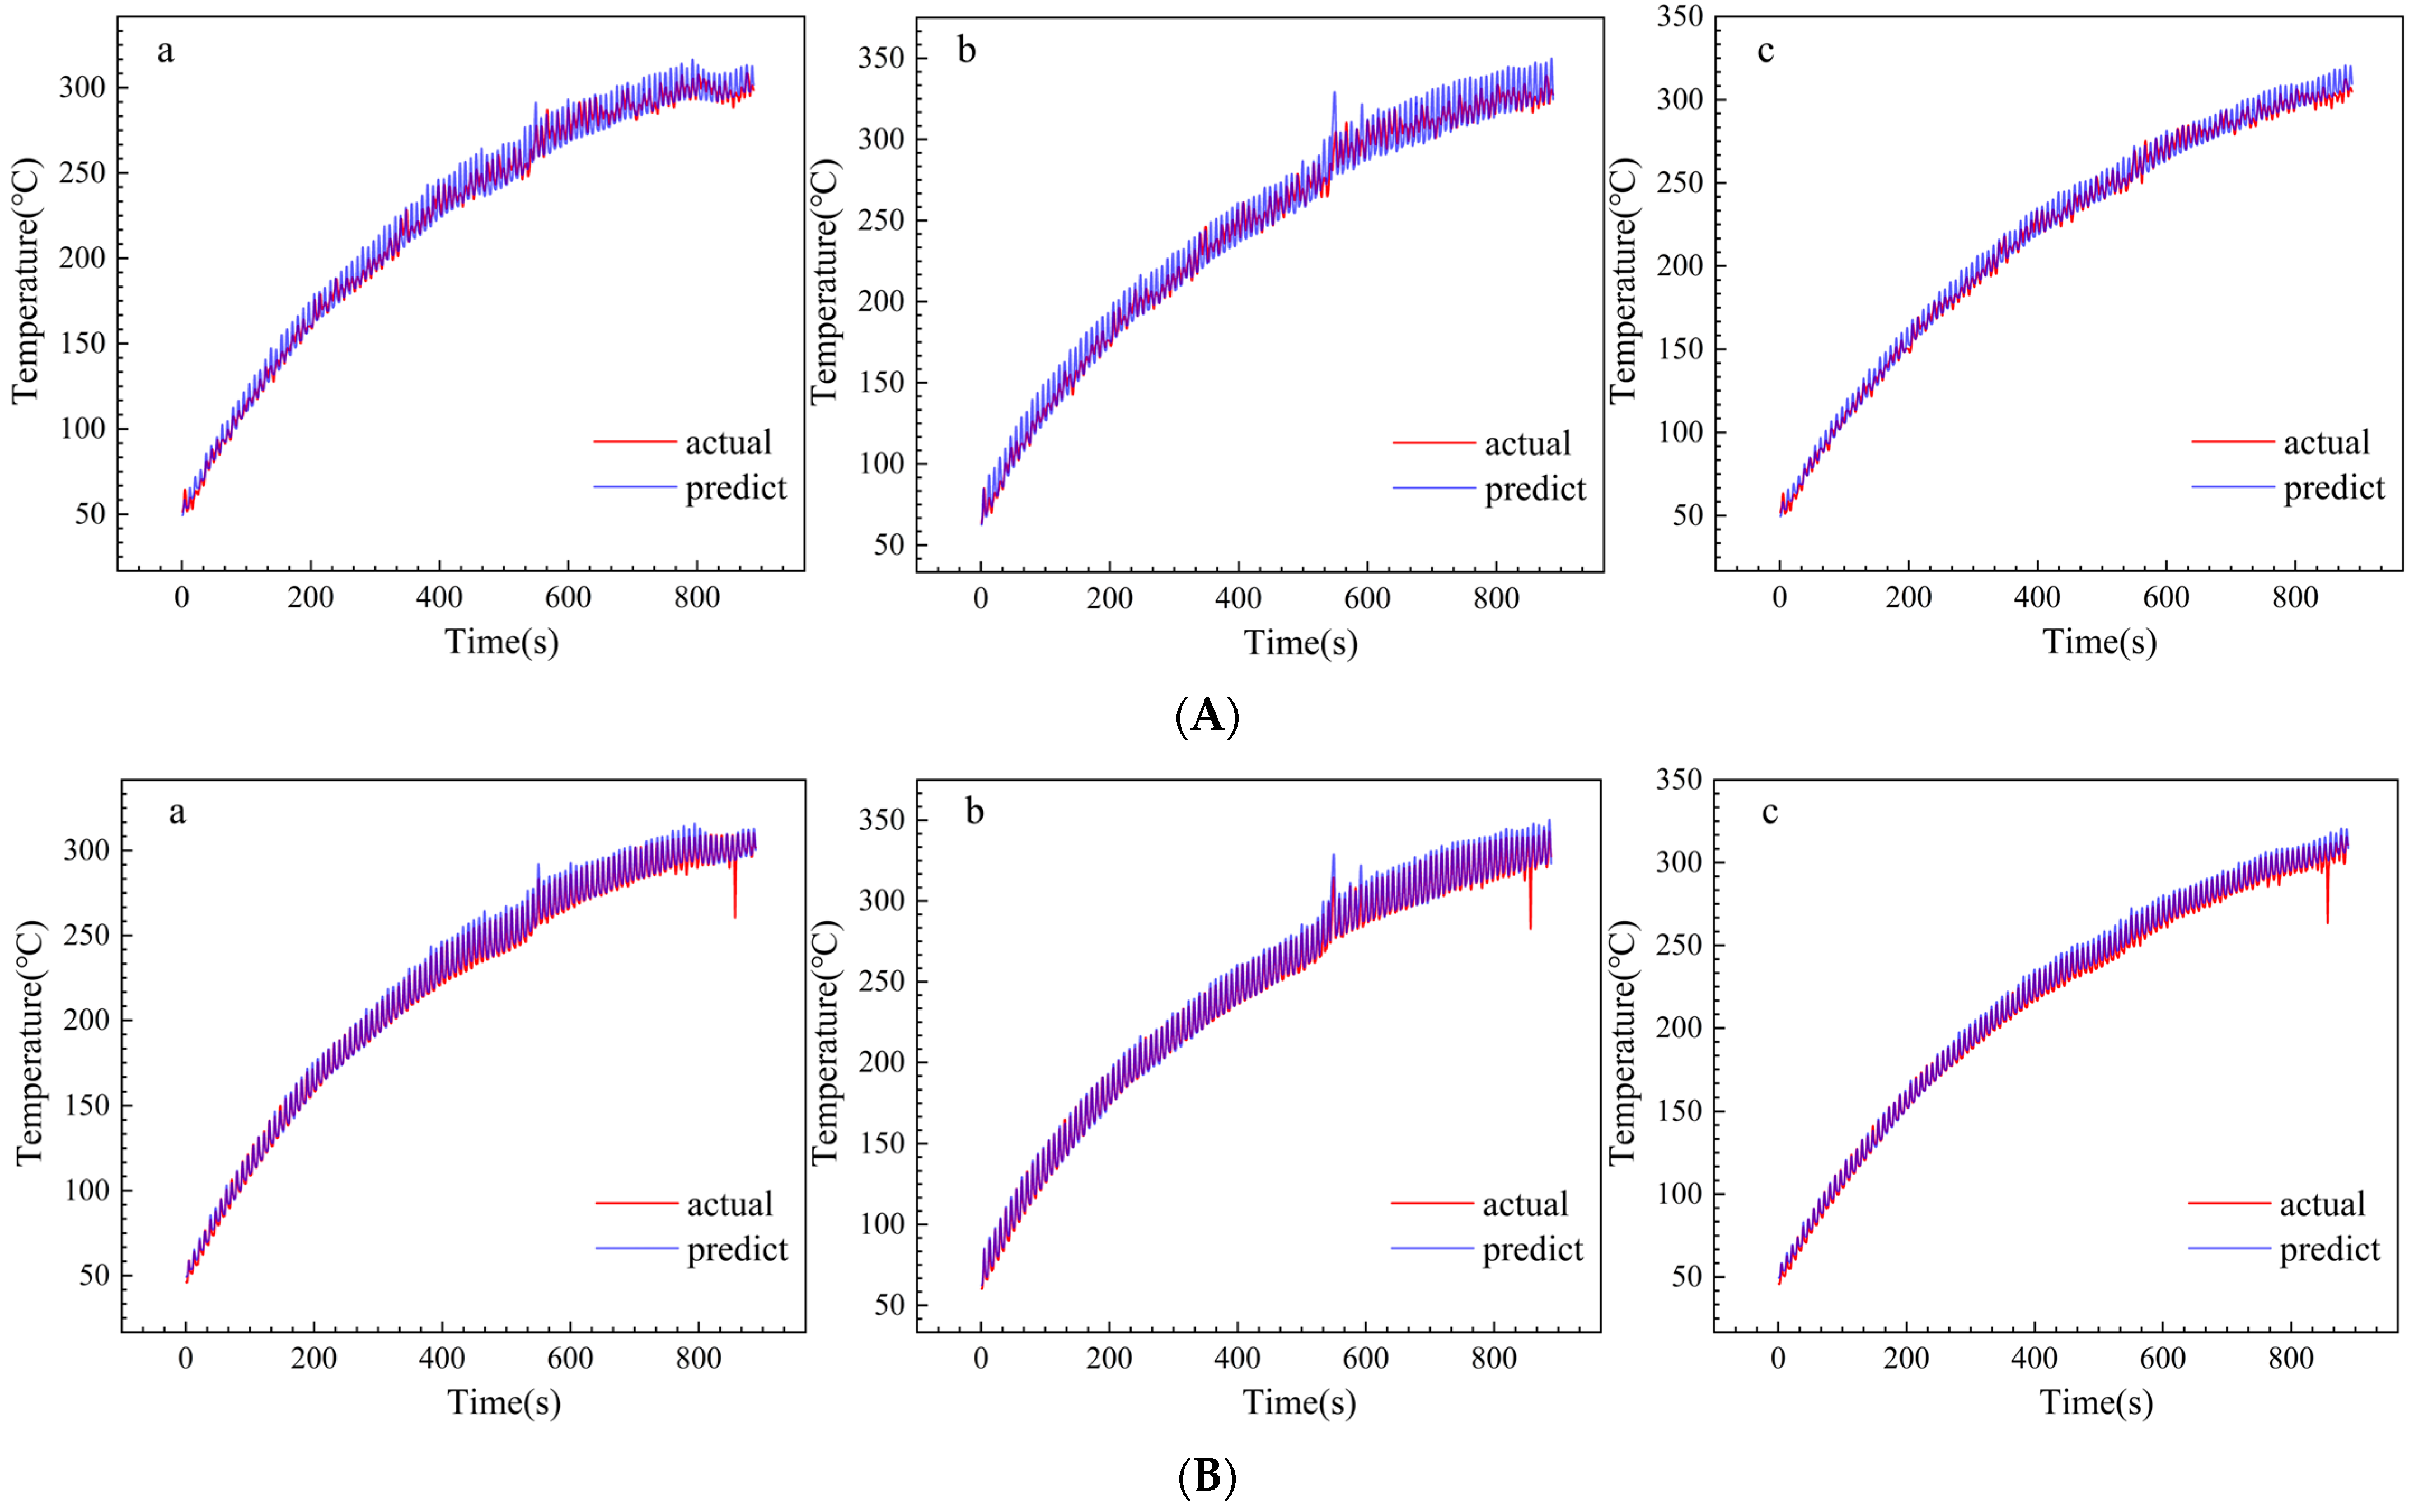
Figure 6.
Comparison of results: (A) BP; (B) LSTM; and (C) Bi-LSTM.
According to Table 2, in the Bi-LSTM model metrics, the maximum error at position a is the largest, 9.13 °C, with a maximum relative error of 3.15%, and the maximum error at position c is the smallest, 4.72 °C, with a maximum relative error of 1.46%. In the LSTM model metrics, the maximum error value at position b is 56.42 °C, but the maximum relative error is the largest at position c, 18.27%. According to the images shown, the Bi-LSTM model fits closer to the actual values in the three positions.
Although these three neural network methods can automatically learn and extract key features in the input data without requiring manual engineering features, this makes them suitable for various data types. However, BP neural network is a feedforward neural network, which usually does not have time linkage. On the contrary, LSTM and Bi-LSTM are recurrent neural network variants suitable for sequence data, with internal state and time linkage. LSTM can only transmit and process sequence data in one direction, while Bi-LSTM can transmit and process data in two directions. The output of each time step contains the context information before and after the time step, which makes the model prediction accuracy higher. Therefore, the Bi-LSTM model outperforms the other two algorithmic models in terms of clutch pressure plate temperature.
In this paper, we will introduce migration learning and introduce part of the temperature data of the new platen for training to realize the high-accuracy prediction of the temperature of the new platen.
2.5. Transfer Learning Algorithms
The objective of transfer learning is to leverage knowledge acquired from one domain (source domain) to enhance performance in another domain (target domain). In this study, we aim to improve the clutch platen temperature prediction in the target domain by utilizing both the trained platen data (source domain) and the upcoming platen data (target domain). As the eigenvalues of these two datasets exhibit some similarity, we employ the ADDA algorithm, a feature-based transfer learning approach. This algorithm maps the real data of the pressure plate from both the source and target domains into a shared virtual space, where the model is constructed. This process enhances the generalization capability of the virtual platen and the algorithm model.
2.6. Model Construction Using Transfer Learning
The model construction process comprises the following steps:
(1) Data Preparation: Two types of clutch pressure plates, the Fuda clutch pressure plate (same model, different experimental environment) and the Valeo clutch pressure plate (different model), were selected for experimentation. Temperature measurements were recorded at three distinct positions on each clutch pressure plate. The experiment was conducted over 28 cycles of clutch pressure plate engagement, corresponding to a duration of 840 s. The collected data was used as the target domain for transfer learning. The data underwent cleaning and organization, and time intervals of 0.05 s and 1 s were set for the initial 6 s and the last 24 s, respectively. Finally, the data was normalized to reduce errors.
(2) Model Architecture: The Bi-LSTM model was imported, and two identical model frames were set up simultaneously to serve as encoders, projecting the two sets of data into a unified space. A regressor and a discriminator were also established. The regressor received the extracted features as inputs and learned the mapping relationship of the predicted target variables on the target domain, while the discriminator distinguished between the trained data (source domain) and the data ready for training (target domain).
(3) Training the Model: The new data was divided into ten parts, with nine parts allocated as the training set and one part as the validation set. Hyper-parameters such as training times and batch size were set, and the new model was trained accordingly. The validation set was used for prediction to ensure that the model effectively fitted the target domain data.
(4) Temperature Prediction and Experiment: The model was employed to predict the temperatures at three different points on the platen for the time interval of 840–870 s. Simultaneously, the actual temperatures were collected during experimentation using the LZDZX-430A bench. A comparison and summary of the two datasets were conducted.
(5) Continued Prediction and Experimentation: The predicted data from step (4) was used as input parameters to further predict the platen temperature for the next 30 s (870–900 s). The experiment was conducted for comparison. This process was repeated for three different time intervals: 840–870 s, 870–900 s, and 900–930 s.
2.7. Fitting Results of Fuda Clutch Pressure Plate
Data from multiple experimental batches of the same model was utilized for training to create the migration learning model. The prediction results of this model on the validation set are illustrated in Figure 7. The corresponding evaluation metrics are presented in Table 3.
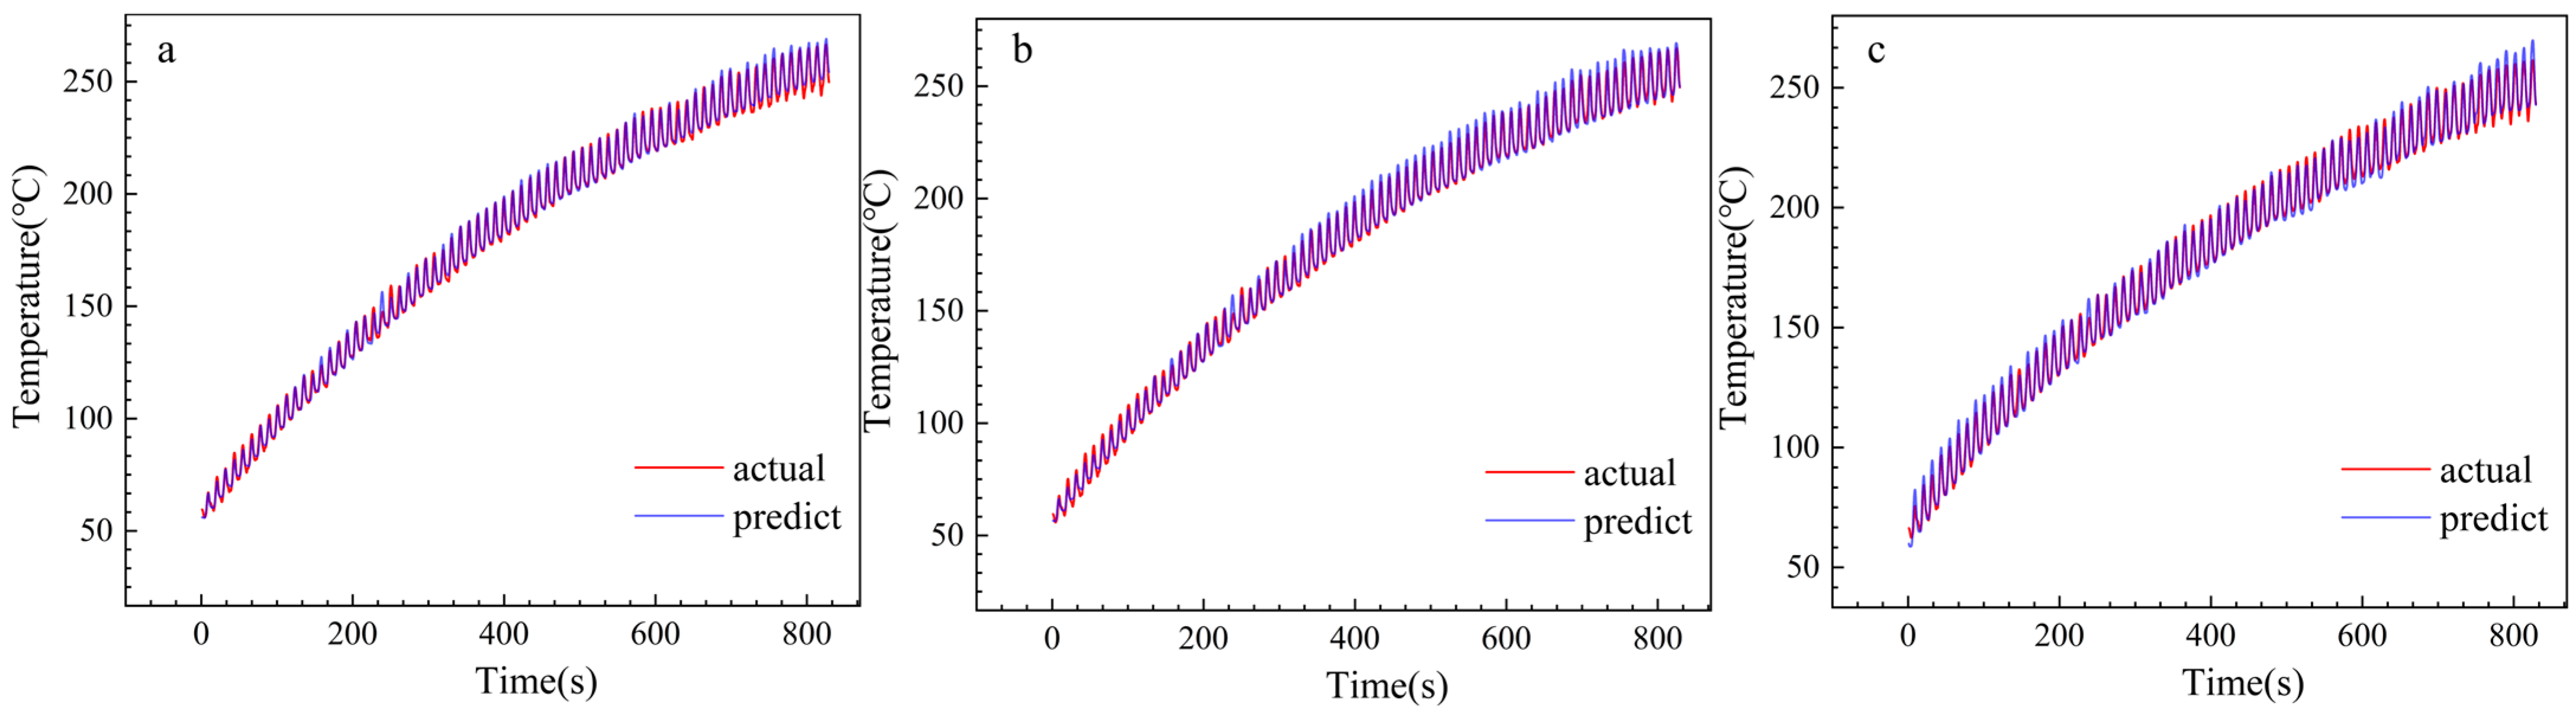
Figure 7.
Validation image of the Fuda pressure plate ((a–c) are the three positions of the pressure plate).
Table 3.
Migration model metrics (°C).
Based on Table 3 and Figure 7, the model achieves a maximum error of 16.15 °C on the validation set, with a maximum relative error of 6.09% and an R2 value of 0.997, approaching 1. This indicates a strong fit for new data and supports its applicability in predicting the temperature of the Fuda platen.
2.8. Fitting Results for the Valeo Clutch Pressure Plate
The data of different models are imported for training to obtain the migration learning model. The prediction results of this migration learning model on the validation set are depicted in Figure 8. Corresponding evaluation metrics can be found in Table 4.
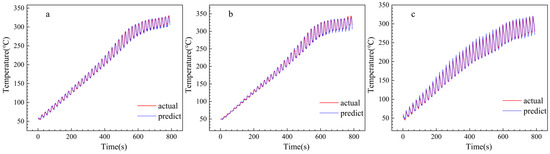
Figure 8.
Validation image of the Valeo pressure plate ((a–c) are the three positions of the plate).
Table 4.
Migration model indicators (°C).
Based on the data presented in Table 4 and Figure 8, the maximum error of the model on the validation set is 17.87 °C, the maximum relative error is 5.63%, and the R2 is 0.9983, which tends to be 1. Consequently, the model proves to be suitable for accurate temperature predictions on the Valeo platen.
3. Pressure Plate Temperature Prediction
3.1. Fuda Clutch Pressure Plate Temperature Prediction
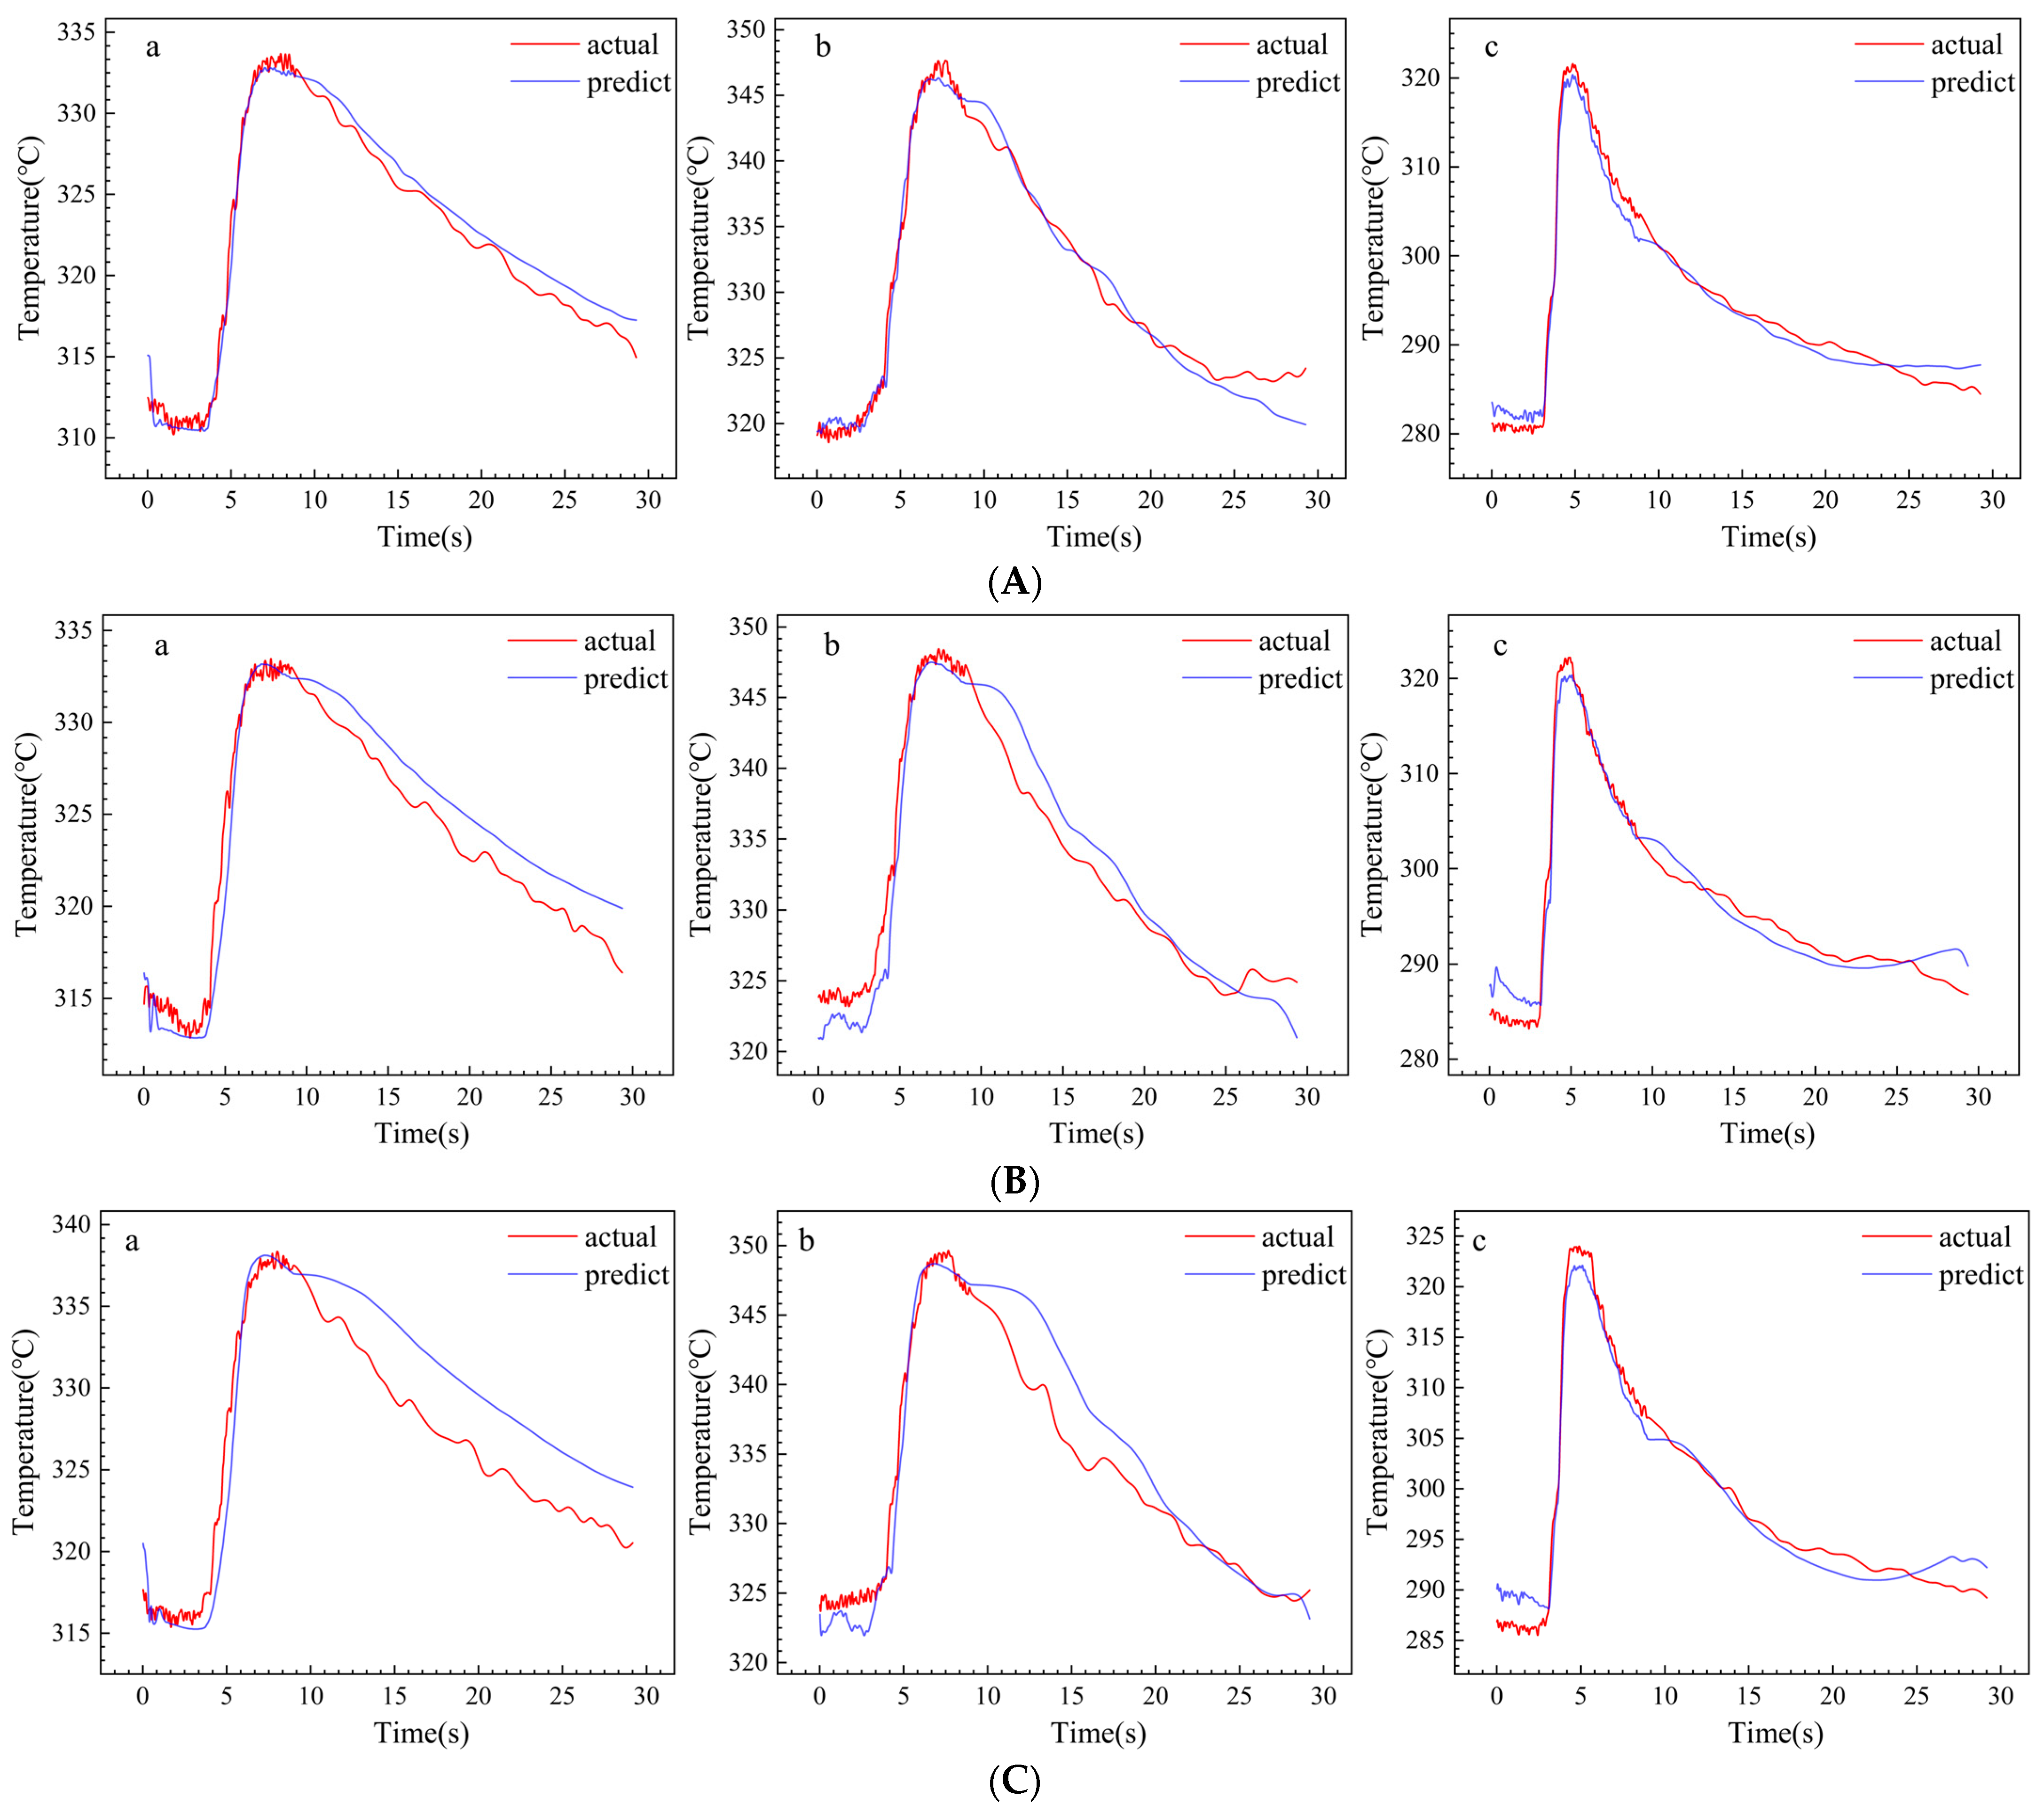
The new Fuda model is used to predict the clutch pressure plate temperature. Initially, the model was trained and tested using temperature data recorded between the 840–870 s. Subsequently, predictions from the model were verified and analyzed against experimental data. The predicted values were then used as input parameters for temperature prediction in the 870–900 s range, and this prediction was also validated through experimentation. This iterative process was repeated for temperature prediction in the 900–930 s range. Finally, the experimental and predicted data were organized, and their index parameters were calculated, as presented in Table 5. The temperature profiles at three different positions of the platen for the duration of 840–930 s are illustrated in Figure 9.
Table 5.
The total prediction index of Fuda clutch pressure plate.
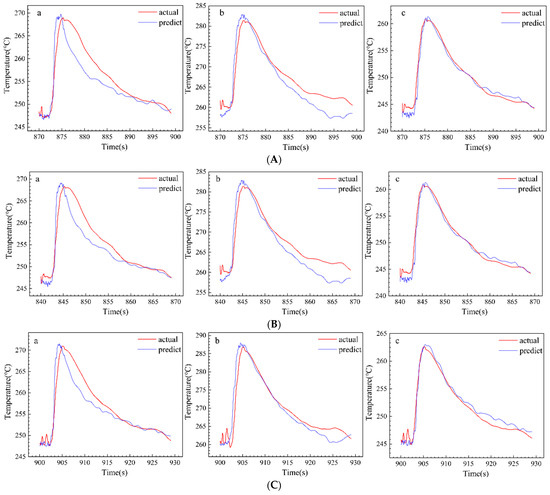
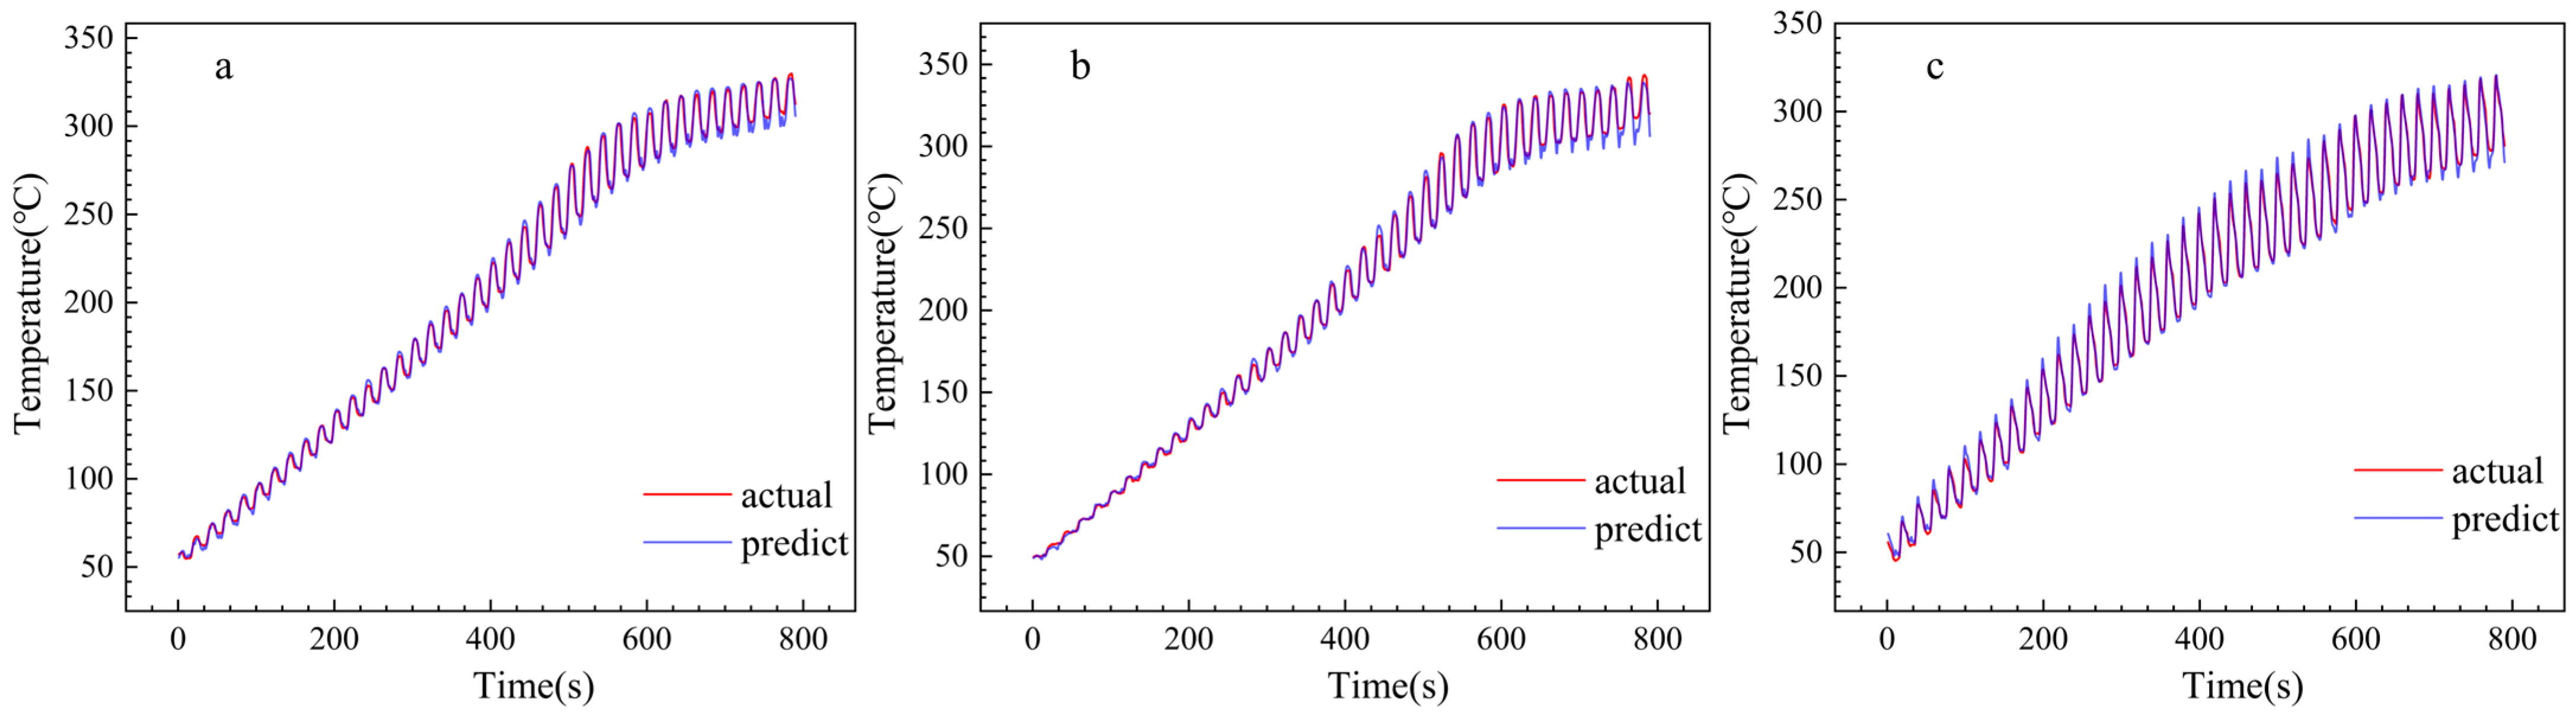
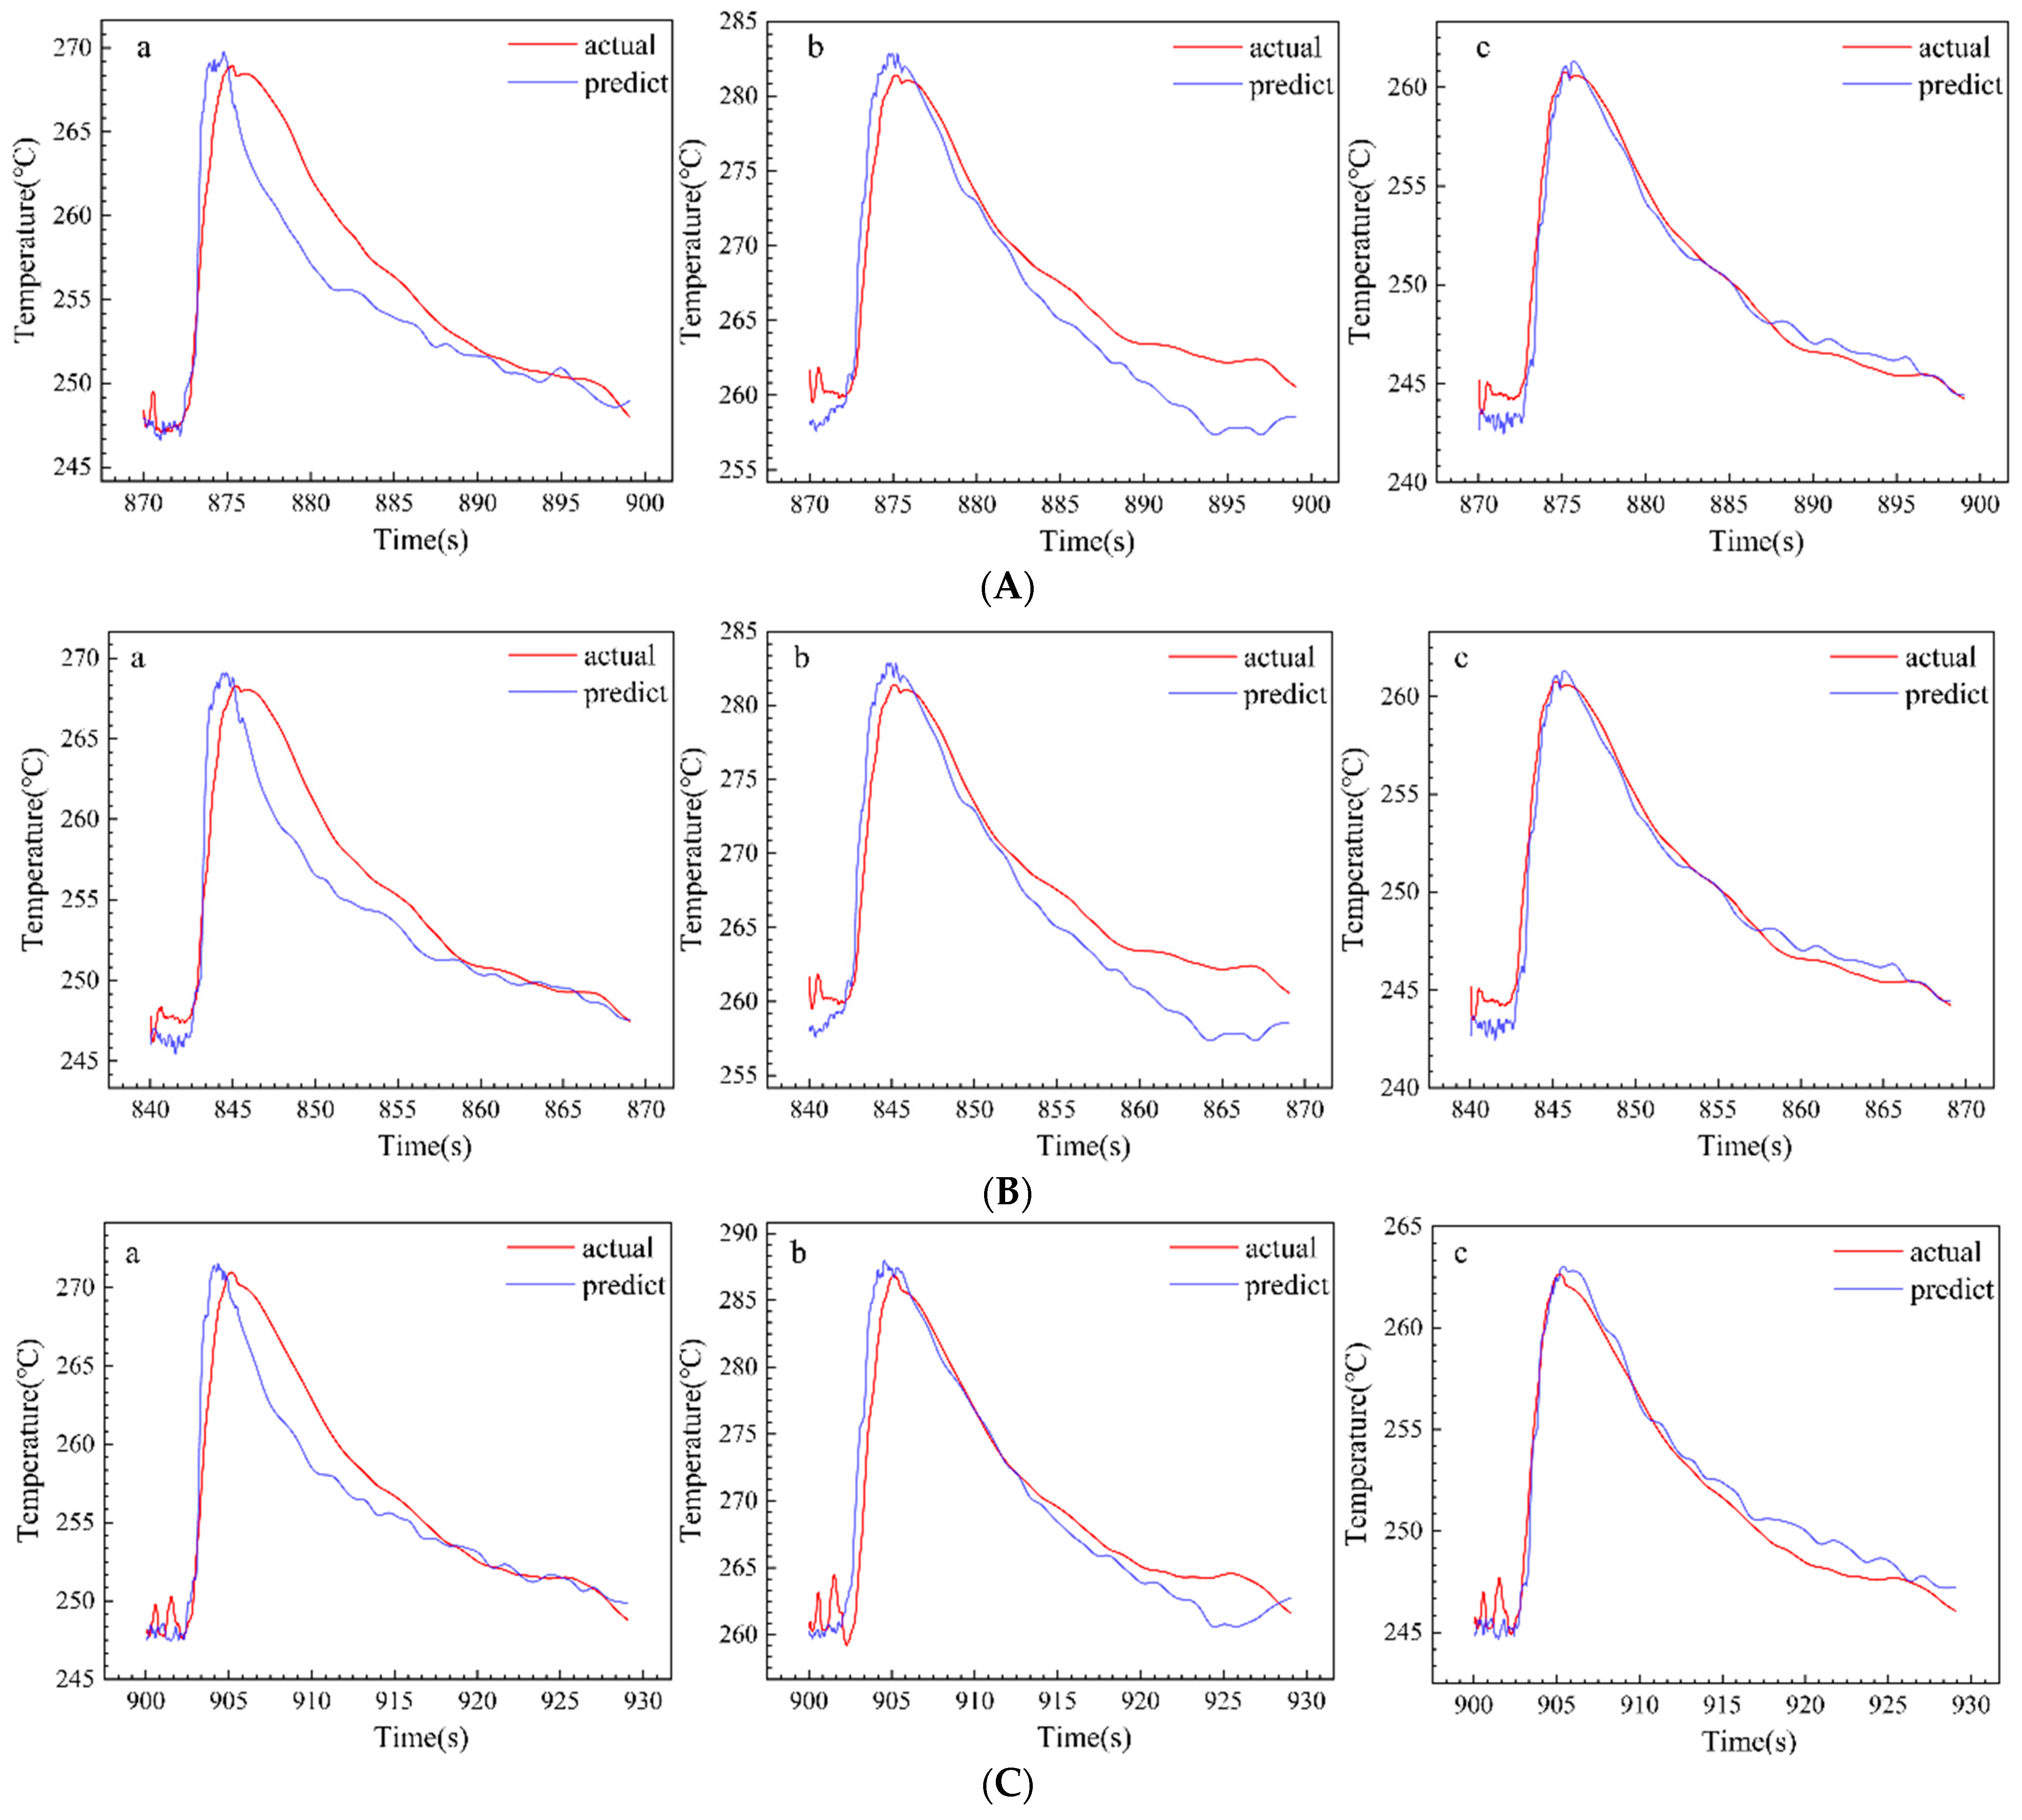
Figure 9.
Comparison of experimental values and predicted values at different time points of Fuda pressure plate: (A) 840–870 s; (B) 870–900 s; (C) 900–930 s.
According to Table 5 and Figure 9, the model predicts an R2 of approximately 0.90 over three cycles. The maximum error of 840–870 s is 8.4339 °C, the maximum error of 870–900 s is 7.3884 °C, and the maximum error of 900–930 s is 9.5811 °C. Overall, in the predicted 840–930 s, the maximum error of the three positions of the pressure plate is within 10 °C, which proves that the prediction method has a certain effectiveness.
Table 6 presents the specific index parameters of the platen at three different positions during various cycles (where one cycle lasts for 30 s). This section may be divided into subheadings. It should provide a concise and precise description of the experimental results, their interpretation, and the experimental conclusions that can be drawn.
Table 6.
The prediction indexes of Fuda clutch pressure plate.
Table 6 presents platen position a has a slightly lower prediction effect than the remaining two positions and has the largest Root Mean Squared Errors for 840–870 s, which are 7.55 °C, 3.88 °C, and 6.96 °C. However, platen position b has the largest error with a parameter of 9.58 °C, which is higher than that of platen positions b and c. The best effect is found in platen position c, which has the errors all within 5 °C, and it has MSE, RMSE, and MAE all below 1, and R2 is also close to 1.
3.2. Valeo Clutch Pressure Plate Temperature Prediction
The present study employs a novel Valeo clutch-based model for predicting the temperature of the clutch pressure plate. Initially, the pressure plate temperature from 840–870 s is used as the prediction target and predicted using the model. Subsequently, this predicted temperature is utilized as an input parameter to forecast the pressure plate temperatures for the consecutive periods of 870–900 s and 900–930 s. Finally, experiments were carried out on the platen to collect experimental data for the three time periods and analyzed for comparison. The comparison results are presented in Table 7. The temperature profiles at three different locations of the platen for 840–930 s are shown in Figure 10.
Table 7.
The total prediction index of Valeo clutch pressure plate.
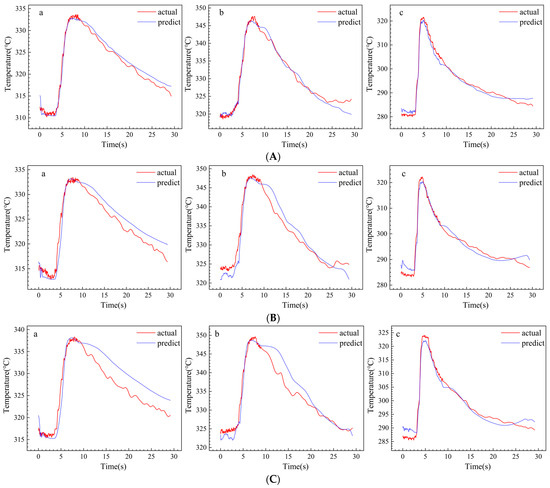
Figure 10.
Comparison of experimental values and predicted values at different time points of Valeo pressure plate: (A) 840–870 s; (B) 870–900 s; (C) 900–930 s.
From Table 7 and Figure 10, the model predicted R2 above 0.95 in all three cycles, with the maximum error at 840–870 s with a parameter of 6.92 °C and a maximum relative error of 2.08%. The average maximum error was 5.94. Analysis of the images reveals that the actual temperature drops at position b from 840–900 s and at positions a and b from 900–930 s and was faster than predicted after 6 s. The actual temperature drop at position b at 840–900 s and at positions a and b at 900–930 s was faster than predicted. The predicted errors for the three positions of the platen during the time interval of 840–930 s exhibit a high degree of consistency, with variations of less than 10 °C among them.
Table 8 shows the specific metrics for the three positions of the platen in different cycles (one cycle of 30 s).
Table 8.
The prediction indexes of Valeo clutch pressure plate.
Table 8 illustrates the prediction performance for different platen positions. The maximum error of a position in the time interval 900–930 s is 5.9712 °C, and the relative error is 1.82%. The maximum error of the b position in the time interval 870–900 s is 6.9208 °C, and the relative error is the largest among the three positions, which is 2.08%. The effect of the position c is the best, the maximum error is 4.8756 °C, and the relative error is 1.00%. According to these data, it can be shown that the method still has high accuracy for the temperature prediction of different clutch pressure plates, and the established model has strong generalization ability.
3.3. Results
In summary, although there are some errors in the temperature prediction of the two transfer learning models in the corresponding pressure plate 840–930 s, these errors are less than 10 °C, which meets the industrial requirements. This means that the clutch pressure plate temperature prediction method based on Bi-LSTM and transfer learning in this paper provides a high-precision and feasible solution for the temperature prediction of the clutch pressure plate. It overcomes the problem of insufficient adaptability to complex working conditions and the different types of pressure plates in traditional methods in the case of small samples and limited data.
4. Conclusions
During the operation of the clutch, especially in the process of continuous engagement and separation, the accurate temperature prediction of the pressure plate is very important to maintain the performance of the clutch. Although some temperature prediction methods have been used, the accuracy and high computational difficulty of these methods is still a concern, and these methods are difficult to adapt to complex situations under real working conditions, such as with a small number of samples. Aiming at the pressure plate temperature prediction problem during the continuous clutch engagement and separation process, this paper proposes a new method based on Bi-LSTM and migration learning. First, neural network modeling is performed on the existing pressure plate temperature data of 930 s (31 consecutive engagements), and the features of pressure plate temperature are extracted using the Bi-LSTM neural network to establish a clutch pressure plate temperature prediction model; following this, the ADDA algorithm based on feature migration learning is used to realize the migration of the temperature prediction model to the temperature prediction model for the same type of pressure plate and the different type of pressure plate and to obtain the temperature prediction migration model. Then, the migration learning was utilized to predict the temperature profile for the next three consecutive engagements and compared with the experimentally collected data. The comparison results show that the model-predicted values and the actual values are in better agreement, the maximum temperature deviation is less than 9 °C, and the maximum relative deviation is less than 3.5%.
In general, the proposed method can predict the temperature profile of the clutch pressure plate accurately in the case of small samples and limited data, which has important significance for the temperature control and the structural design of the clutch assembly and the similar fields.
Author Contributions
Conceptualization, D.C.; methodology, D.C.; software, D.C.; validation, D.C.; formal analysis, D.C. and Y.G.; investigation, D.C.; resources, D.C., B.X. and Y.G.; data curation, C.L.; writing—original draft preparation, D.C.; writing—review and editing, Y.G.; visualization, D.C.; supervision, D.C.; project administration, D.C.; funding acquisition, D.C. All authors have read and agreed to the published version of the manuscript.
Funding
National Natural Science Foundation of China: No. 51965012; Innovation Project of Guangxi Graduate Education: 2023YCXS006.
Institutional Review Board Statement
Not applicable.
Informed Consent Statement
Informed consent was obtained from all subjects involved in the study.
Data Availability Statement
Not applicable.
Acknowledgments
The authors gratefully acknowledge the financial support for this work from the National Natural Science Foundation of China (NSFC) (No. 51965012) and Innovation Project of Guangxi Graduate Education (2023YCXS006).
Conflicts of Interest
The authors declare no conflict of interest.
References
- Madhuraj, H.N.; Bharath, M.R. Modeling and simulation of clutch pressure plate casting using alternate materials. In AIP Conference Proceedings; AIP Publishing LLC: New York, NY, USA, 2018; Volume 1943, p. 020044. [Google Scholar]
- Lu, F.; Zhu, M.T.; Liu, X.L. Transient thermal analysis and the structure improvement of a clutch pressure plate. J. Transp. Sci. Eng. 2013, 2, 94–97. (In Chinese) [Google Scholar]
- Xu, X.K. Research on Clutch Failure of Minicar. Ph.D. Thesis, Wuhan University of Technology, Wuhan, China, 2008. (In Chinese). [Google Scholar]
- Gong, Y.; Ge, W.; Yi, Y.B. Finite element analysis of thermal buckling characteristics of automotive 430 dry clutch pressure plate. Int. J. Veh. Des. 2018, 78, 108–130. [Google Scholar] [CrossRef]
- Gong, Y.; Wang, P.; Ge, W.; Yi, Y.-B. Numerical Simulation and Mechanism Analysis on the Concave Deformation of Automotive Dry Clutch Pressure Plate. Appl. Sci. 2019, 9, 5017. [Google Scholar] [CrossRef]
- Hu, D.; He, M.; Zhao, Y. Thermal Stress Analysis of Tractor Clutch Pressure Plate. In Proceedings of the 2016 International Conference on Engineering Science and Management, Zhengzhou, China, 18–20 August 2016; Atlantis Press: Zhengzhou, China, 2016; pp. 272–276. [Google Scholar]
- Schneider, T.; Dietsch, M.; Voelkel, K.; Pflaum, H.; Stahl, K. Analysis of the Thermo-Mechanical Behavior of a Multi-Plate Clutch during Transient Operating Conditions Using the FE Method. Lubricants 2022, 10, 76. [Google Scholar] [CrossRef]
- Abdullah, O.I.; Schlattmann, J. Thermal behavior of friction clutch disc based on uniform pressure and uniform wear assumptions. Friction 2016, 4, 228–237. [Google Scholar]
- Wang, Y.; Liu, D.; Dong, H.; Lin, J.; Zhang, Q.; Zhang, X. Research on a BP Neural Network Slope Safety Coefficient Prediction Model Based on Improved Sparrow Algorithm Optimization. Appl. Sci. 2023, 13, 8446. [Google Scholar] [CrossRef]
- Chakrapani, G.; Sugumaran, V. Transfer learning-based fault diagnosis of automobile dry clutch system. Eng. Appl. Artif. Intell. 2023, 117, 105522. [Google Scholar] [CrossRef]
- Liu, W.J.; Wan, G.C.; Tong, M.S. A Hybrid Temporal Data Mining Method for Intelligent Train Braking Systems. IEEE Access 2022, 10, 28739–28749. [Google Scholar] [CrossRef]
- Kevin, V.V.; Abdel, R.; Matteo, G.; Peter, V.; Ann, N.; Julian, S.; Stijn, G.; Gregory, P.; Wim, S. Improving wet clutch engagement with reinforcement learning. In Proceedings of the 2012 International Joint Conference on Neural Networks (IJCNN), Brisbane, Australia, 10–15 June 2012; IEEE: New York, NY, USA, 2012; pp. 1–8. [Google Scholar]
- Xiaodong, J.; Shiming, D.; Chunhao, L.; Peter, R.; Jay, L. A Methodology for the Early Diagnosis of Vehicle Torque Converter Clutch Degradation. In Proceedings of the 2019 IEEE 15th International Conference on Automation Science and Engineering (CASE), Vancouver, BC, Canada, 22–26 August 2019; IEEE: New York, NY, USA, 2019; pp. 529–534. [Google Scholar]
- Zhu, B.; Feng, Y.; Gong, D.; Jiang, S.; Zhao, L.; Cui, N. Hybrid particle swarm optimization with extreme learning machine for daily reference evapotranspiration prediction from limited climatic data. Comput. Electron. Agric. 2020, 173, 105430. [Google Scholar] [CrossRef]
- Bellagarda, A.; Cesari, S.; Aliberti, A.; Ugliotti, F.; Bottaccioli, L.; Macii, E.; Patti, E. Effectiveness of neural networks and transfer learning for indoor air-temperature forecasting. Autom. Constr. 2022, 140, 104314. [Google Scholar] [CrossRef]
- Tian, S.; Ma, L.; Li, H.; Tian, F.; Mao, J. Research on a Coal Seam Gas Content Prediction Method Based on an Improved Extreme Learning Machine. Appl. Sci. 2023, 13, 8753. [Google Scholar] [CrossRef]
- Ma, Z.; Chen, Y.; Fan, Y.; He, X.; Luo, W.; Shu, J. An Improved AoT-DCGAN and T-CNN Hybrid Deep Learning Model for Intelligent Diagnosis of PTCs Quality under Small Sample Space. Appl. Sci. 2023, 13, 8699. [Google Scholar] [CrossRef]


Disclaimer/Publisher’s Note: The statements, opinions and data contained in all publications are solely those of the individual author(s) and contributor(s) and not of MDPI and/or the editor(s). MDPI and/or the editor(s) disclaim responsibility for any injury to people or property resulting from any ideas, methods, instructions or products referred to in the content. |
© 2023 by the authors. Licensee MDPI, Basel, Switzerland. This article is an open access article distributed under the terms and conditions of the Creative Commons Attribution (CC BY) license (https://creativecommons.org/licenses/by/4.0/).