Article

Damage Evolution in Quasi-Brittle Materials: Experimental Analysis by AE and Numerical Simulation

by
Boris Nahuel Rojo Tanzi
1,†,
Mario Sobczyk
1,†,
Ignacio Iturrioz
1,† and
Giuseppe Lacidogna
2,*,†
1
Department of Mechanical Engineering, Federal University of Rio Grande do Sul (UFRGS), Porto Alegre 90046-902, Brazil
2
Department of Structural, Geotechnical and Building Engineering, Politecnico di Torino, 10129 Turin, Italy
*
Author to whom correspondence should be addressed.
These authors contributed equally to this work.
Appl. Sci. 2023, 13(19), 10947; https://doi.org/10.3390/app131910947
Submission received: 18 July 2023 / Revised: 4 September 2023 / Accepted: 2 October 2023 / Published: 3 October 2023

Abstract

:
This work investigates the extension of a total-collapse prediction method to include local failures in quasi-brittle materials as they undergo damage processes. The analysis is experimentally conducted with acoustic emission data from a basalt specimen under a prescribed displacement loading test. The proposed failure index is compared with the well-established b-value to evaluate its usefulness; the simulation results are also used to further investigations. In particular, the simulations show that the parameter calculation can be carried out by indirectly estimating the elastic energy released within the system throughout the damage process, which cannot be measured directly. It is concluded that the proposed method is valid, consistently outperforming the b-value as a failure precursor throughout the experimental studies.

1. Introduction

Materials labeled as quasi-brittle are those where the rupture process is governed by the damage induced by their loading patterns. Such materials include concrete, rocks, and ceramic composites in high demand for technological applications, as discussed in ref. [1]. Understanding such a process is far from a solved issue, especially if its analysis is based on finite element methods (FEM), as verified in refs. [2,3,4]: even with the aid of homogenization techniques, success is limited to minimal damage ranges. For a detailed review of such methods, see refs. [5,6].
The limitations of traditional FEM techniques applied to such quasi-brittle materials stem from the latter’s inherently discontinuous nature, which include the effects of phenomena such as localization, interactions among micro-crack clusters, and scale dependency. Some techniques using FEM were successfully implemented to bypass the difficulties presented by the presence of discontinuous terms, such as the cohesive interface method [7] and the extended finite element method [8], where the discontinuities are embedded in the element’s interpolation functions. However, these types of approaches have led to the loss of information regarding the spasmodic growth of micro-fissures within the structure. Deep discussions on the topic can be found in refs. [5,6]. According to refs. [9,10,11,12], such processes define universal patterns when a given control parameter (CP) approaches a critical value, e.g., the temperature appearing as a typical CP for states of matter or magnetization properties. Within such a theoretical framework, the density in the state-of-matter could be considered as an example of an order parameter (OP) and their dependency on the associated CP is described as a power law function. The exponents of these functions close the eminence of the critical situation—that is, the change in state, the collapse, among other examples, could be calculated through the renormalization group methodology proposed by Wilson [13] and explained at an introductory level by [14].
On the other hand, experimental evaluation of failure processes rely extensively on the Acoustic Emission (AE) technique, which focuses on the elastic waves formed within a structure as it undergoes damage. With suitable sensors mounted on the structure’s surface, such waves are detected and interpreted as an indicator of a damage process, where damage extension translates into the amplitude and number of counts of detected wave signals. Moreover, the analysis of such signals leads to the calculation of several exponential parameters, with the so-called b-value appearing as the most popular one in refs. [15,16,17,18,19,20,21,22,23] as well as in works by other authors [24,25,26,27,28,29]. That exponent relates the statistical distribution of AE signals (N) and their corresponding magnitudes (A) through the power law A N b , which strongly resembles the relations between OP and CP in the phase transformations discussed in the previous paragraph. Such similarities also appear in Natural Time analyses [30], which also rely on finding parameters that reach a critical value as the structure approaches failure, as illustrated by [31,32,33,34,35]. There are other wave-based methods for monitoring the damage process in structures, as illustrated in refs. [36,37].
Here, we apply the method introduced by Dȩbski et al. [38], where the temporal derivative of the measured global elastic energy appeared as a precursor to failure time. While that metric was applied to the study of total collapse only, and the analysis was restricted to numeric results, we extended its use here as a precursor to local failures also, verifying its usefulness as a critical parameter in a broader sense. To that end, a basalt-made prismatic specimen was tested until its complete rupture. The specimen was built with a preformed oblique main crack, inducing the damage process to develop in a complex, mixed-mode pattern, with three critical regions with different rupture characteristics. AE data were collected throughout the test, leading to the computation of the corresponding b-value as a complementary measure of the evolving damage pattern, serving as a comparison reference for tracking the results by [38]. The specimen reflects the same structure employed in that work; however, the latter was restricted to simulation results, whereas this work also includes experimental data. The experiments are complemented with simulation results based on a version of the Discrete Element Method, leading to a comprehensive understanding of the damage process under study.
This work’s main features can be summarized as follows:
  • Research problem: to study the damage process of a prefissured basalt specimen through both simulation and experimental tests, collecting Acoustic Emission data to track damage development throughout the tests.
  • Objectives: (i) to investigate the usefulness of a new parameter proposed originally by Dȩbski et al. [38] as a precursor for local and complete failure in the structure undergoing damage; (ii) to illustrate the possibilities of LDEM to aid in the interpretation of experimental results.
  • Significance, Novelty, and Benefits: The index proposed by Dȩbski et al. [38], originally applied in numerical results only as a global failure precursor, is tested in our paper with an experimental approach, proposing an alternative measure of the elastic energy derivative during the test. Another novelty is related to the fact that this index is applied here not only to determine the global collapse but also to identify local failure regions with excellent performance. The behavior of this index as a failure precursor is compared with the b-value, which is a typical AE parameter. Moreover, in the present case, we observe that the benefit of proposing the index as a failure precursor could be another way to identify critical regions during the damage process to complement the analysis performed using AE signals.

2. The Lattice Discrete Element Method (LDEM)

This work’s numerical analysis uses the Lattice Discrete Element Method (LDEM), a version of the Discrete Element Method where solid bodies are modeled as nodal lumped masses interconnected by massless uniaxial elements, where such elements are only able to carry axial loads. Each node has three degrees of freedom, corresponding to the displacements in the three orthogonal coordinate directions. Nayfeh and Hefzy [39] determined the conditions for representing an orthotropic elastic continuum medium through this model, leading to a cubic cell with nine nodes (Figure 1a) that was adopted by Riera [40] to solve dynamic structural problems. For this geometric arrangement used herein, the lengths of longitudinal and diagonal elements are L n = L and L d = 3 L / 2 , respectively, with equivalent stiffnesses given by
E A n = E ϕ L 2 , E A d = A n 2 3 3 ,
where Young’s modulus is E, L is the length of longitudinal elements, and ϕ = ( 9 + 8 δ ) / ( 18 + 24 δ ) and δ = 9 ν / ( 4 8 ν ) are coefficients that relate those parameters to their corresponding linearly elastic solid properties, with ν representing Poisson’s coefficient. The LDEM model used herein is completely equivalent to an isotropic elastic solid when ν = 0.25 , as shown in the extensive examination by [41]. Assuming the internal material damping as a linear function of the nodal masses’ velocities, the solid’s spatial discretization yields N equations of motion in the well-known form
M u ¨ + C u ˙ + F r P = 0 ,
in which u represents the vector of generalized nodal displacements, where an upper dot denotes a temporal derivative; M is the diagonal mass matrix; C is the the damping matrix, assumed diagonal to generate an uncoupled system; F r comprises the internal forces acting on the nodal masses; and P is the vector of external forces.
The fracture analysis performed here adopts the softening law for quasi-fragile materials proposed by [42], which assumes the force–strain relation presented in Figure 1b for elements subjected to tension. In such a relation, the area under the force vs. strain curve (triangle OPB) is proportional to the energy density necessary to fracture the element’s area of influence, which allows one to account for the irreversible effects of crack nucleation and propagation throughout the modeled structure. Once the damage energy density reaches fracture level, the element fails and loses its load-carrying capacity. The material is assumed to be linearly elastic under compression, inducing failure to occur through indirect tension in such circumstances. The constitutive parameters and symbols appearing in the figure are defined as follows. The element’s axial force F depends on the axial strain ε , whereas A i is the element’s equivalent fracture area, defined to ensure that the energy dissipated by a fracture in the discrete arrangement matches that of the continuum medium it emulates. For a continuous cubic sample of dimensions L × L × L , the fracture energy due to a crack parallel to one of its faces is Γ = G f Λ = G f L 2 , in which Λ is the actual fractured area, i.e., L 2 . In the corresponding LDEM module with the same dimensions, fracture occurs in two parts, consisting of the contributions from five longitudinal elements (four coincident with the module edges and one internal element) and four diagonal ones. Finally, the strains ε p and ε r are related to another material parameter, the characteristic length d e q , by means of the following expressions:
ε p = G f E d e q ,
ε r = ε p d e q A i A i 2 L i ,
where the subindex i identifies the type of element referenced (diagonal or normal), whereas d e q is an upper limit for a given structure’s characteristic length: once that length becomes larger than d e q , the structure presents unstable fracture propagation. Such a length can be determined through the so-called Carpinteri number [43]
s = G f E d σ p ,
where d represents the characteristic length of the structure and σ p is the failure stress. As shown in [44], for the LDEM constitutive law, considering that σ p = E ε p , and combining Equations (3) and (5), one can write
s = d e q d .
In the LDEM, G f is a random parameter given by a Weibull probability distribution
p ( G f ) = 1 exp G f β γ
with β and γ denoting the scale and shape parameters, respectively. Such parameters are determined by the coefficient of variation C V G f , defined as the ratio between the standard deviation s ( G f ) and the mean value μ ( G f ) of the specific fracture energy G f related to the size L. The spatial correlation for G f is defined through the correlation lengths L c x , L c y , and L c z along with the directions x, y, and z, respectively. For a detailed explanation of these parameters and their application in the context of LDEM, refer to [45,46,47].
Since this work’s intended application presents relevant compression effects, the proposed LDEM model must be improved by inclusion of an internal-friction dissipation mechanism. To that end, the constitutive law given in Figure 1b is modified here, following the peridynamics considerations proposed by [48]. Such a modification relies on changing the failure strain to also take into account the compression level of the bars connected to the element under analysis. Then,
ε r = k r t ε p
where
k r t = max k r , k r β 1 n b c i = 1 n b c ε i ( ε i < 0 ) ε p .
In Equation (9), n b c represents the number of bars linked to the analyzed element under compression strain. The scalar parameter k r t rules the increase in dissipated energy due to internal friction, being activated when the analyzed element is solicited by traction and the bars connected to it are compressed. An exhaustive explanation of the Lattice Discrete Element Method (LDEM) used in the present paper and the complete deduction of Equations (1)–(9) appear in [40,44,46,47,49].

3. Acoustic Emission Technique

The Acoustic Emission (AE) technique relies on the generation of elastic waves due to crack formation within a structure. When those waves propagate throughout the structure and reach its surface, they are captured by appropriate sensors, generating signals that can be interpreted to map the spatial and temporal distribution of damage events. This technique is well established and has been widely debated over the last six decades, with [21,50,51] appearing as prominent examples, whereas several direct applications can be found in refs. [27,29,35,52,53,54,55]. The work by Richter is especially famous due to its wide application in the area of seismology.
As already pointed out in the introduction, successful application of the AE technique for analyzing structural damage is justified by the analogies between damage and phase transformation processes, which are solidly established in statistical physics arguments [14] and the renormalization group concept by [13]. However, searching for a “definitive” failure precursor remains an open issue because all indexes proposed to date may be inconclusive under some operational conditions. Within this context, this work investigates the proposal by [38] of using the temporal derivative of the system’s elastic energy as such a precursor, extending it to include the prediction of local failures and using the well-established b-value as a comparison reference. The main aspects of each of these precursors are presented in Section 3.1.

3.1. Global Parameters Computed from the AE Signal

This work uses two global indexes as failure precursors during a damage process:
(a)
Relation between the number of events and the signal amplitude (b-value): This relation is widely used in seismological applications, with the classic law by Gutenberg and Ritcher [50] being the primary example of its usefulness. It is mathematically expressed as
N ( A ) A b ,
where N is the cumulative number of signals and A is the signal amplitude. The physical meaning of b is discussed in refs. [21,56]; it is hypothetically related to the fractal dimension D of the domain from which the cracks emanate, according to the expression D = 2 b . At the beginning of a damage process within the structure, events originate from a micro-fissure of volumetric distribution, i.e., D = 3 and b = 1.5 , leading to small-amplitude signals. As damage progresses and localization effects occur, events emanate preferentially from the micro-fissure cloud, resulting in macro-crack nucleation.
The procedure for computing b is explained in detail [57] and summarized schematically in Figure 2. The amplitudes due to each event are collected and organized in a histogram. Then, a bi-log diagram relating the cumulative number N of events with amplitudes A is drawn. Finally, b is determined as the angular coefficient of the fitting line.
(b)
Temporal derivative of the system’s elastic energy: This criterion takes the local maxima of the system’s elastic energy variation rate (i.e., its time derivative) as a precursor. Given its original proposition by [38], it is referred to here as the Dȩbski–Pradhan–Hansen (DPH) parameter.

4. Case Study

The study focused on the prefissured specimen made from basalt and depicted in Figure 3. The study involved applying a compressive load to the structure until it collapsed, monitoring damage evolution through the two methods discussed in Section 3.1. The study was carried out in two ways: 1—experimentally; 2—numerically. It is worth noticing that this work’s main contribution lies in the extended applicability of the DPH index, proposed in ref. [38], which is characterized by the following features proposed here:
  • The original DPH index is the time derivative of the body’s internal elastic energy, which cannot be accessed through direct measurement. Therefore, the original index applies only as a theoretical analysis tool based on simulation data. Here, we use the product between the prescribed displacement and the corresponding reaction force perceived in the test machine as a proxy for the body’s internal elastic energy. As these two variables are readily available for measurement, this procedure also allows the use of the DPH index with experimental data.
  • The correspondence between the actual elastic within the structure and its proposed estimation counterpart is investigated through simulation results, confirming that the proposed proxy leads to equivalent conclusions.
  • Instead of predicting total collapse only, the DPH index is investigated as a valid precursor also to local failures.
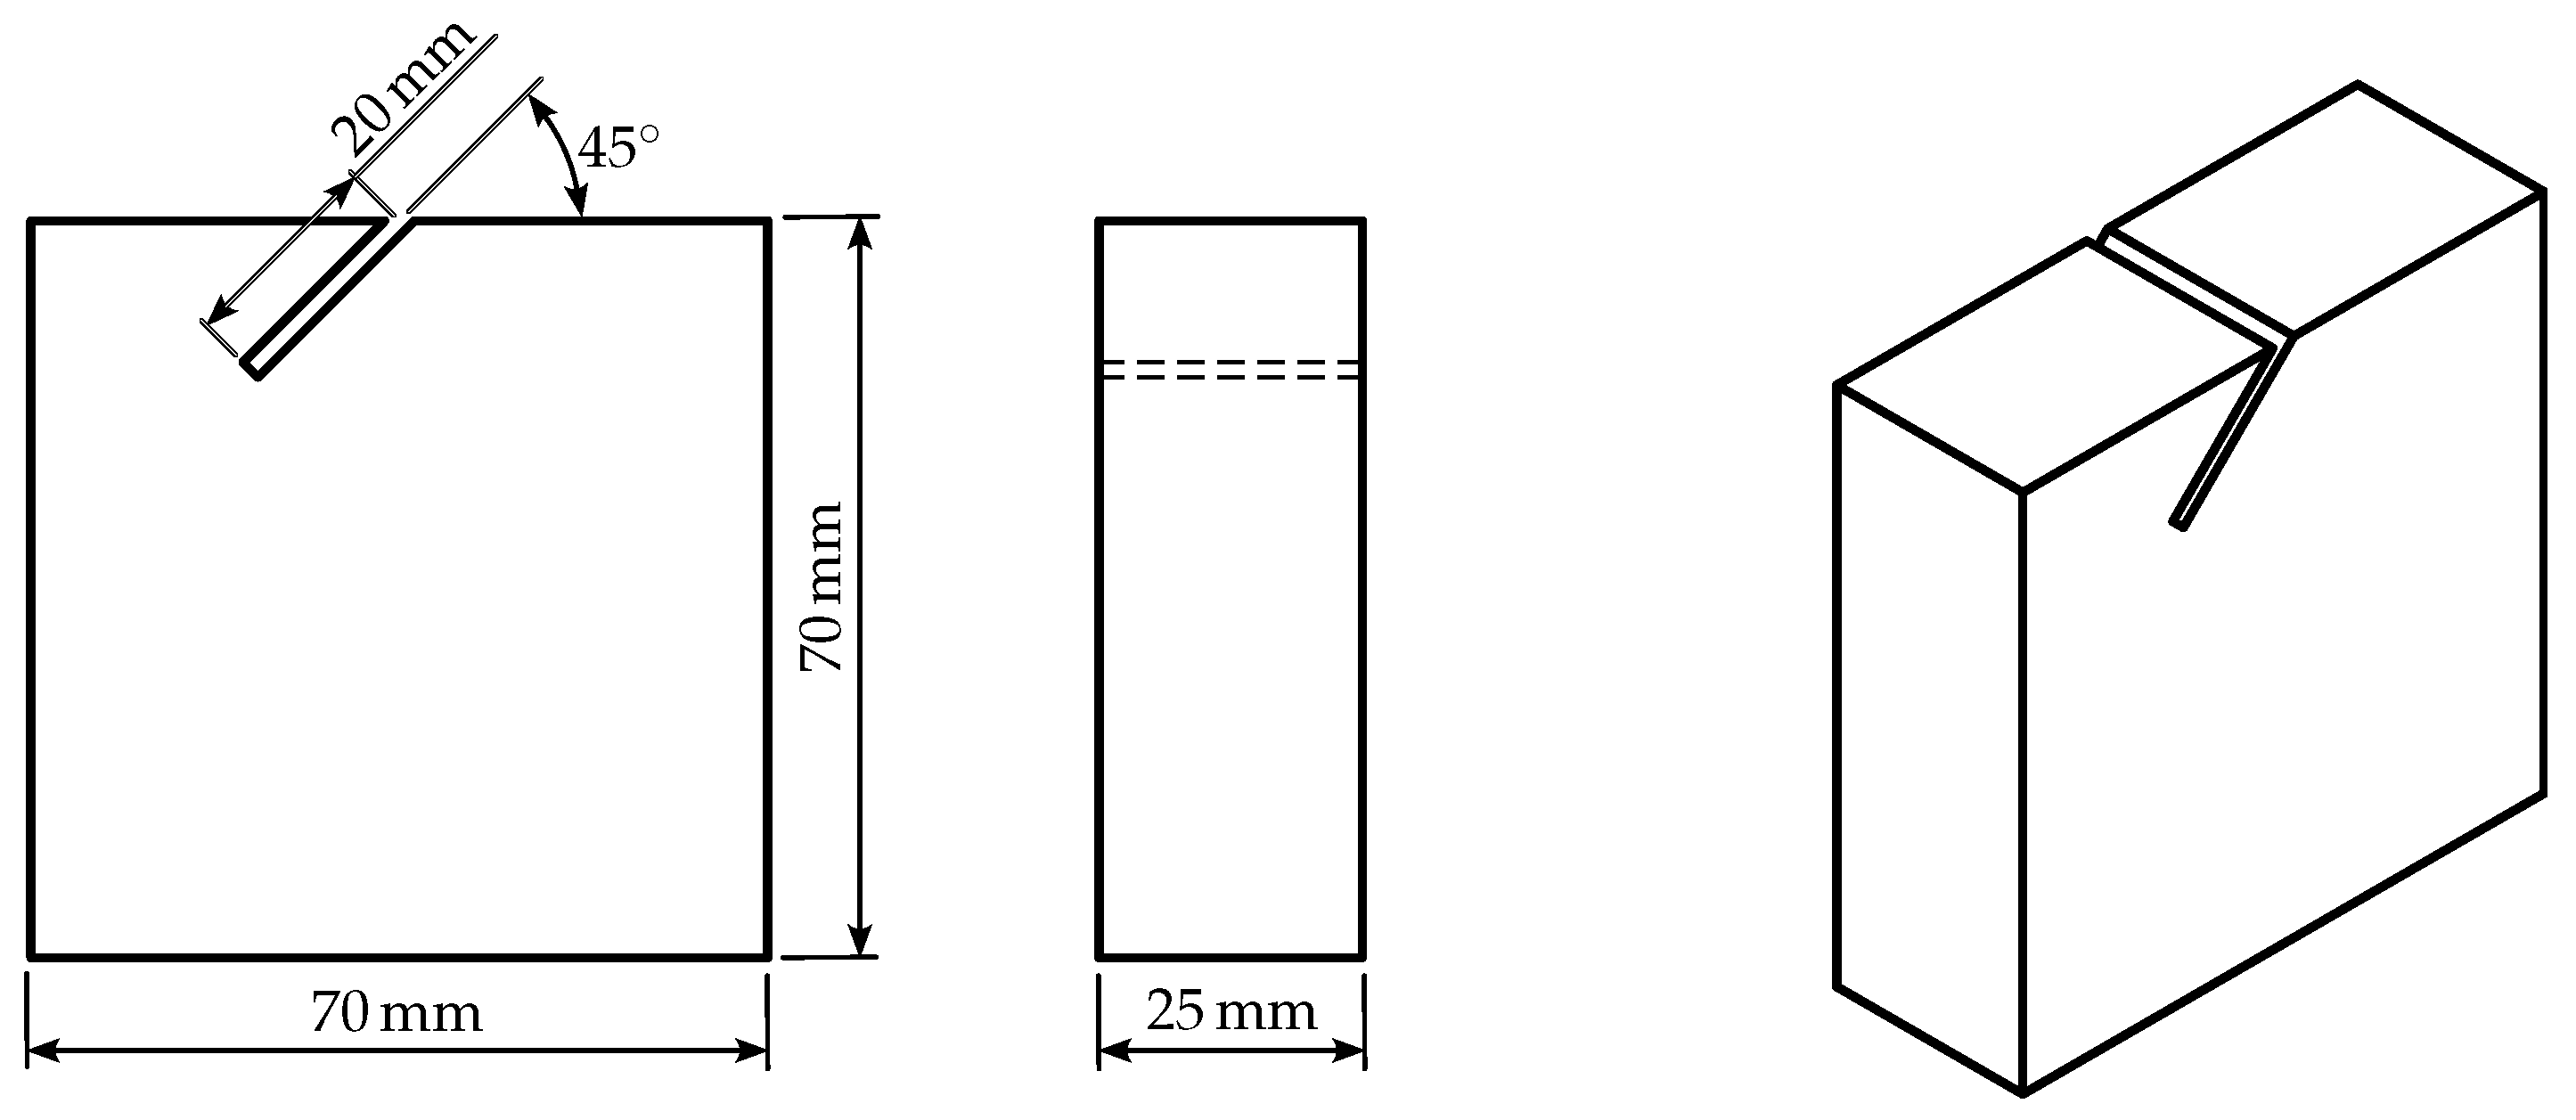
The implementation details for each part of the test are described in the following subsections.
Figure 3. The layout and main dimensions of the basalt specimen tested.
Applsci 13 10947 g003

4.1. Experiment Description

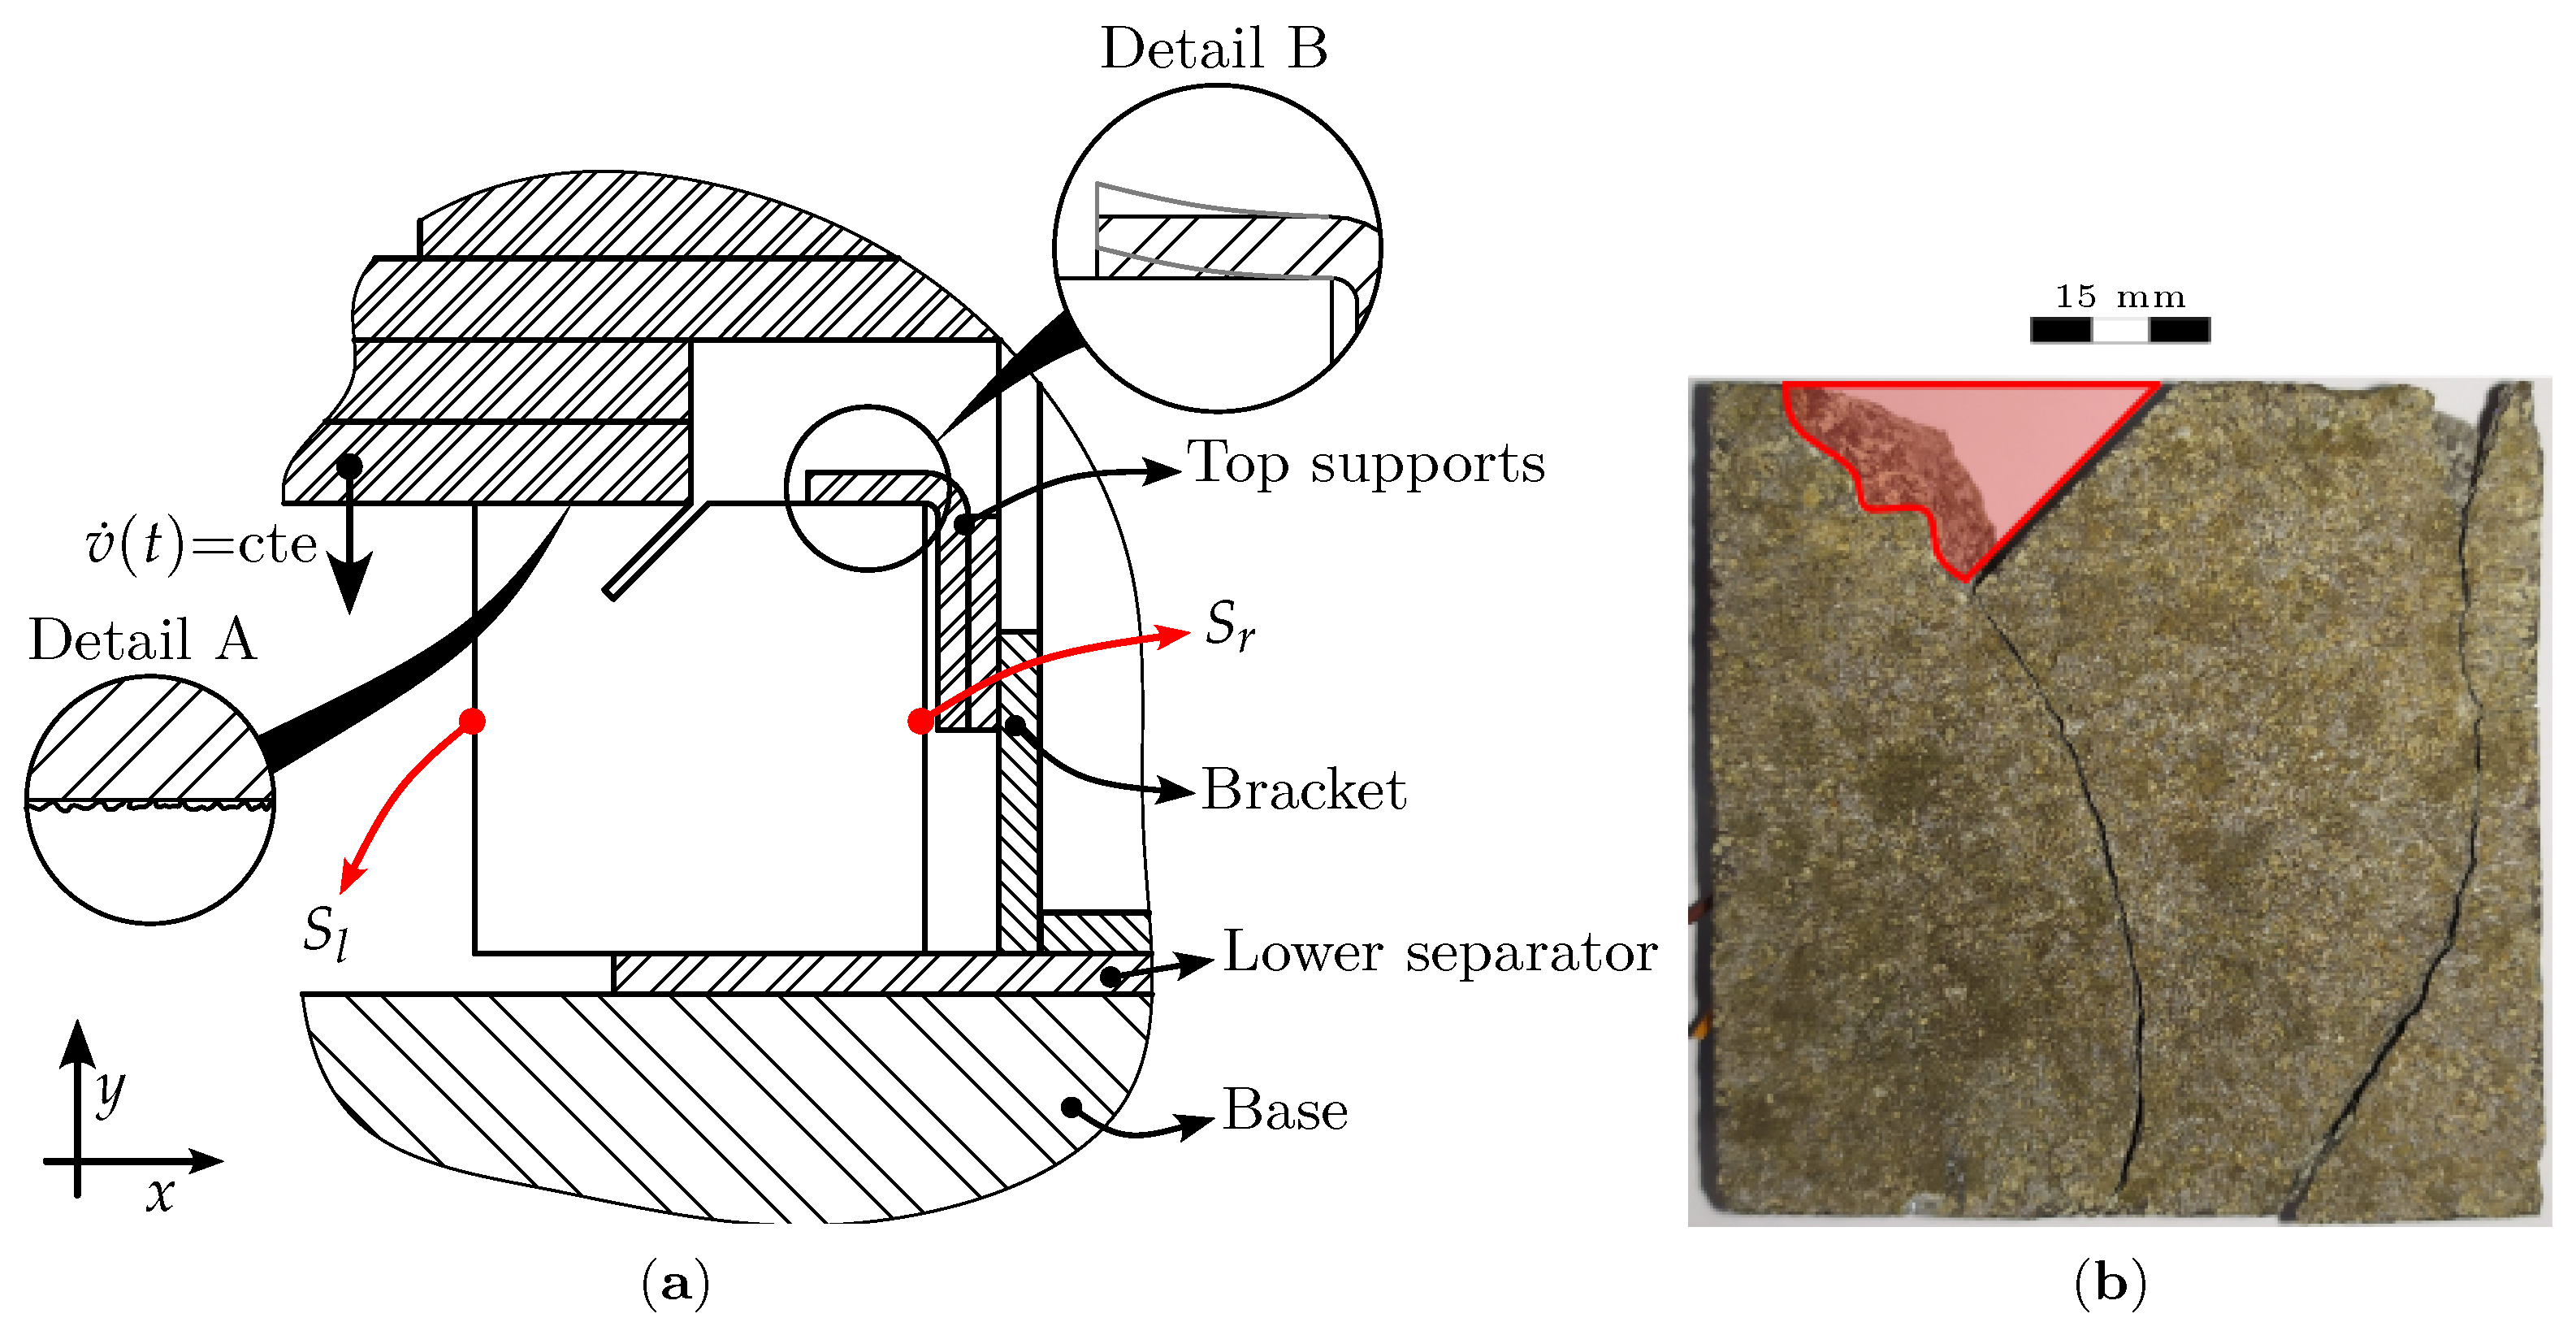
The specimen was subjected to a partial compression load according to the arrangement depicted in Figure 4a, in which the moving parts applied a prescribed displacement at a constant velocity of 0.6   m m / min through a Shimadzu AGX-PLUS universal testing machine. The testing machine features a proprietary data recording system to store displacement and applied load data at a 100 S / s acquisition rate [58]. Damage progression within the structure was monitored through AE measurements from two piezoelectric crystals on opposite sides of the specimen (see Figure 4b), with a resonance frequency of  1.5   M Hz . The collected signals were fed to an Omega® OM-USB data-acquisition set, with a 455  k S / s sampling rate and 12-bit resolution, during 290  s . The data were post-processed with a high-pass filter with a cutoff frequency of 10 k Hz , resulting in 1274 AE events, which will be analyzed in Section 4.3.
The body’s retention structure included one flexible support (Detail A), whereas the basaltic specimen’s surface was not finely polished (Detail B). These factors contributed to inducing an irregular damage pattern, with local failures of different types appearing throughout the structure during the process, as evidenced in the body’s final configuration (Figure 4b). The figure shows three distinct instability regions, with a major failure in the region where the prefissure was located: the section marked by the red triangular painting was totally crushed during the test. Such a boundary configuration is complicated to reproduce in the simulated model. However, as the main interest in the simulations was to compare the progression of the DPH and b-value parameters, not to pinpoint the specific crack distribution throughout the structure, such features were not deemed indispensable to the simulation model and were omitted.

4.2. Numerical Simulation

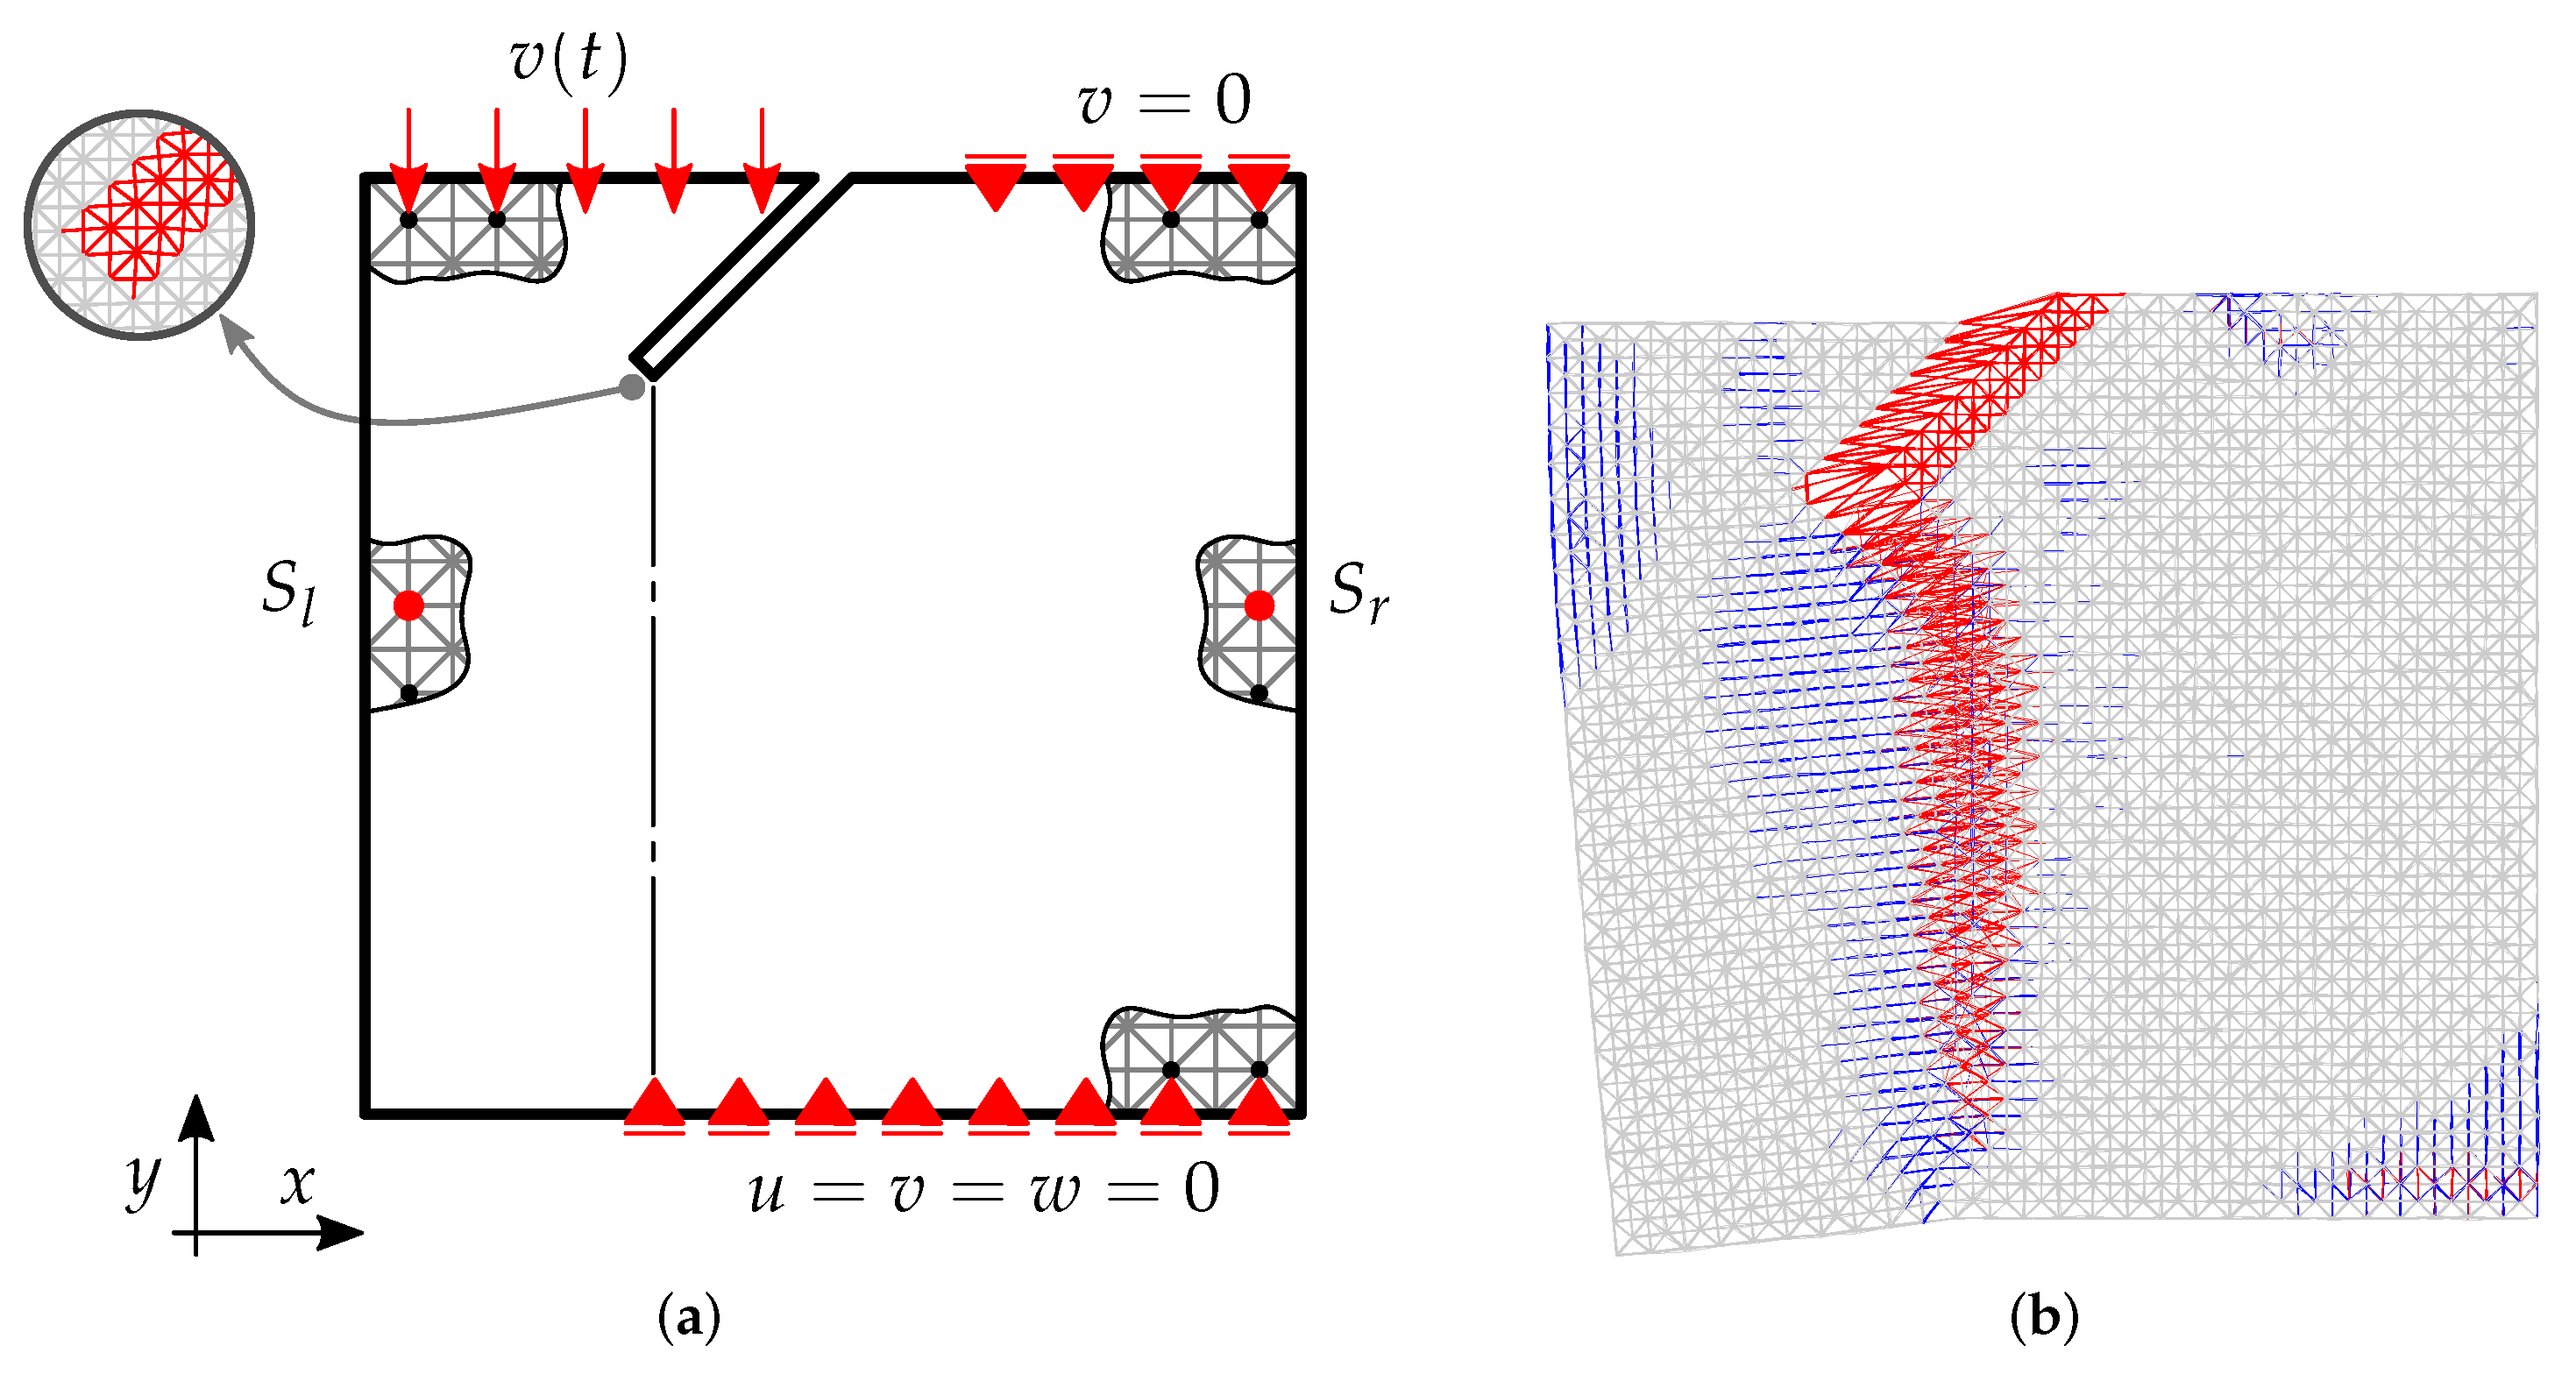
Simulations were performed with an LDEM model, which has been successfully used by the authors’ research group for analyzing quasi-brittle materials, as illustrated in refs. [24,41,44]. The boundary conditions appear in Figure 5a, whereas the model’s relevant material properties appear in Table 1. The values for E, σ p , ρ , and G f were adjusted to fit the experimental results presented in Figure 6. The adopted values for ρ and σ p were compatible with those given in ref. [59], while the one for G f was within the range specified in refs. [60,61], 700   N   m 1   to 1500   N   m 1 . As for E, the adopted value was lower than the range found in ref. [59] (E 1.25   G Pa ). However, references [60,61] show that basalt’s Young’s modulus is a greatly variable quantity.
As discussed in Section 2, the material’s characteristic length d e q was determined through the Carpinteri number s [43], assuming σ p   7.1   M Pa , yielding
s = G c E d 0.5 σ p = 1000 × 1.25 × 10 9 0.025 0.5 7.1 × 10 6 = 0.894 ,
thus, using Equation (6), d e q = s 2 d = 0.894 2 × 0.025 = 0.02   m .
The random field of material toughness is a Weibull distribution with a mean value μ ( G f )   = 1000   N / m , a 160% variation coefficient, and a spatial correlation length L c o r   = 20   m m for the three orthogonal directions. The apparently high value for C V G f is justified by its link to the variation of each bar. Thus, for the whole 15 bars for each cubic module, the equivalent variability reduces by 2.5 times, leading to C V ( G f ) bar/2.5 = 64%. The link between the random field variability in the level of the cubic module and in the level of each bar is discussed in [41]. As a reliable estimate for the random field’s correlation length still requires deeper studies regarding the rock’s material properties, following [62], this value was assumed equal to the characteristic length d e q .

4.3. Results

Experimental and numerical results appear together in Figure 6, which also includes photos from the actual test as well as the simulated damage configuration for instants of particular interest during the test (labeled as (a) to (e)). Loading declivities are similar for the first testing phases until the global displacement reaches approximately 1  m m . At that point, corresponding to the normalized instant t = 0.52 in Figure 7, the main fissure closes and the “triangle” on the specimen’s top contacts its “main body” underneath, leading to significant hardening effects in the experimental response. From that moment onward, simulation results cease to mimic the experiment in a reliable sense, as evidenced by the differences in the actual and simulated specimens’ final configurations (Figure 6c,f). Therefore, the behavior of both indexes as failure predictors are not expected to agree with those from the experiments and are included here only for the sake of completeness. Instead, the main usefulness in discussing the simulations lies in evaluating the proposed alternative method for calculating the DPH index, since the simulated response provides access to the system’s internal energy to compare with the simulated work applied by the testing machine.
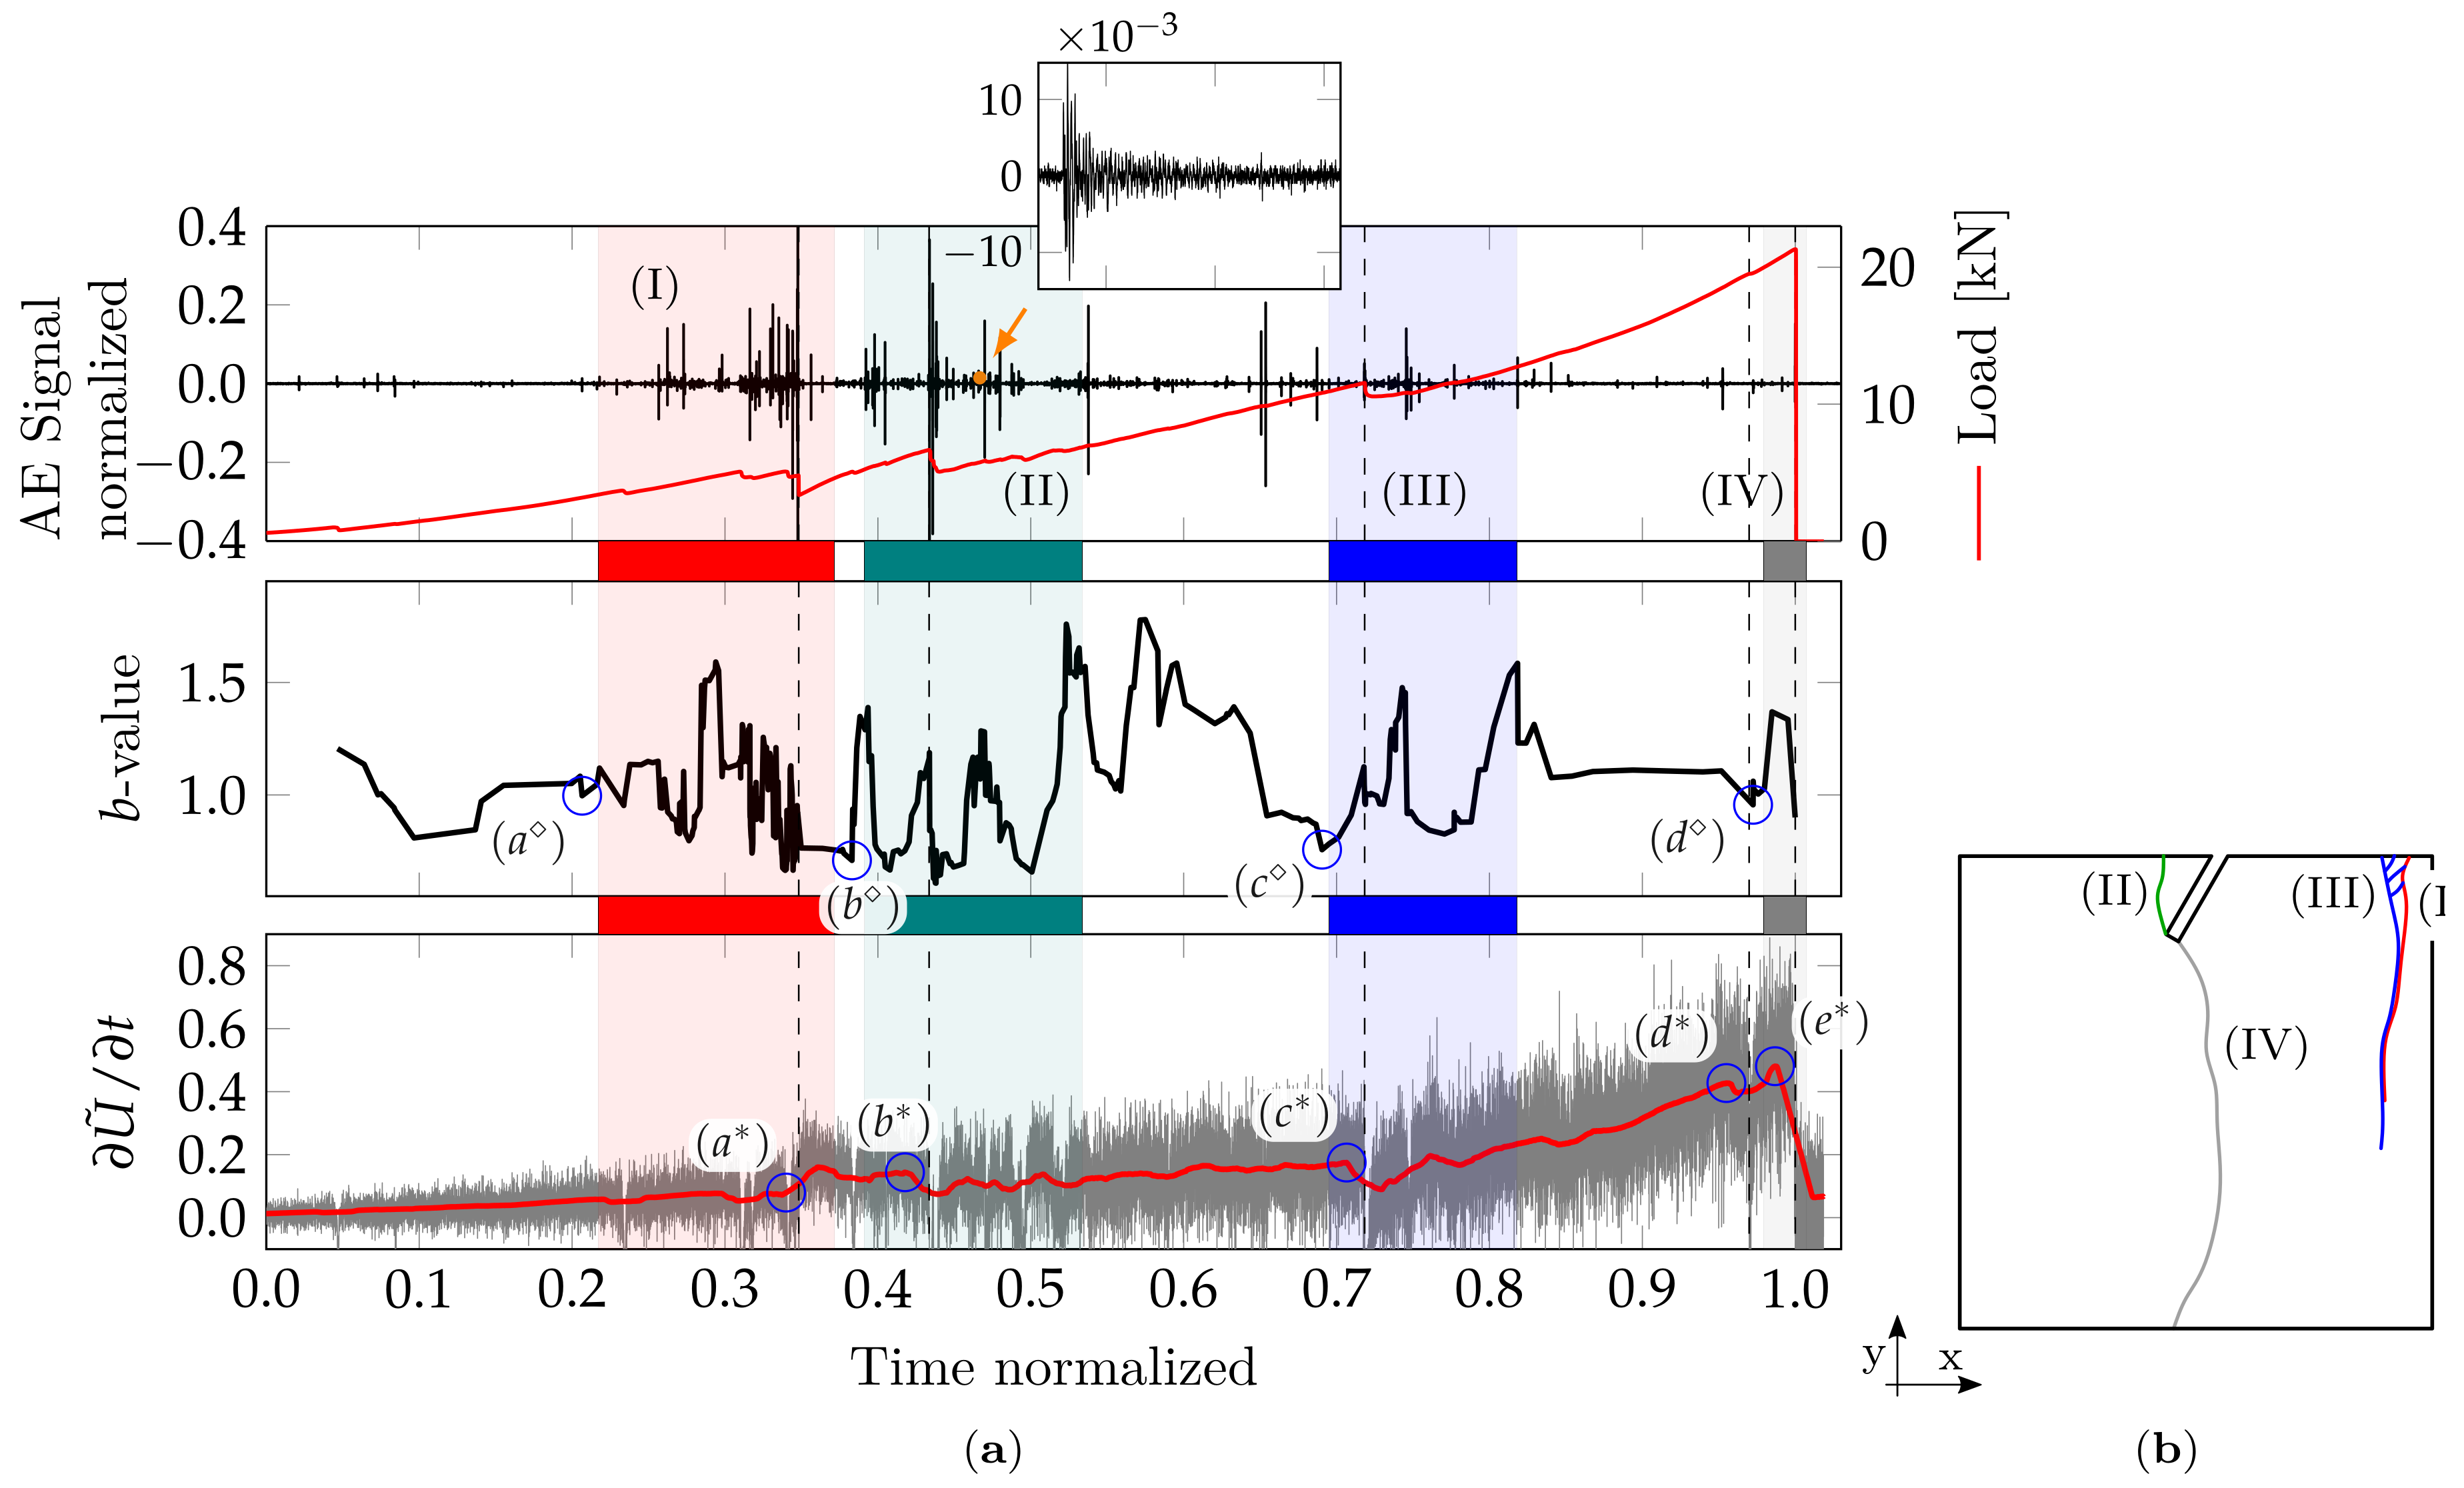
Figure 8 depicts the temporal evolution of the AE parameters calculated from the data collected during the experiment. The time scale is normalized with respect to the rupture time ( 216.49   s ). The graph on top illustrates the load evolution (red) accompanied by the AE measurements from sensor S l . Since the measurements from both sensors were very similar, only one data set was used in the remainder of the work. The second graph concerns the b-value parameter computed from the mentioned sensor’s signals using windows of 35 samples with three-sample overlaps. Finally, the bottom graph presents the evolution of the DPH parameter, inferred by taking the time derivative of the product between the applied displacement and the measured reaction forces on the specimen’s supports. The gray line indicates the computed values for each instant, whereas the red one corresponds to its filtered counterpart.
The three plots presented in Figure 8a (top, middle, and bottom) are divided into four different intervals by lightly colored shadows, identified as (I) red, (II) green, (III) blue, and (IV) gray, corresponding to each characteristic behavior identified visually during the test and registered as a video. Figure 7 and Figure 8b aid in the interpretation of the intervals, which are characterized as follows:
I
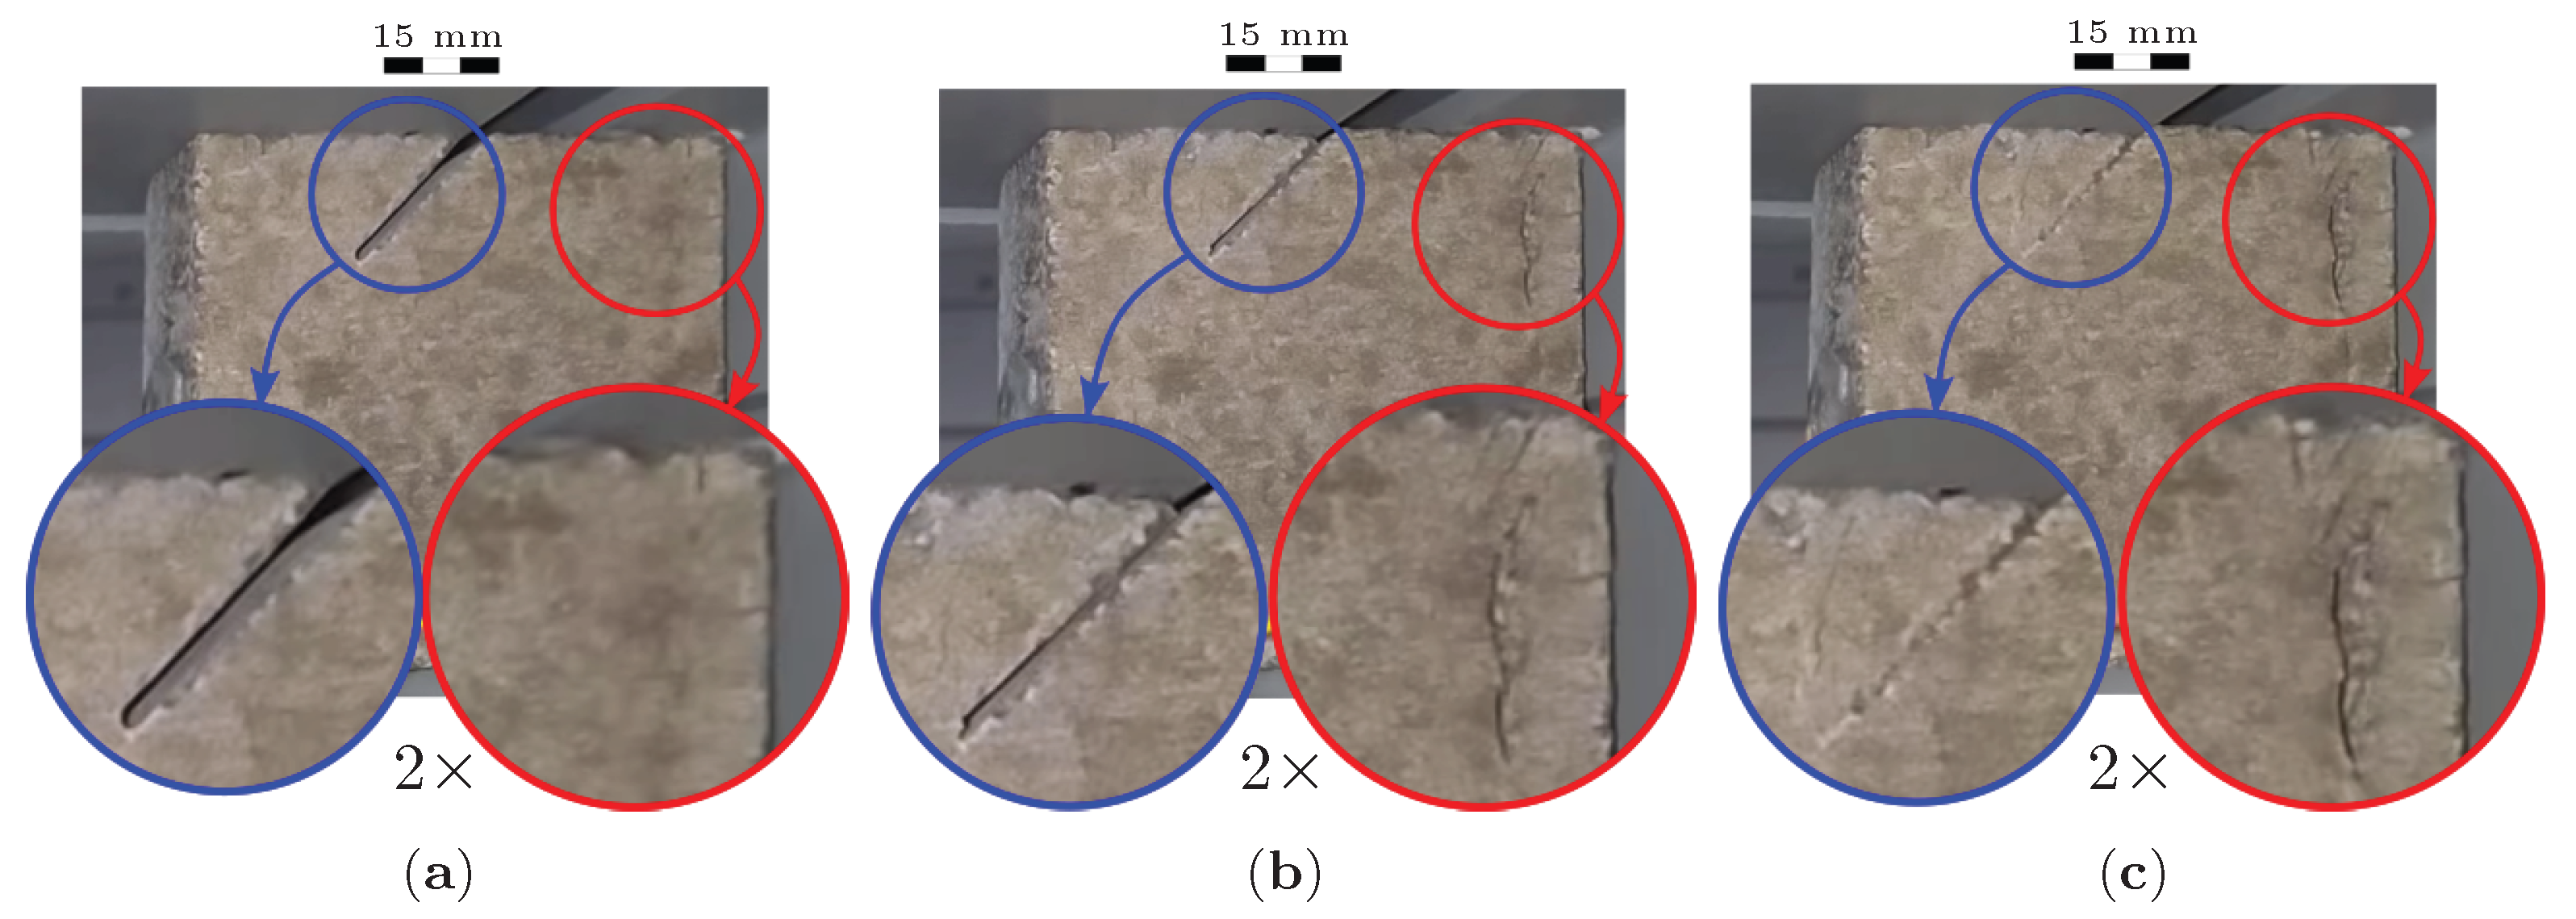
A localized vertical fissure develops in the superior right corner. Notice that no prefissure is discernible in that region until the normalized time approaches 0.3 (Figure 7a) but its appearance is anticipated by significant AE activity since t 0.25 .
II
The prefissure begins to close with visible damage in its supporting region, while the damage in the superior right corner continues to develop. At this interval’s end (normalized time = 0.52, displacement = 1  m m ), there is significant hardening in the load vs. global displacement response. The partial closing of the prefissure is confirmed by Figure 7b.
III
The diagonal prefissure is entirely closed while the damage continues to increase in the superior right corner (Figure 7c).
IV
A new fissure propagates from the head of the diagonal prefissure (Figure 6c and Figure 8b).
Figure 8a also features slashed lines marking the highest instability points within each region, i.e., when a sudden loading reduction signals the appearance of a significant crack. Completing the information provided in the figure, the most relevant points identified through the two parameters of interest appear as (a), (b), (c), and (d), where the “diamond” ( ( · ) ) marker indicates a b-value local minimum and the “asterisk” ( ( · ) ) refers to a sharp variation in the DPH index.
Figure 7. Evolution of damage in the experimental trial in three regions localized in Figure 8 in normalized time t. (a) Region (I), t: 0.290. (b) Region (II), t: 0.529. (c) Region (III), t: 0.818.
Applsci 13 10947 g007
Figure 8. (a) AE experimental results: top—the results of the temporal evolution of Load, Signal AE; middle—b-value evolution; bottom—DPH parameter evolution during the test. ( · ) and ( · ) instants of particular interest for the predictors b-value and DPH, respectively. (b) Visual representation of the damage process throughout the test.
Applsci 13 10947 g008
The evolution of the b-value appears in Figure 8a’s middle graph. This parameter acts as a failure precursor when a local minimum follows a “plateau” where its value is relatively stable. Notice that one such “plateau” occurs before each of the four main regions in the specimen behavior and that each of those “plateaus” is followed by one of the local minima marked as ( a ), ( b ), ( c ), and ( d ). However, none of those minima occur near the major instability points. Thus, the b-value appears as a reliable indicator of changes in the specimen’s overall behavior regions but it is not as effective for predicting the actual instability points.
The bottom graph in Figure 8a illustrates the evolution of the DPH index. This parameter was introduced in ref. [38], where its maximum overall value indicated a structure’s total collapse. Here, we investigate its usefulness to identify not only the final collapse but also the intermediate critical points as the damage process evolves. Notice that the DPH index presents a local maximum (( a ), ( b ), ( c ), ( d ), and ( e )) near each main instability point, including even the relatively minor one associated with point ( d ). Also, the final collapse is predicted by the overall maximum ( e ), which confirms the results presented in ref. [38]. To the best of the authors’ knowledge, this is the first instance of applying the DPH index as a local-failure predictor and the first time it is applied to experimental data. Notice that, close to the final collapse, the DPH index shows a maximum value; however, in this situation, there is no high activity in the AE signals, perhaps due to the shielding effect produced by the damage advance in the specimen region making it difficult for the AE signals activity to arrive to the sensor. This is a very good example where the DPH index could be a useful complement to the AE analysis. A different tendency between the two precursors could indicate the presence of a local effect that prevents the AE wave from arriving at the sensors used in the analysis. Notice also that in the same process in other local instabilities, the maxima of the DPH index and the b-value decreasing during the process both indicate the eminence of local critical regions.
The information in Figure 8a’s bottom graph is complemented by Table 2, relating the moments of critical instabilities ( t i ) with the times when the DPH index presented a local maximum ( t n ), including the ratio between those two values. Notice that this ratio presents small variability [0.96–0.99] and is close to 1.0, reinforcing the DPH index’s consistency as a failure predictor. This ratio’s stability is discussed in further detail in [38].
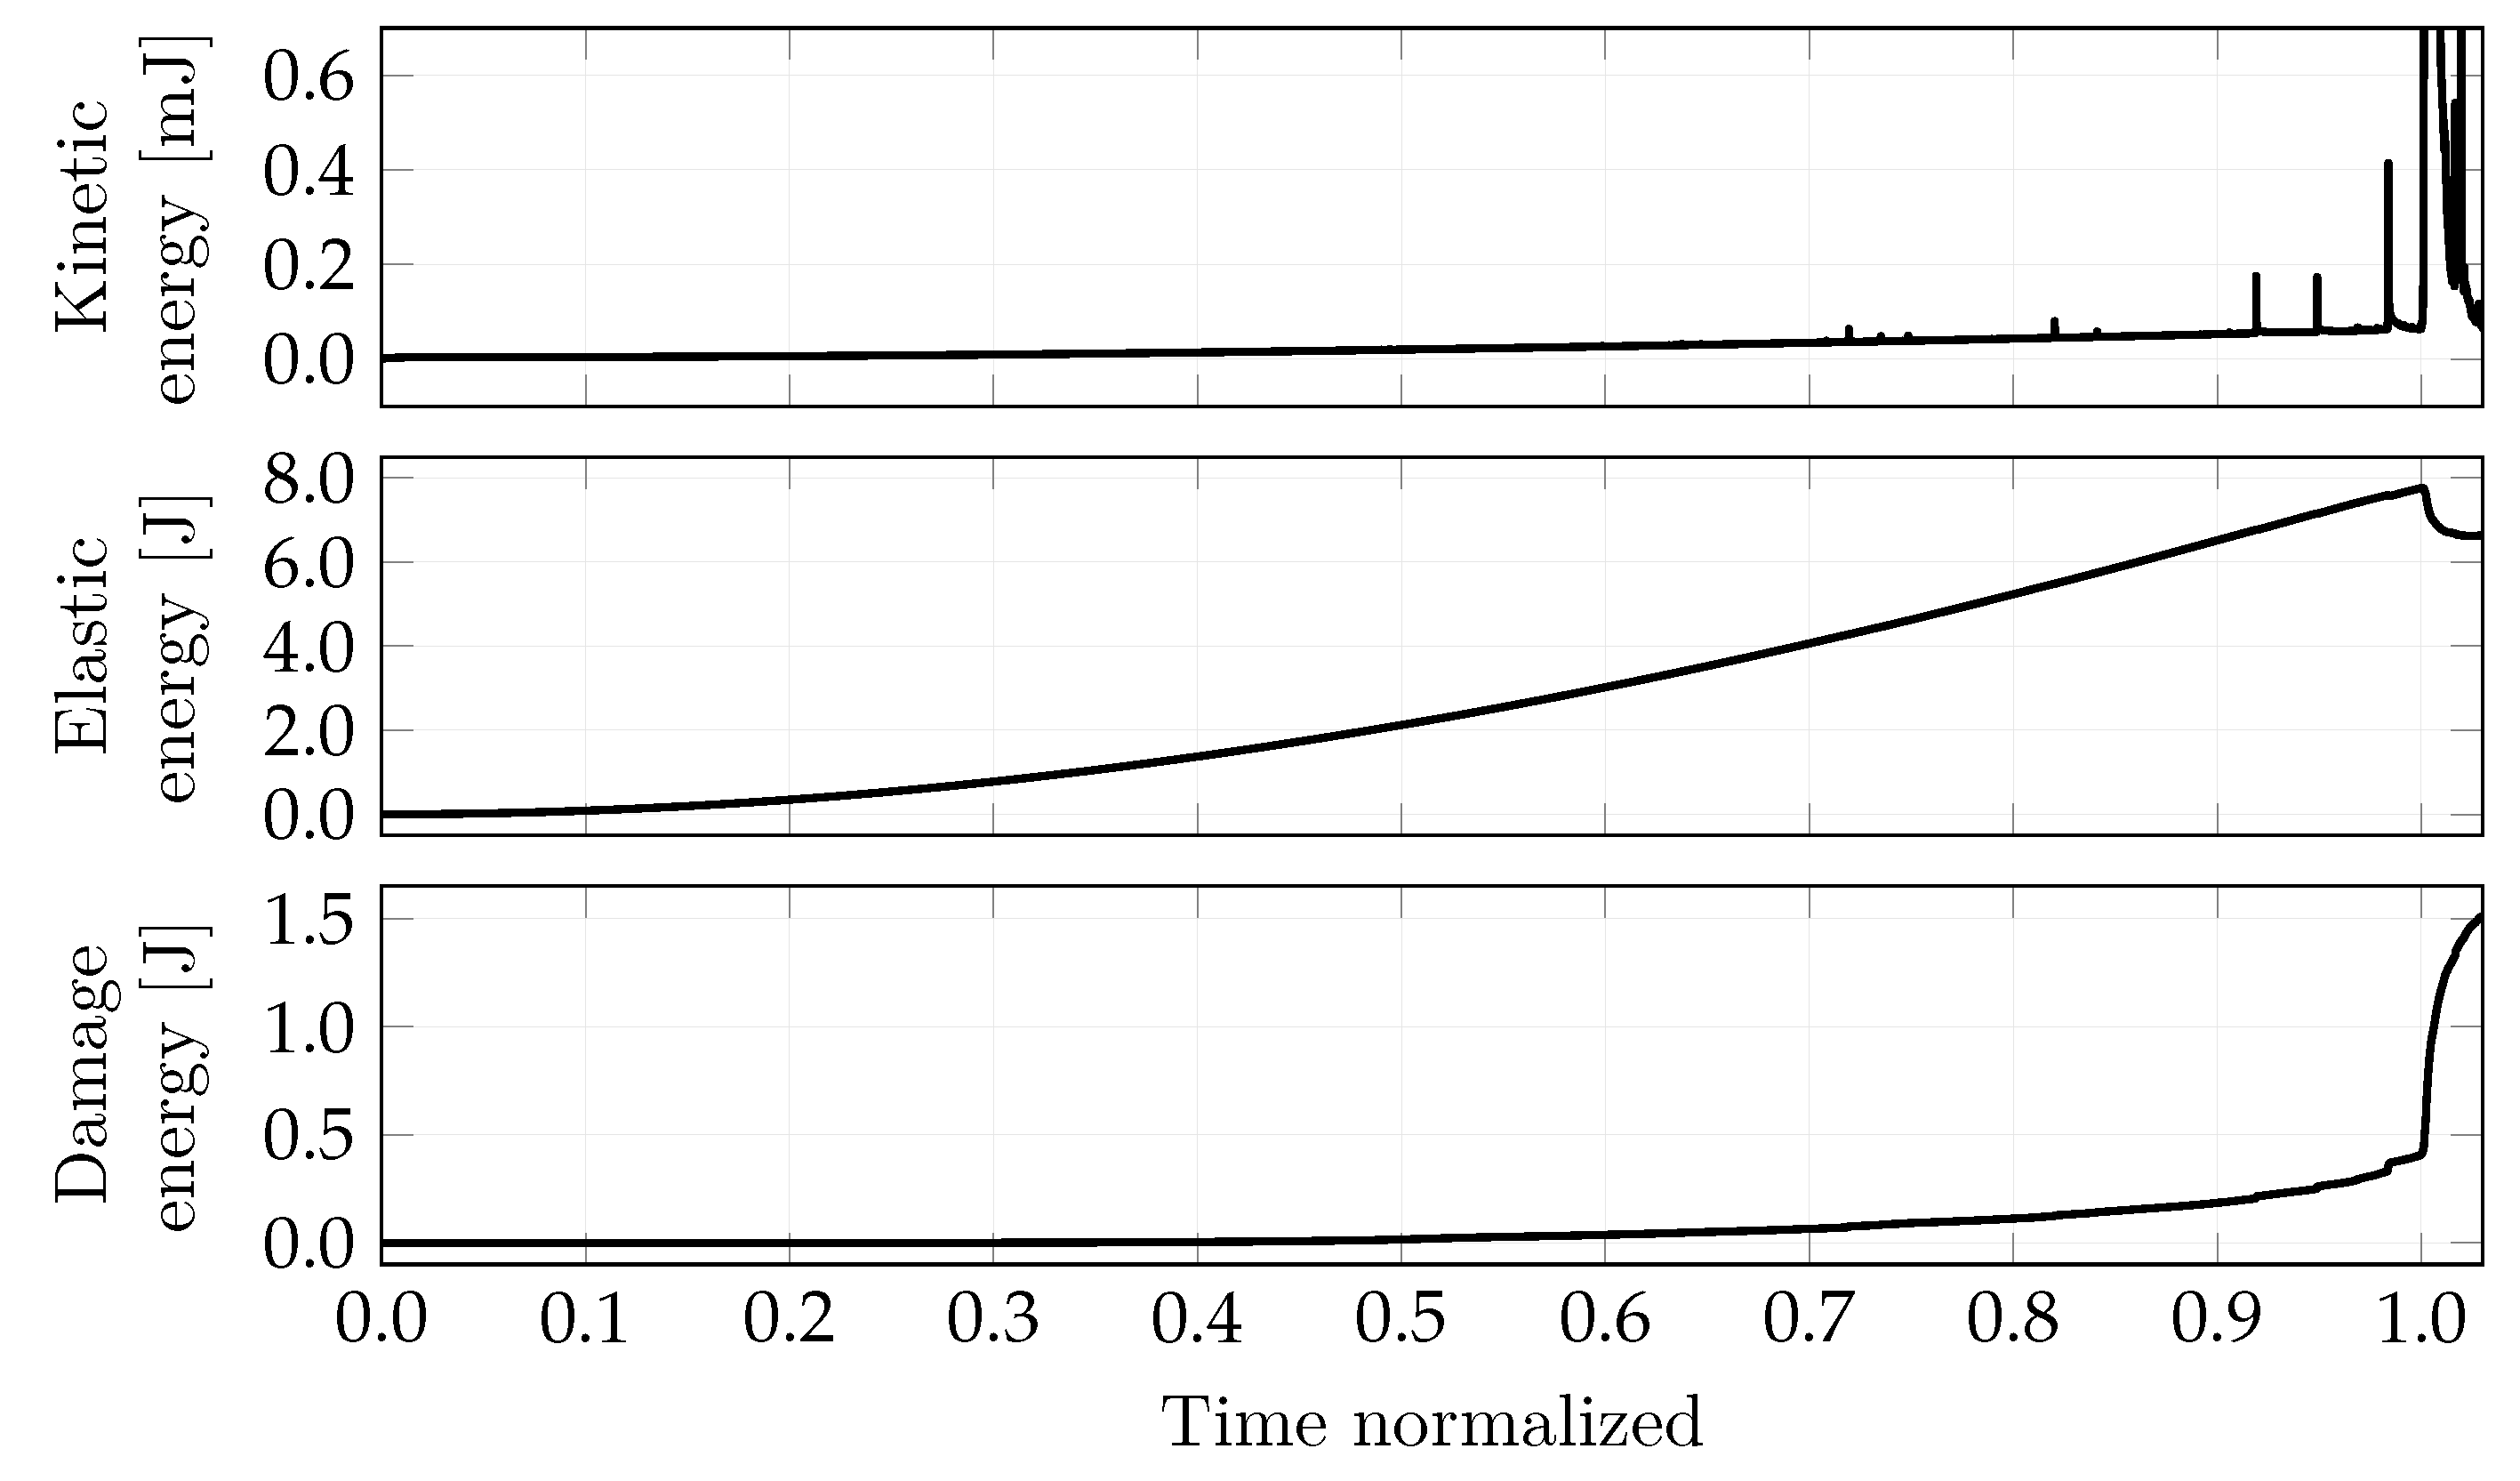
Simulation results are presented in Figure 9 and Figure 10 and summarized in Table 3. Although the damage process begins at normalized time = 0.25, its effect is negligible until t = 0.77. Figure 9 depicts the system’s energy balance with respect to normalized time. In that same figure, the peaks in the kinetic energy evolution coincide with the region of significant AE activity (see Figure 10), and the elastic energy maximum occurred at the same normalized time as the maximum load was reached.
Figure 10 illustrates the simulated applied load as a function of normalized time, with the corresponding AE signal from the virtual sensors. The b-value and DPH parameters are calculated analogously to the experimental data presented in Figure 8. However, two different metrics of elastic energy are used to extract the DPH parameter: the first is the elastic energy computed within the specimen (i.e., the “actual” energy involved in the process); the second relies on the product between the reaction support and the prescribed displacement, i.e., the same method used for estimating the elastic energy behavior for the analysis presented in Figure 8. The results indicate significantly fewer AE events throughout the simulated process in comparison with the experiment.
The two last graphs in Figure 10 concern the DPH parameter’s evolution, which was computed by two methods: with the “actual” elastic energy computed during the simulation (U) and with its estimated counterpart U ˜ , given by the product between the excitation displacement and the corresponding load applied by the mobile support to induce it. These results are summarized in Table 3. Since the simulated results did not indicate clear local failures before the total collapse, the usefulness of the DPH index as their predictor could not be confirmed through simulations. However, the indication of total collapse was confirmed with the indexes computed from both U and U ˜ (points a and a in Figure 10), which suggests the validity of the proposed estimation method for the elastic energy in an experimental setup.
Concluding this section, the experimental and simulated data observations can be summed up in three main points. First, the predictions from the DPH index were consistent with the developing damage pattern and the indication carried out for the b-value evolution during the experimental test. Since the b-value is a widely employed failure precursor with several successful application examples, this result alone cannot mean that the DPH is a consolidated precursor of local and global failures. On the other hand, since its supporting data are entirely independent from those used for calculating the b-value, the DPH can be treated as a complementary metric, leading to a more complete analysis of the damage process. Second, although the simulated results were not conclusive with respect to predicting the damage pattern from either the DPH or the b-value, they did confirm that the behavior of the actual elastic energy within the system (which is necessary to calculate the DPH index in its original form) can be successfully approximated through the product between the applied displacement and the reaction from the structure. Since the direct measurement of such energy within the structure is unattainable, the alternative method is of significant practical importance. Finally, the experimental results also confirmed the invariance of the ratio between the precursors and failure times indicated by the DPH index, a theoretical property introduced by the metric’s original proponents. To the best of the authors’ knowledge, this is the first experimental confirmation of such a property, which means it will require further confirmation in future works. If confirmed, however, such a result would imply that the DPH index is a powerful predictor of structural failure.

5. Conclusions

In the present work, we propose an extension of the DPH index to predict failure during damage processes in quasi-brittle materials. To the best of the authors’ knowledge, this is the first application example of that index with experimental data. The experiment-based analysis was also backed up by simulation results. The main conclusions from such an endeavor are as follows:
  • While the original version of the DPH index was used only as a predictor of total structural failure, our proposed alternative could also identify intermediate local failure events. Its performance as a failure predictor was consistent in comparison with the widely used b-value during the experimental test. However, this could be a peculiar characteristic of the test carried out in the paper, and before generalizing its advantages, the persistence of this tendency must be verified by new tests to verify the index performance in other representative specimens of different materials and dimensions.
  • Although the simulated results could not confirm the usefulness of the proposed DPH index conclusively, they showed that the behavior of the actual elastic energy within the system (which is necessary to calculate the original index) could be successfully approximated through the product between the applied displacement and the reaction from the structure. Since the direct measurement of such energy within the structure is unattainable, such an alternative method is of significant practical importance because it enables using a hitherto strictly theoretical tool in the experimental study of damage processes.
As a final remark, as the first application instance of the DPH index to an experimental setup as far as the authors are aware, this work’s findings still require further confirmation before its conclusiveness can be ascertained. Future work will concentrate on widening the proposed index’s application spectrum to other types of structures and damage processes to seek such confirmation.

Author Contributions

Conceptualization, B.N.R.T., I.I. and G.L.; methodology, B.N.R.T., I.I. and G.L.; software, B.N.R.T.; validation, B.N.R.T.; formal analysis, B.N.R.T. and I.I.; investigation, B.N.R.T., I.I. and M.S.; resources, I.I. and G.L.; data curation, I.I. and G.L.; writing—original draft preparation, B.N.R.T., M.S. and I.I.; writing—review and editing, B.N.R.T., M.S., I.I. and G.L.; visualization, B.N.R.T.; supervision, G.L. and I.I.; project administration, I.I.; funding acquisition, I.I. and G.L. All authors have read and agreed to the published version of the manuscript.

Funding

This research was funded by CNPq and CAPES (Brazil), and the sponsorship guaranteed with basic research funds was provided by Politecnico di Torino.

Institutional Review Board Statement

Not applicable.

Informed Consent Statement

Not applicable.

Data Availability Statement

Not applicable.

Acknowledgments

The authors acknowledge the financial support received from the Brazilian National Council for Scientific and Technological Development (CNPq, Brazil) and from the Coordination for the Improvement of Higher Education Personnel (CAPES-Brazil). The sponsorship guaranteed with basic research funds provided by Politecnico di Torino, Italy, for its financial aid in this work is also acknowledged.

Conflicts of Interest

The authors declare no conflict of interest.

Abbreviations

The following abbreviations are used in this manuscript:
AEAcoustic Emission
CMODCrack mouth opening displacement
CPControl parameter
FEMFinite Element Methods
LDEMLattice Discrete Element Method
OPOrder parameters

References

  1. Dhanasekar, S.; Ganesan, A.T.; Rani, T.L.; Vinjamuri, V.K.; Nageswara Rao, M.; Shankar, E.; Dharamvir; Kumar, P.S.; Misganaw Golie, W. A Comprehensive Study of Ceramic Matrix Composites for Space Applications. Adv. Mater. Sci. Eng. 2022, 2022, 6160591. [Google Scholar] [CrossRef]
  2. Kachanov, L.M. Introduction to Continuum Damage Mechanics. In Mechanics of Elastic Stability; Springer: Dordrecht, The Netherlands, 1986; Volume 10. [Google Scholar] [CrossRef]
  3. Krajcinovic, D. Damage Mechanics; Number 41 in North-Holland Series in Applied Mathematic and Mechanics; Elsevier: Amsterdam, The Netherlands; New York, NY, USA, 1996. [Google Scholar]
  4. Gross, D.; Seelig, T. Fracture Mechanics: With an Introduction to Micromechanics, 3rd ed.; Mechanical Engineering Series; Springer International Publishing: Berlin/Heidelberg, Germany, 2018. [Google Scholar] [CrossRef]
  5. Voyiadjis, G.Z.; Ahmed, B.; Park, T. A review of continuum damage and plasticity in concrete: Part II—Numerical framework. Int. J. Damage Mech. 2022, 31, 762–794. [Google Scholar] [CrossRef]
  6. Park, T.; Ahmed, B.; Voyiadjis, G.Z. A review of continuum damage and plasticity in concrete: Part I—Theoretical framework. Int. J. Damage Mech. 2022, 31, 901–954. [Google Scholar] [CrossRef]
  7. Needleman, A. A Continuum Model for Void Nucleation by Inclusion Debonding. J. Appl. Mech. 1987, 54, 525–531. [Google Scholar] [CrossRef]
  8. Belytschko, T.; Chen, H.; Xu, J.; Zi, G. Dynamic crack propagation based on loss of hyperbolicity and a new discontinuous enrichment. Int. J. Numer. Methods Eng. 2003, 58, 1873–1905. [Google Scholar] [CrossRef]
  9. Rundle, J.B.; Turcotte, D.L.; Shcherbakov, R.; Klein, W.; Sammis, C. Statistical physics approach to understanding the multiscale dynamics of earthquake fault systems: Statistical physics of Earthquakes. Rev. Geophys. 2003, 41. [Google Scholar] [CrossRef]
  10. Kawamura, H.; Hatano, T.; Kato, N.; Biswas, S.; Chakrabarti, B.K. Statistical Physics of Fracture, Friction and Earthquake. Rev. Mod. Phys. 2012, 84, 839–884. [Google Scholar] [CrossRef]
  11. Hansen, A.; Hemmer, P.C.; Pradhan, S. The Fiber Bundle Model: Modeling Failure in Materials; Statistical Physics of Fracture and Breakdown; Wiley-VCH Verlag GmbH & Co. KGaA: Weinheim, Germany, 2015. [Google Scholar]
  12. Biswas, S.; Ray, P.; Chakrabarti, B.K. Statistical Physics of Fracture, Breakdown, and Earthquake: Effects of Disorder and Heterogeneity; John Wiley & Sons: Weinheim, Germany, 2015. [Google Scholar]
  13. Wilson, K.G. Problems in Physics with many Scales of Length. Sci. Am. 1979, 241, 158–179. [Google Scholar] [CrossRef]
  14. Huang, K. Statistical Mechanics, 2nd ed.; Wiley: New York, NY, USA, 1987. [Google Scholar]
  15. Ohtsu, M. The history and development of acoustic emission in concrete engineering. Mag. Concr. Res. 1996, 48, 321–330. [Google Scholar] [CrossRef]
  16. Colombo, I.S.; Main, I.G.; Forde, M.C. Assessing Damage of Reinforced Concrete Beam Using “ B—Value” Analysis Acoustic Emission Signals. J. Mater. Civ. Eng. 2003, 15, 280–286. [Google Scholar] [CrossRef]
  17. Rao, M.V.M.S.; Lakshmi, K.J.P. Analysis of b-value and improved b-value of acoustic emissions accompanying rock fracture. Curr. Sci. 2005, 89, 1577–1582. [Google Scholar]
  18. Kurz, J.H.; Finck, F.; Grosse, C.U.; Reinhardt, H.W. Stress Drop and Stress Redistribution in Concrete Quantified Over Time by the b-value Analysis. Struct. Health Monit. 2006, 5, 69–81. [Google Scholar] [CrossRef]
  19. Carpinteri, A.; Lacidogna, G.; Niccolini, G. Critical Behaviour in Concrete Structures and Damage Localization by Acoustic Emission. Key Eng. Mater. 2006, 312, 305–310. [Google Scholar] [CrossRef]
  20. Carpinteri, A.; Lacidogna, G.; Niccolini, G.; Puzzi, S. Critical defect size distributions in concrete structures detected by the acoustic emission technique. Meccanica 2008, 43, 349–363. [Google Scholar] [CrossRef]
  21. Carpinteri, A.; Lacidogna, G.; Puzzi, S. From criticality to final collapse: Evolution of the “b-value” from 1.5 to 1.0. Chaos Solitons Fractals 2009, 41, 843–853. [Google Scholar] [CrossRef]
  22. Carpinteri, A.; Lacidogna, G.; Niccolini, G. Fractal analysis of damage detected in concrete structural elements under loading. Chaos Solitons Fractals 2009, 42, 2047–2056. [Google Scholar] [CrossRef]
  23. Carpinteri, A.; Lacidogna, G.; Niccolini, G.; Puzzi, S. Morphological Fractal Dimension Versus Power-Law Exponent in the Scaling of Damaged Media. Int. J. Damage Mech. 2009, 18, 259–282. [Google Scholar] [CrossRef]
  24. Iturrioz, I.; Lacidogna, G.; Carpinteri, A. Experimental Analysis and Truss-Like Discrete Element Model Simulation of Concrete Specimens Under Uniaxial Compression. Eng. Fract. Mech. 2013, 110, 81–98. [Google Scholar] [CrossRef]
  25. Iturrioz, I.; Lacidogna, G.; Carpinteri, A. Acoustic emission detection in concrete specimens: Experimental analysis and lattice model simulations. Int. J. Damage Mech. 2014, 23, 327–358. [Google Scholar] [CrossRef]
  26. Birck, G.; Iturrioz, I.; Lacidogna, G.; Carpinteri, A. Damage process in heterogeneous materials analyzed by a lattice model simulation. Eng. Fail. Anal. 2016, 70, 157–176. [Google Scholar] [CrossRef]
  27. Rojo Tanzi, B.N.; Sobczyk, M.; Becker, T.; Segovia González, L.A.; Vantadori, S.; Iturrioz, I.; Lacidogna, G. Damage Evolution Analysis in a “Spaghetti” Bridge Model Using the Acoustic Emission Technique. Appl. Sci. 2021, 11, 2718. [Google Scholar] [CrossRef]
  28. Rojo Tanzi, B.N.; de Abreu Cáceres, G.; Echer, L.; Iturrioz, I.; Lacidogna, G. The damage evolution in specimens made with quasi-brittle materials: Experimental verification using Acoustic Emission technics. In Proceedings of the 26th International Acoustic Emission Symposium, Kawasaki, Japan, 31 October–2 November 2022; pp. 1–6. [Google Scholar]
  29. Rojo Tanzi, B.N.; Birck, G.; Sobczyk, M.; Iturrioz, I.; Lacidogna, G. Truss-like Discrete Element Method Applied to Damage Process Simulation in Quasi-Brittle Materials. Appl. Sci. 2023, 13, 5119. [Google Scholar] [CrossRef]
  30. Varotsos, P.A.; Sarlis, N.V.; Skordas, E.S. Natural Time Analysis: The New View of Time; Springer: Berlin/Heidelberg, Germany, 2011. [Google Scholar] [CrossRef]
  31. Potirakis, S.; Mastrogiannis, D. Critical features revealed in acoustic and electromagnetic emissions during fracture experiments on LiF. Phys. A Stat. Mech. Its Appl. 2017, 485, 11–22. [Google Scholar] [CrossRef]
  32. Niccolini, G.; Lacidogna, G.; Carpinteri, A. Fracture precursors in a working girder crane: AE natural-time and b-value time series analyses. Eng. Fract. Mech. 2019, 210, 393–399. [Google Scholar] [CrossRef]
  33. Niccolini, G.; Potirakis, S.M.; Lacidogna, G.; Borla, O. Criticality Hidden in Acoustic Emissions and in Changing Electrical Resistance during Fracture of Rocks and Cement-Based Materials. Materials 2020, 13, 5608. [Google Scholar] [CrossRef] [PubMed]
  34. Ferreira Friedrich, L.; Cezar, E.S.; Colpo, A.B.; Rojo Tanzi, B.N.; Sobczyk, M.; Lacidogna, G.; Niccolini, G.; Kosteski, L.E.; Iturrioz, I. Long-Range Correlations and Natural Time Series Analyses from Acoustic Emission Signals. Appl. Sci. 2022, 12, 1980. [Google Scholar] [CrossRef]
  35. Ferreira Friedrich, L.; Rojo Tanzi, B.N.; Colpo, A.B.; Sobczyk, M.; Lacidogna, G.; Niccolini, G.; Iturrioz, I. Analysis of Acoustic Emission Activity during Progressive Failure in Heterogeneous Materials: Experimental and Numerical Investigation. Appl. Sci. 2022, 12, 3918. [Google Scholar] [CrossRef]
  36. Mostafaei, H.; Ghamami, M.; Aghabozorgi, P. Modal identification of concrete arch dam by fully automated operational modal identification. Structures 2021, 32, 228–236. [Google Scholar] [CrossRef]
  37. Mostafaei, H.; Mostofinejad, D.; Ghamami, M.; Wu, C. A new approach of ensemble learning in fully automated identification of structural modal parameters of concrete gravity dams: A case study of the Koyna dam. Structures 2023, 50, 255–271. [Google Scholar] [CrossRef]
  38. Dȩbski, W.; Pradhan, S.; Hansen, A. Criterion for Imminent Failure During Loading—Discrete Element Method Analysis. Front. Phys. 2021, 9, 675309. [Google Scholar] [CrossRef]
  39. Nayfeh, A.H.; Hefzy, M.S. Continuum modeling of three-dimensional truss-like space structures. AIAA J. 1978, 16, 779–787. [Google Scholar] [CrossRef]
  40. Riera, J.D. Local effects in impact problems on concrete structures. In Proceedings of the Conference on Structural Analysis and Design of Nuclear Power Plants, Porto Alegre, RS, Brasil, 3–5 October 1984; pp. 57–79. [Google Scholar]
  41. Kosteski, L.; Barrios D’Ambra, R.; Iturrioz, I. Crack propagation in elastic solids using the truss-like discrete element method. Int. J. Fract. 2012, 174, 139–161. [Google Scholar] [CrossRef]
  42. Hillerborg, A. A Model for Fracture Analysis; Report TVBM; Division of Building Materials, LTH, Lund University: Lund, Sweden, 1978; Volume 3005. [Google Scholar]
  43. Carpinteri, A. Application of Fracture Mechanics to Concrete Structures. J. Struct. Div. 1982, 108, 833–848. [Google Scholar] [CrossRef]
  44. Kosteski, L.E.; Iturrioz, I.; Lacidogna, G.; Carpinteri, A. Size effect in heterogeneous materials analyzed through a lattice discrete element method approach. Eng. Fract. Mech. 2020, 232, 107041. [Google Scholar] [CrossRef]
  45. Puglia, V.B.; Kosteski, L.E.; Riera, J.D.; Iturrioz, I. Random field generation of the material properties in the lattice discrete element method. J. Strain Anal. Eng. Des. 2019, 54, 236–246. [Google Scholar] [CrossRef]
  46. Vantadori, S.; Carpinteri, A.; Iturrioz, I. Effectiveness of a lattice discrete element model to simulate mechanical wave shielding by using barriers into the ground. Eng. Fail. Anal. 2020, 110, 104360. [Google Scholar] [CrossRef]
  47. Iturrioz, I.; Riera, J.D. Assessment of the Lattice Discrete Element Method in the simulation of wave propagation in inhomogeneous linearly elastic geologic materials. Soil Dyn. Earthq. Eng. 2021, 151, 106952. [Google Scholar] [CrossRef]
  48. Silling, S.; Askari, E. A meshfree method based on the peridynamic model of solid mechanics. Comput. Struct. 2005, 83, 1526–1535. [Google Scholar] [CrossRef]
  49. Colpo, A.; Vantadori, S.; Friedrich, L.; Zanichelli, A.; Ronchei, C.; Scorza, D.; Iturrioz, I. A novel LDEM formulation with crack frictional sliding to estimate fracture and flexural behaviour of the shot-earth 772. Compos. Struct. 2023, 305, 116514. [Google Scholar] [CrossRef]
  50. Richter, C.F. Elementary Seismology; W. H. Freeman and Company: New York, NY, USA; Bailey Bros. & Swinfen Ltd.: London, UK, 1958; Volume 2. [Google Scholar]
  51. Grosse, C.; Ohtsu, M. (Eds.) Acoustic Emission Testing; Springer: Berlin/Heidelberg, Germany, 2008. [Google Scholar] [CrossRef]
  52. Ferreira Friedrich, L.; Colpo, A.; Maggi, A.; Becker, T.; Lacidogna, G.; Iturrioz, I. Damage process in glass fiber reinforced polymer specimens using acoustic emission technique with low frequency acquisition. Compos. Struct. 2021, 256, 113105. [Google Scholar] [CrossRef]
  53. Aggelis, D.G. Classification of cracking mode in concrete by acoustic emission parameters. Mech. Res. Commun. 2011, 38, 153–157. [Google Scholar] [CrossRef]
  54. Behnia, A.; Chai, H.K.; Shiotani, T. Advanced structural health monitoring of concrete structures with the aid of acoustic emission. Constr. Build. Mater. 2014, 65, 282–302. [Google Scholar] [CrossRef]
  55. Shetty, N.; Livitsanos, G.; Van Roy, N.; Aggelis, D.G.; Van Hemelrijck, D.; Wevers, M.; Verstrynge, E. Quantification of progressive structural integrity loss in masonry with Acoustic Emission-based damage classification. Constr. Build. Mater. 2019, 194, 192–204. [Google Scholar] [CrossRef]
  56. Aki, K. Scaling Law of Seismic Spectrum. J. Geophys. Res. 1967, 72, 1217–1231. [Google Scholar] [CrossRef]
  57. Han, Q.; Wang, L.; Xu, J.; Carpinteri, A.; Lacidogna, G. A robust method to estimate the b-value of the magnitude–frequency distribution of earthquakes. Chaos Solitons Fractals 2015, 81, 103–110. [Google Scholar] [CrossRef]
  58. Shimadzu. AGS-X Plus: Instruction Manual; Shimadzu Corporation: Kyoto, Japan, 2012. [Google Scholar]
  59. Aldeeky, H.; Al Hattamleh, O. Prediction of Engineering Properties of Basalt Rock in Jordan Using Ultrasonic Pulse Velocity Test. Geotech. Geol. Eng. 2018, 36, 3511–3525. [Google Scholar] [CrossRef]
  60. Zhang, C.; Shi, F.; Cao, P.; Liu, K. The fracture toughness analysis on the basalt fiber reinforced asphalt concrete with prenotched three-point bending beam test. Case Stud. Constr. Mater. 2022, 16, e01079. [Google Scholar] [CrossRef]
  61. Balme, M.R.; Rocchi, V.; Jones, C.; Sammonds, P.R.; Meredith, P.G.; Boon, S. Fracture toughness measurements on igneous rocks using a high-pressure, high-temperature rock fracture mechanics cell. J. Volcanol. Geotherm. Res. 2004, 132, 159–172. [Google Scholar] [CrossRef]
  62. Junges, B.M.B.; Ficher, N.M.; Kosteski, L.E.; Marangon, E. Hardness correlation length in a self-compacting concrete. Rev. Ibracon Estruturas E Mater. 2020, 13, e13401. [Google Scholar] [CrossRef]
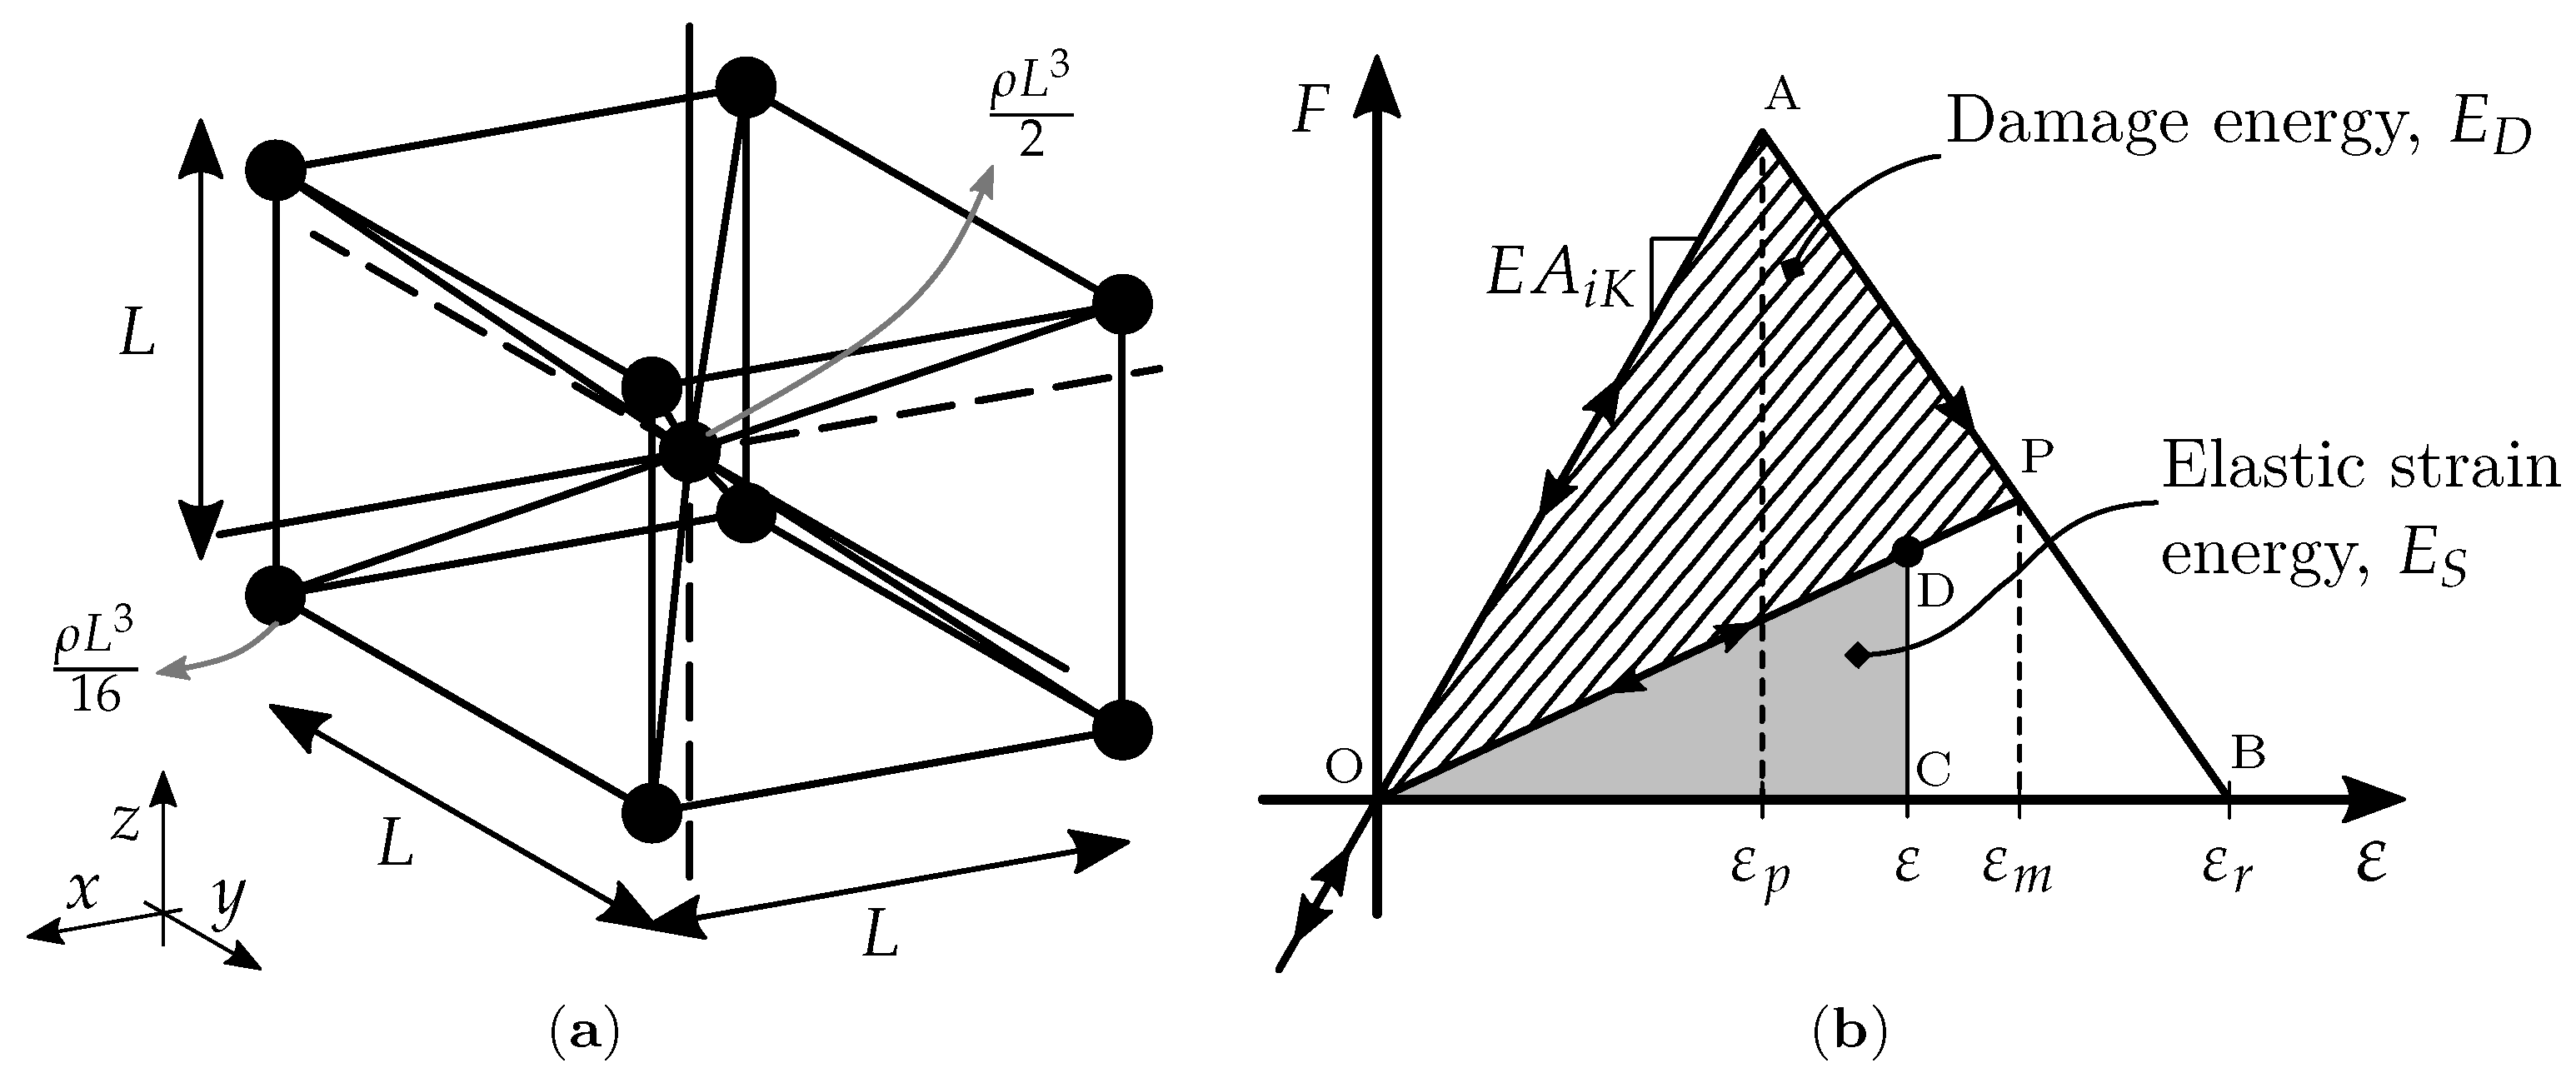
Figure 1. View of basic LDEM model: (a) the basic cubic module within a LDEM array; (b) classical uniaxial constitutive law used by the LDEM elements.
Applsci 13 10947 g001
Figure 2. Precursors from AE tests, obtaining b-value from Equation (10).
Applsci 13 10947 g002
Figure 4. (a) The dispositive used to fix the basalt specimen during the test. Detail A: irregularities in the specimen surface. Detail B: the excessive support flexibility. (b) The final configuration obtained during the test.
Applsci 13 10947 g004
Figure 5. (a) Geometry of the test body with the boundary conditions used. (b) Final configuration obtained in the LDEM simulation (broken bars indicated in red, damage bars indicated in blue, and undamaged bars indicated in gray.
Applsci 13 10947 g005
Figure 6. Comparison between experimental and numerical results in terms of Global Reaction measured vs. applied displacement at constant velocity. (ac) evolution of damage at the indicated points of the experimental result; (df) of LDEM.
Applsci 13 10947 g006
Figure 9. Time evolution of energy of the LDEM model. The dissipated energy is zero up to the normalized time = 0.25; then, it begins to increase in sensible form after time = 0.77.
Applsci 13 10947 g009
Figure 10. Results in terms of Acoustic Emission signal vs, time, load vs. time, and the time evolution of b-value and DPH index vs. the normalize time. Two measures of the DPH parameter are indicated: U / t indicate the derivative of the elastic energy computed internally in the simulation; U ˜ / t indicate the derivative of the measure of the elastic energy computed as the product between the reaction support and the prescribed displacement. ( a ) and ( a ) instants of particular interest for the DPH computed using U / t and U ˜ / t .
Applsci 13 10947 g010
Table 1. The LDEM parameters adopted for the basalt prismatic specimen with a prefissure.
# mod.LE ν d eq
28 × 28 × 10 2.50   m m 1.25   G Pa 0.25 0.02   m m
ρ μ ( G f ) L cor CV ( G f ) β
2456   k g   m 3 1000   N   m 1 20   m m 160%3
Table 2. Collapse prediction time ( ( · ) ) relationship with DPH characteristic values—experimental test (see Figure 8).
( a )( b )( c )( d )( e )
t n 0.3400.4180.7070.9550.987
t i 0.3480.4340.7180.9701.000
t n / t i [%]97.62696.35698.36098.46698.674
Table 3. Collapse prediction times using LDEM. t n : precursor time determined from DPH computed using U / t ( a ) and using U / t ( a ). t i : time in which the collapse happens.
( a )( a )
t n 0.9370.983
t i 1.0001.000
t n / t i [%]93.78298.315
Disclaimer/Publisher’s Note: The statements, opinions and data contained in all publications are solely those of the individual author(s) and contributor(s) and not of MDPI and/or the editor(s). MDPI and/or the editor(s) disclaim responsibility for any injury to people or property resulting from any ideas, methods, instructions or products referred to in the content.