Article

Vertically and Horizontally Reinforced End-Bearing Stone Column: An Experimental and Numerical Investigation

Department of Civil Engineering, Delhi Technological University, New Delhi 110089, India
*
Author to whom correspondence should be addressed.
Appl. Sci. 2023, 13(19), 11016; https://doi.org/10.3390/app131911016
Submission received: 5 September 2023 / Revised: 21 September 2023 / Accepted: 27 September 2023 / Published: 6 October 2023

Abstract

:
In the present study, experiments were conducted using model testing to explore the load-carrying capability of horizontally and vertically reinforced end-bearing stone columns. Single columns with three different diameters, i.e., 50 mm, 75 mm, and 100 mm, were tested under compressive loading in both unreinforced and reinforced circumstances. This study examined three different variations in horizontal reinforcement. In the first case, the geotextile was evenly distributed at regular intervals along the entire height of the column (L). Secondly, horizontal layering was implemented from the column head to the centre of the column. Lastly, in the third case, horizontal layering was applied from the centre of the column to the base of the column. For vertical reinforcement, four different lengths of reinforcement (Lr) were used, i.e., L, 0.75 L, 0.5 L, and 0.25 L. According to the experimental results, using horizontal as well as vertical layers of reinforcement improved the bearing capacity of the stone columns. In addition, the process of layering as well as vertical encasing served to mitigate the lateral bulging of the columns under examination, as it capitalised on the interlocking and frictional interactions among the stones that comprised the columns. Numerical modelling with a finite element (FE) code, Plaxis 3D, was also performed to validate the experimental results. An exhaustive comparison of all the cases was performed, and the experimental results demonstrated a high level of concurrence with the numerical findings.

1. Introduction

Eligible construction sites are becoming scarcer as a result of the infrastructural development that is rapidly taking place. As a result, it has become necessary to build civil structures at marginal locations with weak soils [1,2]. Among the many techniques used to improve the ground, stone columns are frequently employed to increase the extremely soft/soft ground-bearing capacity and to lessen the overall and unequal settlement of superstructures. Stone columns are effectively used in order to support clay embankments, LPG containers, raft foundations, and bridge approach fills, and to improve the stability of the slope and decrease the risk of liquefaction of loose, cohesionless soil [3]. Due to these three main factors, stone columns are an excellent ground remediation approach. Because they have a larger frictional value than the neighbouring soils, they serve as a stronger medium and improve the ground’s ability to bear weight and rigidity. Additionally, they accelerate consolidation and decrease the post-construction settlement [4,5]. Third, the placement of stone columns leads to radial displacement and an increase in the nearby soft clay’s lateral earth pressure coefficient [1,6,7]. In particular, stone columns applied in ground development approaches work very effectively in cohesive soils when the in situ soil’s undrained shear capacity varies from 15 to 35 kPa. In extremely soft soils that do not provide the columns with enough lateral confinement, stone columns might not be the best choice. In recent years, the encapsulation of the columns with various forms of geosynthetics has become increasingly feasible to enhance the column’s lateral strength, thereby also increasing its vertical capability [8,9,10,11,12,13,14,15,16,17,18,19,20]. However, there has been limited use of the horizontal layering of geotextiles as a reinforcing material [14,21,22].
Greenwood [23] determined the ultimate load-carrying capability of a stone column based on its collapse mechanism of bulging and the passive resistance provided by adjacent softer soils. As an effect of the frictional angle of the material of the column, the area replacement ratio, and the constrained modulus of the neighbouring soil as well as the stone column, Priebe [24] calculated a factor for settlement improvement, described as the ratio of unaltered ground settlement to the upgraded ground settlement for a stiff foundation reinforced by numerous stone columns. Among numerous columns made of stone, a single column was isolated using the “unit cell” idea developed by Baumann and Bauer [25]. Using model tests and numerical studies based on finite elements and the unit cell idea, Ambily and Gandhi [26] produced a design chart for the calculation of the settlement of an area that is reinforced by columns of stone. On 20 documented case studies on softer cohesive types of soil, McCabe et al. [27] conducted an evaluation of the settlement enhancement factors of the ground that had been improved by stone columns under the influence of both footing and embankment stress. The dry method of bottom feeding is a more desirable method for the erection of columns in soft cohesive types of soil, according to a comparison of the projected and measured settlement improvement factors among several stone column construction procedures. Shahu and Reddy [28] used small-scale laboratory and numerical investigations to explore the functioning of stone columns arranged in groups. The results suggest that multiple aspects, including the slenderness ratio, area replacement ratio, relative stiffness between the soil and column, and stress conditions of the nearby soil, are significant in comprehending the behaviour of stone floating columns in groups. Kaiwen et al. [29] conducted experiments to study the performance of geosynthetics-encased steel slag columns where steel slag was mixed with 10% and 20% fines to simulate the clogging effect. The result showed that the bearing capacity of the column-treated foundations was 10 times higher compared to the untreated ones, and the effect of fines was negligible. Similar analyses were also conducted by Fan and Rowe [30,31], where a geomembrane was utilised.
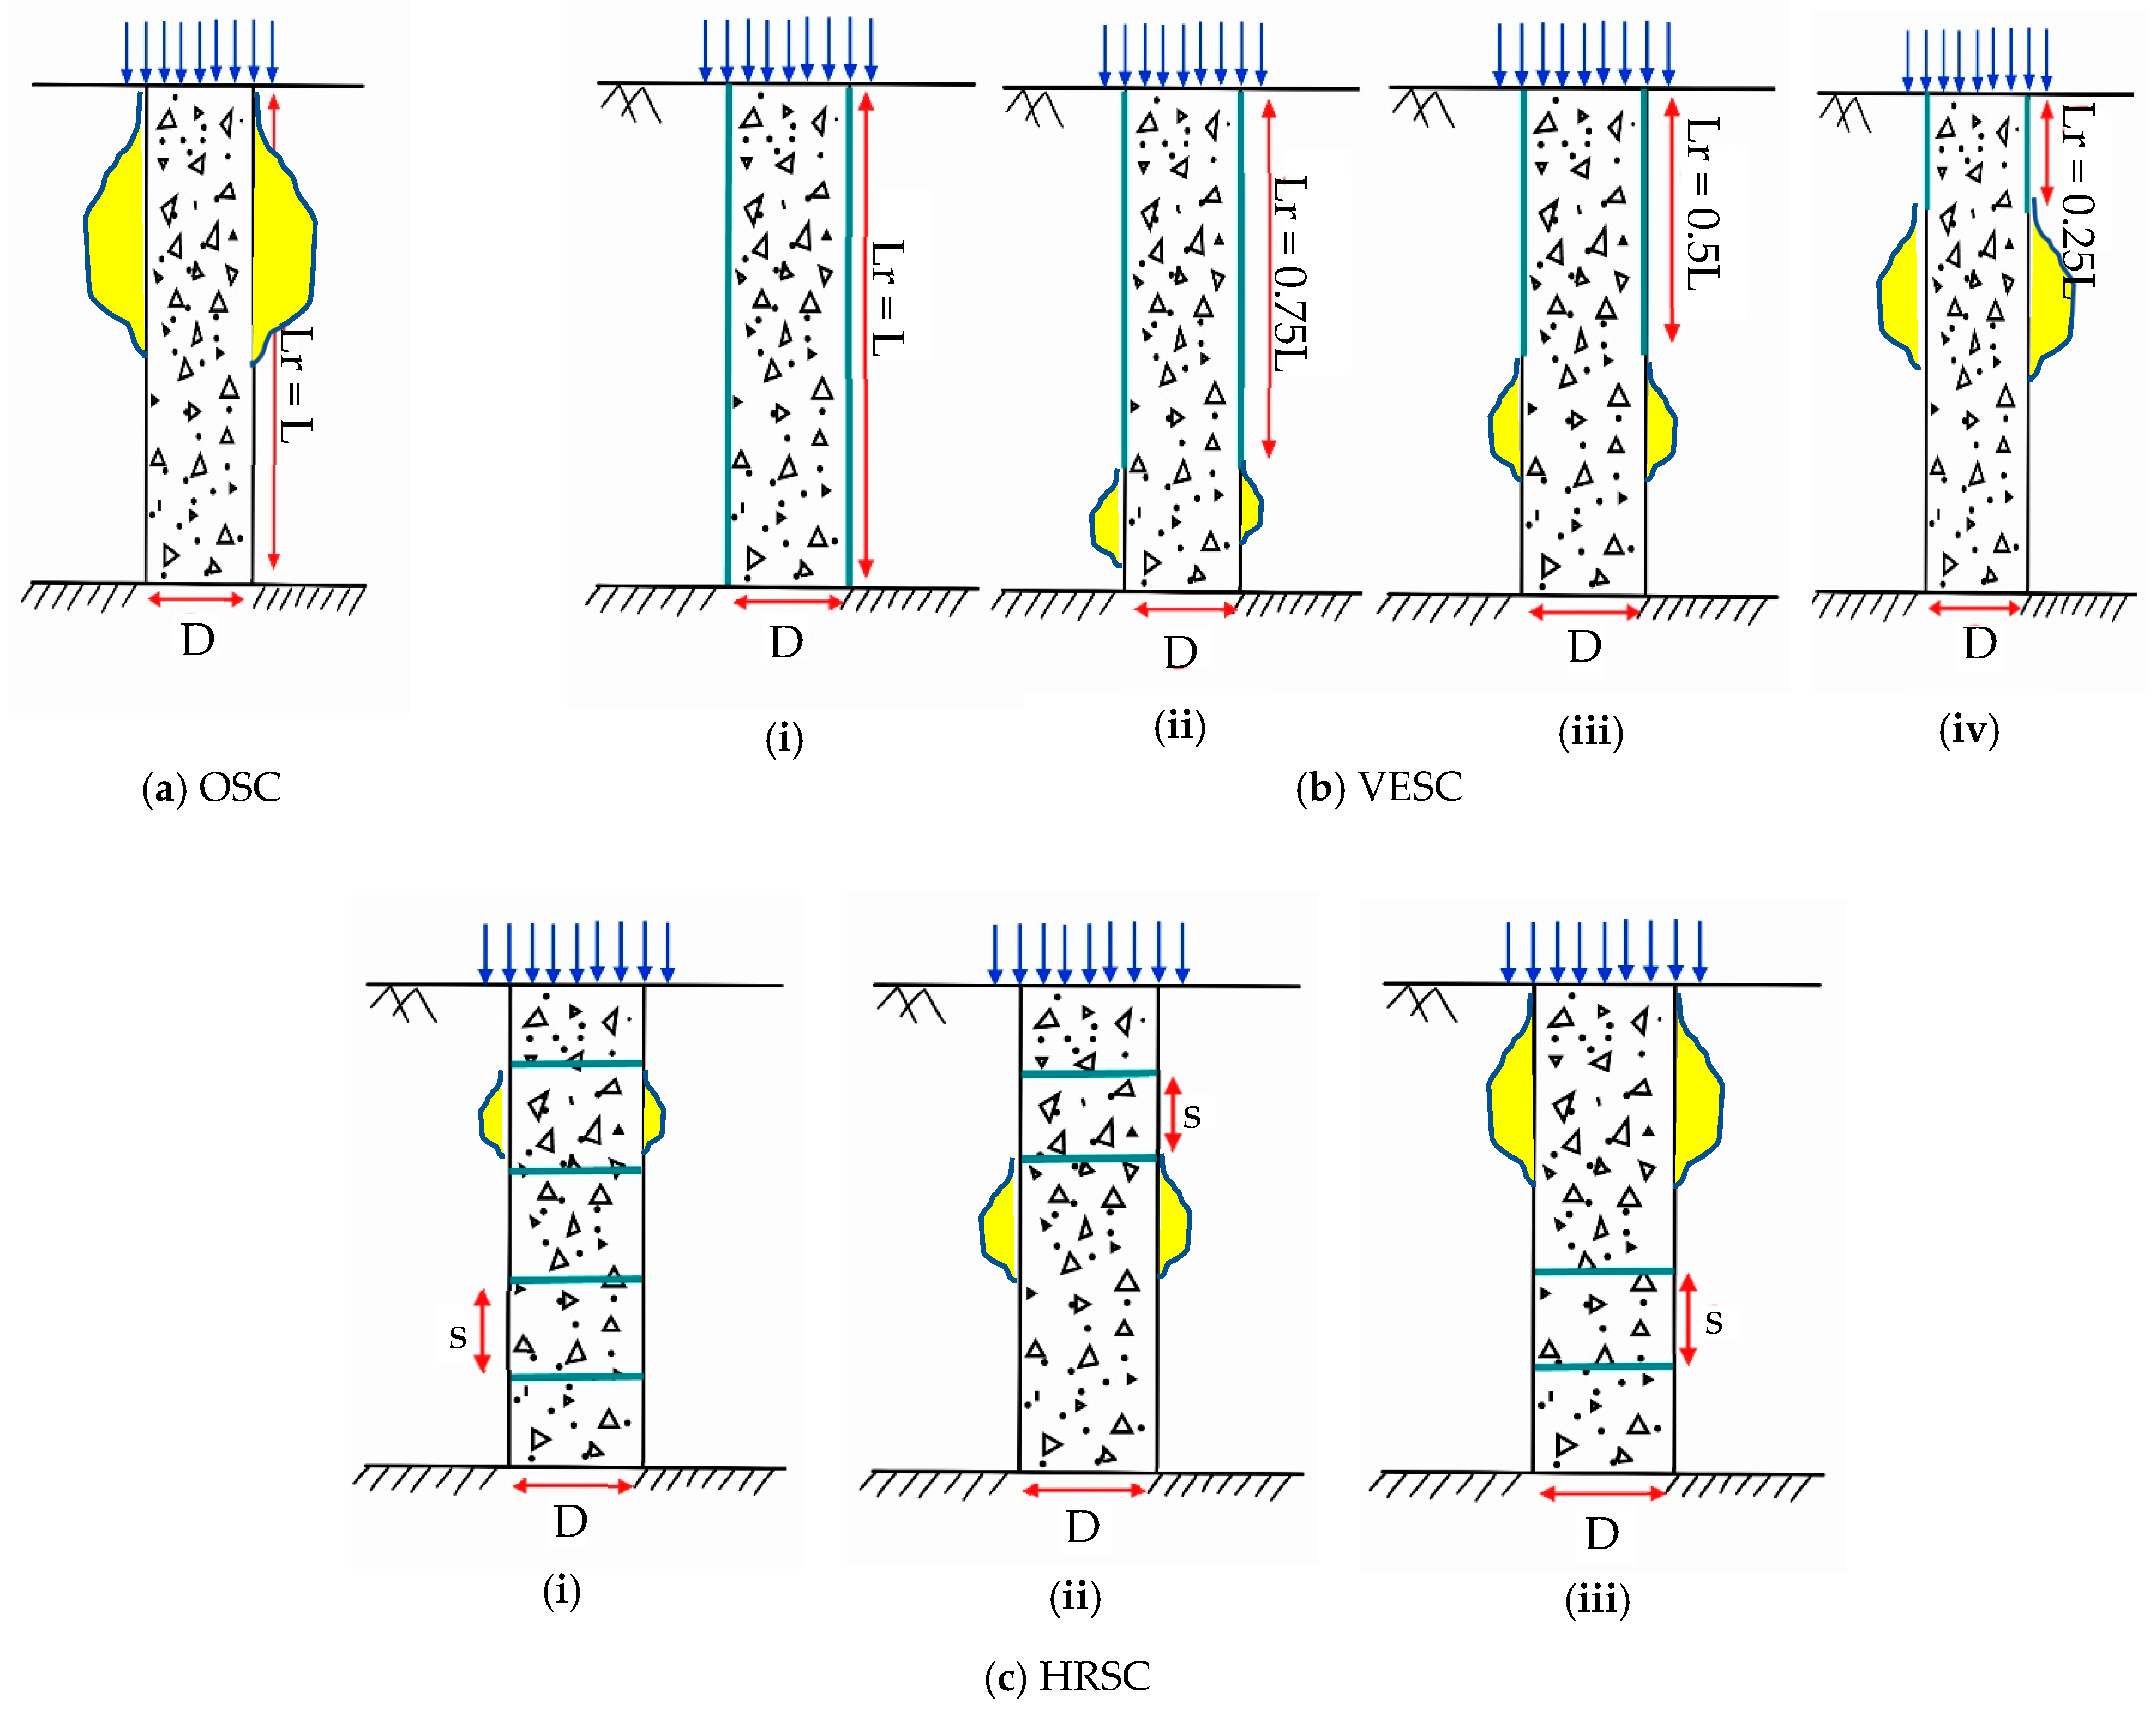
Figure 1 depicts a representation of three types of columns used in this research, namely an ordinary stone column (OSC), a horizontally reinforced stone column (HRSC), and a vertically reinforced stone column (VESC), at various lengths, for geotextile reinforcement.
The findings of a series of experiments employing a large system laboratory weighted over one stone column with varying diameters are detailed in this research. Ordinary stone column (OSC), horizontally reinforced stone column (HRSC), and vertically encased stone column (VESC) tests were used to assess the effect of the varying reinforcement length (Lr) on the soil’s response. The same analysis was also conducted numerically. The primary aim of the present study was to evaluate and compare the efficacy of VESCs and HRSCs in a softer soil type with different stone column diameters while maintaining consistency between laboratory and numerical findings.

2. Materials Employed

2.1. Soft Clay and Stone Aggregates

Soft-type clay and crushed-type stones were utilised as resources in this investigation. Many existing research works have focused on enhancing the overall efficiency of cohesionless soils reinforced by stone columns. In actual field conditions, a weaker type of cohesive soil to a certain depth above a firmer layer is not unusual. As a result, an assessment of the efficiency of stone columns reinforcing the cohesive-type soil (clay) is necessary to determine the load-bearing capability, subsequent settlement, and the generation of design techniques that may be employed without a comprehensive subsurface study. Specific gravity, compaction qualities, particle size distribution, and shear strength indicators of the soil utilised in the model tank were all examined. The laboratory testing for the determination of soil qualities was performed in compliance with Indian Standards. Table 1 indicates the diverse index properties associated with soft clay. The clay material was classified as CL as per the Unified Soil Classification System (USCS). The moisture percentage of the clay was determined to be 26.13%, corresponding to the undrained shear strength value of 20 kPa, after which this value was maintained throughout the experiments.
The size of the pebbles used in building stone columns was identified as a critical factor. The dimension of the particles (d) of the crushed aggregates/gravels utilised in real-time practice was kept between 25 and 50 mm for the building of columns with these stones, with diameters (D) ranging from 0.6 to 1.0 m. As per Ali et al. [21], crushed-type stones with sizes ranging from 6 to 40 mm can be used as aggregates, with a D/d ratio ranging between 12 and 40 as used for prototypes. Thus, for the current investigation, D/d ratios of 4–50 and aggregate sizes varying from 2 to 10 mm were used to create model stone columns with D = 50, 75, and 100 mm. The aggregates were tested for their particle size distribution, dry density, and shear strength using a direct shear test with a rate of shearing of 1.25 mm/min, under normal stress of values 100 kPa, 150 kPa, 200 kPa, and 300 kPa. Stone material was classified as GP, according to USCS. The values of the coefficient of uniformity and coefficient of curvature were found to be 2.14 and 1.10, respectively. Table 2 also includes the aggregate qualities established through laboratory testing.

2.2. Geotextile as an Encasement Material

Under vertical loads, the vertical displacement of the stone column must occur with lateral swelling near the head of the column. Because of this swelling/expansion, the geotextile encasement stretches and develops a circumferential stress that is tensile, providing additional confining stress on the column. Because of this lateral expansion, the geotextile encasement stretches and develops a circumferential tensile stress, adding confining stress on the column. Considering that a geotextile enclosure behaves linearly elastically, and also disregarding the shear stresses in the circumferential direction between the column and the geotextile, the hoop tensile force T in the geotextile undergoes conversion into a state of horizontal tension σr,geo, which is given to the geotextile, i.e.,
σ r , geo = T r c
T = T0 + ∆T
T = J   r = E g   t g   r c r c
The variable rc is the radius of the column, T0 represents the initial tensile tension exerted on the encasement due to the installation of the column; ∆T means that the column has increased tensile tension due to lateral bulging; Eg, J, and tg are the elasticity modulus, tensile modulus, and the measurement of the geotextile’s thickness, respectively; and J = Egtg. The value of T0 is typically non-zero, and its size is contingent upon the specific installation method [32].
When Equations (1)–(3) are combined, the calculation of the supplementary restraining force induced through the geotextile is contingent upon the encasement properties and the lateral expansion of the column, i.e.,
σ r , geo = T 0 r c + J   r c r c 2
The material used for encasement was a geotextile made of woven polypropylene, designed to handle a large amount of weight while having low permeability. The data presented in Table 3 illustrate the tensile strength values of the geosynthetics under consideration, as determined by typical wide-width tensile test methods. Geotextiles are employed in several applications, including but not limited to roads, airport runways, storage locations, and retaining walls. Moreover, when considering the implementation of horizontal reinforcement in the form of a circular disc, the practicality of producing a nearly circular fabric (with a diameter slightly less than that of the column) is more advantageous compared to employing a significantly more rigid geogrid material. As a result, only geotextiles were used for the end-bearing columns in this investigation.

3. Experimental Description

3.1. Tank Size and Scale Effect

The boundary effects, L/D ratio, and geometric similitude ratio were taken into account while modelling the stone column and test tank characteristics (length (L) and diameter (D)). As per Wood et al. [33], the diameter of a prototype stone column varied between 0.6 m and 1 m. Furthermore, the minimal diameter of the column, which can be erected entirely intact, was around 13 mm [28]. Moreover, the L/D ratio of the prototype varied between 5 and 20 [28]. Thus, the diameters of the columns used in the current study were 50, 75, and 100 mm. In accordance with the above rule, the L/D ratio for the current analysis was set in the range of 5–10. Moreover, the similitude ratio (Dmodel/Dprototype) was found in the range of 0.05 to 0.1. The most crucial characteristic for dimensioning the model tank is that the tank boundaries exhibit low induced stresses. This indicates that the tank’s boundaries must be at a distance such that no constraints form, and so that the overestimation of outcomes can be avoided. Considering this, the overall depth of the testing box utilised for the test setup was maintained at 0.6 metres. Similarly, Ali et al. [21] investigated cylindrical tank models for single and multiple reinforced stone columns. The tank was equipped with a robust loading structure and a loading system (Figure 2).

3.2. Clay Bed Preparation

The process of preparing clay beds was performed in a model tank with a size of 1200 mm × 900 mm and 600 mm in height. The sand was poured using the rainfall process, with every layer being 50 mm deep. The uniformity of the unit weight was maintained for each layer having a bulk density of 18 kN/m3 and was verified continually during filling with a mould having a specific volume at three separate points inside the layer. In total, ten layers of sand were applied, with a final height of 50 cm attained. To minimise the effects of friction involving the setup and the clay, the interior faces of the tank walls were covered in a thin film of grease. To determine the deformation patterns formed while testing a stone column, a tracer consisting of a powdered dye was utilised for identification purposes following the completion of each 10 mm layer. The studied clay’s natural water content was determined, and then the quantity of extra water required to attain a moisture value of 26.13 percent was computed. When not drained, this moisture level correlates to a strength value of 20 kPa. To attain consistent moisture within the softer soil, the outer part of the setup was covered by a nylon cloth and secured for three days. In all tests, the top surface of the clay was levelled and chopped to keep an absolute thickness and surface. All the tests used a similar technique to produce the clay layer. The moisture content profile was checked at a 10 cm gap for all clay layers to ensure that steady water content was preserved across the entire model tank. In all the tests, the observed variation in water content inside the clay bed exhibited a marginal deviation of less than 1.5%.

3.3. Installation and Construction Method of Stone Columns

Stone columns having diameters of 50, 75, and 100 mm were constructed for various experiments considering unreinforced and reinforced conditions. The geometric similitude ratio, L/D ratio, and the boundary effects were employed to determine the stone columns’ attributes. In accordance with the discussion in the previous section, the L/D ratio in the current work was set at 10, 6.67, and 5 for 50, 75, and 100 mm diameter columns, respectively. The stone column was cast using the replacement technique. Previous studies have employed this methodology for the installation of small-scale stone columns, as opposed to alternative techniques such as soil displacement, freezing, and force invasion [14]. The process of constructing stone columns involved the utilisation of slender and polished steel pipes, characterised by internal diameters of 50, 75, and 100 mm, as well as a wall thickness of 2 mm. The PVC casing was driven into the clayey soil with the help of a hydraulic jack. The primary justification for the use of top-down methodologies was to mitigate the occurrence of soil collapse during the process of borehole construction. A screw augur with a 38 mm diameter was employed to extract the clay from the PVC casing. The leftover soil was scraped out of the casing. The stone column was constructed by placing stone aggregates into the pit at three equal levels, with the number of aggregates determined based on a bulk unit weight measurement of 15.8 kN/m3. To obtain a homogenous density, a 1.5 kg circular tamping rod having a diameter of 20 mm was used to compact the stone debris by dropping the rod from an elevation of 100 mm, with 25 strikes for each layer.
In order to reinforce the hole, a pipe having a diameter slightly smaller than that of the hole was employed during VESC testing to offer vertical encasing reinforcement at the specific spot. The HRSC employed a design process that was analogous to that of the OSC. The spacing (S) between the horizontal layers of the geotextile was 100 mm. Therefore, the S/D ratios used were 2, 1.33, and 1 for 50, 75, and 100 mm diameter stone columns, respectively. The casing tube was labelled at 100 mm intervals to allow for the correct alignment of the horizontal encasement. With the help of the tamping rod, round discs were inserted at each marking after the aggregates were added and tamped. Alternatively, the casing pipe was gradually withdrawn.

3.4. Test Procedure

As described in the scholarly literature, the area replacement ratio refers to the proportion of the area in the cross-section occupied by columns concerning the overall area of the foundations. In practice, stone columns are loaded for an area replacement ratio (Ar) varying between 5 and 35% [14]. Utilising a loading plate of 200 mm diameter, individual stone column tests on columns were carried out having diameters of 50, 75, and 100 mm. The observed percentages of Ar in the present investigations were 6.25, 14.06, and 25% for columns having diameters of 50, 75, and 100 mm, respectively. The loading plate thickness was determined through an iterative process involving repeated experimentation and analysis. This approach aimed to minimise any observable deformation of the plate under loading conditions. Ultimately, a loading plate with a thickness of 25 mm was selected as it exhibited negligible distortion. This test’s loading system was stress-regulated, with the rate of loading controlled with the use of a hydraulic jack that had a capability of 20 kN. The testing procedure involved the application of a monotonic vertical load on the treated clay, followed by the analysis of the load–settlement characteristics of the clay. The end of load application occurred after the settlement in the stone column acquired a magnitude of 50 mm. After the column was constructed, using a plate positioned at the column’s centre, the vertical load was applied. When the settlement of the stone column reached 50 mm, the load application was stopped. Single stone columns were subjected to 27 tests in the current investigation. Table 4 provides a comprehensive outline of the experimental tests that were conducted. In all solitary stone column tests, a minimal length to diameter (L/D) ratio of 5 was employed, as a minimum value of 4 is necessary to avert bulging collapse [17,34]. Table 4 and Figure 1 show the various lengths of the encasement used for VESCs and HRSCs.

4. Numerical Analysis Using Plaxis 3D

In order to enhance the comprehension of the performance of the OSC and ESC, numerical simulations were run. The failure mechanism and footing settlement were investigated. We also examined how the column and encasement length (both VESC and HRSC) affected the results. The code for finite elements Plaxis 3D was used to create the entire 3D model. Clay and stone columns were modelled as a continuum element consisting of 10-noded tetrahedral elements. The geosynthetic encasement was simulated as discrete elements possessing solely normal stiffness, exhibiting solely translational degrees of freedom at their nodes and the capacity to endure solely tensile stresses. The numerical simulations employed a conservative strain formulation, and a hierarchical construction process was simulated. The inherent softness of the soil was initially modelled as a horizontal surface with a consistent depth. Geostatic initial stresses were created by the soil unit weight and the coefficient of lateral earth pressure at rest, K0. Subsequently, the placement of the columns and footings, collectively with their encasements, was carried out without considering the potential variations in the underlying soil resulting from the building of the columns. Finally, the settlement of the footing of 50 mm was simulated, and the analysis was run to obtain the results.
The Mohr–Coloumb model was used to model the clayey soil and the stone columns. Soil and column simulations were performed using the soil parameters given in Table 1 and Table 2. The various parameters needed to assign the properties were E, γbulk, γsat, c, υ, and φ. To precisely mimic the boundary constraint pertaining to the mode tank, the model’s bottom was constrained in the x, y, and z directions. However, in order to allow for stone column settlement under the influence of weight, vertical bounds in the z-direction were not restricted. The study by Ambily and Gandhi [26] emphasized the examination of unreinforced columns of stone without an interface element. Their findings indicated that the primary deformation mode in these columns was radial bulging, with minimal shear deformation observed. Geotextile encasement was modelled for reinforced stone columns using the Plaxis code’s geogrid element. The material under consideration, referred to as an “elastic” substance, requires the incorporation of axial stiffness (EA) to represent its stiffness properties. In this context, “E” denotes the modulus of elasticity of the geotextile, while “A” represents the cross-sectional area of the geotextile. The discretization of the earth and stone columns was accomplished with the help of 15-noded triangular elements (Figure 3). A medium mesh type was used to generate a mesh in all the analyses. The total number of soil elements varied between 4000 and 8000. For a reference case of D = 75 mm, when Lr = L, the average element size was found to be 0.1031 m. For the same case, the maximum and minimum element sizes were 0.1885 m and 0.01212 m, respectively. Similarly, the element size, nodes, and other discretization properties could be observed. The generation of in situ stresses was conducted prior to the application of the load, employing the K0 technique and Jacky’s (1-sinφ) computation. The technique of loading stone columns involved applying vertical displacement according to pre-determined specifications. This process was examined using plastic computing, which assesses the failure load at different displacement levels until the desired displacement is achieved. One limitation of the current finite element (FE) modelling approach is the failure to consider the laboratory installation procedure of stone columns.

Validation

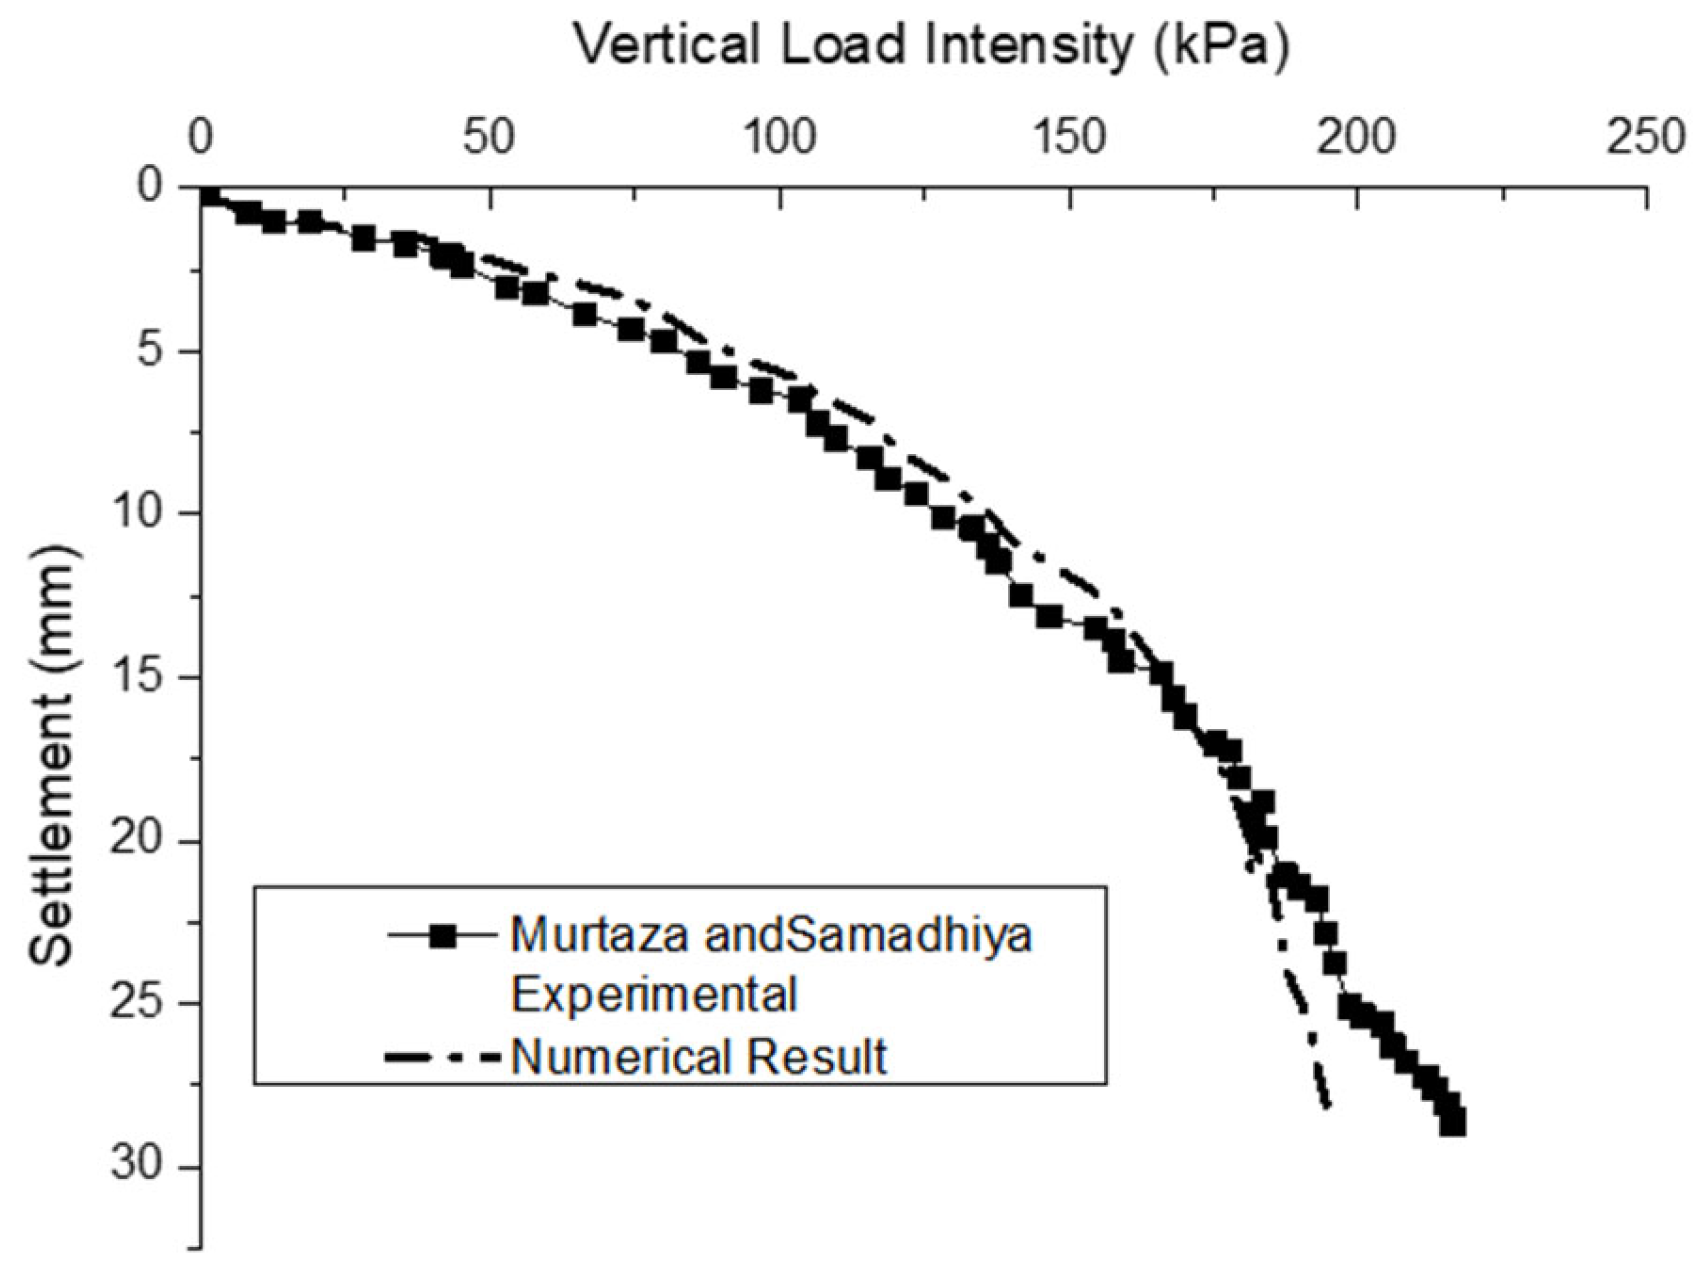
The validation of the numerical models involved the simulation of the load settling behaviour observed in the model tests conducted by Murtaza and Samadhiya [35]. The researchers conducted laboratory experiments utilizing the unit cell approach to assess individual stone columns embedded in soft clays. The experiments were conducted on stone columns with two diameters, 75 and 90 mm. The columns were subjected to two loading circumstances: (a) loading the column solely and (b) loading the entire area of the unit cell. These loading conditions were applied in both end-bearing and floating conditions. The present study focused on validating the scenario of a column area loading only for an end-bearing column. The study considered a single column of 75 mm in diameter and the length of the column was 525 mm. A geotextile was chosen as the encasement material, with a tensile strength of 4.4 kN/m. The details of the material properties for the chosen material model can be found in the referred study of Murtaza and Samadhiya [35]. Figure 4 shows the vertical load intensity settlement behaviour of the end-bearing granular piles of the present study and the experimental result of Murtaza and Samadhiya [35]. According to the current study’s findings, the settlement varied by less than 3% for most of the values. Additionally, at a settlement of roughly 20–30 mm, a maximum difference of 15% was noted. The findings of this study indicate that the current model aligns well with the experimental observations mentioned and that the chosen modelling approach is appropriate for the simulation of the behaviour of clayey soil reinforced with vertically and horizontally encased stone columns.

5. Results and Discussion

5.1. Failure Mechanism—Experimental Result

At a displacement of 50 mm, the failure of all the columns was considered. The surrounding clay from the loading setup was removed, and the stone columns were excavated. Uncased stone columns with distorted shapes were studied. The cause of the failure was determined to be the deformation of the stone columns, resulting in bulging. Bulging failure occurred for a single OSC for a distance of D to 2.5 D from the crest of the stone columns. Furthermore, apart from the prominent failure in bulging, the stone columns without casing also demonstrated lateral displacement. Figure 5a shows the bulging failure in the case of an OSC. The lateral deformation seen in the current tests exhibited similarities to the lateral displacement documented by Wood et al. [33]. As each column was uniformly subjected to the vertical load, there were hoop stresses developing inside the stone column. This caused the stone column to bulge laterally. Stone columns possess the ability to endure a substantial magnitude of hoop stress due to their encapsulation within a material characterised by notable tensile strength. The test findings demonstrated that all reinforced stone columns (for various Lr) had less bulging and lateral deformation than unreinforced stone columns. The entirely encased column (Lr = L) failed the punching test as there was no bulging throughout its whole length (Figure 5b(i)). Bulging was modest for the 50% encasement length column (Lr = 0.5 L). Under the enclosed zone, only slight lateral distortion was seen (Figure 5b(iii)). A comparable finding was obtained for a 75% encased length, i.e., Lr = 0.75 L (Figure 5b(ii)). For Lr = 0.25 L, bulging was visible slightly beneath the encasement length in the case of VESCs, as illustrated in Figure 5b(iv). The bulging level and location were demonstrated to be equivalent to those of the OSC example (Figure 5a).
In the scenario involving HRSCs, it was observed that the placement of horizontal strips at uniform intervals throughout the column’s length (specifically, at intervals of 100 mm) resulted in the collapse of the column. This collapse occurred as a consequence of localised swelling at distances ranging from 1.5 times to 2.5 times the column’s diameter (referred to as D), which was analogous to the behaviour observed in OSCs (Figure 5c(i)). This suggests that there was not sufficient space between the geotextiles’ horizontal layers. Figure 5c(ii) depicts modest bulging when reinforced for the top half (0.5 L from the column top), observed at the intersection of the column length’s reinforced and unreinforced portions. The bulging failure was similar to an unreinforced case when the reinforcement was used for the lower portion, particularly within a distance of 0.5 L from the centre to the foot.
For columns having a length greater than the critical length and irrespective of whether it was end-bearing or floating, it failed by bulging [17]. However, columns shorter than the critical length are likely to fail in general shear if it is end-bearing on a rigid base and punching if it is a floating column. The critical column length is the shortest column that can carry the ultimate load regardless of settlement [31]. In various research works, a different L/D ratio was found for the critical length of the column. Moreover, in the current study, the L/D ratio ranged between 5 and 10, the bulging failure was predominant. Its study is significant as it can further lead to the instability of the foundation. The highest bearing capacity was observed for L/D = 5 in the current study, which is similar to other existing studies [27,28,31].

5.2. Failure Mechanism—Numerical Result

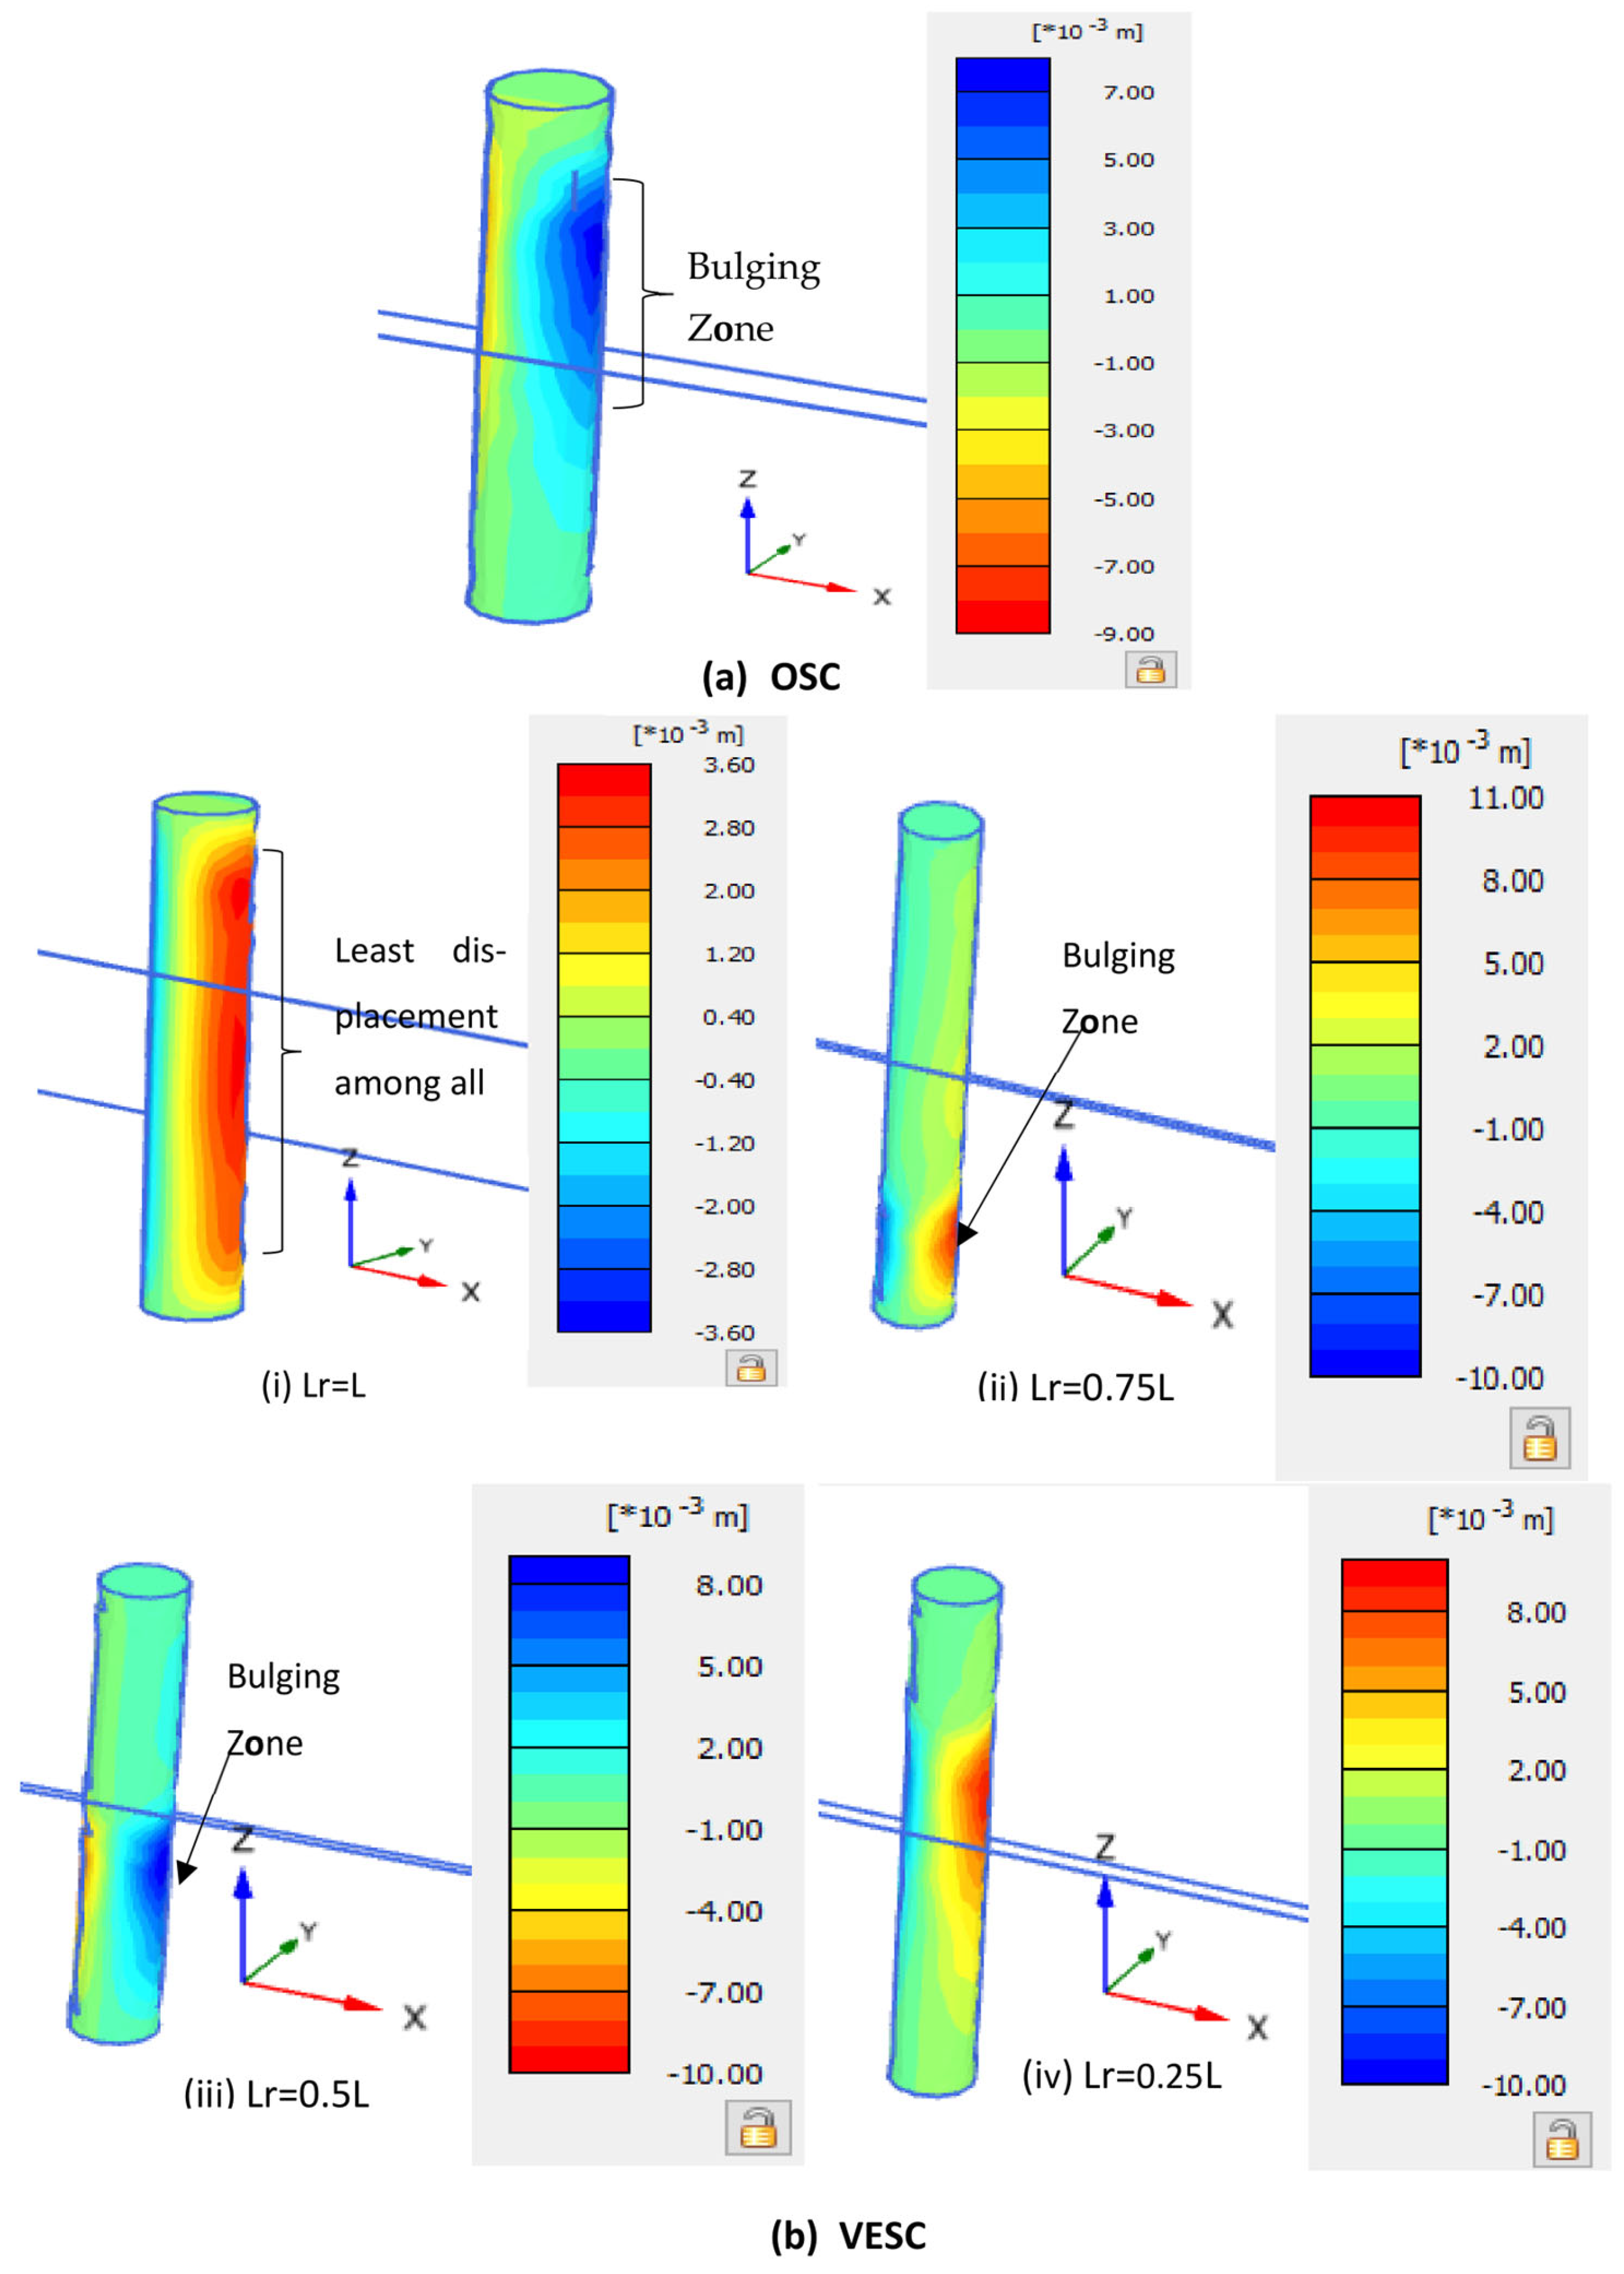
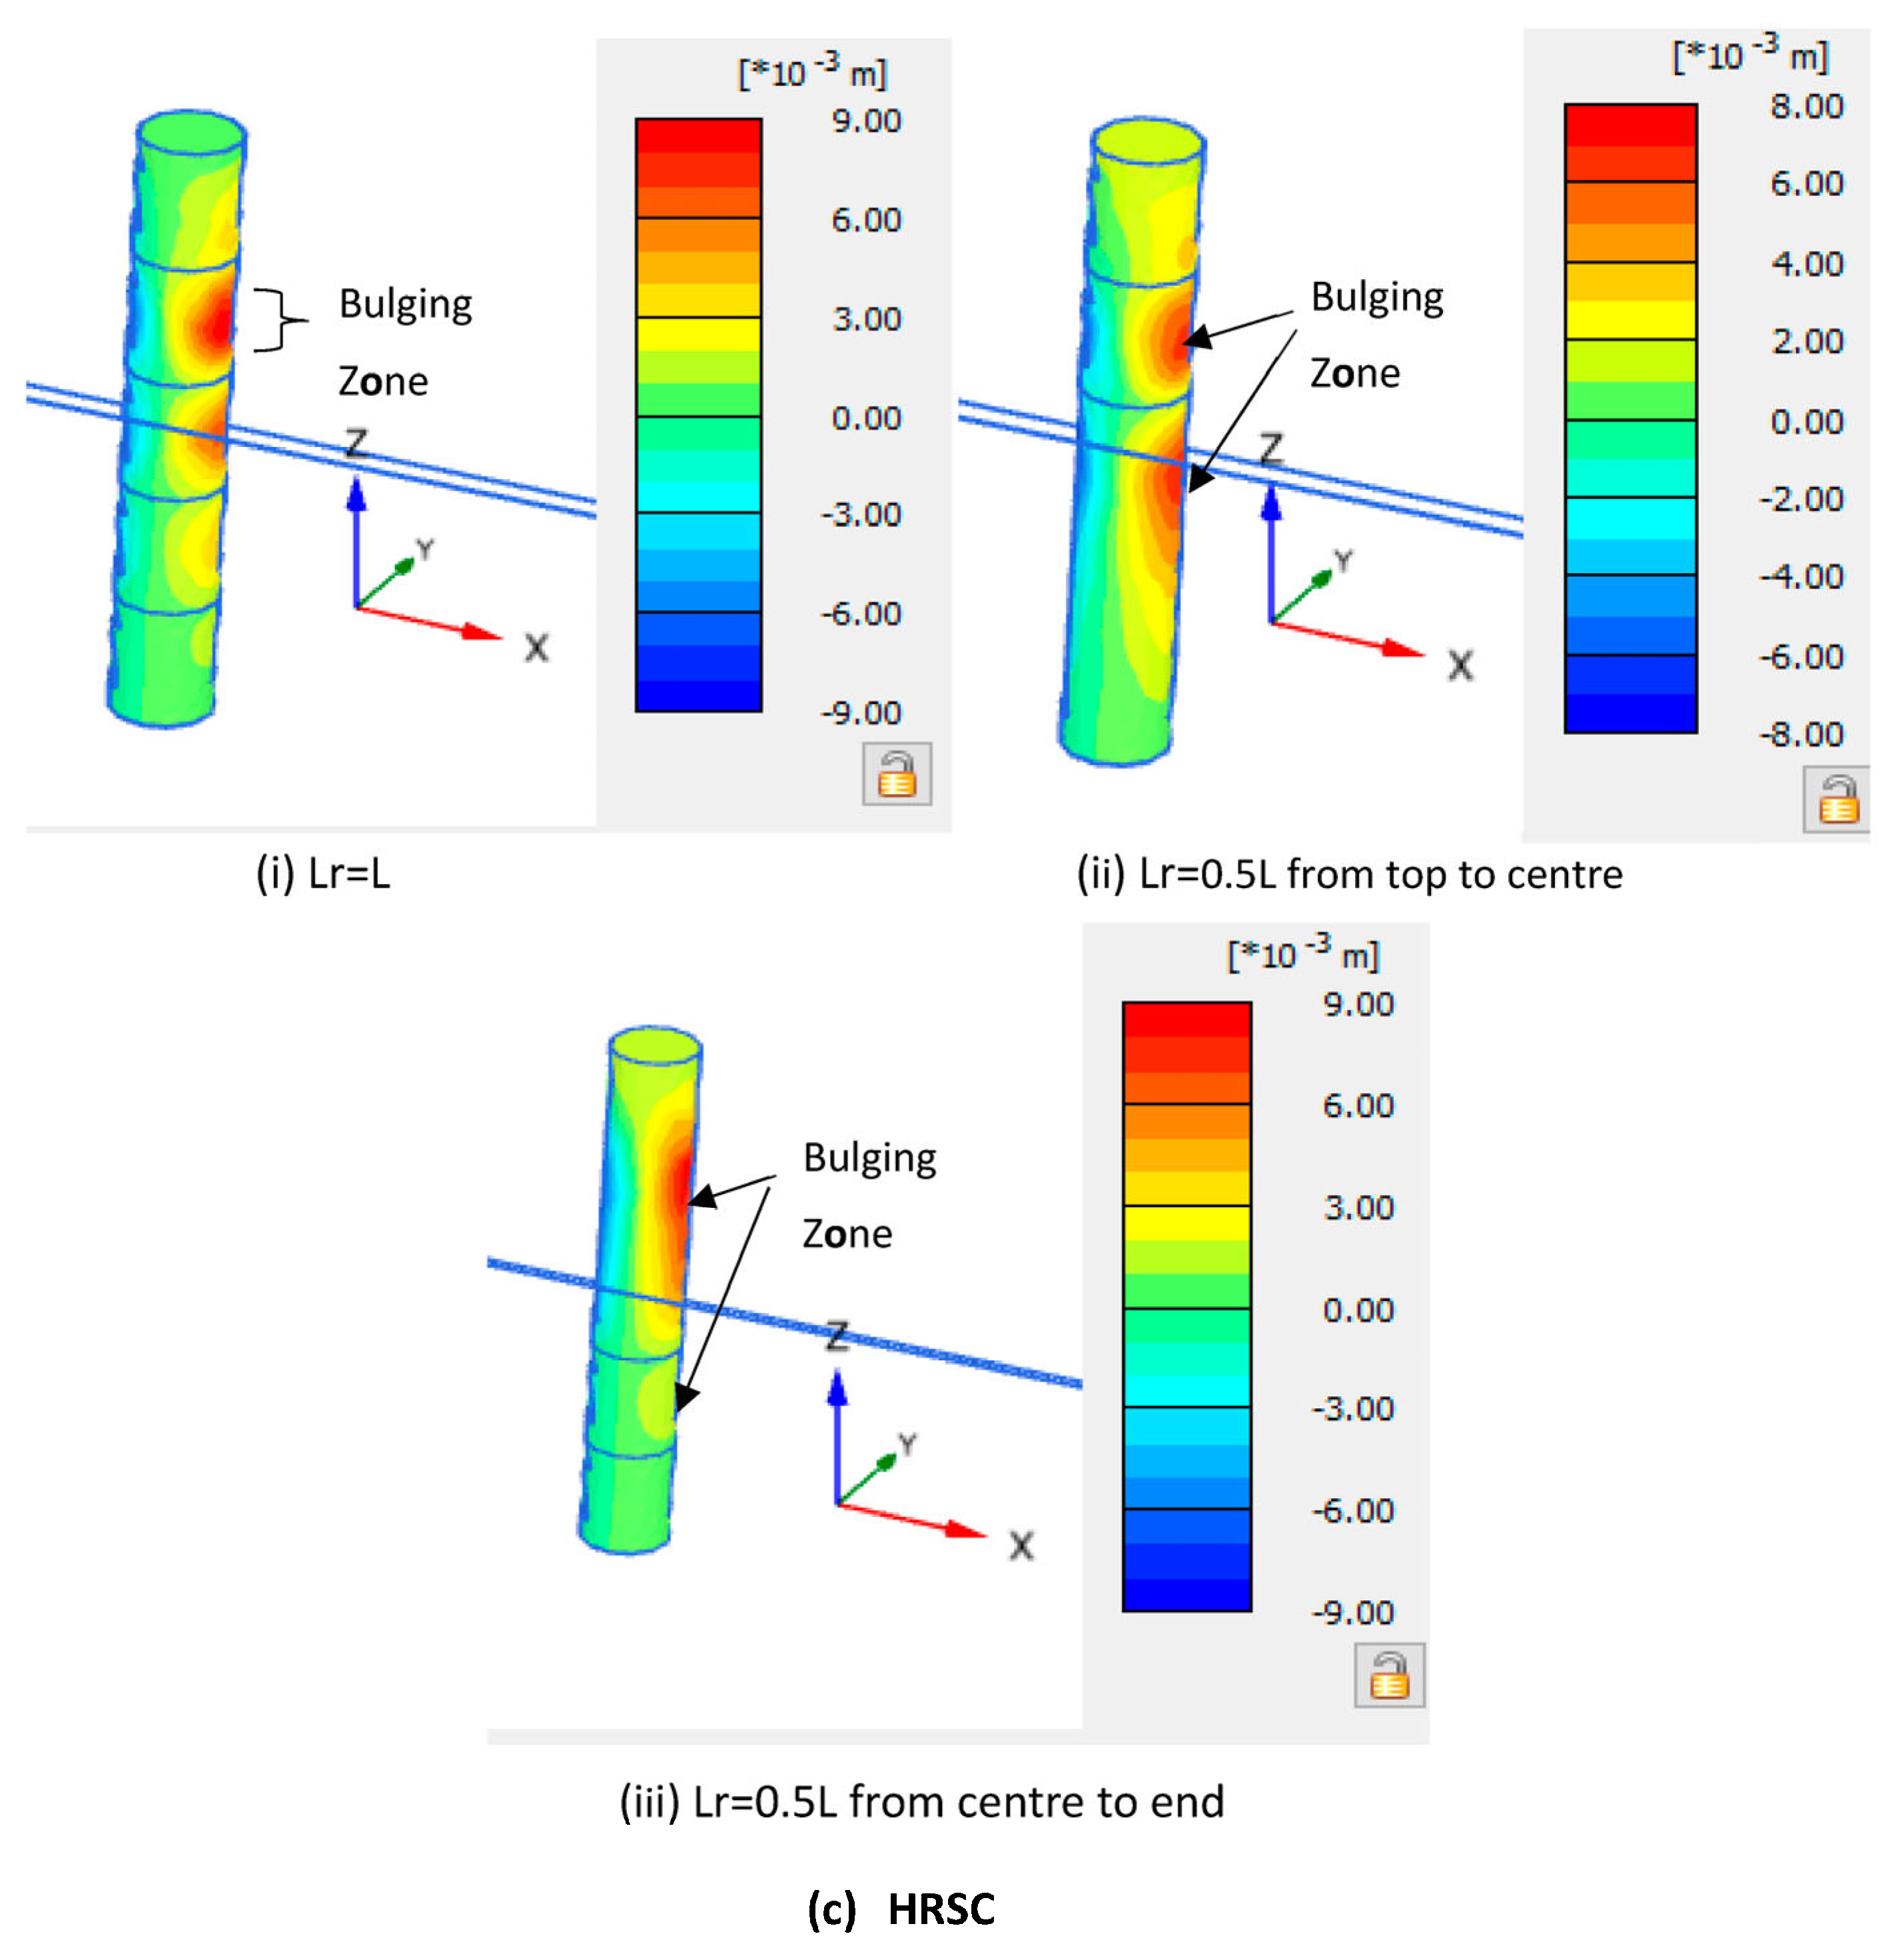
Figure 4 illustrates the pattern of column bulging at varying depths for two conditions: uncased (OSC) and encased (VESC and HRSC) columns. Figure 6a depicts the bulging failure mechanism of OSCs occurring at a distance of D-2D from the top of the column, similar to the experimental result of the OSC case (Figure 5a). The reason is the generation of hoop stresses near the column head. For VESCs, when Lr = L, minimal or no deformation was observed, as shown in Figure 6b(i). For Lr = 0.75 L and Lr = 0.5 L, slight bulging was observed near the junction of the encased and uncased zones (Figure 6b(ii,iii)). When Lr = 0.25 L, the failure was similar to that of the OSC, which was the same as that of the experimental failure mechanism (Figure 6b(iv)).
For HRSCs, when the spacing between reinforcements was 100 mm throughout the column length, local bulging was noted (similar to that of OSCs), indicating large spacing between the reinforcements (Figure 6c(i)). To reduce this deformation, the spacing should be minimized. For reinforcement provided only for the top half and bottom half, minimized bulging was noticed at the intersection of the reinforced and unreinforced areas (Figure 6c(ii,iii)), similar to the result obtained from the experimental analysis.

5.3. Load–Settlement Analysis—Experimental Result

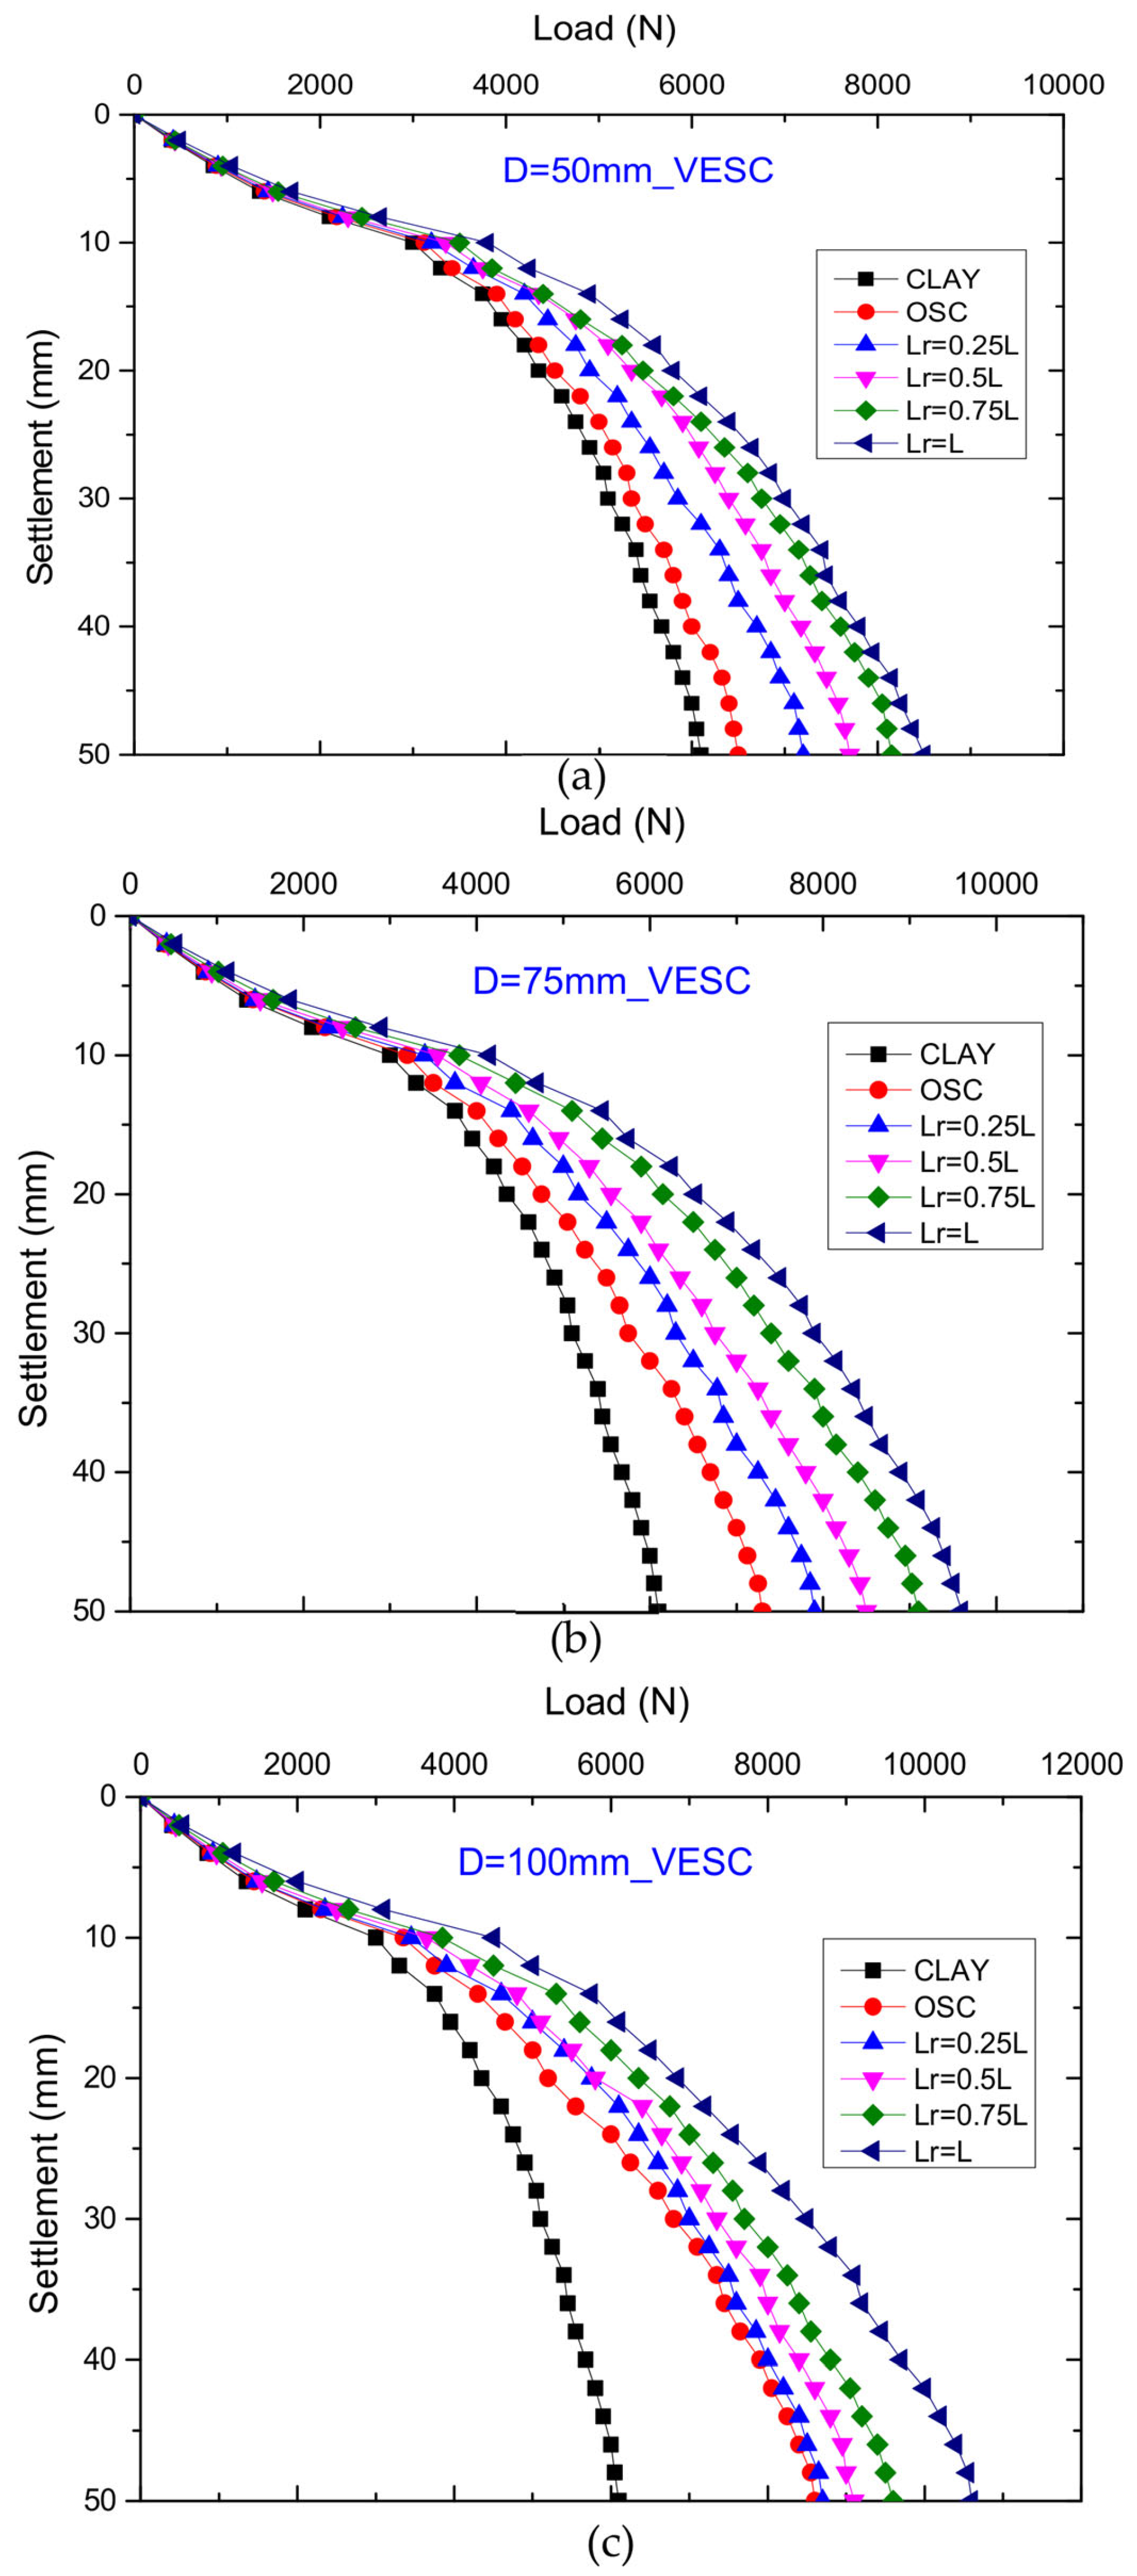
Figure 7a–c illustrates the load–settlement responses of both unreinforced and reinforced loose clays with stone columns of varying diameters (50, 75, and 100 mm) and different forms of reinforcement for columns for VESCs, while Figure 8a–c depicts the load–settlement behaviour of HRSCs. OSCs, HRSCs, and VESCs were discovered to increase the load-carrying capacity of soft soil. When increasing the as from 6.25 to 25%, the ultimate carrying capabilities of all three types of columns (OSCs, HRSCs, and VESCs) were increased. To understand the behavioural change for various configurations, the ultimate load at 50 mm settlement was considered for the analysis. For D = 50, 75, and 100 mm, when an OSC is used in soft clay, the load capacity increases by 6.15, 16.43, and 29.06%, respectively. For the VESC case, when Lr = 0.25 L, the load capacity further increases by 9.72, 7.5, and 1.14% for 50, 75, and 100 mm diameter columns, respectively, with respect to the OSC case of individual diametral columns. Similarly, for Lr = 0.5 L, as compared to their individual OSC values, the load capacity increases by 15.58, 14.11, and 5.49% for D = 50, 75, and 100 mm, respectively. For Lr = 0.75 L, the increase was found to be 20.24, 19.78, and 10.41%. Moreover, when Lr = L, the percentage increase in load capacity for the same cases was 23.52, 23.95, and 18.86%.
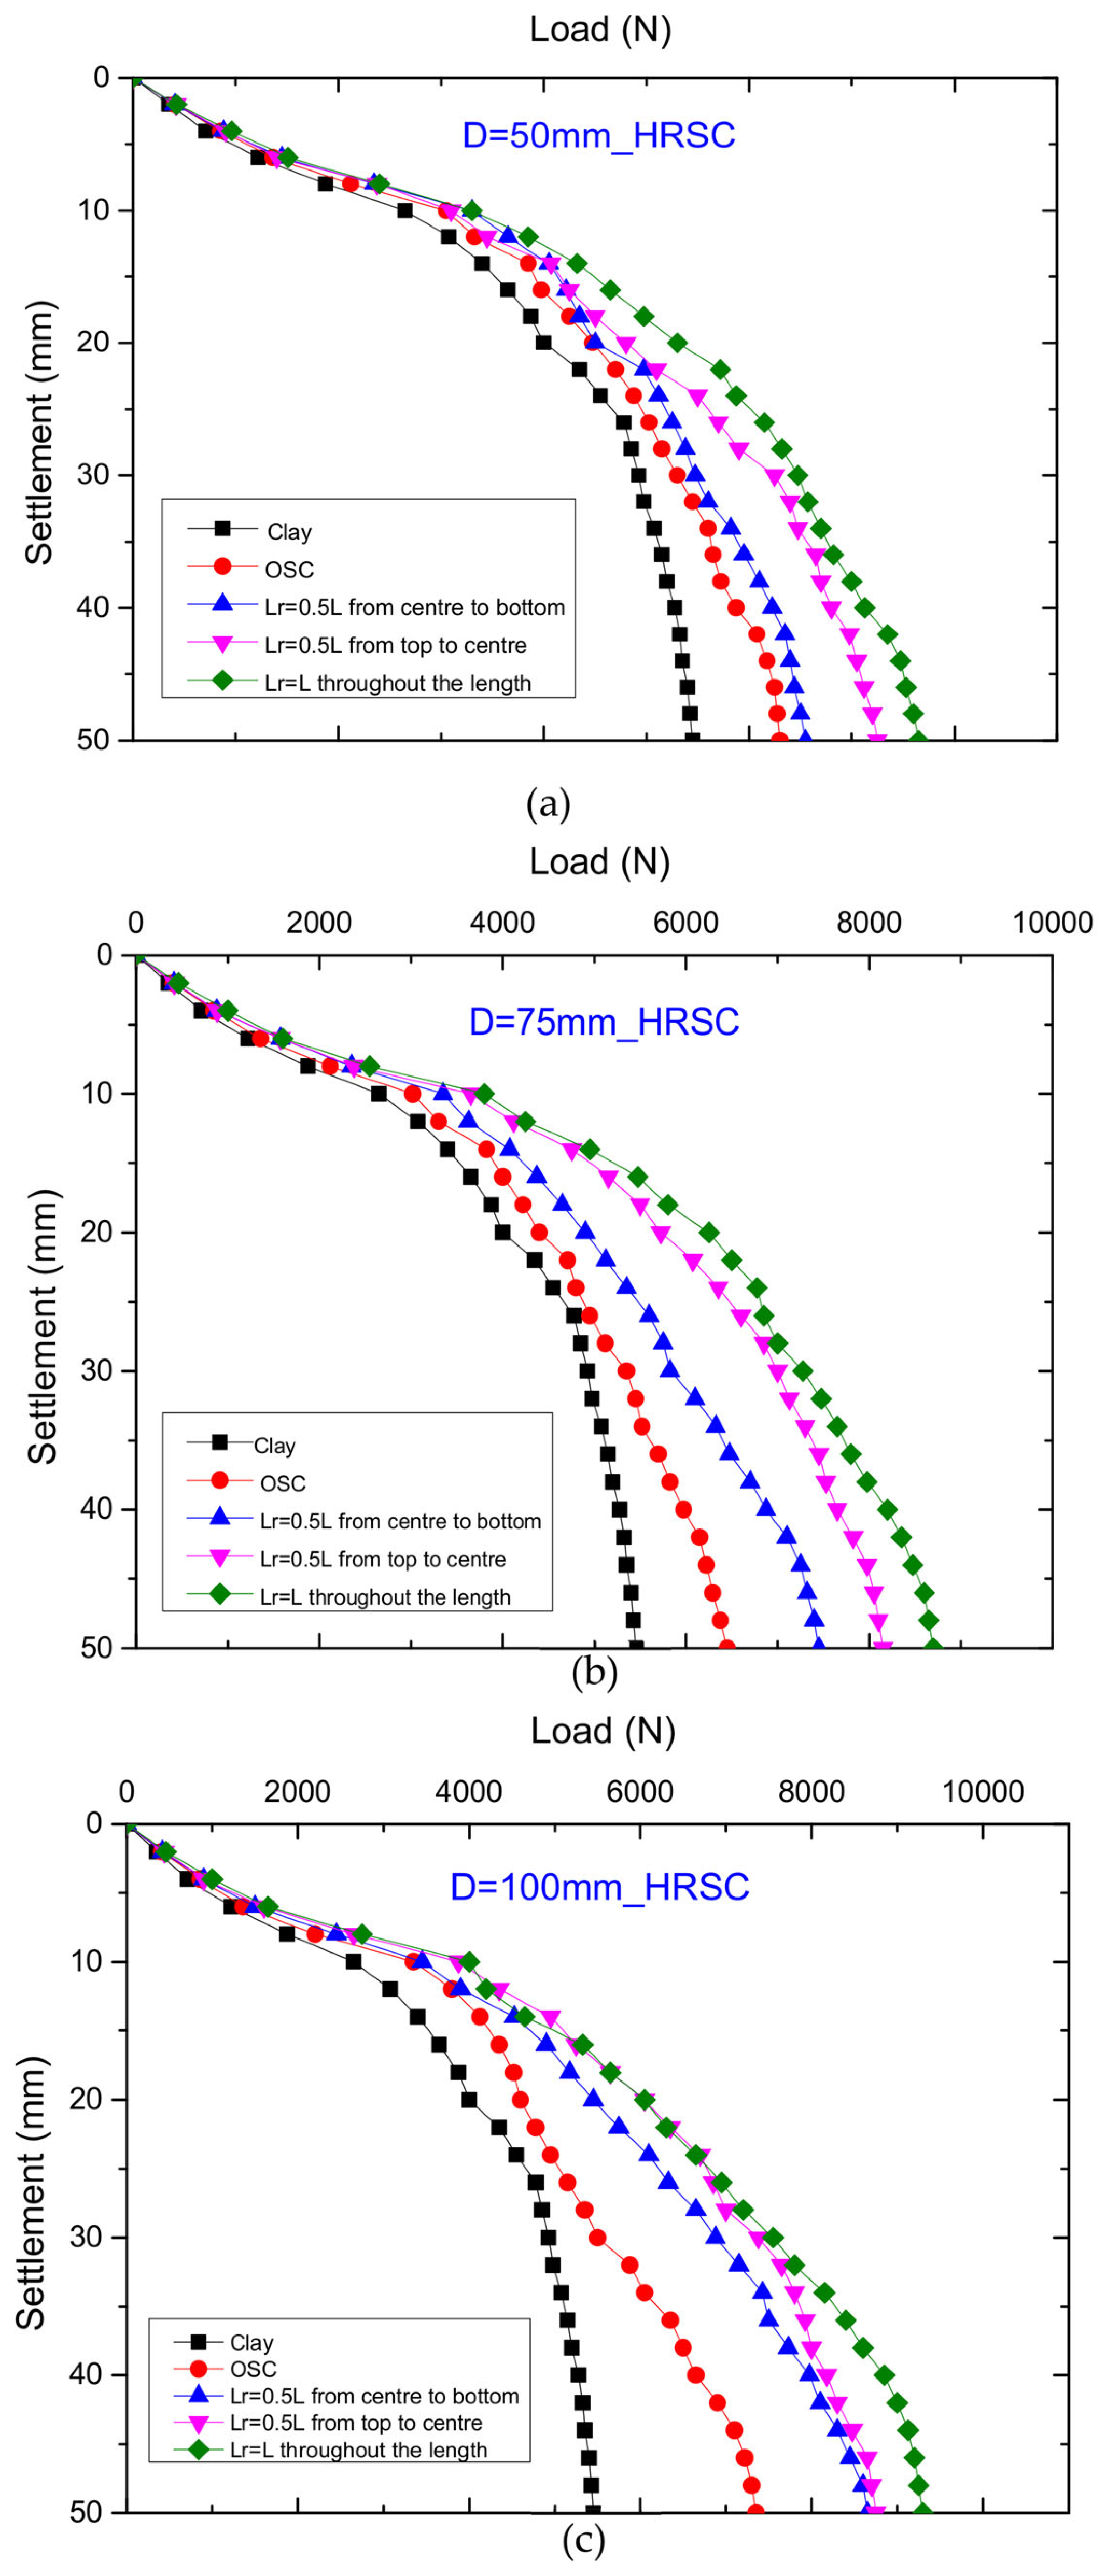
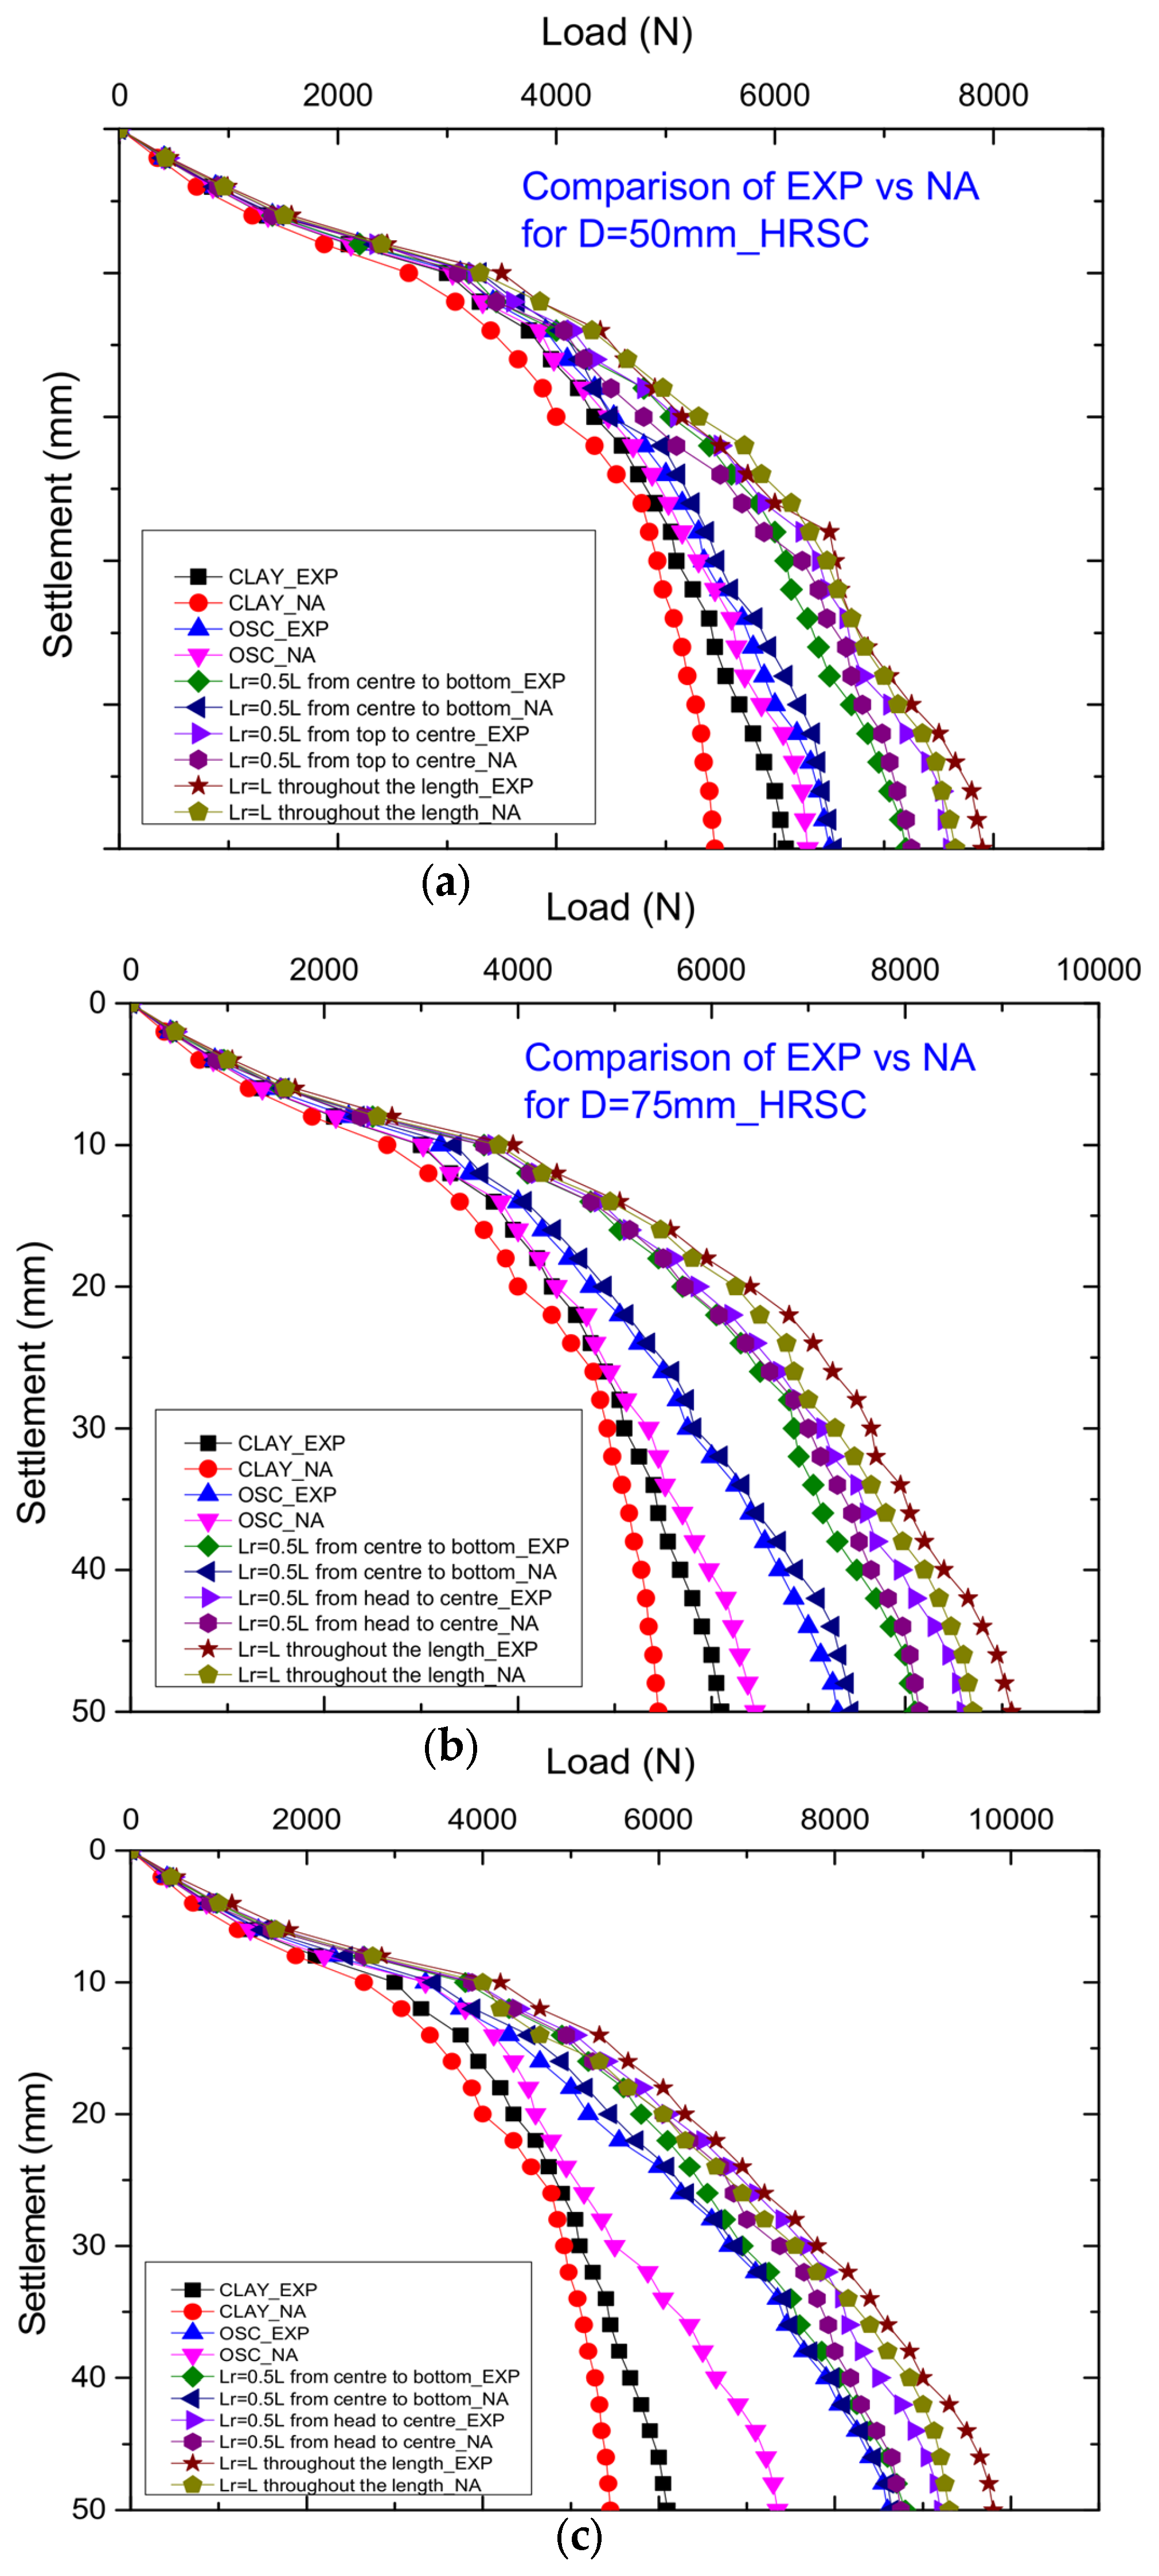
For HRSCs, when Lr = 0.5 L from the centre of the column to the end, the load-bearing capacity was increased by 9.72, 9.87, and 2.27% for D = 50, 75, and 100 mm, respectively, compared to their corresponding OSC values. Similarly, when Lr = 0.5 L from the head to the centre of the column, the capacity increased by 14.14, 15.11, and 6.52%. Moreover, for Lr = L throughout the column length, the percentage increase in capacity was 17.72, 19.78, and 12.24%.

5.4. Load–Settlement Analysis—Numerical Result

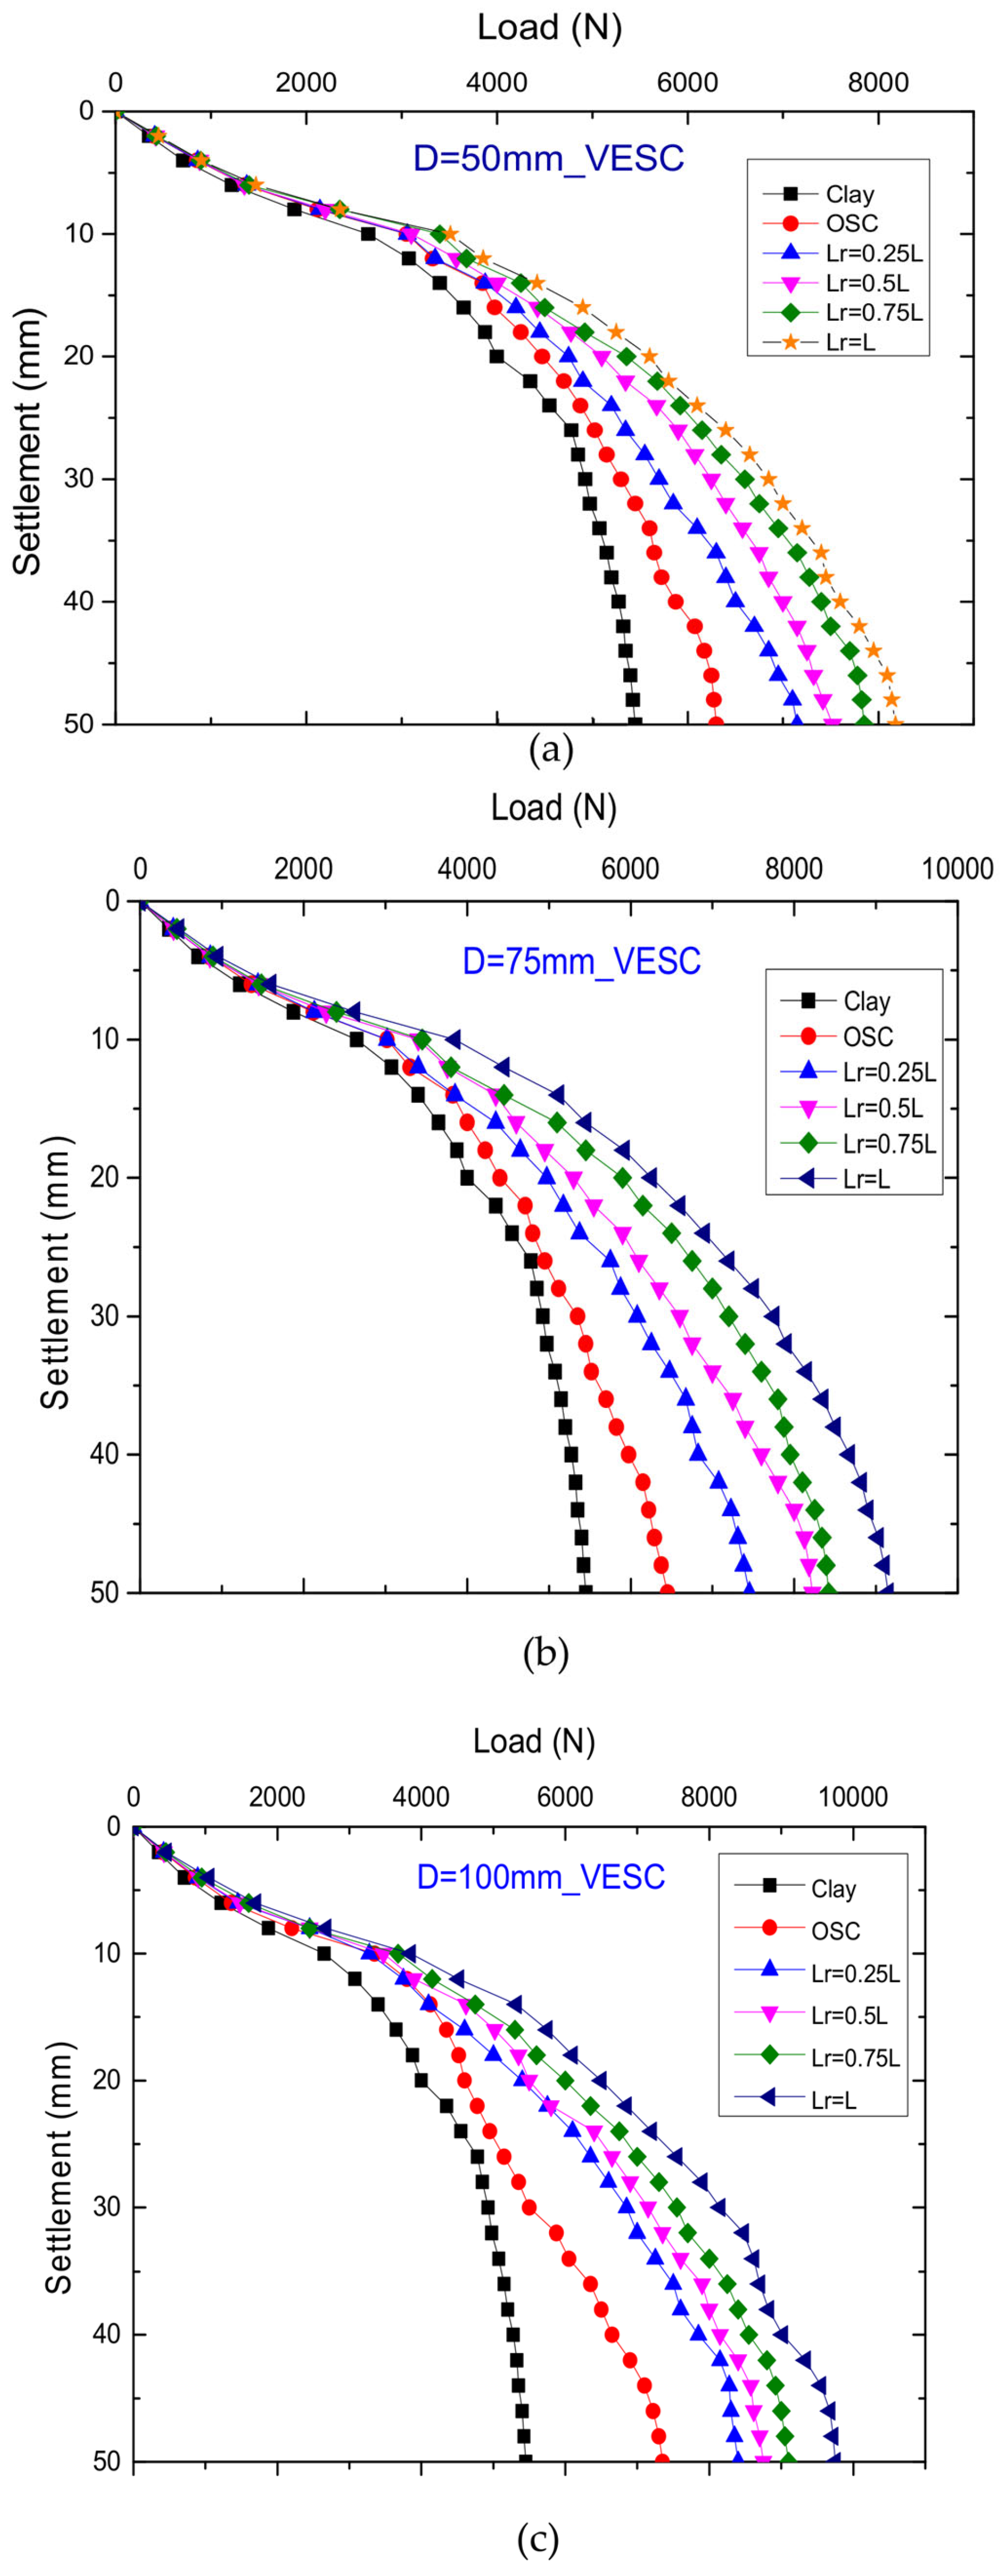
Figure 9a–c and Figure 10a–c depict the load–settlement graphs of VESC and HRSC reinforced columns for three varying diameters (50, 75, and 100 mm) obtained after numerical analysis. For OSCs, the load improvement was 13.49% compared to the unreinforced case. In VESCs, for D = 50 mm, when Lr = 0.25 L, the improvement was 11.88% compared to OSCs. Similarly, for Lr = 0.5 L, 0.75 L, and L, compared to OSCs, the improvement was found to be 16.22, 19.74, and 22.98%, respectively. For D = 75 mm, the load capacity improvement for Lr = 0.25 L, 0.5 L, 0.75 L, and L was calculated as 13.42, 21.53, 23.39, and 29.51%. Likewise, for D = 100 mm, the improvement was 12.5, 16, 19.12, and 24.62% for Lr = 0.25 L, 0.5 L, 0.75 L, and L, respectively, when compared to the OSC results. A comparison with the numerical data obtained by Plaxis 3D was also performed to validate the experimental results.
A similar analysis was conducted for various HRSC cases and compared with the OSC results. For D = 50 mm, when Lr = 0.5 L from the centre of the column to the end, 0.5 L from the column head to the centre, and L throughout the column length, the load improvement was found to be 3.81, 13.10, and 17.65%, respectively. Similarly, the improvements for D = 75 mm were 13.42, 20.86, and 25.86%. For D = 100 mm, the load improvement was calculated as 15.03, 16, and 20.97%. The trend was very similar to that obtained from the experimental results. The slow settlement of stone columns acquired with loads is another interesting finding regarding the FE results. This can be explained by the fact that the geotextile–clay and aggregate–geotextile interfaces were rough, resulting in higher interface stiffness than in the more flexible interfaces used in model testing. Therefore, settlement was observed during loading in the context of finite element (FE) analysis due to the direct transmission of hoop stresses to the base of the column of stone upon contact with the simulated interface of higher stiffness.

6. Comparative Analysis of Experimental and Numerical Outcomes

A comparison with the numerical data obtained by Plaxis 3D was also conducted to validate the experimental results. The failure mechanism was similar in both cases, which can be very well observed from Figure 5 and Figure 6. The deformation was higher in unreinforced soil than reinforced soil (OSC). However, the failure of the OSC was due to bulging, which was controlled by providing an encasement around the OSC. The encasement provided was both vertical and horizontal layering of a geotextile. Both the experimental and numerical analyses exhibited the same trend regarding failure mechanisms.
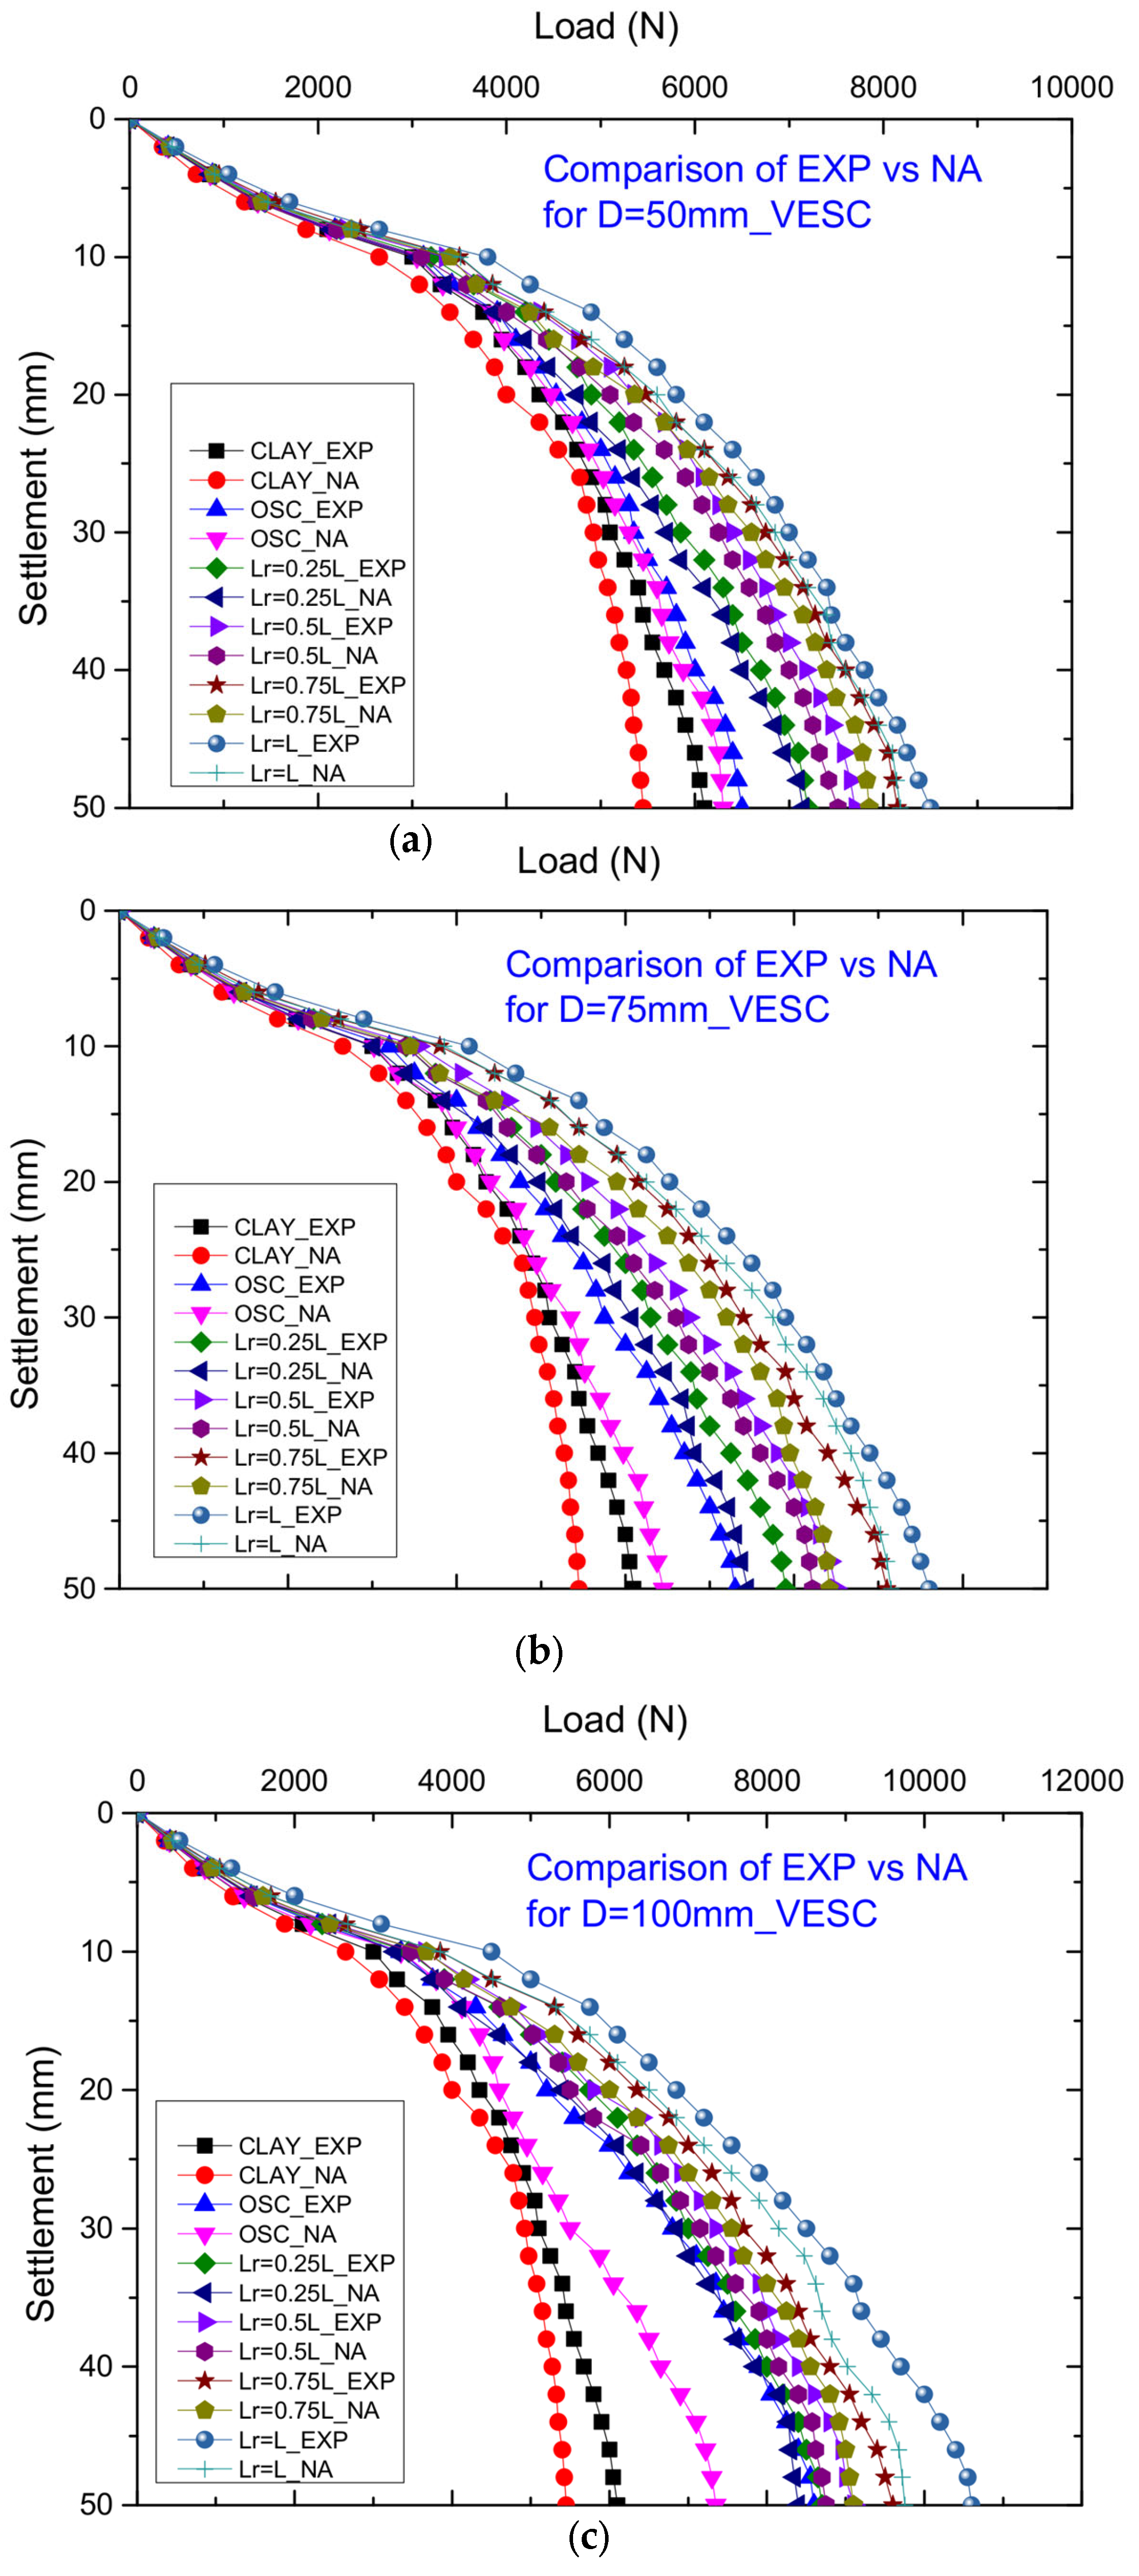
A graph was plotted, as shown in Figure 11 and Figure 12, to study the load–settlement behaviour. A factor, ‘load ratio (LR)’, was devised for an effective comparison; it is defined as the ratio of the load capacity of the experimental results to that of the numerical results. For unreinforced soft soil, the LR value obtained was 1.12. In OSCs, for D = 50, 75, and 100 mm, the LR value was calculated as 1.03, 1.13, and 1.17, respectively. In VESCs, for D = 50 m, Lr = 0.25 L, 0.5 L, 0.75 L, and L, the LR value was found to be 1.006, 1.02, 1.03, and 1.04, respectively. Similarly, for the same length of reinforcement in D = 75 mm, the LR value was calculated as 1.06, 1.03, 1.08, and 1.05. The LR values for D = 100 mm were 1.04, 1.04, 1.05, and 1.09. In the HRSC case, for D = 50 mm, when Lr = 0.5 L from centre to end, 0.5 L from top to centre, and L throughout the length of the column, the LR values were obtained as 1.10, 1.05, and 1.03, respectively. Similarly, for D = 75 mm, the LR values were 1.09, 1.06, and 1.05. Moreover, for D = 100 mm, the LR values were 1.02, 1.05, and 1.05. All the cases in our study revealed a slightly lower value of the load-carrying capacity at 50 mm settlement for the numerical results compared to the experimental results. A potential cause of this issue may be the inherent constraint of replicating stone columns without accounting for the effects of installation, which results in an inability to accurately replicate the altered characteristics of the soil that arise during model testing. Moreover, the Rinter value of 0.8 was used; this is a soil reduction factor that is applied to the strength and stiffness of the interface. Rinter = 1.00 reflects a rigid interface between the structure and the soil; therefore, the nodes of the interface and soil are coupled and show the same behaviour (and deformations). A Rinter value of 0.8 was used to simulate the relative relation at the interface, which resulted in a lower value. Additionally, Table 5 demonstrates that the load-carrying capability, as determined by laboratory testing and numerical analysis, was in accordance, with a maximum 11.08% coefficient of variance (COV).

7. Conclusions

This investigation involved laboratory experiments and numerical analysis conducted on individual stone columns with diameters of 50, 75, and 100 mm. During the testing phase, various lengths of encasement were utilised for VESCs and HRSCs in conjunction with a reinforcing material. The experimental results obtained from these tests were then compared to the numerical analytical findings. Based on the results of the experimental programme, it is possible to draw the following conclusions.
  • The predominant failure mechanism observed in all experiments was ballooning. The occurrence of bulging failure was seen at a depth ranging from D to 2D below the head of the stone column. The occurrence of bulging in the column materials among the reinforcing sections in single HRSCs is limited.
  • Increasing the area replacement ratio for an ultimate settlement of 50 mm increased the load-carrying capability in both the experimental and numerical analysis.
  • For VESCs, the full-length encasement resulted in a higher load capacity of 23.52, 23.95, and 18.86% for D = 50, 75, and 100 mm, respectively, in the experimental results as compared to their OSC results. A similar trend was observed in the numerical results.
  • In HRSCs, when reinforcement was provided for the full length of the column at equal intervals, the load capacity increased by 17.72, 19.78, and 12.24% for D = 50, 75, and 100 mm, respectively, when compared to their OSC values. Similar results were observed for the numerical analysis.
  • Compared to the experimental results, the numerical results showed a slightly lower value for the load-carrying capability at 50 mm settlement, but the values obtained were in good agreement, with a maximum COV value of 11.08%.
  • Compared to partial reinforcements, the most effective HRSCs were seen to have reinforcement sheets provided at equally spaced intervals over their entire length. In the context of VESCs, it was determined that complete encasement (Lr = L) was more effective than partial reinforcement.

Author Contributions

Conceptualization, S.S. and A.K.G.; methodology, S.S. and A.K.G.; software, S.S.; validation, S.S. and A.K.G.; formal analysis, S.S. and A.K.G.; investigation, S.S. and A.K.G.; resources, S.S. and A.K.G.; data curation, S.S.; writing—original draft preparation, S.S.; writing—review and editing, S.S. and A.K.G.; visualization, S.S. and A.K.G.; supervision, A.K.G.; project administration, A.K.G. All authors have read and agreed to the published version of the manuscript.

Funding

This research received no external funding.

Institutional Review Board Statement

Not applicable.

Informed Consent Statement

Not applicable.

Data Availability Statement

All the data have been provided in the current article.

Acknowledgments

The authors acknowledge the lab facility provided by Delhi Technological University, New Delhi, India.

Conflicts of Interest

The authors declare no conflict of interest.

Nomenclature

OSCOrdinary stone column
VESCVertically encased stone column
HRSCHorizontally reinforced stone column
LLength of the column
DDiameter of the stone column
LrLength of the reinforcement
SSpacing between horizontal layers of geotextile
EElastic modulus of soil
γbulkBulk unit weight of soil
γsatSaturated unit weight of soil
cSoil cohesion
φFriction angle of soil
υPoisson’s ratio
EAAxial stiffness of geotextile

References

  1. Choobbasti, A.J.; Zahmatkesh, A.; Noorzad, R. Performance of Stone Columns in Soft Clay: Numerical Evaluation. Geotech. Geol. Eng. 2011, 29, 675–684. [Google Scholar] [CrossRef]
  2. Srijan; Gupta, A.K. A Review article on Construction, Parametric Study and Settlement Behavior of Stone Column. In IOP Conference Series: Earth and Environmental Science; IOP Publishing: Bristol, UK, 2021; p. 796. [Google Scholar] [CrossRef]
  3. Thankur, A.; Rawat, S.; Gupta, A.K. Experimental and Numerical Investigation of Load Carrying Capacity of Vertically and Horizontally Reinforced Floating Stone Column Group. Geotech. Geol. Eng. 2021, 39, 3003–3018. [Google Scholar] [CrossRef]
  4. Munfakh, G.A.; Sarkar, S.K.; Castelli, R.P. Performance of a test embankment founded on stone columns. In Proceedings of the International Conference on Advances in Piling and Ground Treatment for Foundations, London, UK, 2–4 March 1983; pp. 259–265. [Google Scholar]
  5. Yan, J.; Ye, S.L. Simplified method for consolidation rate of stone column reinforced foundations. J. Geotech. Geoenviron. Eng. (ASCE) 2001, 127, 597–603. [Google Scholar]
  6. Elshazly, H.A.; Hafez, D.A.; Mossaad, M.E. Reliability of conventional settlement evaluation for circular foundations on stone columns. Geotech. Geol. Eng. 2008, 26, 323–334. [Google Scholar] [CrossRef]
  7. Guetif, Z.; Bouassida, M.; Debats, J.M. Improved clay characteristics due to stone column installation. Comput. Geotech. 2007, 34, 104–111. [Google Scholar] [CrossRef]
  8. Castro, J.; Sagaseta, C. Deformation and consolidation around encased stone columns. Geotext. Geomembr. 2011, 29, 268–276. [Google Scholar] [CrossRef]
  9. Murugesan, S.; Rajagopal, K. Studies on the Behavior of Single and Group of Geosynthetic Encased Stone Columns. J. Geotech. Geoenviron. Eng. 2010, 136, 129–139. [Google Scholar] [CrossRef]
  10. Fattah, M.Y.; Zabar, B.S.; Hassan, H.A. Experimental Analysis of Embankment on Ordinary and Encased Stone Columns. Int. J. Geomech. 2016, 16, 04015102. [Google Scholar] [CrossRef]
  11. Srijan; Gupta, A.K. Effectiveness of triangular and square pattern of stone column with varying s/d ratio on consolidation be-haviour of soil. In Proceedings of the ASCE India Conference on Challenges of Resilient and Sustainable Infrastructure Development in Emerging Economies, Kolkata, India, 2–4 March 2020; Volume 1, pp. 1648–1654. [Google Scholar]
  12. Murugesan, S.; Rajagopal, K. Geosynthetic-encased stone columns: Numerical evaluation. Geotext. Geomembr. 2006, 24, 349–358. [Google Scholar] [CrossRef]
  13. Srijan; Gupta, A.K. The effect of using a sand column on the expansive soil’s swelling characteristics. J. Curr. Res. Eng. Sci. 2022, 5, 1–6. [Google Scholar]
  14. Mohanty, P.; Samanta, M. Experimental and Numerical Studies on Response of the Stone Column in Layered Soil. Int. J. Geosynth. Ground Eng. 2015, 1, 27. [Google Scholar] [CrossRef]
  15. Liu, S.; Zhang, D.; Song, T.; Zhang, G.; Fan, L. A Method of Settlement Calculation of Ground Improved by Floating Deep Mixed Columns Based on Laboratory Model Tests and Finite Element Analysis. Int. J. Civ. Eng. 2022, 20, 207–222. [Google Scholar] [CrossRef]
  16. Shahu, J.T.; Kumar, S.; Bhowmik, R. Ground Improvement for Transportation Infrastructure: Experimental Investigations on Cyclic Behavior of a Group of Granular Columns. Int. J. Geomech. 2023, 23, 04022309. [Google Scholar] [CrossRef]
  17. Barksdale, R.D.; Bachus, R.C. Design and Construction of Stone Column; Report No. FHWA/R 83/026; National Technical Information Service: Springfield, VA, USA, 1983.
  18. Ali, M. Behavior of Ordinary and Encased Stone Columns End-Bearing and Floating in Soft Clay (Numerical Model). In Proceedings of the International Congress and Exhibition “Sustainable Civil Infrastructures: Innovative Infrastructure Geotechnology”, Cairo, Egypt, 24–28 November 2018. [Google Scholar]
  19. Thakur, A.; Rawat, S.; Gupta, A.K. Experimental study of ground improvement by using encased stone columns. Innov. Infrastruct. Solut. 2021, 6, 1. [Google Scholar] [CrossRef]
  20. Hasan, M.; Samadhiya, N.K. Performance of geosynthetic-reinforced granular piles in soft clays: Model tests and numerical analysis. Comput. Geotech. 2017, 87, 178–187. [Google Scholar] [CrossRef]
  21. Ali, K.; Shahu, J.T.; Sharma, K.G. Model tests on single and groups of stone columns with different geosynthetic reinforcement arrangement. Geosynth. Int. 2014, 21, 103–118. [Google Scholar] [CrossRef]
  22. Hosseinpour, I.; Riccio, M.; Almeida, M.S.S. Numerical evaluation of a granular column reinforced by geosynthetics using en-casement and laminated disks. Geotext. Geomembr. 2014, 42, 363–373. [Google Scholar] [CrossRef]
  23. Greenwood, D.A. Mechanical improvement of soils below ground surfaces. In Proceedings of the Ground Engineering Conference, Institution of Civil Engineers, London, UK, 13 September 1970; pp. 11–22. [Google Scholar]
  24. Priebe, H.J. The design of vibro replacement. Ground Eng. 1995, 28, 31–37. [Google Scholar]
  25. Baumann, V.; Bauer, G.E.A. The performance of foundations on various soils stabilized by the vibro-compaction method. Can. Geotech. J. 1974, 11, 509–530. [Google Scholar] [CrossRef]
  26. Ambily, A.P.; Gandhi, S.R. Behavior of stone columns based on experimental and FEM analysis. J. Geotech. Geoenviron. Eng. (ASCE) 2007, 133, 405–441. [Google Scholar] [CrossRef]
  27. McCabe, B.A.; Nimmons, G.J.; Egan, D. A review of field performance of stone columns in soft soils. Proc. Inst. Civ. Eng. Geotech. Eng. 2009, 162, 323–334. [Google Scholar] [CrossRef]
  28. Shahu, J.T.; Reddy, Y.R. Clayey soil reinforced with stone column group: Model tests and analyses. J. Geotech. Geoenviron. Eng. (ASCE) 2011, 137, 1265–1274. [Google Scholar] [CrossRef]
  29. Liu, K.; Qiu, R.; Yan, T.; Wu, B.; Fan, J.; Yue, F.; Mei, G. Model test of clogging effects on composite foundation of geosynthetic-encased steel slag column. Geotext. Geomembr. 2022, 50, 858–867. [Google Scholar] [CrossRef]
  30. Fan, J.; Rowe, R.K. Effect of subgrade on tensile strains in a geomembrane for tailings storage applications. Can. Geotech. J. 2022, 60, 18–30. [Google Scholar] [CrossRef]
  31. Fan, J.; Rowe, R.K. Effect of subgrade on leakage through a defective geomembrane seam below saturated tailing. Geotext. Geomembr. 2023, 51, 360–369. [Google Scholar] [CrossRef]
  32. Lo, S.R.; Zhang, R.; Mak, J. Geosynthetic-encased stone columns in soft clay: A numerical study. Geotext. Geomembr. 2010, 28, 292–302. [Google Scholar] [CrossRef]
  33. Wood, D.M.; Hu, W.; Nash, D.F.T. Group effects in stone column foundations: Model tests. Geotechnique 2000, 50, 689–698. [Google Scholar] [CrossRef]
  34. Hughes, J.M.O.; Withers, N.J.; Greenwood, D.A. A field trial of the reinforcing effect of a stone column in soil. Geotechnique 1975, 5, 31–44. [Google Scholar] [CrossRef]
  35. Murtaza, H.; Samadhiya, N.K. Experimental and numerical analysis of geosynthetic-reinforced floating granular pies in soft clays. Int. J. Geosynth. Ground Eng. 2016, 2, 22. [Google Scholar]
Figure 1. Schematic representation of (a) OSC, (b) VESCs having different Lr (i) Lr = L (ii) Lr = 0.75 L (iii) Lr = 0.5 L (iv) Lr = 0.25 L, and (c) HRSCs with different geosynthetic positioning (i) Equal interval throughout the depth (ii) Top half—0.5 L from head (iii) Bottom half—from centre to bottom.
Applsci 13 11016 g001
Figure 2. Test tank and stone column installed and reinforced with geosynthetics.
Applsci 13 11016 g002
Figure 3. For a reference case of D = 75 mm and Lr = L, (a) 3D model of the setup; (b) discretization of the model.
Applsci 13 11016 g003
Figure 4. Comparison of vertical load intensity settlement behaviour of end-bearing column.
Applsci 13 11016 g004
Figure 5. Multiple failure mechanisms for a column with a 100 mm diameter: (a) OSC, (b) VESC (i) Lr = L (ii) Lr = 0.75 L (iii) Lr = 0.5 L (iv) Lr = 0.25 L, (c) HRSC (i) Equal interval throughout the depth (ii) Top half—0.5 L from head (iii) Bottom half—from centre to bottom.
Applsci 13 11016 g005
Figure 6. Various failure modes by numerical analysis for 100 mm diameter column: (a) OSC, (b) VESC, (c) HRSC (The colour coding indicates the displacement of the column in the x-direction simulating the bulging of the column).
Applsci 13 11016 g006aApplsci 13 11016 g006b
Figure 7. Experimental result of load–settlement variation of VESCs for various Lr on single stone columns having diameters of (a) 50 mm, (b) 75 mm, and (c) 100 mm.
Applsci 13 11016 g007
Figure 8. Experimental result of load–settlement variation of HRSC for various Lr on single stone columns having diameters of (a) 50 mm, (b) 75 mm, and (c) 100 mm.
Applsci 13 11016 g008
Figure 9. Numerical analysis result of load–settlement variation of VESC for various Lr on single stone columns having diameters of (a) 50 mm, (b) 75 mm, and (c) 100 mm.
Applsci 13 11016 g009
Figure 10. Numerical analysis result of load–settlement variation of HRSC for various arrangements on single stone columns with diameters of (a) 50 mm, (b) 75 mm, and (c) 100 mm.
Applsci 13 11016 g010
Figure 11. Comparison of experimental and numerical results for VESC for (a) D = 50 mm, (b) D = 75 mm, and (c) D = 100 mm.
Applsci 13 11016 g011
Figure 12. Comparison of experimental and numerical results for HRSC for (a) D = 50 mm, (b) D = 75 mm, and (c) D = 100 mm.
Applsci 13 11016 g012
Table 1. Clay’s characteristics.
CharacteristicsValue
Specific gravity (SG)2.56
Plastic limit (PL)27%
Liquid limit (LL)50%
Plasticity limit23%
Shrinkage limit (SL)10%
Maximum dry unit weight17.16 kN/m3
Optimum moisture content19.23%
Bulk unit weight at 26.13% water content18 kN/m3
Unified classification system CL
Undrained shear strength20 kPa
Table 2. Stone column properties.
CharacteristicsValue
Specific gravity2.5
Maximum dry unit weight16.4 kN/m3
Bulk unit weight for the test at 68% relative density15.8 kN/m3
Minimum dry unit weight14.4 kN/m3
Internal friction angle (φ) at 68% relative density42°
Curvature coefficient (Cc)1.10
Uniformity coefficient (Cu)2.14
Unified classification systemGP
Table 3. Attributes of geosynthetics (G).
Tensile modulus from seam tests (kN/m)14.8
Ultimate tensile strength (kN/m)8
Tensile modulus (kN/m)14
Strain at ultimate strength (%)52
Strain at ultimate strength (%) from tests with seam46.5
Ultimate tensile strength from tests with seam (kN/m)7
Table 4. Description of the numerous experimental tests conducted.
Type of ColumnTest DescriptionLength of ReinforcementColumn DiameterTotal Number of Tests Performed
50 mm75 mm100 mm
Solitary Stone ColumnClay 3
Ordinary Stone Column (OSC) 3
Vertically Encased Stone Column (VESC)Lr = L3
Lr = 0.75 L3
Lr = 0.5 L3
Lr = 0.25 L3
Horizontally Reinforced Stone Column(HRSC)Equal interval throughout the depth3
Top half (0.5 L from column head)3
Bottom half (0.5 L from centre to the foot)3
Table 5. Comparison of stone column load capabilities measured experimentally and numerically.
Diameter of Stone ColumnReinforcement TypeReinforcement LengthExperimental Result (kN)Numerical Result (kN)Coefficient of Variation (%)
D = 50 mmOSC 6.506.302.21
VESCLr = 0.25 L7.207.150.49
Lr = 0.5 L7.707.521.67
Lr = 0.75 L8.157.852.65
Lr = L8.508.182.71
HRSCLr = 0.5 L from centre to bottom7.206.556.69
Lr = 0.5 L from head to centre7.607.253.33
Lr = L throughout the length of column7.907.652.27
D = 75 mmOSC 7.306.458.74
VESCLr = 0.25 L7.907.454.15
Lr = 0.5 L8.508.222.37
Lr = 0.75 L9.108.425.49
Lr = L9.609.153.39
HRSCLr = 0.5 L from centre to bottom8.107.455.91
Lr = 0.5 L from head to centre8.608.153.80
Lr = L throughout the length of column9.108.703.18
D = 100 mmOSC 8.607.3511.08
VESCLr = 0.25 L8.708.402.48
Lr = 0.5 L9.108.752.77
Lr = 0.75 L9.609.103.78
Lr = L10.609.755.91
HRSCLr = 0.5 L from centre to bottom8.808.651.22
Lr = 0.5 L from head to centre9.208.753.55
Lr = L throughout the length of column9.809.303.70
Disclaimer/Publisher’s Note: The statements, opinions and data contained in all publications are solely those of the individual author(s) and contributor(s) and not of MDPI and/or the editor(s). MDPI and/or the editor(s) disclaim responsibility for any injury to people or property resulting from any ideas, methods, instructions or products referred to in the content.