Abstract
Images under low-light conditions suffer from noise, blurring, and low contrast, thus limiting the precise detection of objects. For this purpose, a novel method is introduced based on convolutional neural network (CNN) dual attention unit (DAU) and selective kernel feature synthesis (SKFS) that merges with the Retinex theory-based model for the enhancement of dark images under low-light conditions. The model mentioned in this paper is a multi-scale residual block made up of several essential components equivalent to an onward convolutional neural network with a VGG16 architecture and various Gaussian convolution kernels. In addition, backpropagation optimizes most of the parameters in this model, whereas the values in conventional models depend on an artificial environment. The model was constructed using simultaneous multi-resolution convolution and dual attention processes. We performed our experiment in the Tesla T4 GPU of Google Colab using the Customized Raw Image Dataset, College Image Dataset (CID), Extreme low-light denoising dataset (ELD), and ExDark dataset. In this approach, an extended set of features is set up to learn from several scales to incorporate contextual data. An extensive performance evaluation on the four above-mentioned standard image datasets showed that MSR-MIRNeT produced standard image enhancement and denoising results with a precision of 97.33%; additionally, the PSNR/SSIM result is 29.73/0.963 which is better than previously established models (MSR, MIRNet, etc.). Furthermore, the output of the proposed model (MSR-MIRNet) shows that this model can be implemented in medical image processing, such as detecting fine scars on pelvic bone segmentation imaging, enhancing contrast for tuberculosis analysis, and being beneficial for robotic visualization in dark environments.
1. Introduction
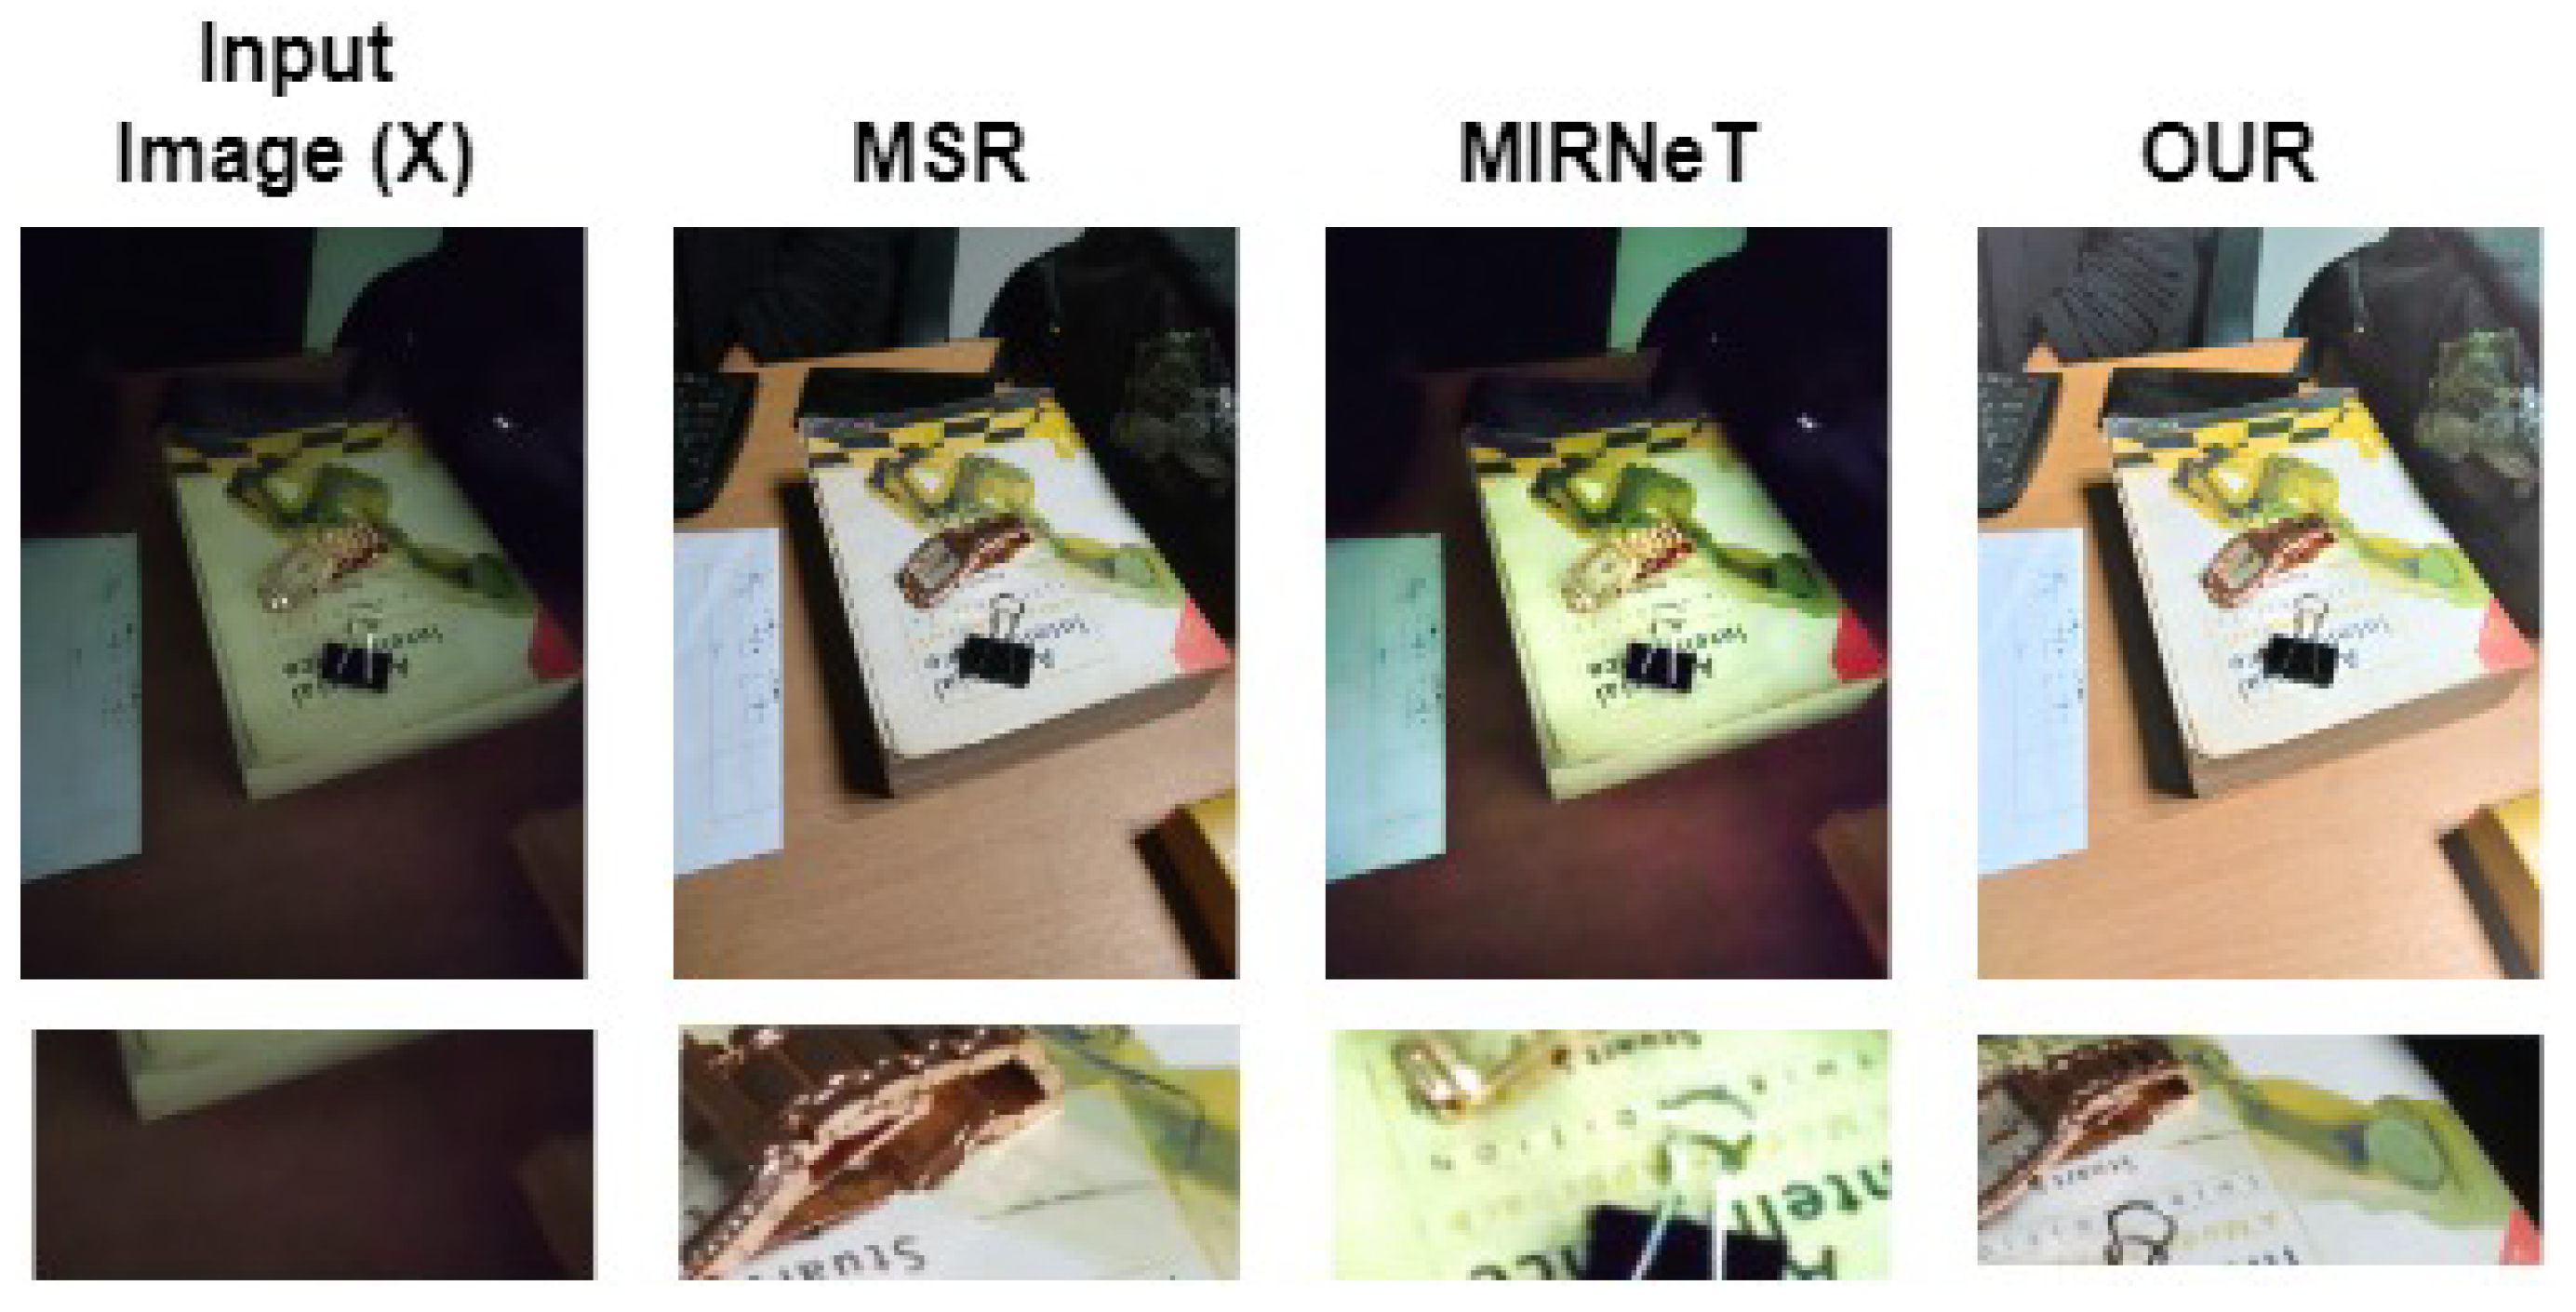
Many industries, such as photography, security, medical imaging, remote sensing, and many others use image restoration to restore high-quality visual content from damaged versions. Image enhancement methods concurrently adjust a given dark input image’s color, contrast, brightness, and noise. Typically, two types of existing deep learning models are used for image enhancement, denoising, or deblurring, namely the encoder-decoder model [1] and/or high-resolution (single-scale) feature processing [2,3]. Some of the limitations of the published methods are shown in Figure 1. The MSR model [4] optimizes the maximum parameters through backpropagation instead of depending on artificial environments. However, in the MIRNeT [5] model, the output images exhibit blurring issues and color degradation, as shown in Figure 1. The authors of [5] focused mainly on improving image contrast and brightness using the predicted illumination map. However, the noise in dark images is unavoidable and cannot be neglected while enhancing the image.
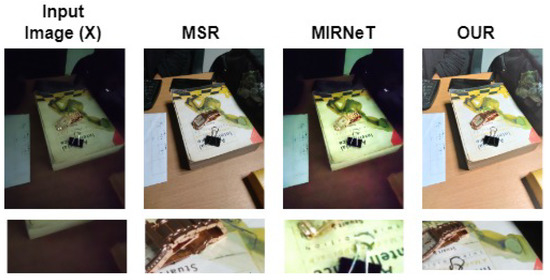
Figure 1.
Some limitations of published methods for image enhancement, Input image, MSR [4], MIRNeT [5], MSR-MIRNeT (Our proposed).
The major limitations during image enhancement processes are color degradation, noise, blurring issues due to perceptual losses, long exposure of the camera lens, object movement, inadequate light, hardware limitations, and many others. In particular, if image enhancement is performed before image denoising, then image deblurring may occur. Some strategies directly employ the denoising procedure as a distinct component of their enhancement pipeline to suppress low-light image noise (attention-based). However, there are some contradictions when applying a cascade in image enhancement and denoising procedures. In recent years, enormous research has been done to overcome the aforementioned limitations during image enhancement. For example, Olivier et al. [6] proposed a model for capsule endoscopic image contrast enhancement, where the combination of two different algorithms enhanced darker parts of the endoscopy image using the weighted bilinear algorithm of half units (HWB) and the threshold weighted bilinear algorithm (TWB) which excludes excess exposure and increases specular highlight spots.
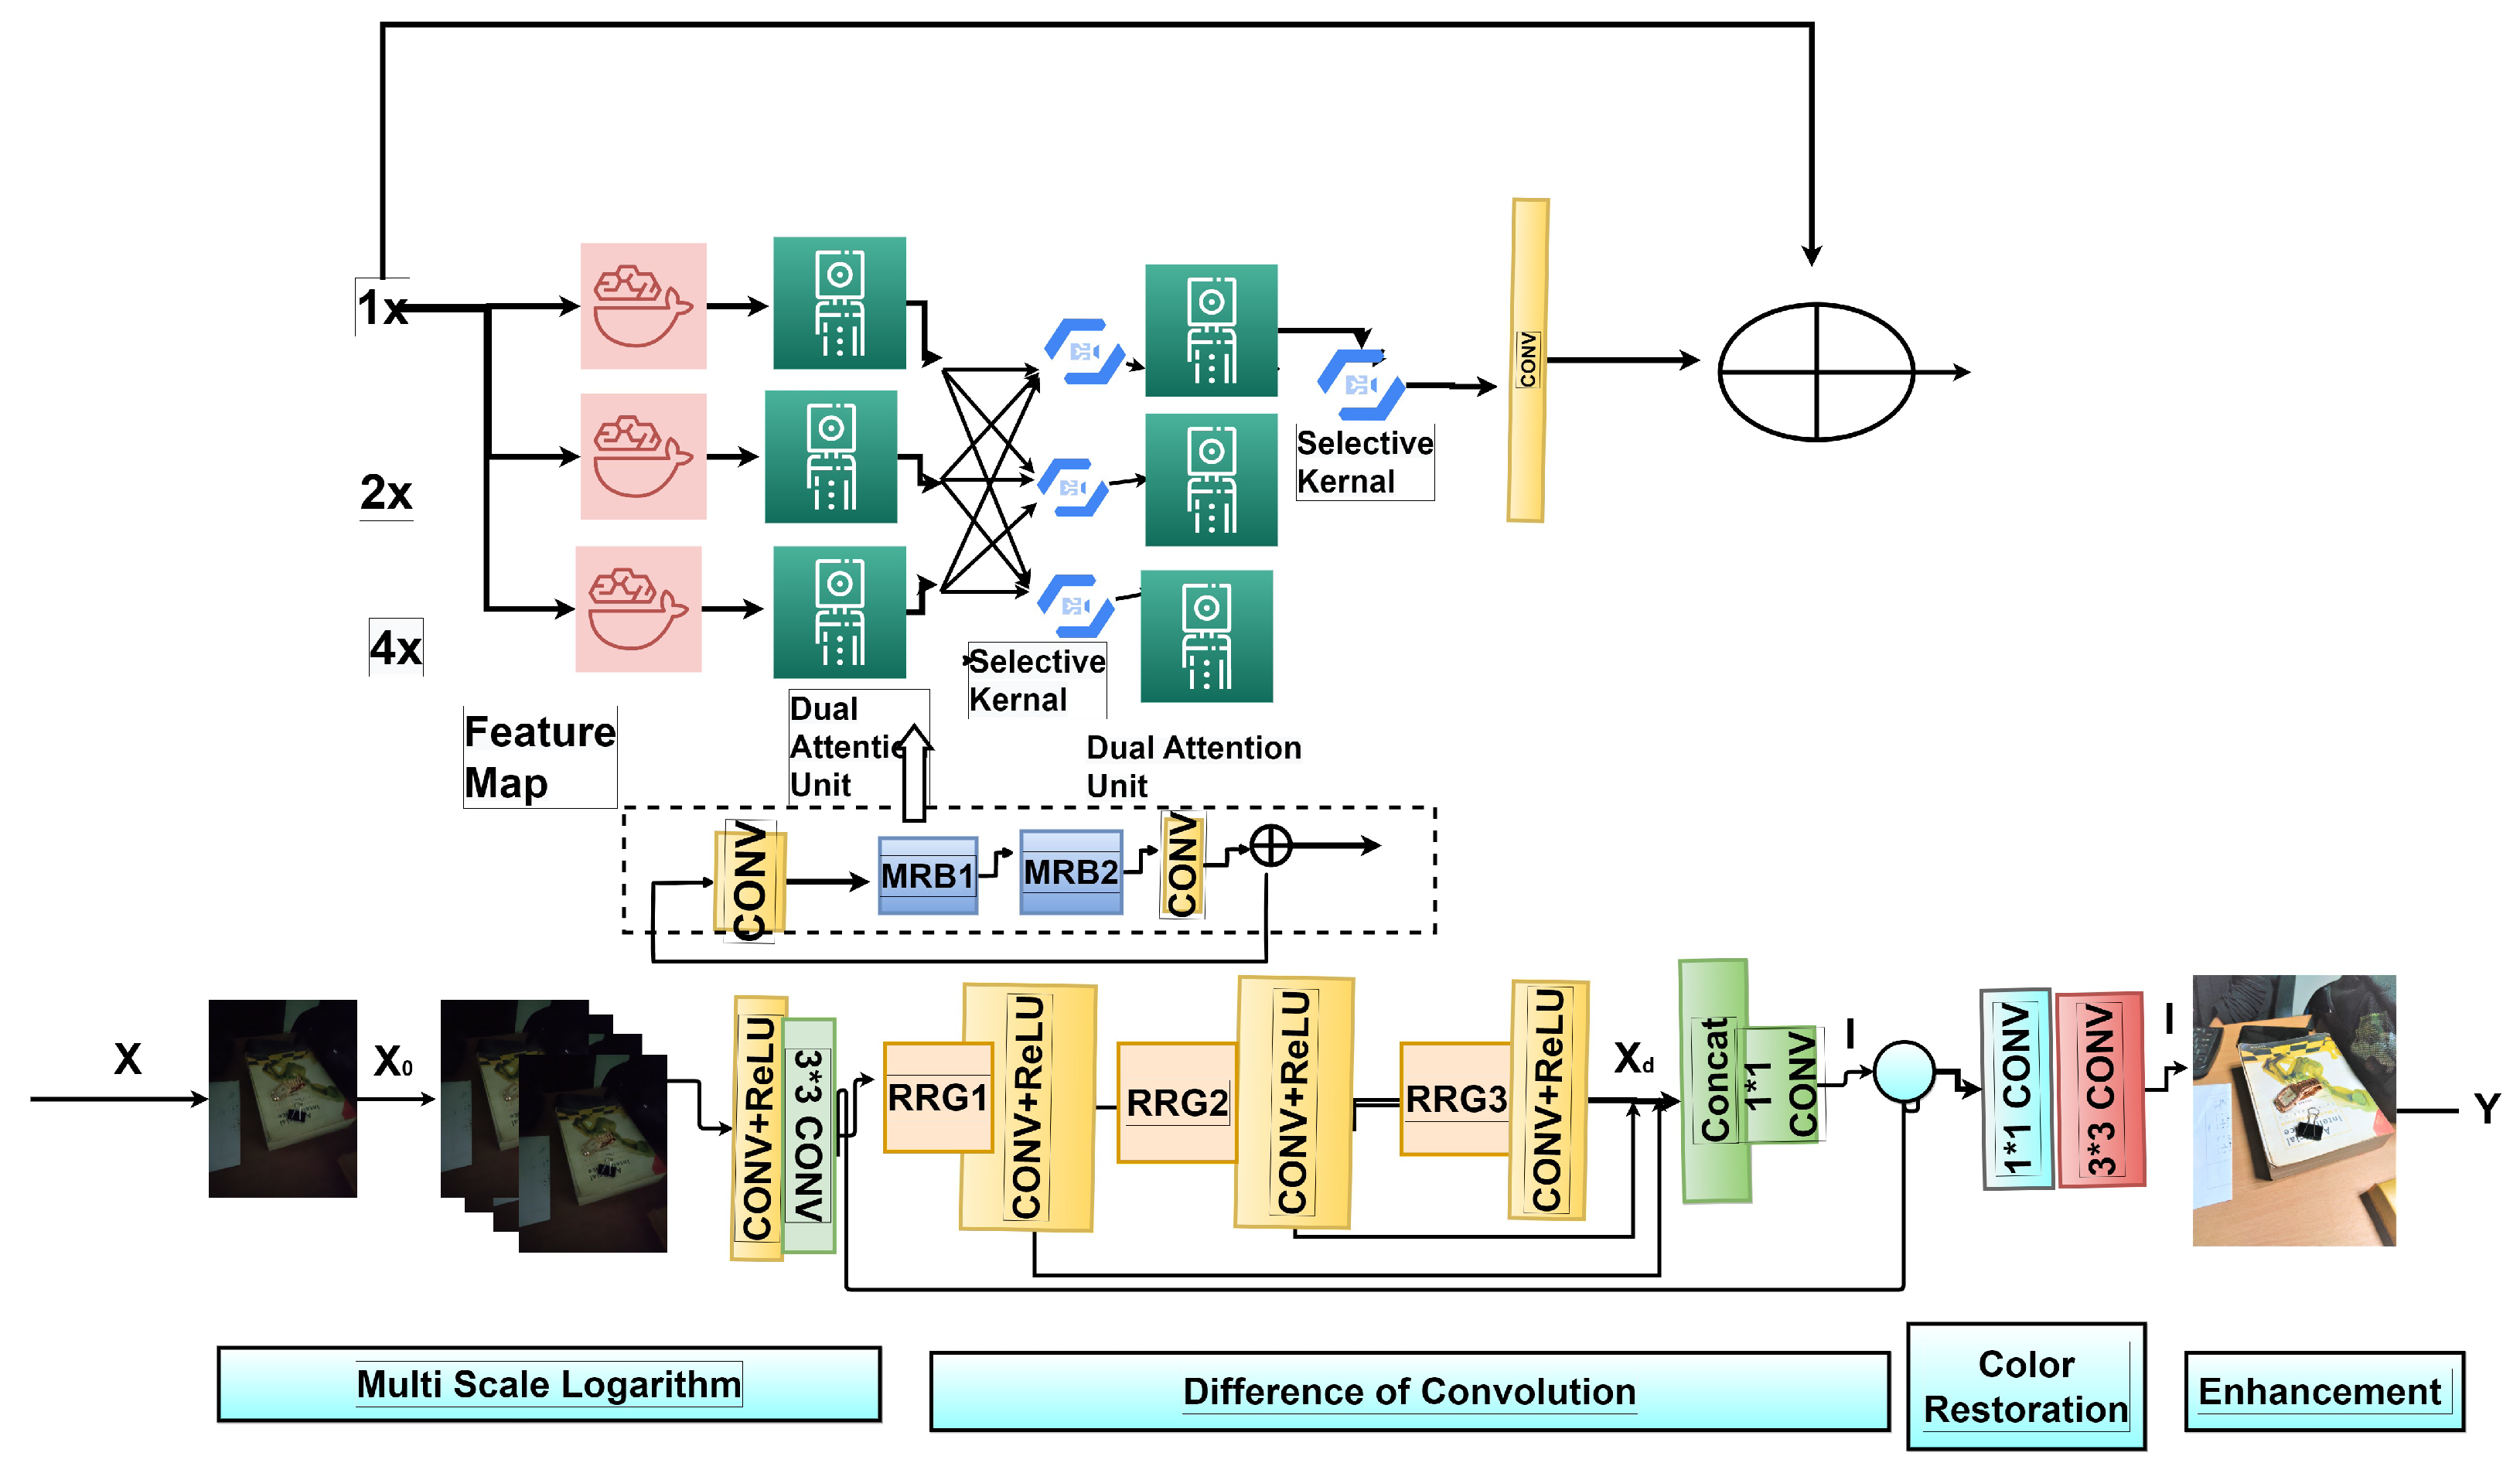
In our proposed model (MSR-MIRNET) the previously established models MSR [4] and MIRNet [5] are combined, in which image denoising and enhancement are performed simultaneously with slight limitations of deblurring. The novelty of our method is that extracted features are aggregated and concatenated with a full convolution layer of the VGG16 model and upgrade the color restoration using multiple logarithmic transformations. From previous studies of some conventional methods [4,5,7], it has been found that these models contain limitations in terms of blurring and unrealistic color formation. Thus, the Retinex-based model [8] is applied to multiple extracted features from dark input images and merges these features with the full CONV layer, which enriches the realistic color sensation. Then, the isolation to a specific range is limited followed by sharing contextual information in a top-down manner. Consequently, selective kernel feature synthesis is conducted through information sharing in both fine-to-coarse network loops on each stream. Our fusion technique dynamically selects the actual kernel sets from individual subdivision representations using a self-attention method, whereas recently established methods only concatenate or average features from multiresolution divisions. Furthermore, to maintain the same number of channels as in the input feature map, a CONV layer is applied. Finally, a CONV layer is used to denoise the output picture and restore color. The diagram of our proposed model is shown in Figure 1.
2. Literature Review
Image enhancement and denoising are the most prominent topics in computer vision. The two main types of low-light picture enhancement are histogram-based approaches and Retinex-based methods. Histogram Equalization (HE) is the first classification approach [8,9] for image enhancement. The second category is based on the Retinex hypothesis, which contends that light and reflection make up an image. Land [10] introduces the Retinex hypothesis to describe how the human visual system perceives color.
2.1. Image Enhancement
Deep learning has recently seen considerable success in the fields of low-level image processing, modeling, and interpretation of nocturnal scenes. The authors in [7] have presented an elaborate overview and pragmatic guide of deep learning applications in dark image enhancement for beginners to advanced level researchers. The authors represented a performance analysis of available deep learning algorithms and established methodologies based on standard datasets. The Deep Retinex-Net [11] enhanced images using deep decomposition and trained a model from end to end, including Enhance-Net for illumination adjustment and Decom-Net for decomposition. According to the Retinex theorem [7], there are two types of image classification, illumination, and reflection:
where I and r represent the captured input image and the intended recovery of the output image, respectively. In natural vision science, the single-scale Retinex is based on the center/surround (SSR) [5]. The mathematical form of this is given in Equation (2).
RED-Net architecture was introduced [12], where the image was first enhanced by increasing contrast using an Image Contrast Enhancement Network (ICE-Net) and then reduced noise using a Re-Enhancement and Denoising Network (RED-Net). However, this model is not compatible with sequential or bracketing images. Furthermore, the researchers concentrated on image enhancement by improving parameter-decomposition, denoising, and contrast enhancement. From this, R2RNet [9] was developed. This method consists of Decom-Net, Denoise-Net, and Relight-Net. Many of these learning techniques rely on conventional denoising techniques when they do not expressly include these. Another cutting-age method for image processing is using Generative Adversarial Nework [13], where the fine details of low quality images are restored using the combination of multi-scale Retinex color reproduction and adaptive histogram equalization. Our method, considering the impacts of noise, uses dual attention plots with SKFF [14] to direct the boost and denoising processes. Therefore, our approach is compatible with current learning-based approaches.
2.2. Image Denoising
Conventional cameras frequently produce less detailed images due to object movement, device shaking, low light, Hardware limitations, etc. There are many existing works for image denoising. BM3D [15] and Poisson Noise Reduction (PNR) [16] are examples of filter-based and deep learning-based approaches for Gaussian denoising. CBDNet [17] offers a convolutional blind denoising network for mixed Gaussian Poisson denoising by adding asymmetric learning. By using both synthetic and real-world pictures for training, CBDNet may be applied to real noisy images. TWSC [18] creates a trilateral weighted sparse coding technique for real-world image denoising. In their two-step methodology, Chen et al. [19] include noise distribution estimation with Generative Adversarial Networks (GANs) and denoising with CNNs. Blurring will arise if image enhancement occurs before image denoising. Hence, our approach simultaneously conducts enhancement and denoising to prevent this. Retinex is a unique base point for a multi-scale low-light image-enhancing technique as a FeedForward convolutional neural network with several Gaussian convolution kernels.
To overcome the previously mentioned limitations, it is suggested that a convolutional neural network (MSR-MIRNeT) that directly learns a mapping between dark and bright images from beginning to end with multi-scale logarithmic transformation and recursive residual block, which has been verified to achieve better performance in practice.
2.3. Our Contributions
Previous studies have shown that there are many ways to improve image enhancement, including denoising, deblurring, and color upgrades. Our proposed approach can be summarized as follows:
- Propose a novel method where isolation is first limited to a specific range and then contextual information is shared in a descending way.
- Selective kernel feature synthesis is conducted through information sharing in both fine-to-coarse network loops on each stream. Our fusion technique dynamically selects actual kernel sets from individual subdivision representations using a self-attention method, whereas recently established methods only concatenate or average features from multiresolution divisions.
- Apply a CONV layer to maintain channel sequences in the input feature map, Finally, a CONV layer is used for output picture denoising and color restoration.
- Use a custom real-world data-based Image Enhancement in Low-Light Condition-IELLc dataset to compare the state of the art (SoA) between our method and previous methods where our results outperformed previous SoA methods.
3. Methodology
3.1. Proposed Architecture MSR-MIRNeT
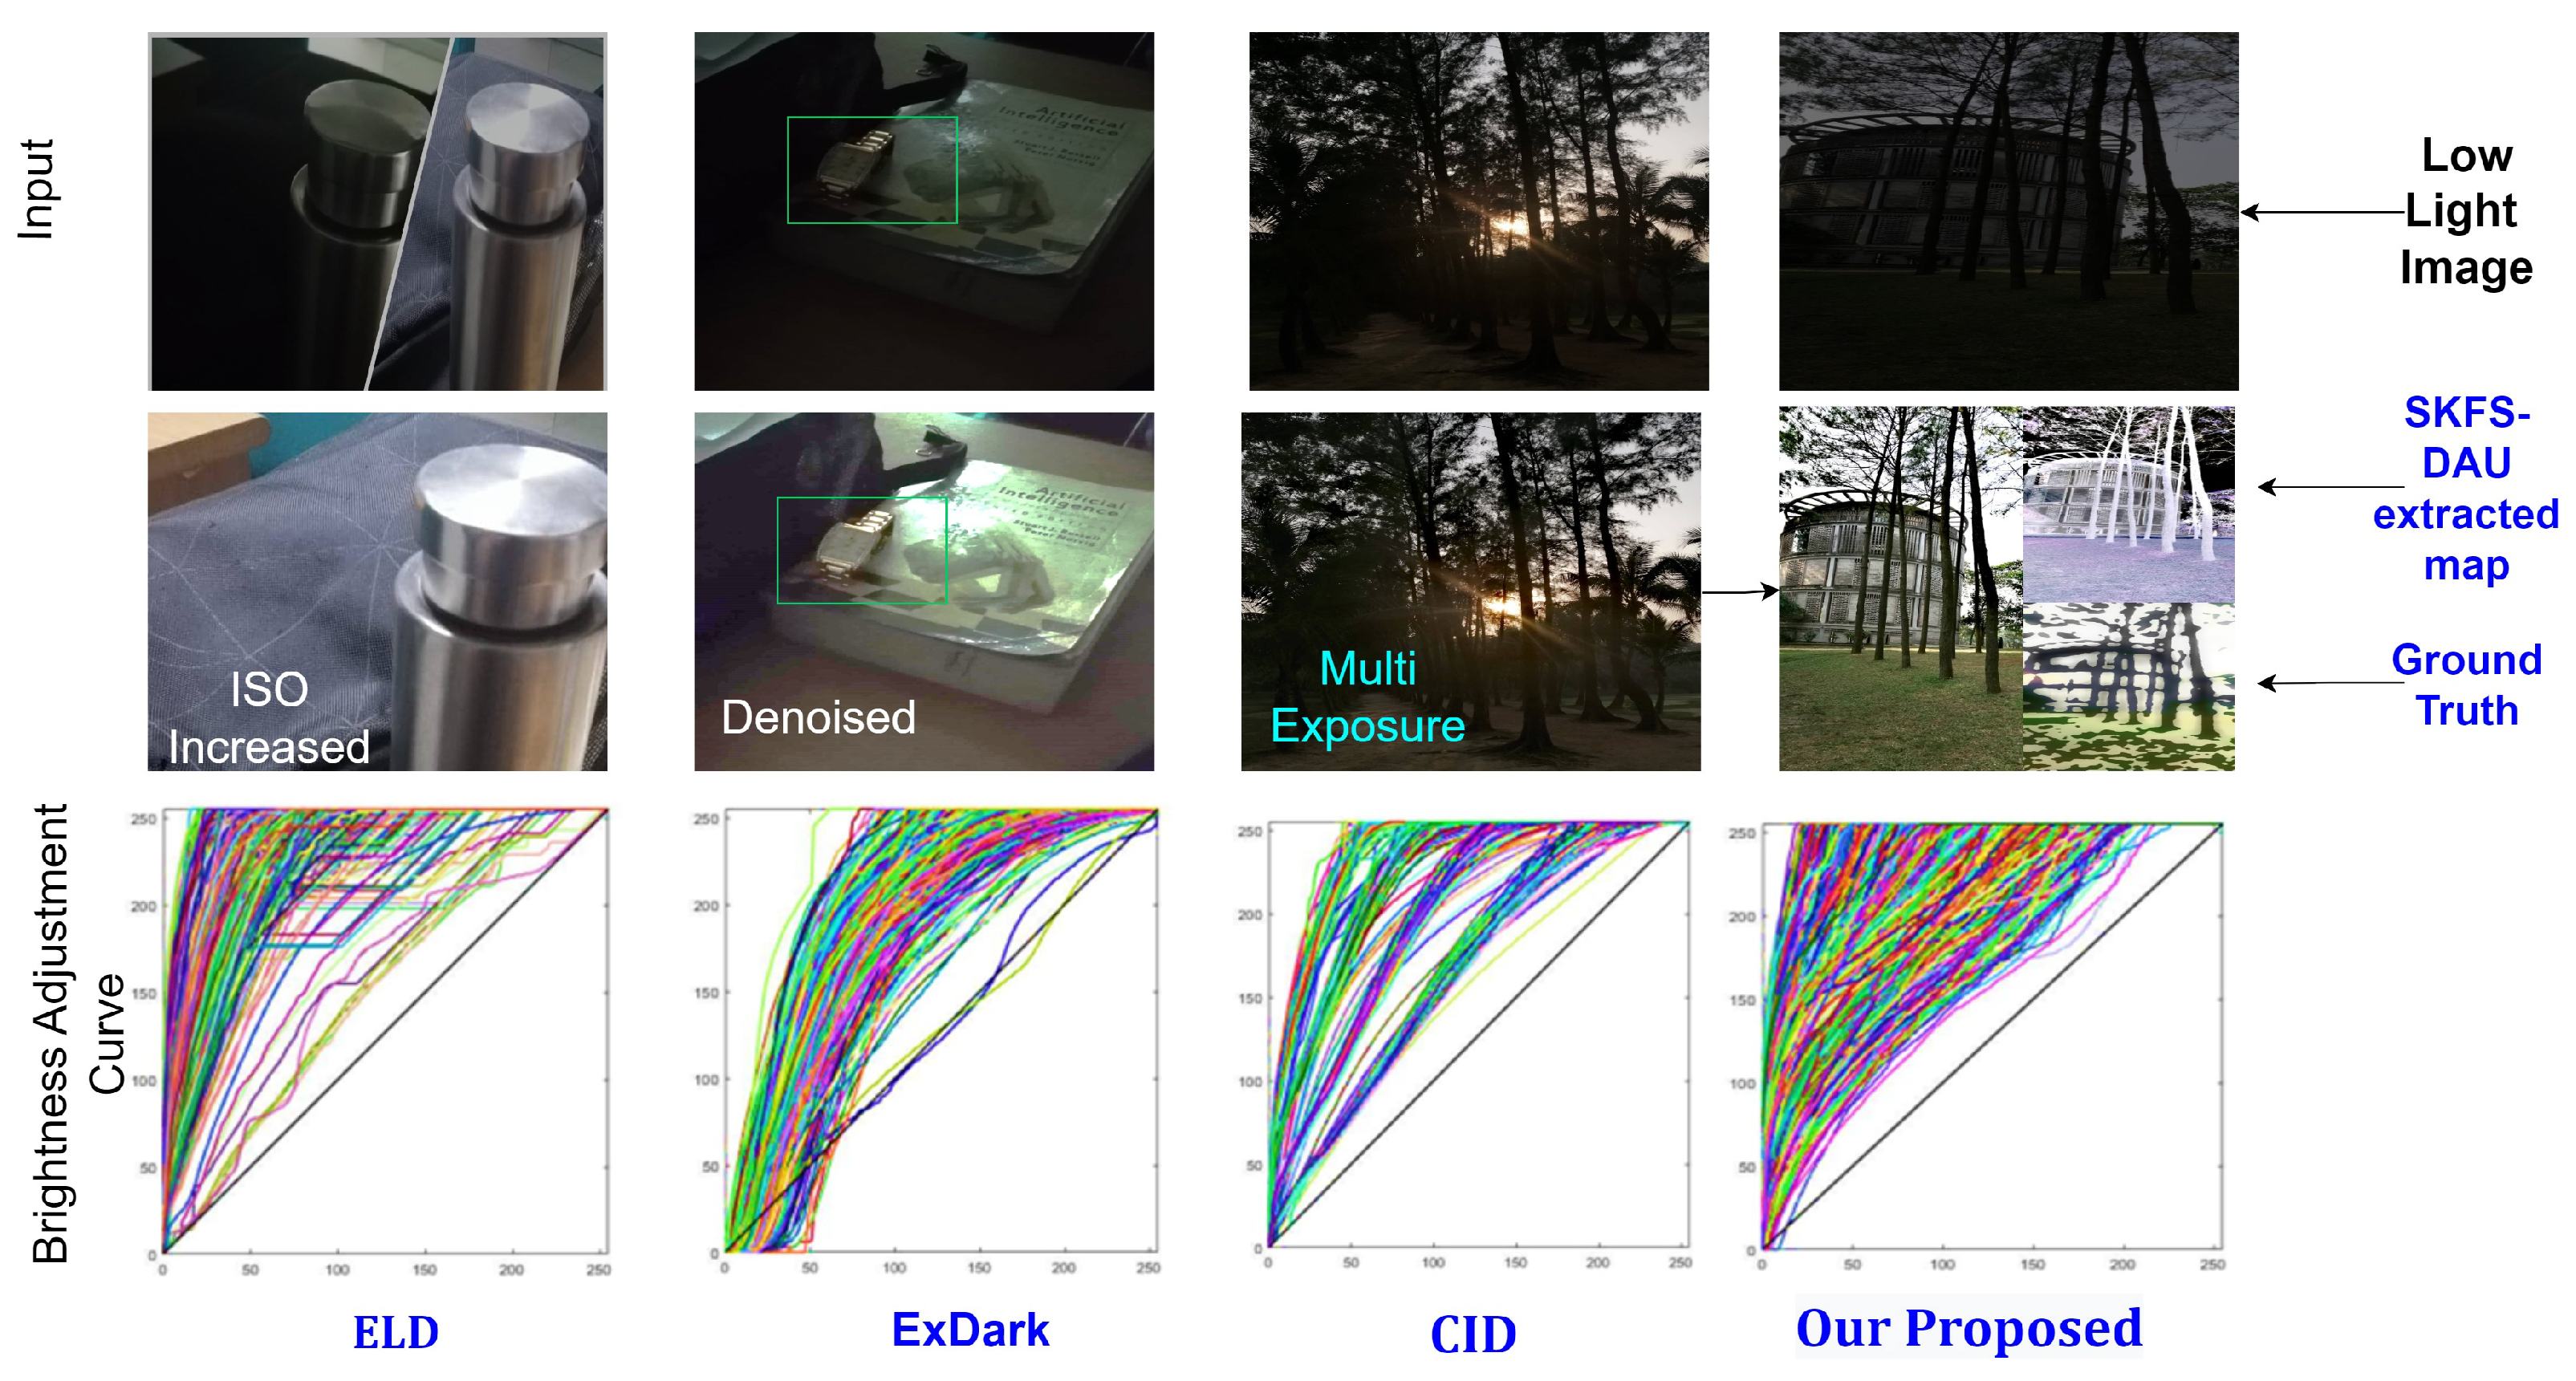
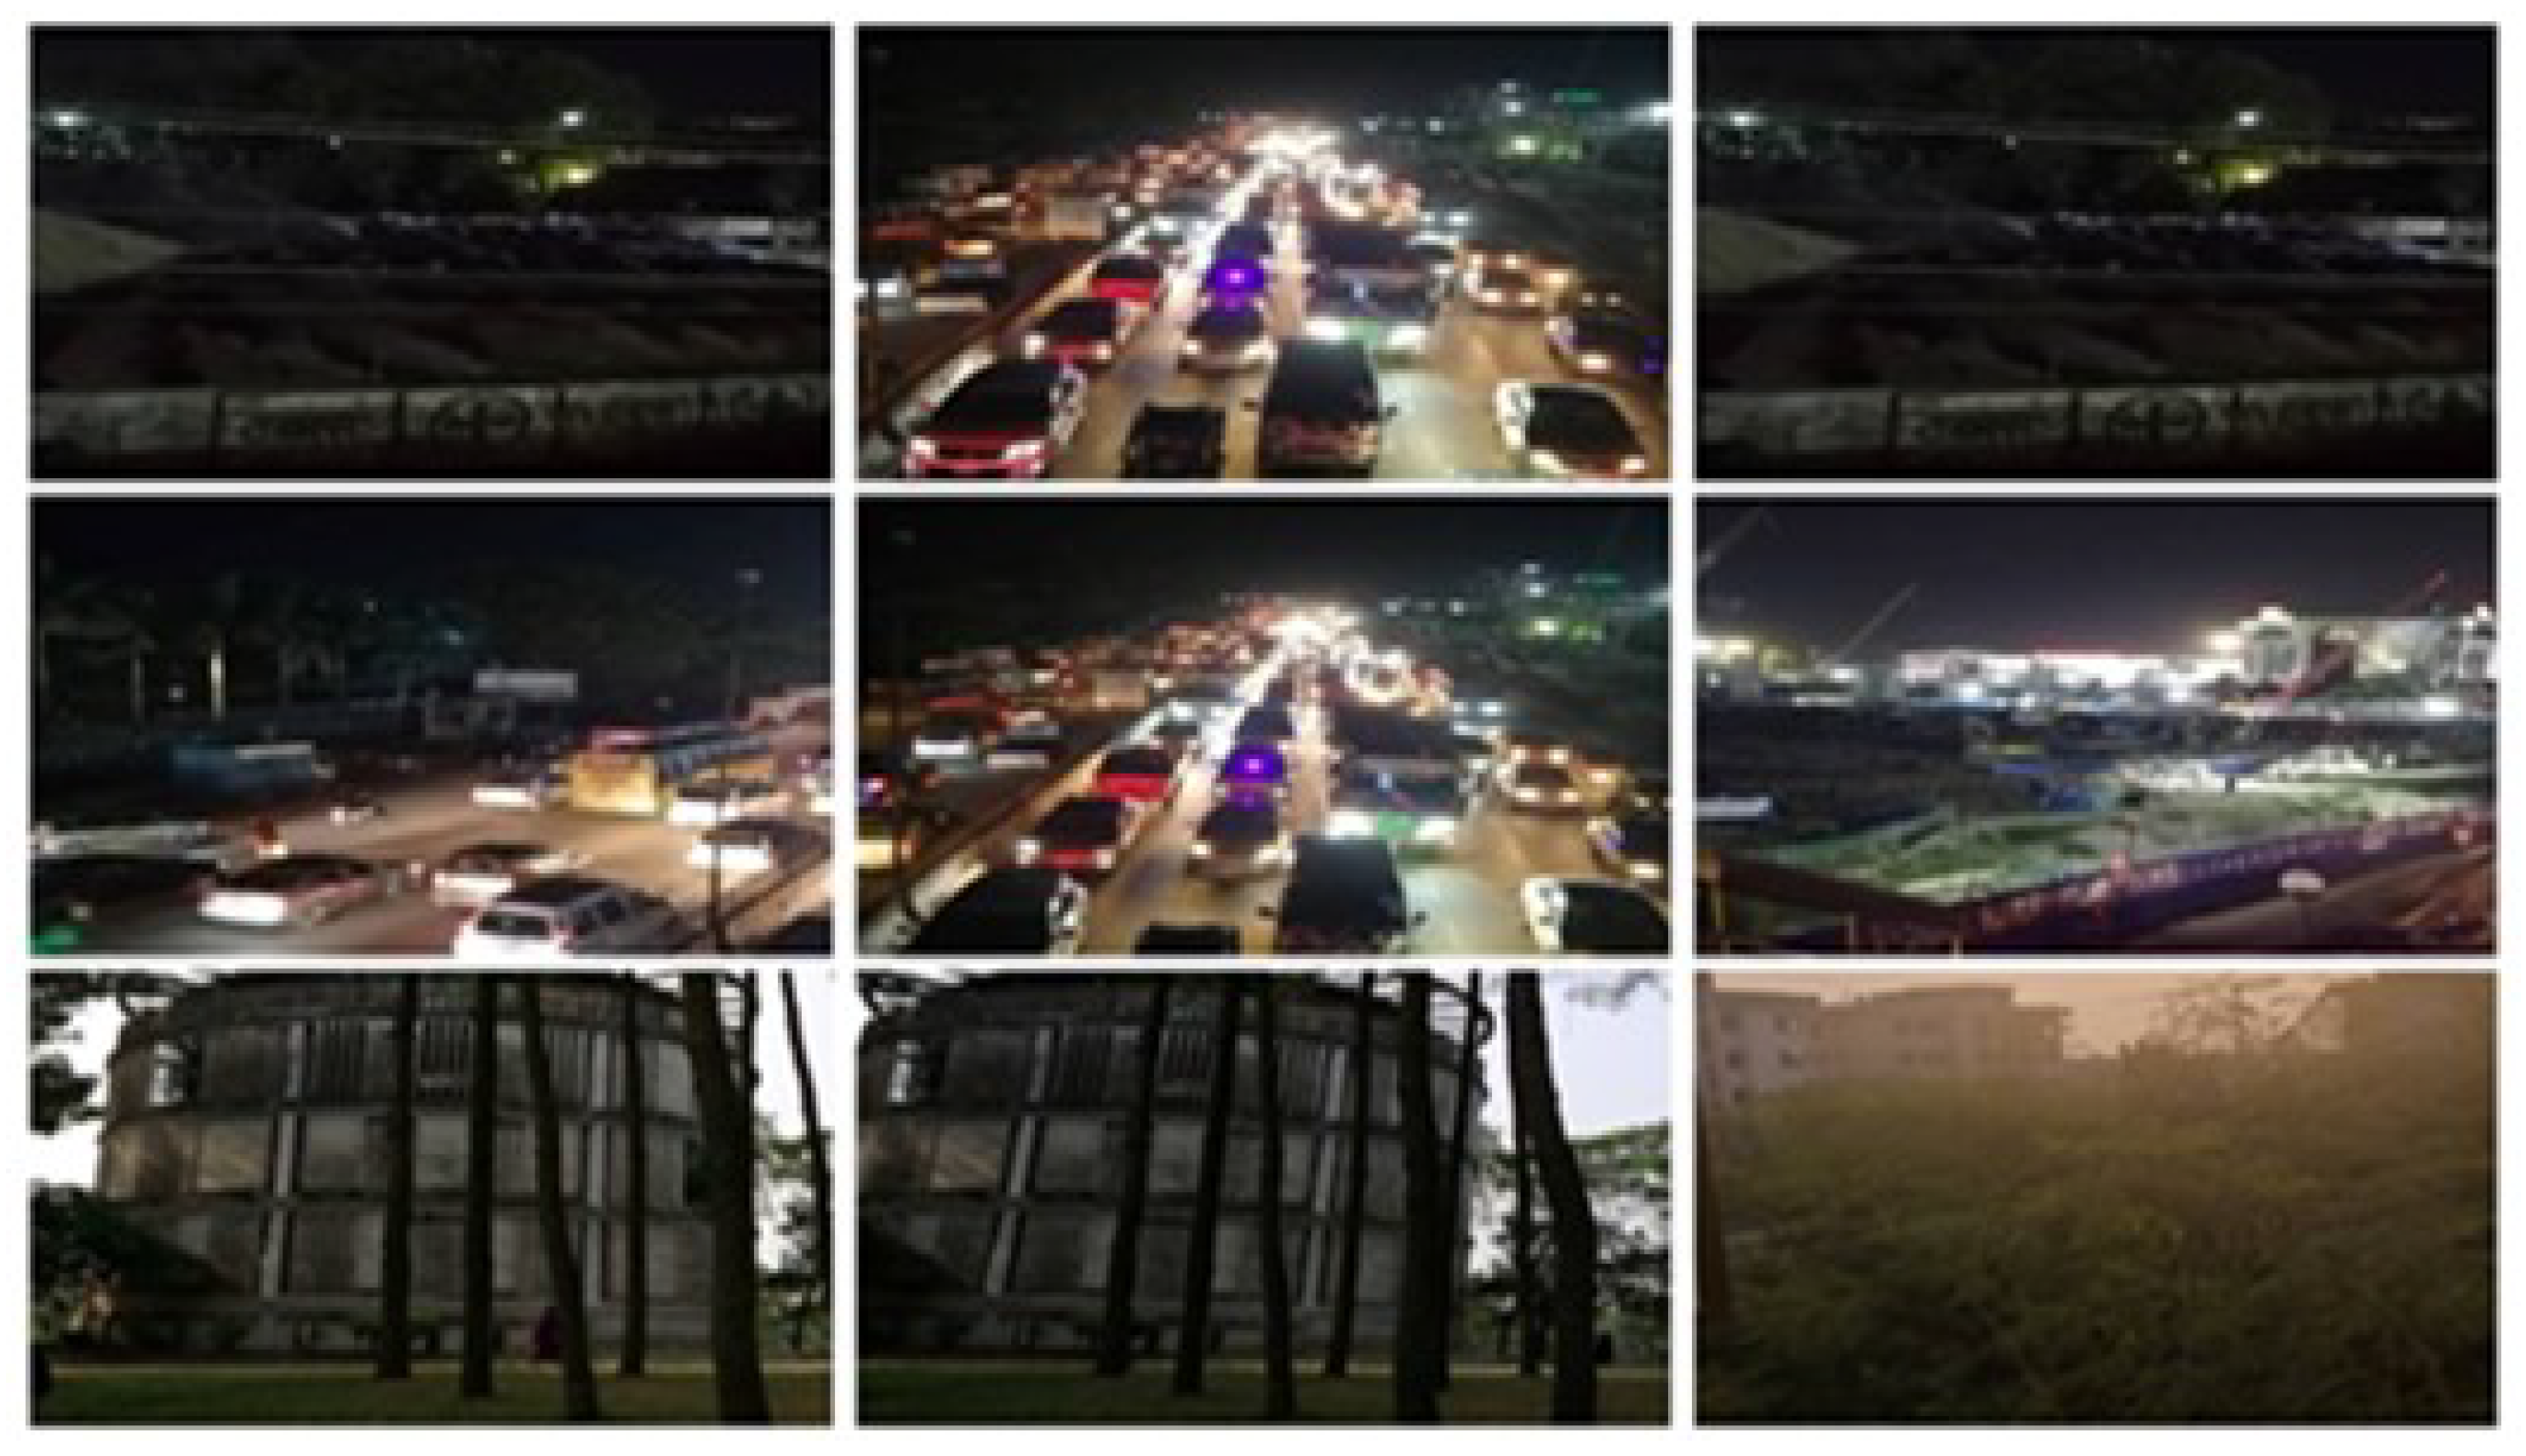
Before training the proposed MSR-MIRNeT hybrid model, the MSR [4] and MIRNeT [5] models are trained and obtained output images based on our ground-truth image, as shown in Figure 2. The schematic architecture of our proposed hybrid MSR-MIRNet model is represented in Figure 3.
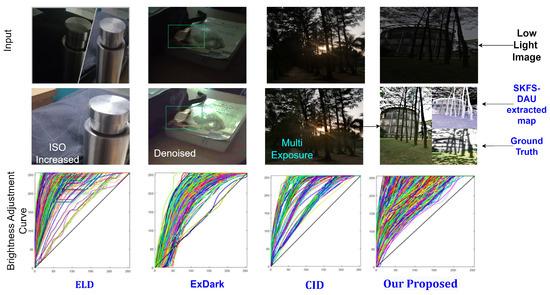
Figure 2.
Visual comparison of low-light enhancement approaches, ELD [20], ExDark [15], CID [21], Our proposed model output.
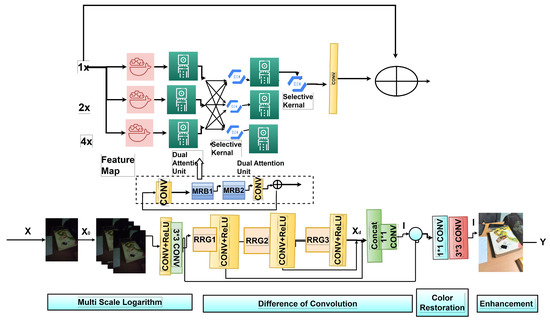
Figure 3.
MSR-MIRNeT Model Architecture.
From a given image X, the network extracts low-level features by applying a CONV layer. Subsequently, multiple numbers of blocks of recursive residual groups (RRGs) permit feature maps to pass over the RRG with surrounding deep features . We merged difference-of-convolution with rectified linear activation function-ReLU for an analogous role with difference-of-Gaussian and the color restoration function, which is compiled with the mapped function. The significant difference between the MSR [4], the MIRNeT [5] model, and our model is that our maximum parameters are designed to learn from the training data to enhance the images. In contrast, in MSR some parameters, such as variance and others, constantly depend on artificial settings. Here the multi-Scale residual is merged with RRG, then CONV is applied for image color restoration, which generates and layers for enhancement as precise features and derives the remaining image . After the color restoration process, some features may have an average value, which reduces the brightness of the generated image. Thus, a CONV layer is used after color restoration to maintain the output RGB image standard. Hence, using the logarithmic transformation ), a low-light image is mapped with a bright image to enhance the output image. This can be represented using Equation (3).
Here, is the input image after color restoration and T is the transformation function. is the final enhanced image. Finally, the equation of repaired image is as follows:
In this experiment, the Charbonnier loss function [5] is used to optimize the pixel loss, which is defined as in Equation (5).
Here, is the ground truth image and represents the constant with a value of in all experiments. Consecutively, with the combination of multi-range logarithmic transformation , difference-of-convolution , color upgradation , and output image enhancement . Our model can be defined as in Equation (6).
is the neighboring Gaussian function, Here, K is constant and is the Standard Deviation of the Gaussian Function.
3.2. Multi-Range Recursive Residual Block (MRB)
CNNs include methods [1,22] to gather multi-scale spatial information in the same layer. In our model, the multi-range residual block (MRRB) maintains high-resolution images while taking deep contextual data from low resolutions, which allows it to produce a spatially exact output. According to our desired model, multiple fully convolutional streams are connected in parallel to the MRRB architecture, as shown in Figure 3. It enables information to flow between parallel streams, hence, low-resolution features can be used to help consolidate high-resolution details and vice versa.
3.3. Selective Kernel Feature Synthesis
We used selective kernel feature fusion due to its self-attention (SKFS) [14]. As shown in Figure 4, the SKFS module dynamically adjusts receptive fields using the Fuse and Select procedures. Furthermore, the aggregation of feature maps is based on self-attention and works with features from many convolutional streams. However, these decisions only provide the network with a small amount of expressive capability, which was originally shown in [23]. MRRB follows a nonlinear method to employ a self-attention mechanism to fuse features obtained at various resolutions. We use this as selective kernel feature fusion (SKFF) [23]. As shown in Figure 4, the SKFF module dynamically adjusts the receptive fields using the FUSE and SELECT procedures. Various resolution stream information is combined with the fuse operator to provide global feature descriptors. In this module, the number of layers are increased to reduce deblurring limitations; however, it did not generate much change from the previously established model [23].

Figure 4.
Updated Selective Kernel Feature Synthesis SKFS module.
These descriptors are used by the select operator to recalibrate the feature maps (of various streams), which are then aggregated. Next, both operators are described in detail for the three-stream situation. However, it is simple to expand it to more streams. First, Fuse componentwise addition is used in multi-range characteristics, defined as . Instead of average pooling, global maximum pooling (GMP) is used to generate channel-channel statistics for 3-D output as , which builds channel-to-channel statistics . After that, a dense feature is generated using image channel-downscaling CONV layer, where for all of our trials.
Following the feature vector J, for an individual resolution stream, three parallel channel upscaling were performed in CONV layers, producing three feature descriptors , , and with size (each value represents the information for one channel) squeeze vector. Second, Select—the attention module is activated and applied the softmax function operator for adaptive recalibrating multi-range feature maps. Subsequently, the general features of the recalibration and aggregation processes were computed. However, SKFS produced better results with six fewer parameters than aggregation with concatenation.
3.4. Dual Attention Unit (DAU)
A method was necessary to communicate information within a feature tensor, along with the spatial and channel dimensions, similar to the SKFF block for information across multi-resolution branches. Therefore, a dual attention unit (DAU) was implemented in convolutional streams to extract features [24], motivated by the developments of current low-level vision algorithms based on attention mechanisms [24]. Figure 5 represents the schematic architecture of the DAU. Only more informative characteristics are permitted to proceed after the suppression of less valuable ones by DAU. Channel and spatial attention processes were used to achieve feature re-calibration.

Figure 5.
Dual-Attention Module including spatial and channel attention.
3.4.1. Channel Attention (CA) Branch
Channel Attention (CA) uses squeeze and excitation procedures to utilize the inter-channel interactions of the convolutional feature maps. The squeeze operation takes a feature map and uses the global average pooling across spatial dimensions to capture the global context, thus providing a feature descriptor . After passing the feature descriptor D through two convolutional layers and sigmoid gating, the excitation operator creates activations . Finally, the branch output is generated by re-scaling M using the activation of D.
3.4.2. 3D-Attention (3D-A) Unit
This function is also known as spatial attention, which builds a spatial attention map to recalibrate the incoming features P. Individual global max pooling operations on these elements as well as, in channel dimensions extract the spatial attention map and concatenate the results to shape a feature map. The combination of convoluted and sigmoid activations is a 3D attention map , which was then used to re-scale P.
3.5. Multi-Range Logarithmic Transformation for Image Enhancement
Original dark images pass through a multi-range logarithmic transformation , which produces an output image of the same size [25]. First, different logarithmic transformations enhanced the dark images by following the formula,
Here, , and th scale outcome with logarithmic base, where n defines the logarithmic transformation function numbers. Subsequently, the extracted 3D tensors are concatenated to a larger 3D and moved to the convolution and ReLU layers.
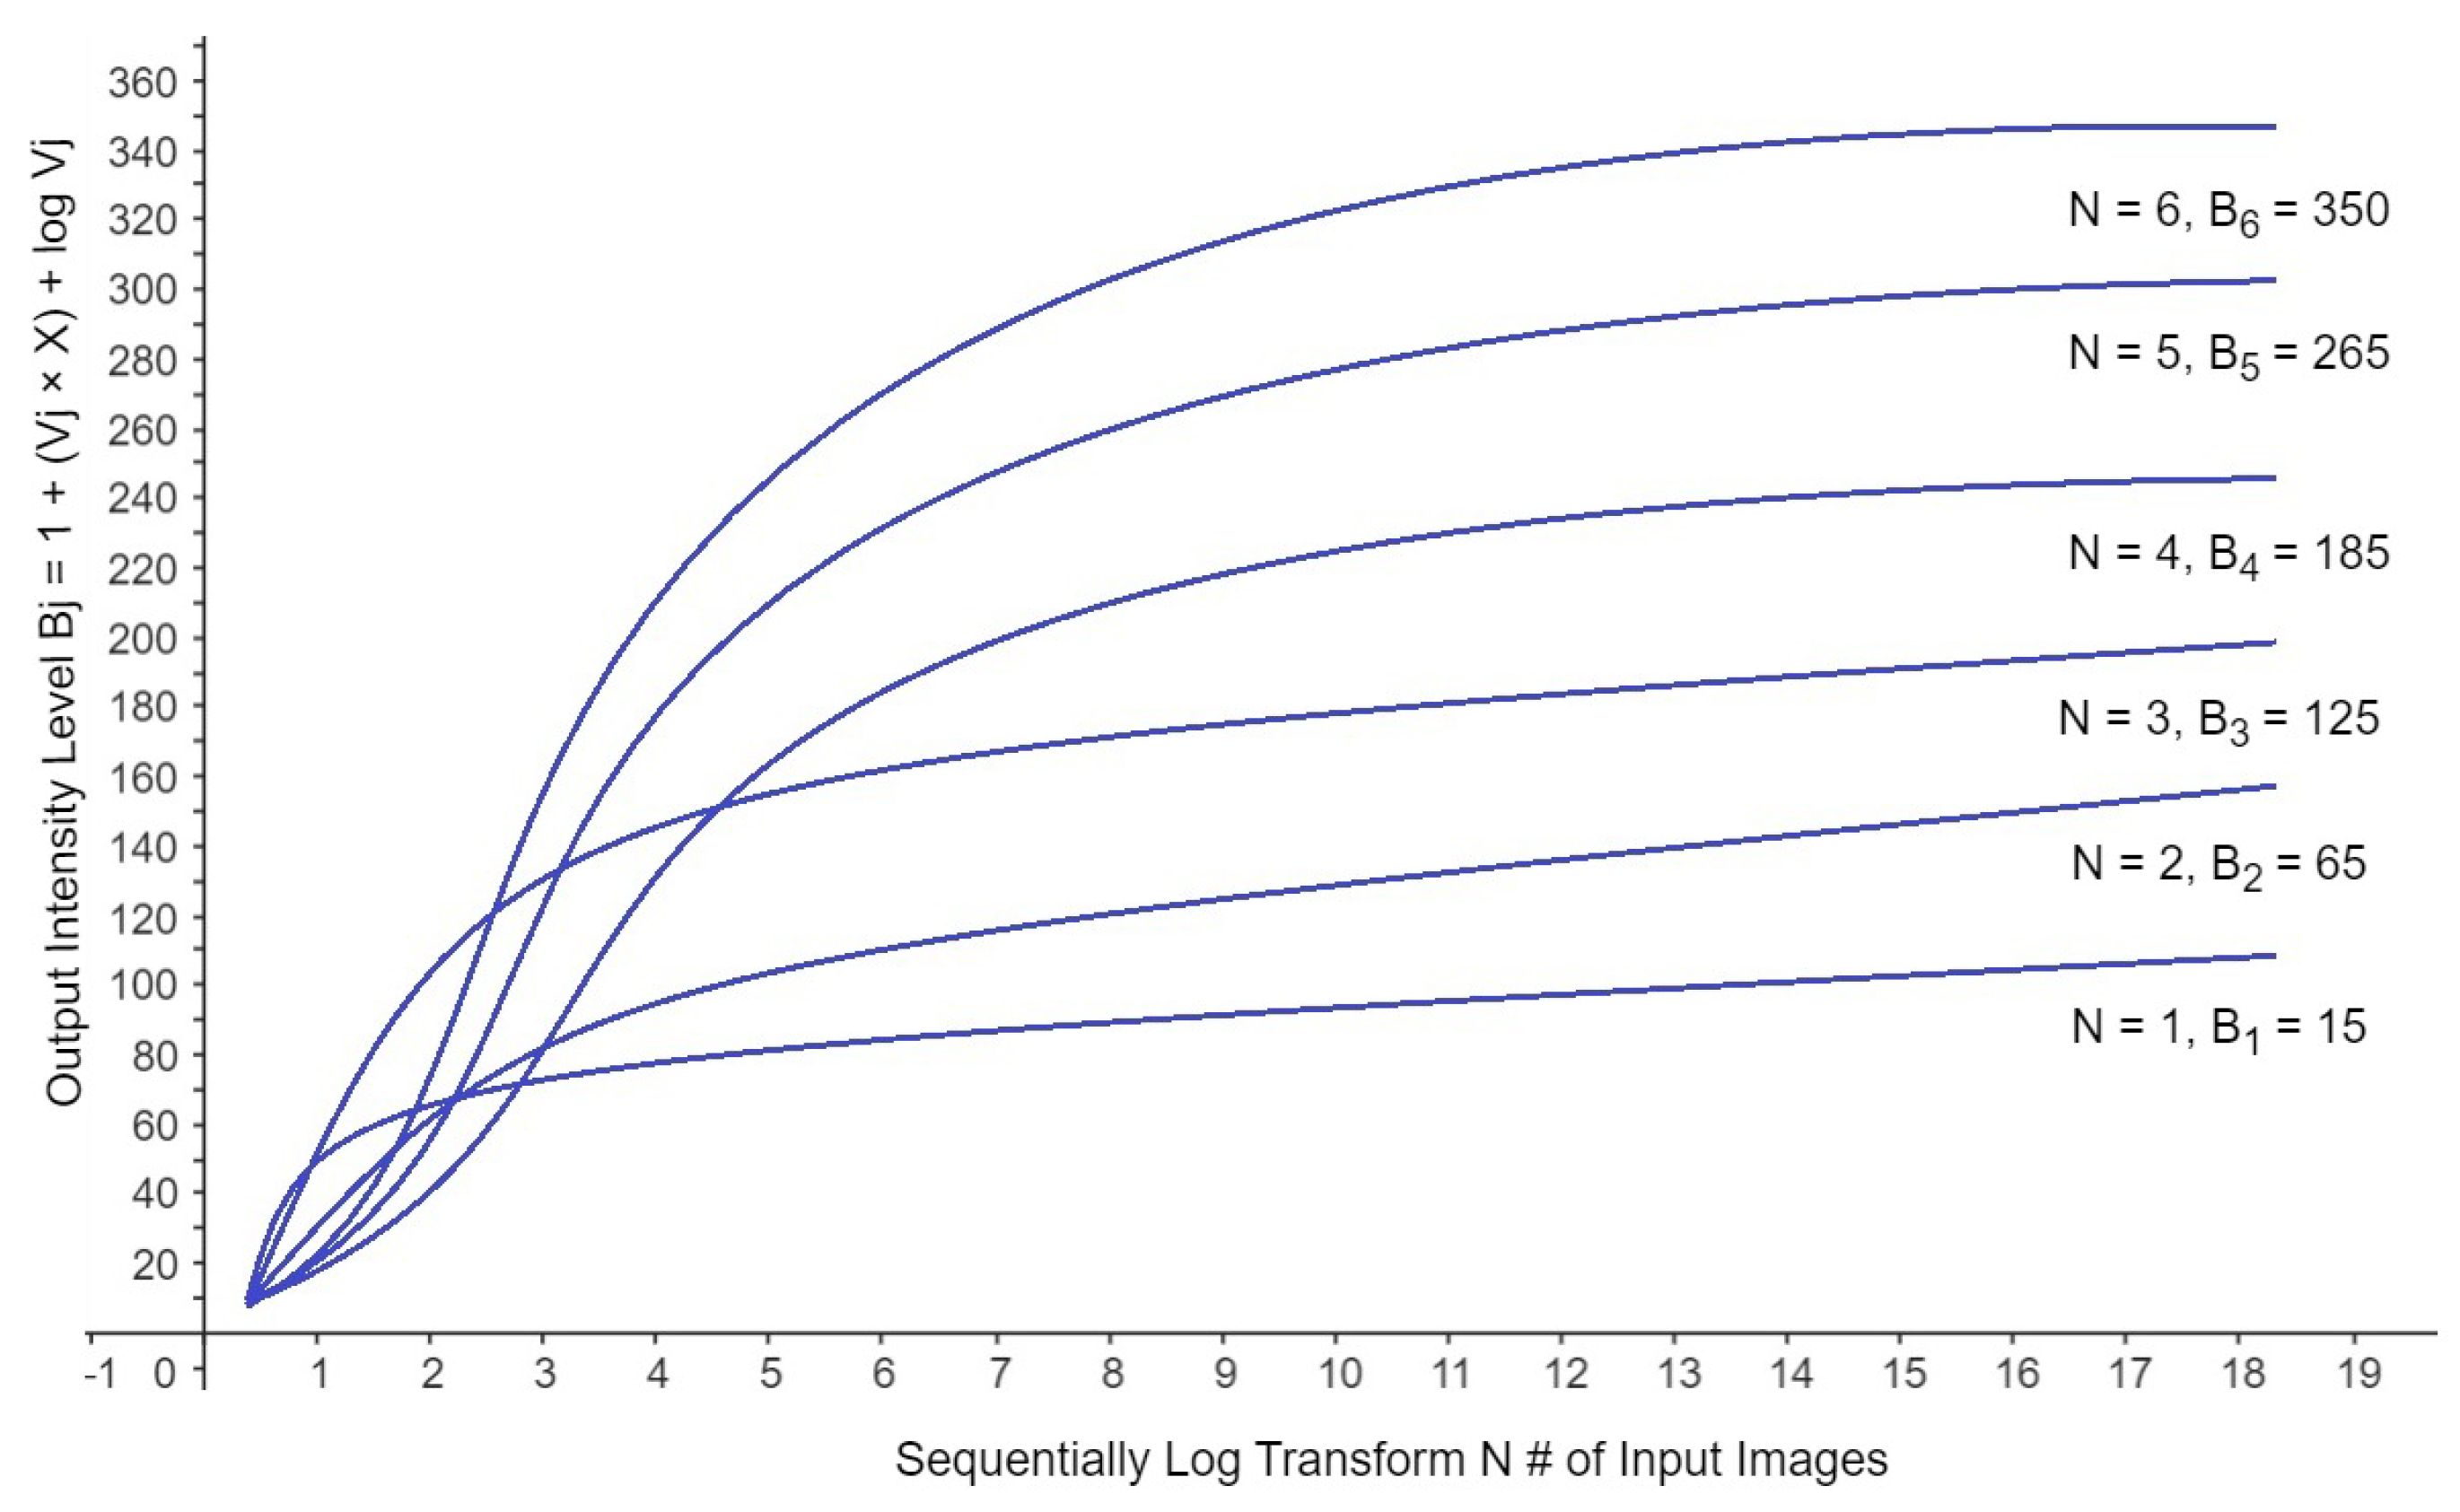
Here, the convolution window decreases the channels to three individual channels, ReLU is maxed and the resulting is a CONV kernel with three output channels, which improves the nonlinear image [9]. Based on the previous operation, this section primarily intends to improve the image via the weighted addition of several logarithmic transformations, which speed up network convergence and downsampling, increasing the shift-equivariance of the network. The graphical representation of multiple log transformations of the dark input images is shown in Figure 6. From Figure 6, it can be determined that the intensity level of low-light image increased with one after another input image log transformation. In the initial condition, the intensity level was low, and consecutively, the output intensity increased. However, the increment lines of the update images intersect each other due to a change in the pixel value at the location of , for example, if the pixel value of at the location was 10, after log transformation, the pixel value at that location of increased to 15, and consecutively, this value again upgrades to .
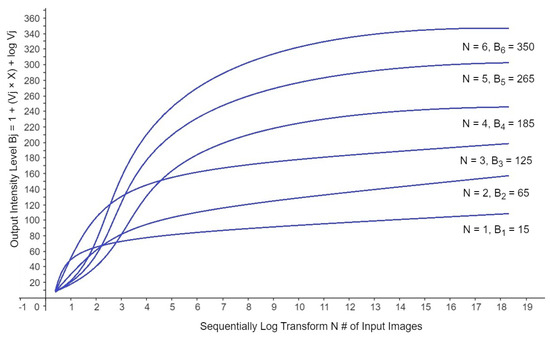
Figure 6.
Graphical representation of sequential multiple scale logarithm transformations of the dark input image.
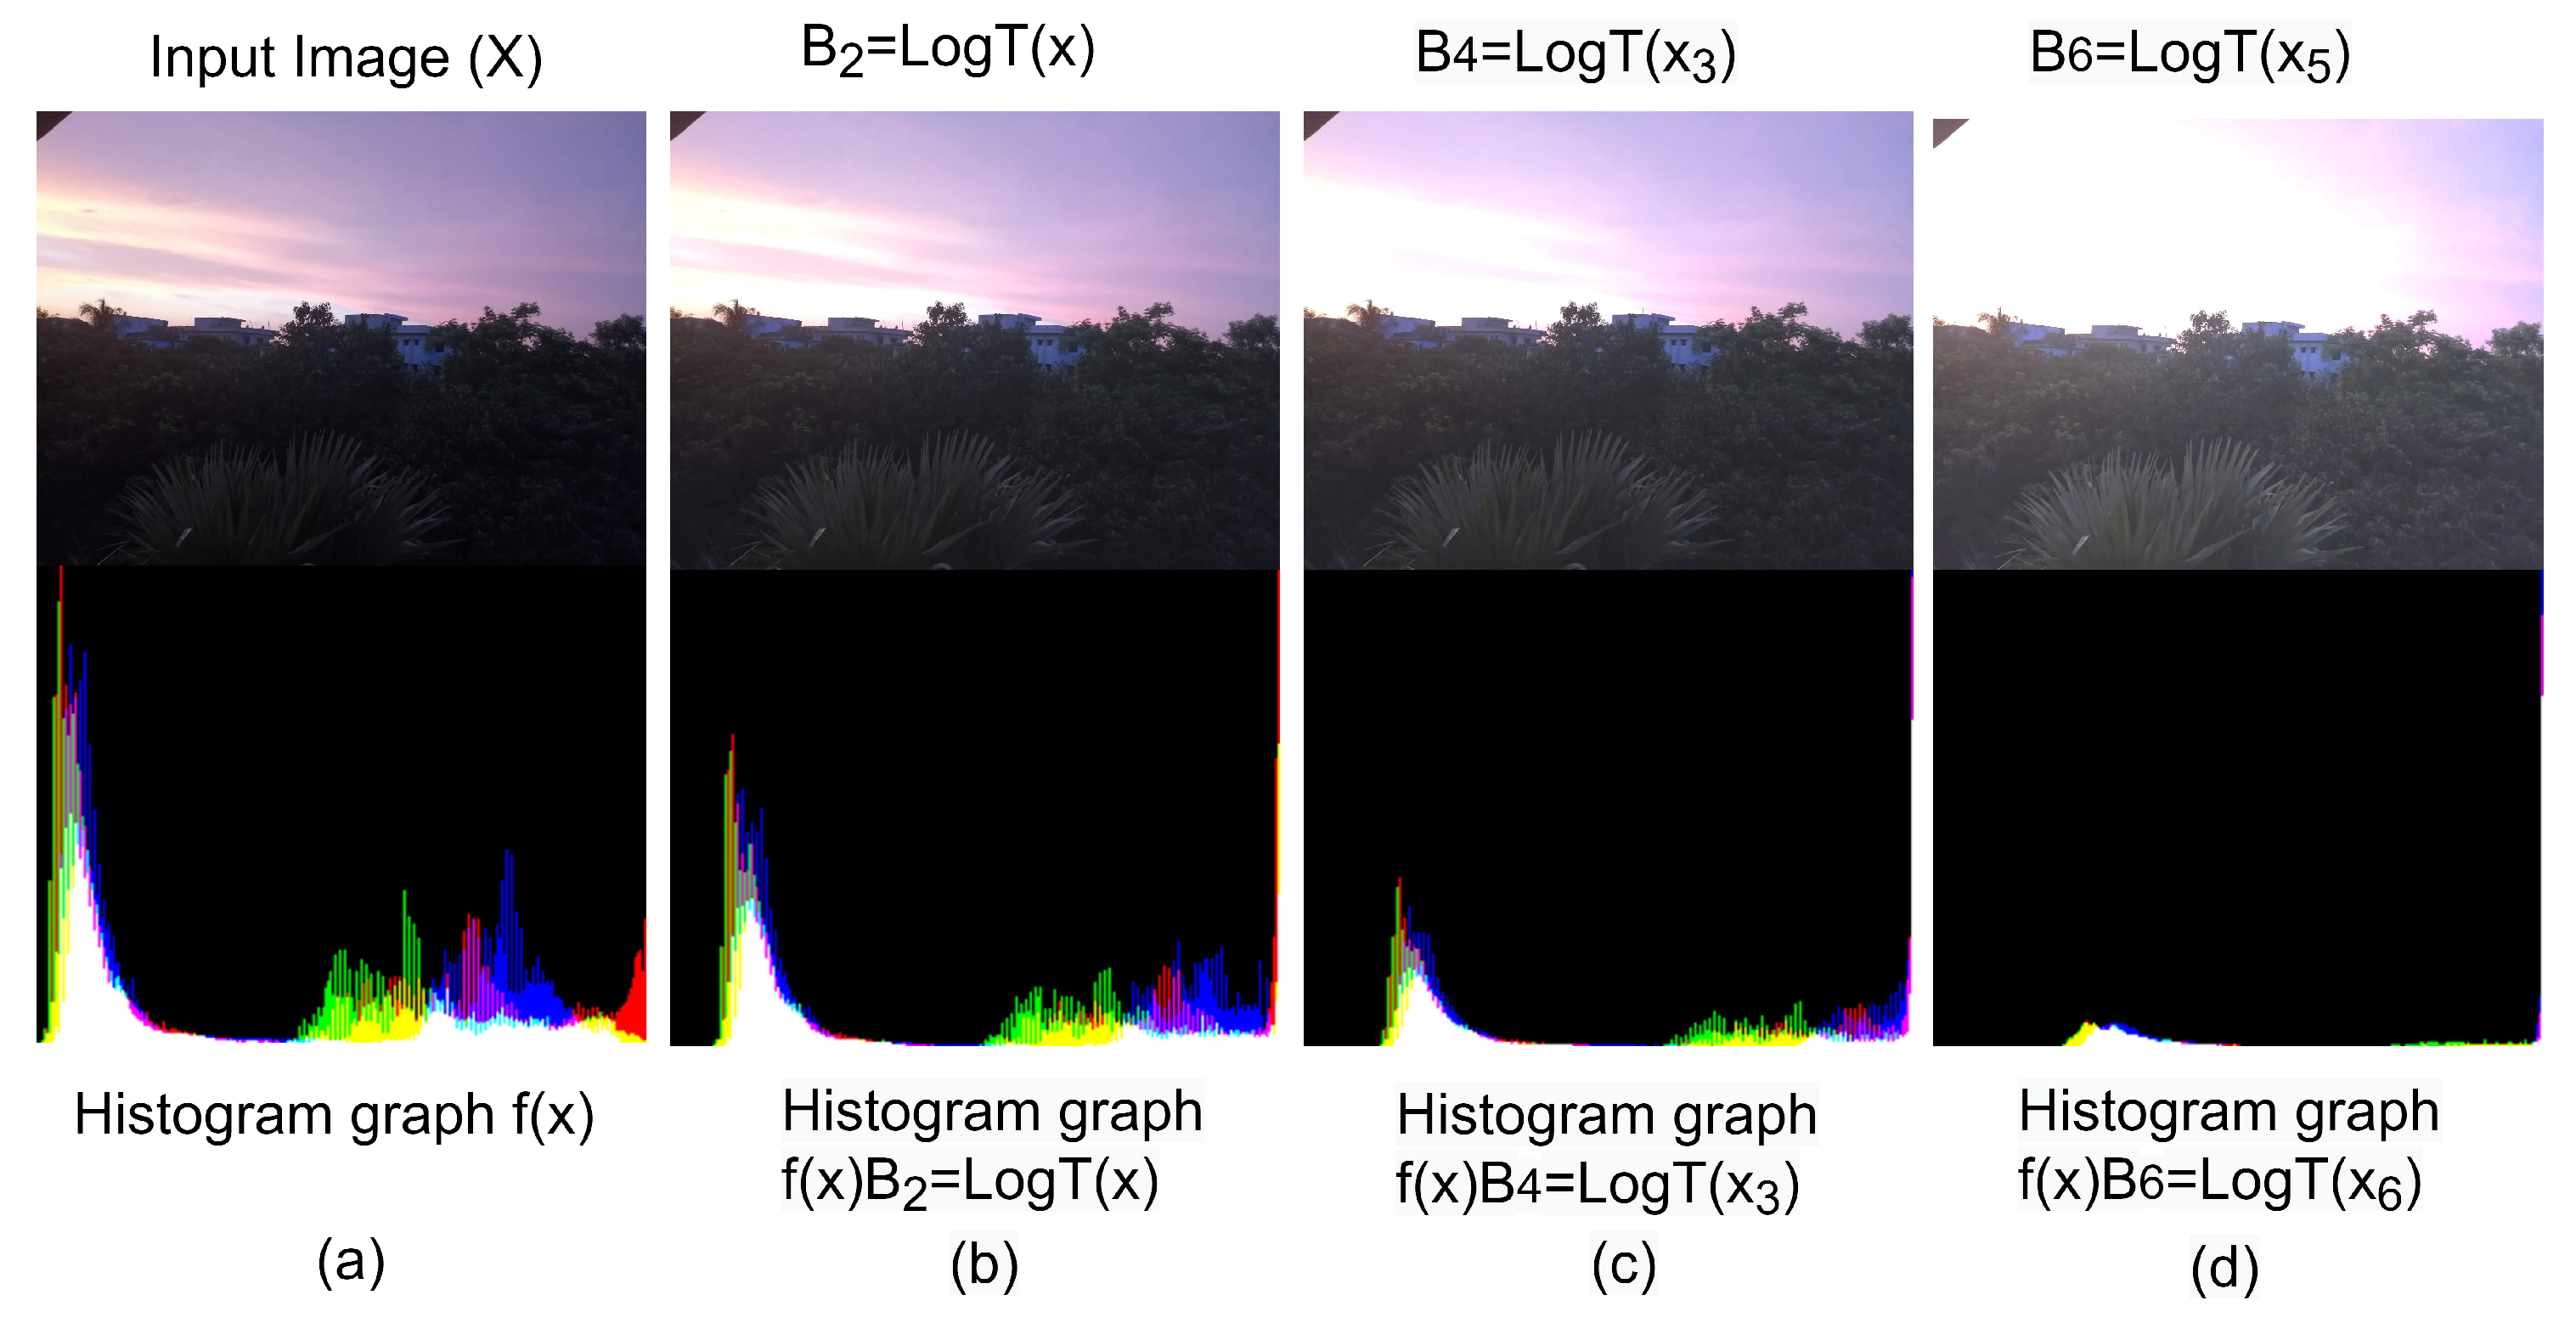
Moreover, the histogram analysis is shown in Figure 7. Here, after each log transformation, the dark input image becomes enhanced in the output image. The low-intensity value in the input image is assigned to a wide range of output levels. The opposite is true for the higher level.
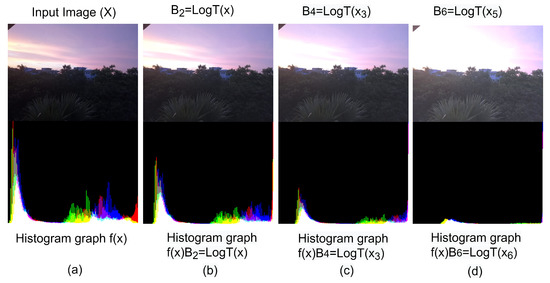
Figure 7.
Analysis of Sequential Multiple Scale Logarithm Transformations of the Dark Input Image. (a) Histogram of the Given Image, (b) Histogram of the second stage Log Transformed Image, (c) Histogram of the fourth stage Log Transformed Image, (d) Histogram of the sixth stage Log Transformed Image.
3.6. Difference-of-Convolution
First, at this stage, the multi-convolutional layers take input from the previous block using Equation (9).
Here, m is the convolutional layer, where , N is the CONV layer number and represents the kernel. concatenates to a larger 3-dimensional tensor C and passes through the CONV layer as in Equation (10).
Here, is the output of the and the receptive field, which is equivalent to the average of N images. Consequently, the generated result of is the difference between and , so the equation can be written as in Equation (11).
3.7. Color Upgrade and Enhancement Function
Significantly, our model emulates the output image color with a convolution layer and three output channels, F [24].
The final image enhanced from is again mapped by the logarithmic transformation function, which follows Equation (13).
Here, T defines as a Logarithmic Transformation Function and is the Updated Color Image.
4. Experiments
The qualitative and quantitative results from our MSR-MIRNeT model concerning other methods are represented in this Section. Next, (a) datasets, (b) implementation specifics and (c) performance evaluation are described for image denoising and image enhancement, in four standard image datasets.
4.1. Dataset
4.1.1. Image Enhancement
For this custom experiment, the customized IELLc dataset is created and is used for the image enhancement training module. Our dataset is modeled in OpenCV and acquired 4000 raw images in low light/average light circumstances using the Samsung A71 mobile phone camera, with the camera configuration 64 MP, f/1.8, 26 mm (wide), 1/1.72″, 0.8 m, PDAF. Table 1, represents our customized datasets. After randomly adjusting the brightness and contrast of the dataset, each high-quality image creates a pair with low-quality images. As a result, our final dataset has 1000 pairs of HQ/LQ photos. The Dataset Specifications are mentioned in Table 2.

Table 1.
IELLc Dataset Specification.

Table 2.
Distribution of Training and Testing Dataset of IELLc Dataset.
This dataset contains images from the manipulated area, in total, approximately 7452 square feet in the RGB channel. For a certain sensor, the distance between two neighboring pixels projecting on the ground is defined as the Ground Sample Distance (GSD), which is based on the camera focal length, altitude, image resolutions, etc.
The distribution of training and testing data features of the IELLc dataset is mentioned in Table 2. Here, training and test data are distributed in a 70%/30% ratio. The input image is re-sized by twice downsampling for associating with the storage of the GPU. The difference between the accurate pixel value quantity and the null pixel value quantity of each image is the number of effective tiles. This occurred due to the misalignment of the sequential image in the diagonal orthomosaic map.
The padding information defines the additional blank pixels in rows and columns, and average-max pooling is used. Orthomosaic maps are diagonally aligned, so tiles from the upper left or bottom right corners are entirely black images. Three orthomosaic maps were used as the RGB channel. The number of tiles in the row/col indicates the number of tiles (i.e., images) in a row and column, respectively. The padding information denotes the number of additional black pixels in rows and columns to match the size of the orthomosaic map with a given tile size. The visual representation of the IELLc dataset is shown in Figure 8.
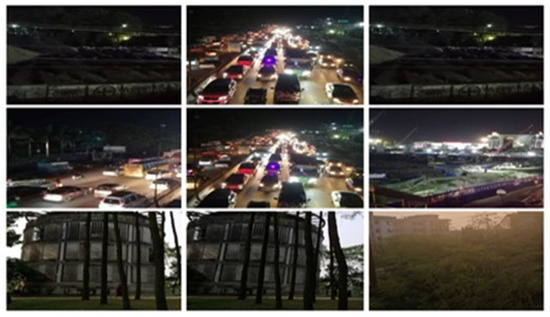
Figure 8.
Visual Representation of Customized IELLc Dataset.
In addition, ExDark (Exclusively Dark Image Dataset) [15] is used, an assembly of 7363 dark photos ranging from extremely dark circumstances to moonlit nights under 10 distinct circumstances, annotated on both image class level and local item leaping boxes (similar to PASCAL VOC). Our dataset is trained on the custom IELLc data set and evaluated the test images on both the custom real-world IELLc data set and the ExDark [15] data set.
4.1.2. Image Denoising
CID (Campus Image Dataset) [21] is utlized since our model is based on Multi-Scale Logarithmic Transformation. The CID (Campus Image Dataset) is a dataset made of Android programming. It is a group of elementary components that captures raw images after every 8 exposure-time intervals. In addition, for higher accuracy and a better result, the CID dataset is merged with the Extreme low light denoising (ELD) dataset [20]. ELD incorporates 10 indoor scenes from 4 multiple brand cameras (Sony A7S2, Nikon D850, Canon EOS70D, Canon EOS700D). All cameras were sourced from local retailers however manufacture in Japan. It includes all three levels (800, 1600, and 3200) and two low light factors (100 and 200) for noisy images, which subsequently generate 240 () raw image pairs.
5. Training Execution Details
Our model is trained from the data preprocessing module. The training and testing data specifications are mentioned in Table 2. Three different networks are trained in three separate tasks and these three training parameters are shared with all experiments. We have run our model in Google Colab, using TensorFlow 2.7 and NVIDIA Tesla T4 GPU. To execute the training process, three RRGs are combined; each RRG block contains two MRRBs. The MRRB is made up of three parallel streams with channel widths of 32; 64; and 128 and resolutions of 1:12:14, respectively, as there are two DAUs in each stream. For iterations and , the Adam optimizer is used to train the models, and the primary learning rate was . Our model was run in multiple numbers logarithmic transformation functions, such as and ; 125; 225; 350, respectively, which generates better results than single scale logarithmic transformation, shown in Figure 6 and Figure 7, respectively. Following the cosine annealing method [9] our model gradually develops the value, as a result, the learning rate is reduced to from its primary value. The patches size is extracted from training pictures. The batch sizes with 5 pooling layers and horizontal and vertical flips were conducted to enrich the output image details.
6. Result Analysis
6.1. Image Enhancement
Here, our proposed MSR-MIRNeT method is evaluated for image enhancement in custom real-world Image Enhancement in Low Light Condition (IELLc) datasets and ExDark [15] datasets in terms of previously established methods. The values of the peak signal-to-noise ratio (PSNR)/structural similarity index measure (SSIM) of our approach are given in Table 3. Our MSR-MIRNeT accomplishes notable advancements over earlier methods/ The PSNR value of MSR-MIRNet is shown in Table 3 using Green color. Significantly, our MSR-MIRNeT model was found to achieve a PSNR gain of 3.66 dB over MIRNeT [5] and compared to the most recent top techniques in the ExDark [15] datasets, our proposed model achieved an improvement of 1.81 dB over deep Retinex-Net [11].

Table 3.
Evaluation of the dark image enhancement performance of existing ExDark [15] and our preprocessed IELLc datasets concerning our model and existing methods.
The performance evaluation of this model with respect to the ExDark Dataset [15] shows that the qualitative values of the intensity and contrast parameters of the regenerated image are almost visually closer to the ground truth. MSR-MIRNeT (proposed model) obtains 1.56 dB PSNR gain over MIRNeT and on the ExDark [15] datasets 2.06 dB improvement over MIRNeT Figure 2. It was also noticed in Table 3 that the PSNR of the deep Retinex-Net method (represented in Blue color) for customized IELLc Dataset and ExDark Dataset [15] produces the nearest outcome.
6.2. Image Denoising
The performance of our proposed MSR-MIRNeT is represented for image denoising. The quantitative comparisons of denoising with respect to PSNR and SSIM measurement are summarized in Table 4. Compared to traditional data-driven denoising algorithms, our MSR-MIRNeT provides the standard result in PSNR.

Table 4.
Comparison of image denoising in the CID data set [21] and ELD [20] with respect to our model and existing methods.
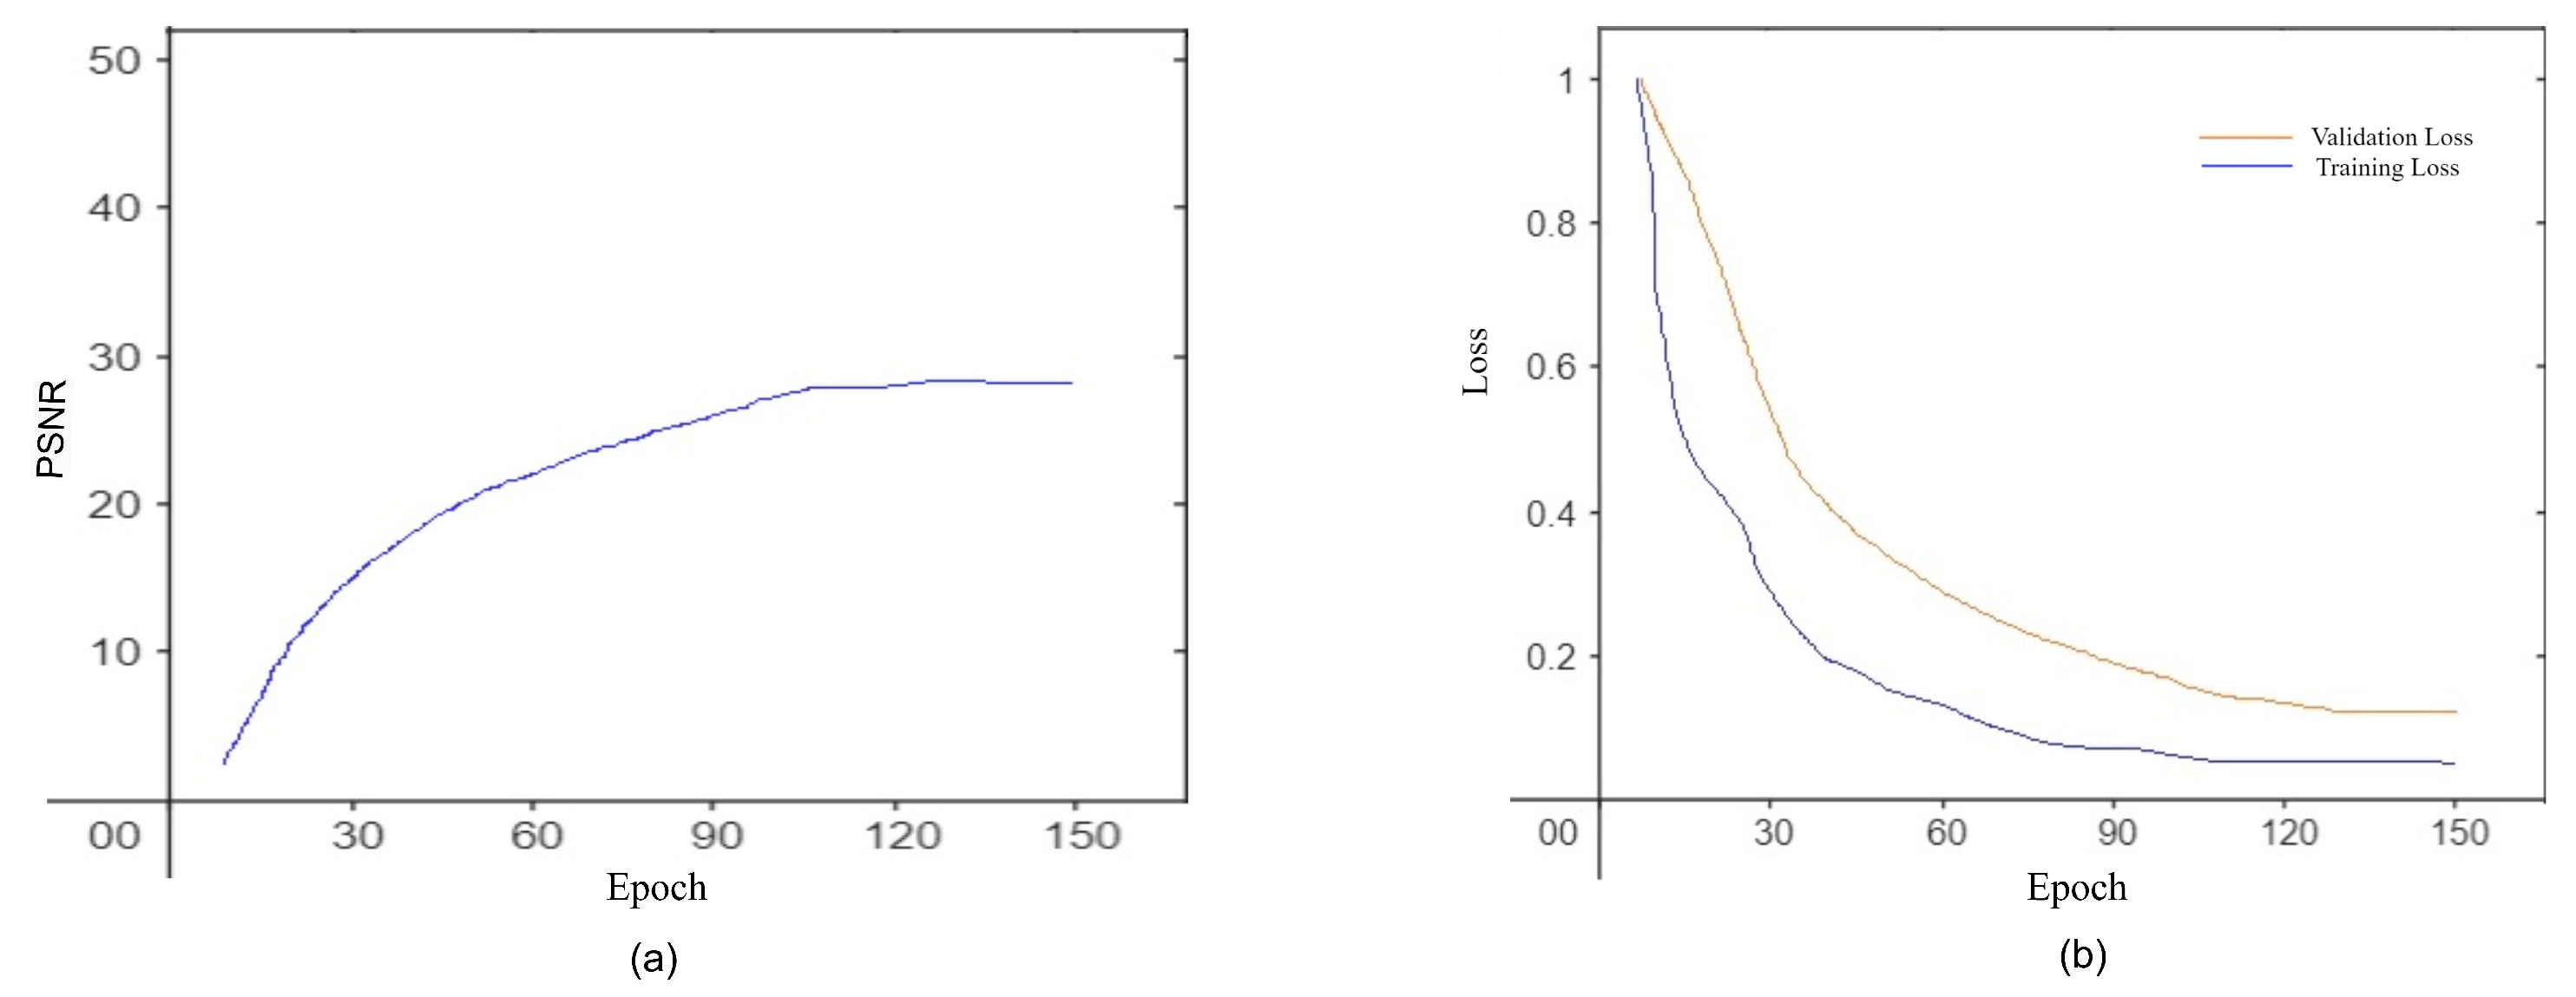
Compared to the CID dataset, our approach outperforms R2RNet [9] and MIRNeT [5] by 2.19 dB. In the Extreme low-light denoising dataset ELD [20] our model provides standard PSNR results in comparison to the others; however, the deep Retinex-Net model provides slightly better results than our model. From Figure 9a, it can be seen that the denoising accuracy is almost 97.67 percent. From Figure 9b, it is also noticeable that the training loss is less than the validation loss, which defines our model run well.
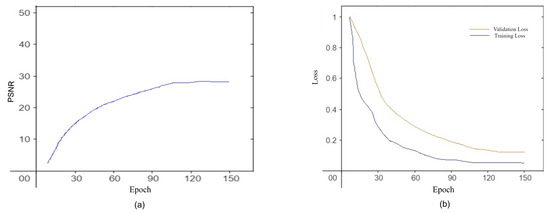
Figure 9.
(a) PSNR VS Epoch Curve, (b) Loss VS Epoch Curve [ and , Adam optimizer, 21 batches, 150 Epoch].
7. Ablation Study
At the time of the training session, it was noticed that our proposed model did not provide a top-notch outcome for multiple-sequence images. The learned perceptual image patch (LPIPS) parameter compares the perceptual similarity between two images, as shown in Table 5. SKFF is beneficial for convolution streams and improves performance. Our training shows that SKFF and DAU concatenation provides significantly better results than a single application of SKFF or concatenation. Moreover, adding ReLU to each convolution layer and increasing the number of streams improves the image quality.

Table 5.
LPIPS result of different datasets used in the MSR-MIRNeT model.
8. Conclusions
In this article, a different hybrid architecture is implemented that combines two contemporary approaches with multiple training modules: the primary phase provides full-resolution processing and the secondary phase of parallel components provides enhanced contextualized features. In this paper, a strategy is proposed to identify concatenation correlations between various multiscale branch features. A CONVNet (MSR-MIRNeT) is designed that directly learns a mapping between dark and bright images from beginning to end with multi-scale logarithmic transformation and recursive residual block concatenation. In feature fusion technology, the receptive field dynamically modifies the output without losing the original feature information. The recognition of the expected results for picture enhancement and restoration repeatedly attests to the effectiveness of the proposed approach. However, perceptual loss and visual blurring are still issues. To overcome these limitations, our focus will be on permutation-invariant work using burst-photography datasets in future research.
Author Contributions
Conceptualization, T.D.M. and S.B.A.; methodology, T.D.M.; software, T.D.M. and M.H.; validation, T.D.M. and M.H.R; formal analysis, G.S.; investigation, T.D.M. and G.S.; resources, M.H.R.; data curation, T.D.M.; writing—original draft preparation, T.D.M.; writing, review and editing, S.B.A. and G.S.; visualization, M.H. and M.F.U.; supervision, S.B.A.; project administration, S.B.A., M.H. and M.F.U.; funding acquisition, S.B.A., M.H., and M.F.U. All authors have read and agreed to the published version of the manuscript.
Funding
This research received no external funding.
Institutional Review Board Statement
Not applicable.
Informed Consent Statement
Not applicable.
Data Availability Statement
Data is available upon request from the authors.
Conflicts of Interest
The authors declare no conflict of interest.
References
- Peng, X.; Feris, R.S.; Wang, X.; Metaxas, D.N. A Recurrent Encoder-Decoder Network for Sequential Face Alignment. In Proceedings of the 14th European Conference, ECCV, Amsterdam, The Netherlands, 11–14 October 2016; Volume 9905, pp. 38–56. [Google Scholar] [CrossRef]
- Nakai, K.; Hoshi, Y.; Taguchi, A. Color Image Contrast Enhancement Method Based on Differential Intensity/Saturation Gray-levels Histograms. In Proceedings of the International Symposium on Intelligent Signal Processing and Communication Systems (ISPACS), Okinawa, Japan, 12–15 November 2013; pp. 445–449. [Google Scholar]
- Lee, C.; Kim, C.S.; Lee, C. Contrast enhancement based on layered dif-ference representation of 2D histograms. IEEE Trans. Image Process. 2013, 22, 5372–5384. [Google Scholar] [CrossRef] [PubMed]
- Shen, L.; Yue, Z.; Feng, F.; Chen, Q.; Liu, S.; Jie, M. MSR-net:Low-light Image Enhancement Using Deep Convolutional Network. arXiv 2017, arXiv:1711.02488. [Google Scholar] [CrossRef]
- Zamir, S.W.; Arora, A.; Khan, S.; Hayat, M.; Khan, F.; Yang, M.-H.; Shao, L. Learning Enriched Features for Real Image Restoration and Enhancement. In Proceedings of the Computer Vision—ECCV 2020: 16th European Conference, Glasgow, UK, 23–28 August 2020. [Google Scholar] [CrossRef]
- Rukundo, O.; Pedersen, M.; Hovde, Ø. Advanced Image Enhancement Method for Distant Vessels and Structures in Capsule Endoscopy. Comput. Math. Methods Med. 2017, 2017, 9813165. [Google Scholar] [CrossRef] [PubMed]
- Kim, W. Low-Light Image Enhancement: A Comparative Review and Pro-spects. IEEE Access 2022, 10, 84535–84557. [Google Scholar] [CrossRef]
- Jobson, D.J.; Rahman, Z.U.; Woodell, G.A. A Multiscale Retinex for Bridging the Gap Between Color Images and the Human Observation of Scenes. IEEE Trans. Image Process. 1997, 6, 965–976. [Google Scholar] [CrossRef] [PubMed]
- Hai, J.; Xuan, Z.; Yang, R.; Hao, Y.; Zou, F.; Lin, F.; Han, S. R2RNet: Low-light image enhancement via Real-low to Real-normal Network. J. Vis. Commun. Image Represent. 2023, 90, 1–12. [Google Scholar] [CrossRef]
- Land, E.H. The Retinex Theory of Color Vision. Sci. Am. 1977, 237, 108–129. Available online: http://www.jstor.org/stable/24953876 (accessed on 24 December 2022).
- Wei, C.; Wang, W.; Yang, W.; Liu, J. Deep Retinex Decomposition for Low-Light Enhancement. arXiv 2018, arXiv:1808.04560. [Google Scholar]
- Le, T.; Li, Y.; Duan, Y. RED-NET: A Recursive Encoder-Decoder Network for Edge Detection. IEEE Access 2019, 90153–90164. [Google Scholar] [CrossRef]
- Xu, B.; Zhou, D.; Li, W. Image Enhancement Algorithm Based on GAN Neural Network. IEEE Access 2022, 10, 36766–36777. [Google Scholar] [CrossRef]
- Li, X.; Wang, W.; Hu, X.; Yang, J. Selective Kernel Networks. In Proceedings of the Computer Vision and Pattern Recognition (CVPR) Conference, Long Beach, CA, USA, 15–20 June 2019; pp. 510–519. [Google Scholar] [CrossRef]
- Dabov, K.; Foi, A.; Katkovnik, V.; Egiazarian, K. Image denoising with block-matching and 3d filtering. Image Process. Algorithms Syst. Neural Netw. Mach. Learn. 2006, 6064, 606414. [Google Scholar]
- Salmon, J.; Harmany, Z.; Deledalle, C.A.; Willett, R. Poisson noise reduction with non-local pca. J. Math. Imaging Vis. 2014, 48, 279–294. [Google Scholar] [CrossRef]
- Guo, S.; Yan, Z.; Zhang, K.; Zuo, W.; Zhang, L. Toward convolutional blind denoising of real photographs. In Proceedings of the IEEE Conference on Computer Vision and Pattern Recognition (CVPR), Long Beach, CA, USA, 15–20 June 2019. [Google Scholar]
- Xu, J.; Zhang, L.; Zhang, D. A Trilateral Weighted Sparse Coding Scheme for Real-World Image Denoising. In Proceedings of the European Conference on Computer Vision, ECCV, Munich, Germany, 8–14 September 2018. [Google Scholar]
- Chen, J.; Chen, J.; Chao, H.; Yang, M. Image blind denoising with generative adversarial network based noise modeling. In Proceedings of the IEEE Conference on Computer Vision and Pattern Recognition (CVPR), Salt Lake City, UT, USA, 18–23 June 2018. [Google Scholar]
- Loh, Y.P.; Chan, C.S. Getting to know low-light images with the Exclusively Dark dataset. Comput. Vis. Image Underst. 2019, 178, 30–42. [Google Scholar] [CrossRef]
- Fu, Q.; Di, X.; Zhang, Y. Learning an adaptive model for extreme low-light raw image processing. IET Image Process. 2020, 14, 3433–3443. [Google Scholar] [CrossRef]
- Xiao, B.; Wu, H.; Wei, Y. Simple baselines for human pose estimation and tracking. In Proceedings of the 15th European Conference, ECCV, Munich, Germany, 8–14 September 2018; Volume 11210, pp. 472–487. [Google Scholar] [CrossRef]
- Zhan, Y.; Li, K.; Li, K.; Wang, L.; Zhong, B.; Fu, Y. Image Super-Resolution Using Very Deep Residual Channel Attention Networks. In Proceedings of the 15th European Conference, ECCV, Munich, Germany, 8–14 September 2018; Volume 11211, pp. 294–310. [Google Scholar] [CrossRef]
- Zhang, Y.; Li, K.; Li, K.; Zhong, B.; Fu, Y. Residual Non-local Attention Networks for Image Restoration. In Proceedings of the International Conference on Learning Represen-tations (ICLR), New Orleans, LA, USA, 6–9 May 2019. [Google Scholar]
- Lee, C.H.; Shih, J.L.; Lien, C.C.; Han, C.C. Adaptive multiscale retinex for image contrast enhancement. In Proceedings of the International Conference on Signal-Image Technology and Internet-Based Systems, SITIS, Naples, Italy, 28 November–1 December; 2013; pp. 43–50. [Google Scholar] [CrossRef]
Disclaimer/Publisher’s Note: The statements, opinions and data contained in all publications are solely those of the individual author(s) and contributor(s) and not of MDPI and/or the editor(s). MDPI and/or the editor(s) disclaim responsibility for any injury to people or property resulting from any ideas, methods, instructions or products referred to in the content. |
© 2023 by the authors. Licensee MDPI, Basel, Switzerland. This article is an open access article distributed under the terms and conditions of the Creative Commons Attribution (CC BY) license (https://creativecommons.org/licenses/by/4.0/).

