Article

Changes of Some Physicochemical Properties of Canola Oil by Adding n-Hexane and Ethanol Regarding Its Application as Diesel Fuel

by
Rafał Longwic
1,*,
Przemysław Sander
1,
Anna Zdziennicka
2,
Katarzyna Szymczyk
2 and
Bronisław Jańczuk
2
1
Faculty of Mechanical Engineering, Lublin University of Technology, 22-618 Lublin, Poland
2
Department of Interfacial Phenomena, Institute of Chemical Sciences, Faculty of Chemistry, Maria Curie-Skłodowska University in Lublin, Maria Curie-Skłodowska Sq. 3, 20-031 Lublin, Poland
*
Author to whom correspondence should be addressed.
Appl. Sci. 2023, 13(2), 1108; https://doi.org/10.3390/app13021108
Submission received: 6 December 2022 / Revised: 5 January 2023 / Accepted: 11 January 2023 / Published: 13 January 2023

Abstract

:
Canola oil cannot be directly used as a fuel in diesel engines because its physicochemical properties differ considerably from those of diesel oil. Therefore, the studies were intended to make closer the surface tension, viscosity and density of the canola oil to those of diesel fuel by adding n-hexane and ethanol. The surface tension and its components as well as density and viscosity were determined not only for the canola oil mixtures with n-hexane and ethanol but also for the canola oil components. The surface tension components were determined based on the contact angle measurements on PTFE. To obtain the components and parameters of saturated fatty acids, the contact angles of water, diiodomethane and formamide on their layers were measured. The contact angles of the studied mixtures were also measured on the engine valve. The obtained results and theoretical considerations allowed us to explain why the values of the surface tension, density and viscosity of canola oil are higher than those for its components. They also contributed to the explanation of the mechanism of the reduction in these quantities for canola oil by the addition of n-hexane and ethanol. It appeared, for example, that viscosity of the canola oil mixture with 20% n-hexane contacted with ethanol is close to that of diesel fuel.

1. Introduction

For many years the research on the use of canola oil in diesel engines has been carried out [1,2,3,4,5,6,7,8,9]. Unfortunately, such important properties of canola oil such as viscosity, density, surface tension, calorific value, flash point, fire point and cetane number in terms of its application for diesel engines are largely different from those of diesel fuel [10,11,12]. As a matter of fact, canola oil can be estrified and the obtained esters have physicochemical properties similar to those of diesel fuel. The drawback of this type of solution is that the transesterification process is a high energy-consuming one and its side effect is the production of significant amounts of glycerine. Moreover, a stable supply of plants must be provided as a source of oilseeds for production (which is difficult due to the vegetation cycle of plants). Thus, it seems that a better way to use canola oil as a fuel for diesel engines is to modify its physicochemical properties [10,11,12,13,14,15,16]. There is a lot of research in the literature on the modification of these properties of canola oil using different methods [10,11,12,13,14,15,16,17,18,19]. These methods can be divided into two groups [13,14,15,16,17,18,19,20]. One group of the methods was to change the form of canola oil, for example, by annealing its microemulsion [20]. Canola oil in the form of microemulsion is characterized by smaller values of physicochemical parameters.
The second methods group of canola oil properties modification is based on the addition to oil different types of substances which caused its physicochemical properties to be closer to those of diesel fuel [10,11,12,13,14,15,16]. The canola oil is the mixture of different mainly unsaturated and saturated fatty acids [21,22,23]. The molecules of these aids contain one hydrophilic group, -COOH, and different types of the hydrophobic hydrocarbon group. In the case of the unsaturated fatty acids in the hydrocarbon group there are the double bonds between some carbon atoms [24]. These bonds decrease the hydrophobic character of hydrocarbon chain insignificantly. It seems that such properties of canola oil, as among others, surface tension, density and viscosity should be proportional to these properties of the canola oil components. However, some differences between these psychochemical properties of canola oil and its components were found [21,22,23]. This fact is important for understanding the reduction in the surface tension, density and viscosity of canola oil by the addition of some substances [13,14,15].
In our previous studies the addition of n-hexane to canola oil was proposed to decrease its viscosity, density and surface tension as well modify its wetting properties [13,14,15]. The n-hexane has a small viscosity (0.3101 mPa·s), density (0.659 g/cm3) and surface tension (18.49 mN/m) and it spreads completely on each solid, even on such low energetic one as polytetrafluoroethylene (PTFE) [15,25,26]. It seems that the addition of n-hexane to canola oil should reduce its viscosity and density values to those of diesel oil. It turned out that even 20% of n-hexane content in canola oil did not meet these conditions. For example, the viscosity of the mixture of canola oil and n-hexane with this content is almost four times larger than that of diesel fuel [15]. The n-hexane is a hydrophobic liquid whose surface tension results practically from the dispersion intermolecular interactions [26]. For this reason n-hexane affects the interactions between the hydrocarbon chains of fatty acids to a greater extent than the acid-base one. Therefore, it seems that apart from n-hexane, the addition of ethanol to canola oil can change its physicochemical properties to a greater extent. Thus, the purpose of our studies was to determine the viscosity, density, surface tension and wetting properties of the canola oil mixture with n-hexane and ethanol with regard to these properties of the canola oil components. However, ethanol was not added directly to canola oil but introduced by the contact of ethanol phase with that of oil. The obtained results from the viscosity, density and surface tension as well as contact angle measurements were considered with regard to the dispersion and acid-base intermolecular interactions as well as the packing of the molecules of particular components of the canola oil based on the components of the surface tension of all substances present in the mixture of canola oil with n-hexane and ethanol. The surface tension components for the mixtures of canola oil with n-hexane and ethanol and unsaturated fatty acids were determined based on the contact angle measurements on the PTFE surface and van Oss et al. concept [27,28]. In the case of saturated fatty acids the components of their surface tension were obtained using in the equation of van Oss et al. [27,28] the contact angle of water, diiodomethane and formamide measured on these acids layers.

2. Materials and Methods

2.1. Materials

In the studies of the surface tension and its components, density, viscosity and contact angle on polytetrafluoroethylene (PTFE) and engine valve for preparation of the canola oil mixture with n-hexane and ethanol, the canola oil called Kujawski produced by ZT “Kruszwica” S.A. (Kruszwica, Poland), n-hexane (ReagentPlus ≥ 99%) purchased from Sigma-Aldrich (Poznań, Poland) and ethanol (96% purity) purchased from POCH (Gliwice, Poland) were used. For canola oil with n-hexane and ethanol mixtures preparation, the canola oil and n-hexane without further purification and ethanol purified by the method described in the literature [29] were applied. For the studies of the surface tension components, density, viscosity and wetting properties, linoleic acid from POCH (Gliwice, Poland), oleic and alpha-linolenic acids from Sigma-Aldrich (Poznań, Poland), palmitic (BioXtra ≥ 99%), stearic (analytical standard) and erucic acids (≥99%) from Merck (Warsaw, Poland) as well as glyceryl tristearate (≥99%) from Merck (Warsaw, Poland) were purchased.
For the studies of the surface tension components of fatty acid being in the solid state at 293 K using the van Oss et al. method [27,28], the polytetrafluoroethylene PTFE) produced by ZA Tarnów (Tarnów, Poland), doubly distilled water, formamide (99.5%) and diiodomethane (99%) purchased from Sigma-Aldrich (Poznań, Poland) were used. The valve was made from the austenitic stainless steel and was prepared removing the combustion products and polishing.
The mixtures of canola oil and n-hexane were prepared at the percentage concentration of n-hexane in the range from 0 to 20%. Next, a given mixture was shaken with the same volume of ethanol. The obtained solutions were left for 24 h for the phase separation. After this time, the oil and alcohol phases were carefully poured off and used for measurements.

2.2. Methods

The equilibrium surface tension ( γ L V ) of the canola oil, n-hexane, ethanol, mixture of canola oil with n-hexane, mixture of canola oil with n-hexane and ethanol, oleic, linoleic and alpha-linolenic acids was measured. In the case of the canola oil mixture with n-hexane and ethanol obtained by the contact of ethanol with the canola oil + n-hexane mixture the surface tension was measured for ethanol and canola oil with n-hexane phases. In addition, the surface tension of the ethanol phase being in contact with n-hexane one and n-hexane phase as well as ethanol-n-hexane interface tension were also measured. The surface and interface tensions were measured using the Krüss K9 tensiometer (Hamburg, Germany) according to the platinum ring detachment method (du Nouy’s method). The ring was cleaned with distilled water and heated to red colour with a Bunsen burner before each measurement. In all cases more than 10 successive measurements were performed. The standard deviation was ±0.1 mN/m and the standard uncertainty was also 0.1 mN/m. The measurement temperature was controlled by a jacketed vessel joined to a thermostatic water bath with the accuracy ± 0.1 K. All the experiments were performed at 293 K within ±0.1 K.
The measurements of the advancing contact angles of the canola oil with n-hexane and the canola oil + n-hexane-ethanol mixtures on the PTFE and valve surface were made using the sessile drop method and the DSA30 measuring system (Krüss) (Hamburg, Germany) in the thermostated chamber at 293 ± 0.1 K. The measurements of the contact angle for the given liquid were repeated by settling a few drops on the same solid. The contact angle for a given liquid was measured for at least 20 drops. Good reproducibility was found for the contact angle measurements. The standard deviation for each set of values was less than 1.2° and the standard uncertainty was less than 0.25°. The contact angle measurements were also made on the PTFE surface for ethanol, canola oil, n-hexane as well as oleic, linoleic and alpha-linolenic acids. For the determination of the components of the surface tension of palmitic, stearic, erucic acids as well as glyceryl tristearate according to the van Oss method [27,28], the contact angles were measured for water, formamide and diiodomethane on their layers formed on the PTFE surface. The standard deviation for the contact angle measurements for water, formamide and diiodomethane was 1.9, 1.4 and 1.0° and the standard uncertainty 0.31, 0.27 and 0.22°, respectively.
The density of the canola oil, canola oil + n-hexane mixture, canola oil + n-hexane + ethanol mixture (for canola oil + n-hexane and ethanol phases), as well as n-hexane, ethanol, oleic, linoleic and alpha-linolenic acids was measured with the U-tube densitometer, DMA 5000 Anton Paar (Graz, Austria), with the precision of the density measurements equal to ±0.000005 g/cm3. The uncertainty was calculated to be equal to 0.01%. The viscosity measurements of the canola oil, canola oil + n-hexane and canola oil + n-hexane + ethanol (for canola + n-hexane and ethanol phase) mixtures, as well as for n-hexane, ethanol, oleic, linoleic and alpha-linolenic acids were performed using the Anton Paar viscometer, AMVn (Graz, Austria), with the precision of 0.0001 mPa·s and the uncertainty of 0.3%. All density and viscosity measurements were made at 293 K. The density of palmitic, stearic, erucic acids and glyceryl tristearate were determined by immersing 2 g in 10 cm3 of n-hexane. The viscosity of palmitic, stearic, erucic acids and glyceryl tristearate were measured based on the literature procedure [30]. The standard devotion was 0.0024 g/cm3 and the uncertainty was 0.4%. The composition of the canola oil in percent (%) was determined by the mass spectrometry with the accuracy of 1.1%.

3. Results and Discussion

3.1. Physicochemical Properties of Canola Oil with Regard to Its Composition

Over 90% of canola oil composition are unsaturated fatty acids, namely the oleic, linoleic and alpha-linolenic ones. Apart from the unsaturated acids there are also the saturated ones such as palmitic and stearic ones. In canola oil the small amounts of trans fat and erucic acid can be also found (Table 1). The molecules of the unsaturated and saturated fatty acids like the molecules of surfactants can be divided into two parts–hydrophobic and hydrophilic ones. The hydrophobic part is a hydrocarbon chain in which, in the case of unsaturated fatty acids, there are one or more double bonds between the carbon atoms. These bonds can make a minor contribution to the polar intermolecular interactions. The –COOH group is the hydrophilic part of unsaturated and saturated fatty acid molecules. According to van Oss and Constanzo [28] the surface tension of fatty acids should depend on the orientation of their molecules towards the air phase. If the molecules are oriented by hydrophobic part towards the air, the surface tension results from the Lifshitz-van der Waals intermolecular interactions. In the case of the orientation of the molecules by hydrophilic part towards the air the surface tension of the given compound results from the Lifshitz-van der Waals and acid-base intermolecular interactions. As follows from our research, the surface tension of unsaturated fatty acids results from both the Lifshitz-van der Waals and acid-base intermolecular interactions and is smaller than that of canola oil (Table 1). However, the acid-base component (AB) of the unsaturated fatty acids surface tension is larger than that of canola oil (Table 1). It should be mentioned that the Lifshitz-van der Waals component (LW) of the oleic acid is only slightly larger than the surface tension of paraffin [26], but for the alpha-linolenic acid it is the same as that of paraffin. In the case of the linoleic acid the LW component of its surface tension is close to that of n-octane [26]. The LW component of the canola oil surface tension is close to the surface tension of polyethylene [31].
Comparing the surface tension of canola oil with that of unsaturated fatty acids and the LW and AB components of this tension raise the question why the surface tension of canola oil and its LW component is larger than the surface tension of unsaturated fatty acids and its LW component. The contribution of the Lifshitz-van der Waals and acid-base intermolecular interactions to the surface tension of unsaturated fatty acids may suggest that their molecules are oriented parallel towards the acid-air interface. In the case of canola oil, the hydrophilic group of acid molecules is probably oriented towards the oil phase with the parallel orientation of hydrophobic parts of the acid molecules at the acid-air interface. Thus, the small value of AB component in the canola oil surface tension can be due to the presence of the unpaired electrons π . According to Zisman [32] the values of the LW component of the surface tension of both the unsaturated fatty acids and canola oil can result from the packing of the –CH2 group at the interface. Zisman [32] suggested that the presence of only –CH2 group at the liquid-air interface causes that the LW component to be close to 26 mN/m. However, the fact that –CH2 group packing when the average distance between these groups of different molecules is minimal was not taken into account. Such a situation takes place in polyethylene whose surface tension is considerably larger than 26 mN/m [31]. It should be emphasized that components of the surface tension of the canola oil and unsaturated fatty acids determined in the present studies (Table 1) are close to those in the literature [33]. However, the components of the saturated fatty acids surface tension is impossible to find in the literature.
To understand the influence of the packing of the molecules of given liquids at the interface and in the bulk phase the volume of the molecules of n-hexane as well as unsaturated and saturated fatty acids was determined using the earlier proposed way [34]. It was found that the volume of the molecule of a given compound can be established based on the length of bond between the atoms being in the molecule and the contact angle between them as well as the average distance between the molecules (d). On this basis, it is possible to find the dimensions of a cube in which a molecule of a chemical compound or its fragments can be inscribed. The volume of this cube represents that of the molecule. In the case of aliphatic hydrocarbons, the volume of their molecules can be determined from the following expression [34]:
V m = L 0 w 2
where L0 is the length of the molecule and w is the width of the molecule.
L0 fulfills the following equation:
L 0 = 1.93 × 2 + 1.27 ( n 1 )
where n is the number of the carbon atoms in the hydrocarbon chain.
For the hydrocarbon chain w = 2.6 + d .
Assuming that at T = 293 K d = 2 Å the molar volume ( V m ) of the n-hexane molecule was calculated from Equation (1). In the case of fatty acids V m was determined by adding the volume of hydrophobic and hydrophilic parts of their molecules expressed by different cubes. Next the molar volume of n-hexane and fatty acids was determined ( V M = V m N ) ( N   is the Avogadro number). Knowing V M , it was possible to determine the density of n-hexane and fatty acids ( ρ ) ( ρ   = M V M ) ( M is the molar weight) (Table 1). It appeared that there is agreement between the measured and calculated values of density. This indicates that based on the bonds’ length, the angle between them and the average distance between the molecules, it is possible to determine the compound density and its changes as a function of d. Figure 1 presents the changes of ρ of n-hexane as a function of d decrease. This Figure suggests clearly that the larger density of canola oil than that of its components can result from the fact that the distance between the molecules in canola oil is smaller than in the case of individual components.
As it is commonly known the viscosity of the liquids increases as a function of pressure and decreases as a function of temperature [35]. The increase in the temperature causes the increase in the distance between the molecules but the increase in the pressure reduces this distance. In fact, the distance between the molecules can decrease in the mixture compared to its single components. However, it is interesting why the viscosity of canola oil is more than twice the size than that of its particular components (Table 1). To explain this problem the changes of intermolecular interactions as a function of d, for example, for n-hexane were analyzed. It should be mentioned that the dispersion interactions between the hydrocarbon chains were analyzed. The LW component of the liquids and solids surface tension results from only dispersion interactions [26,27]. It is known that the dispersion interactions between two elements decrease as a function of d6 [26,36]. Taking this into account the following can be written:
F 1 F 2 = d 2 6 d 1 6
where F1 and F2 are the dispersion forces at different distances between a given group in the molecules.
Figure 2 presents exemplary the d 2 6 d 1 6 values for n-hexane. As follows the small changes of d 2 6 d 1 6 cause the great changes of dispersion force. This can explain the great difference between the viscosity of canola oil and its components. Indeed, not only the dispersion forces are changed but also the acid-base interactions as a function of the distance between molecules. However, the changes of the acid-base forces as a function of the distance are different from those of dispersion.

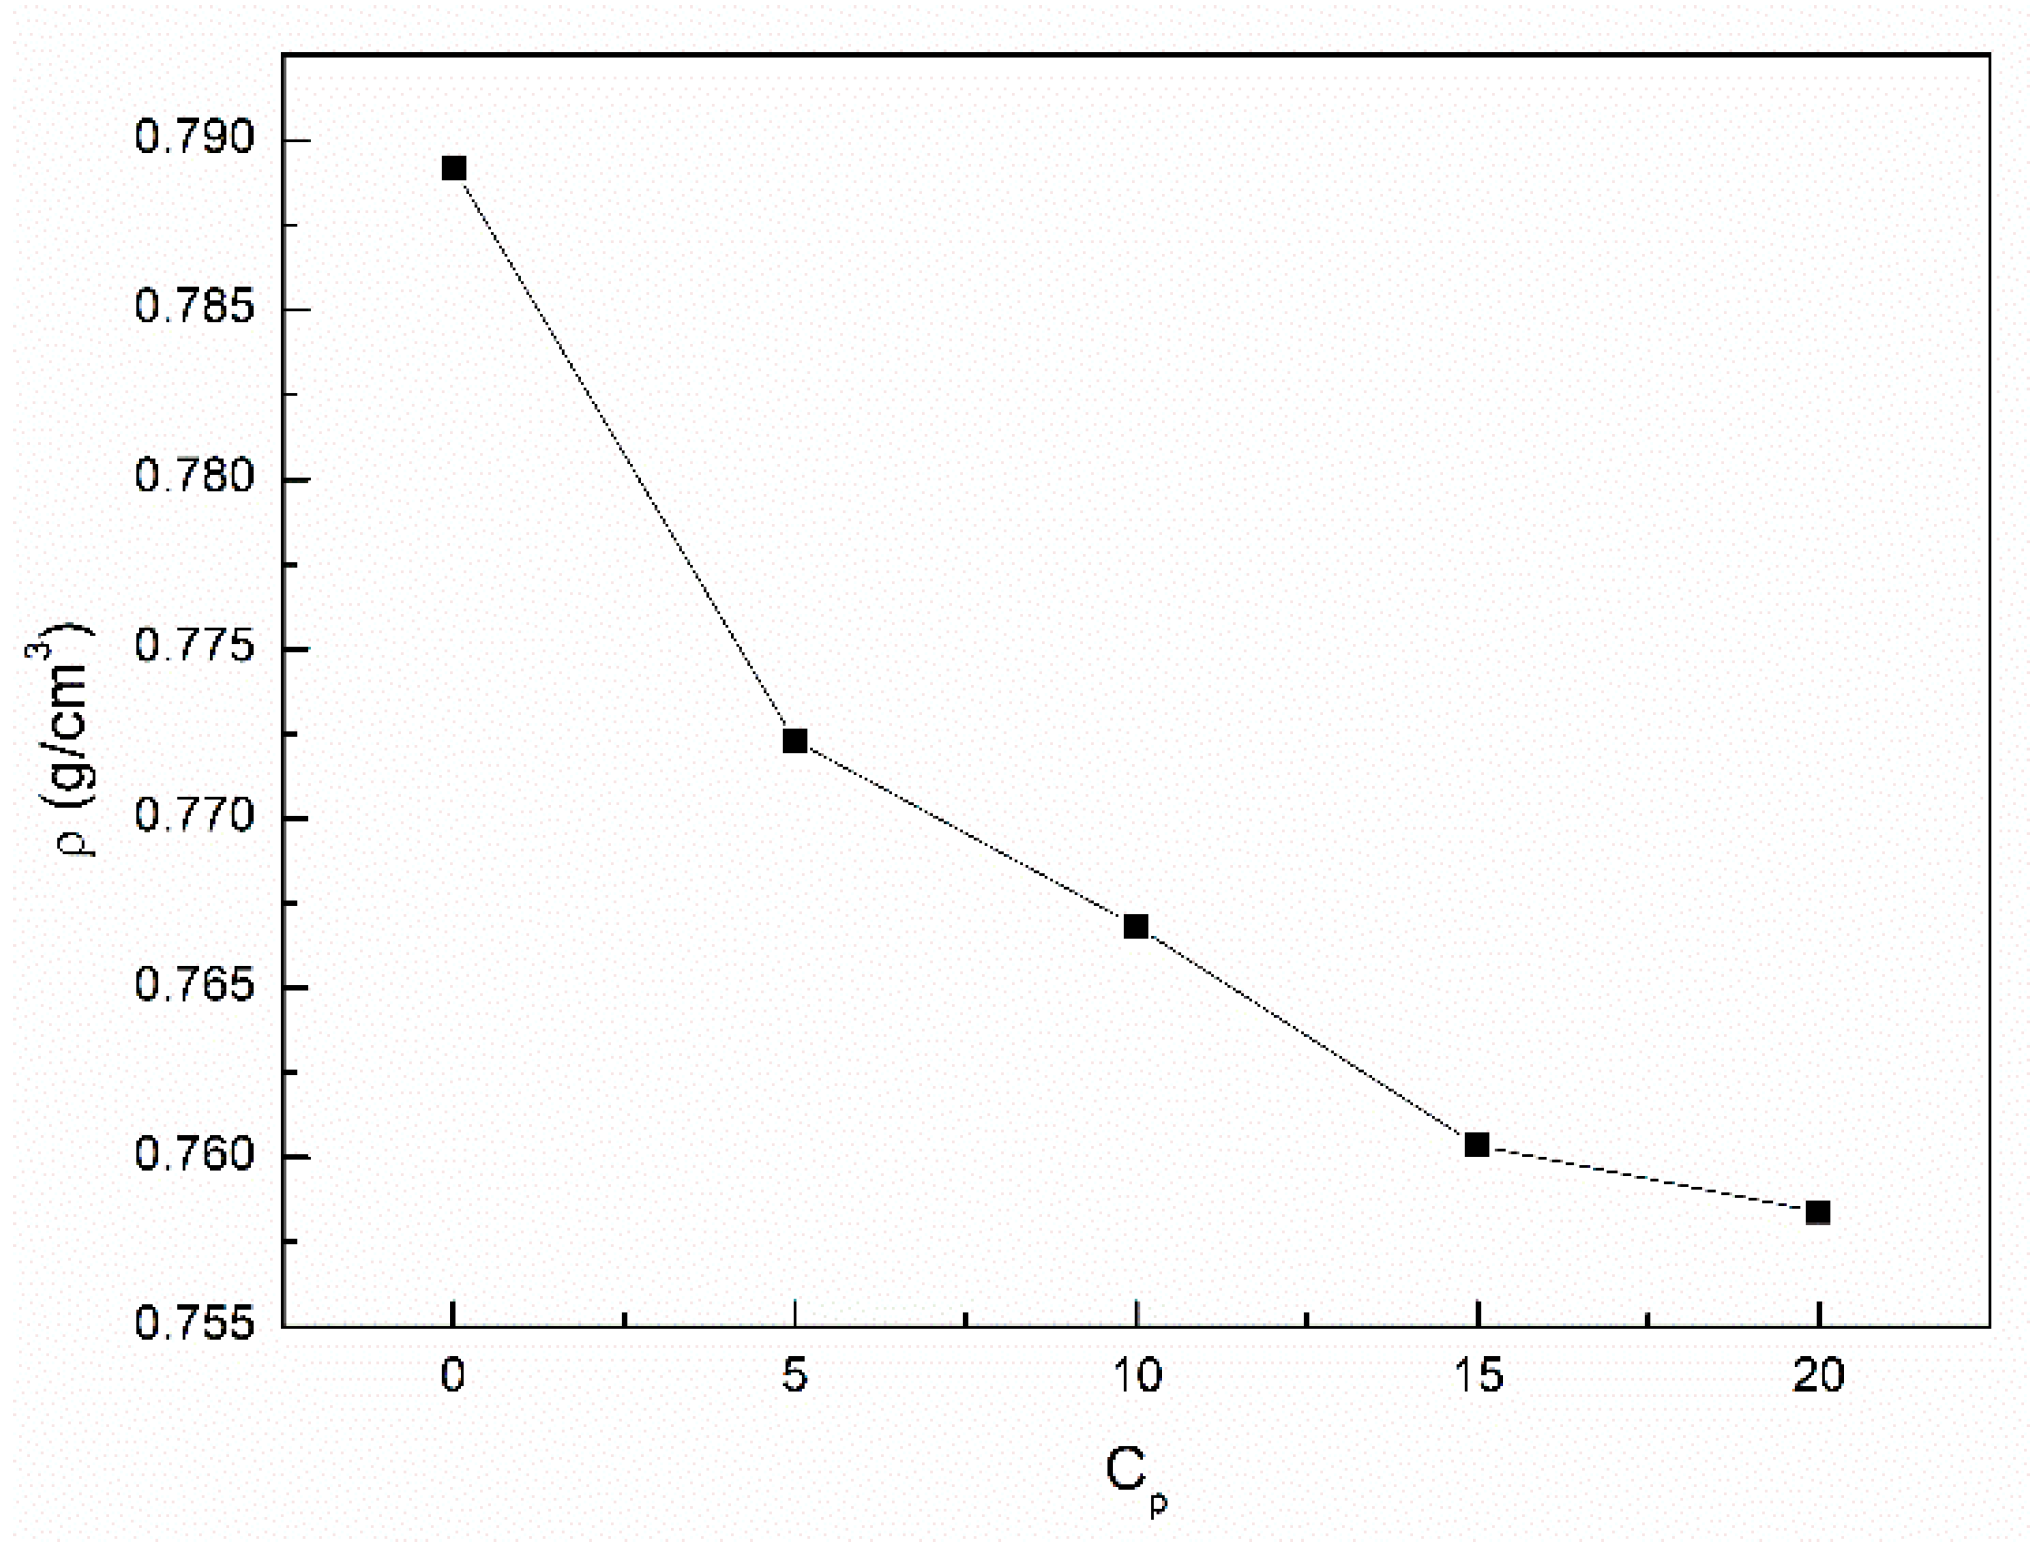
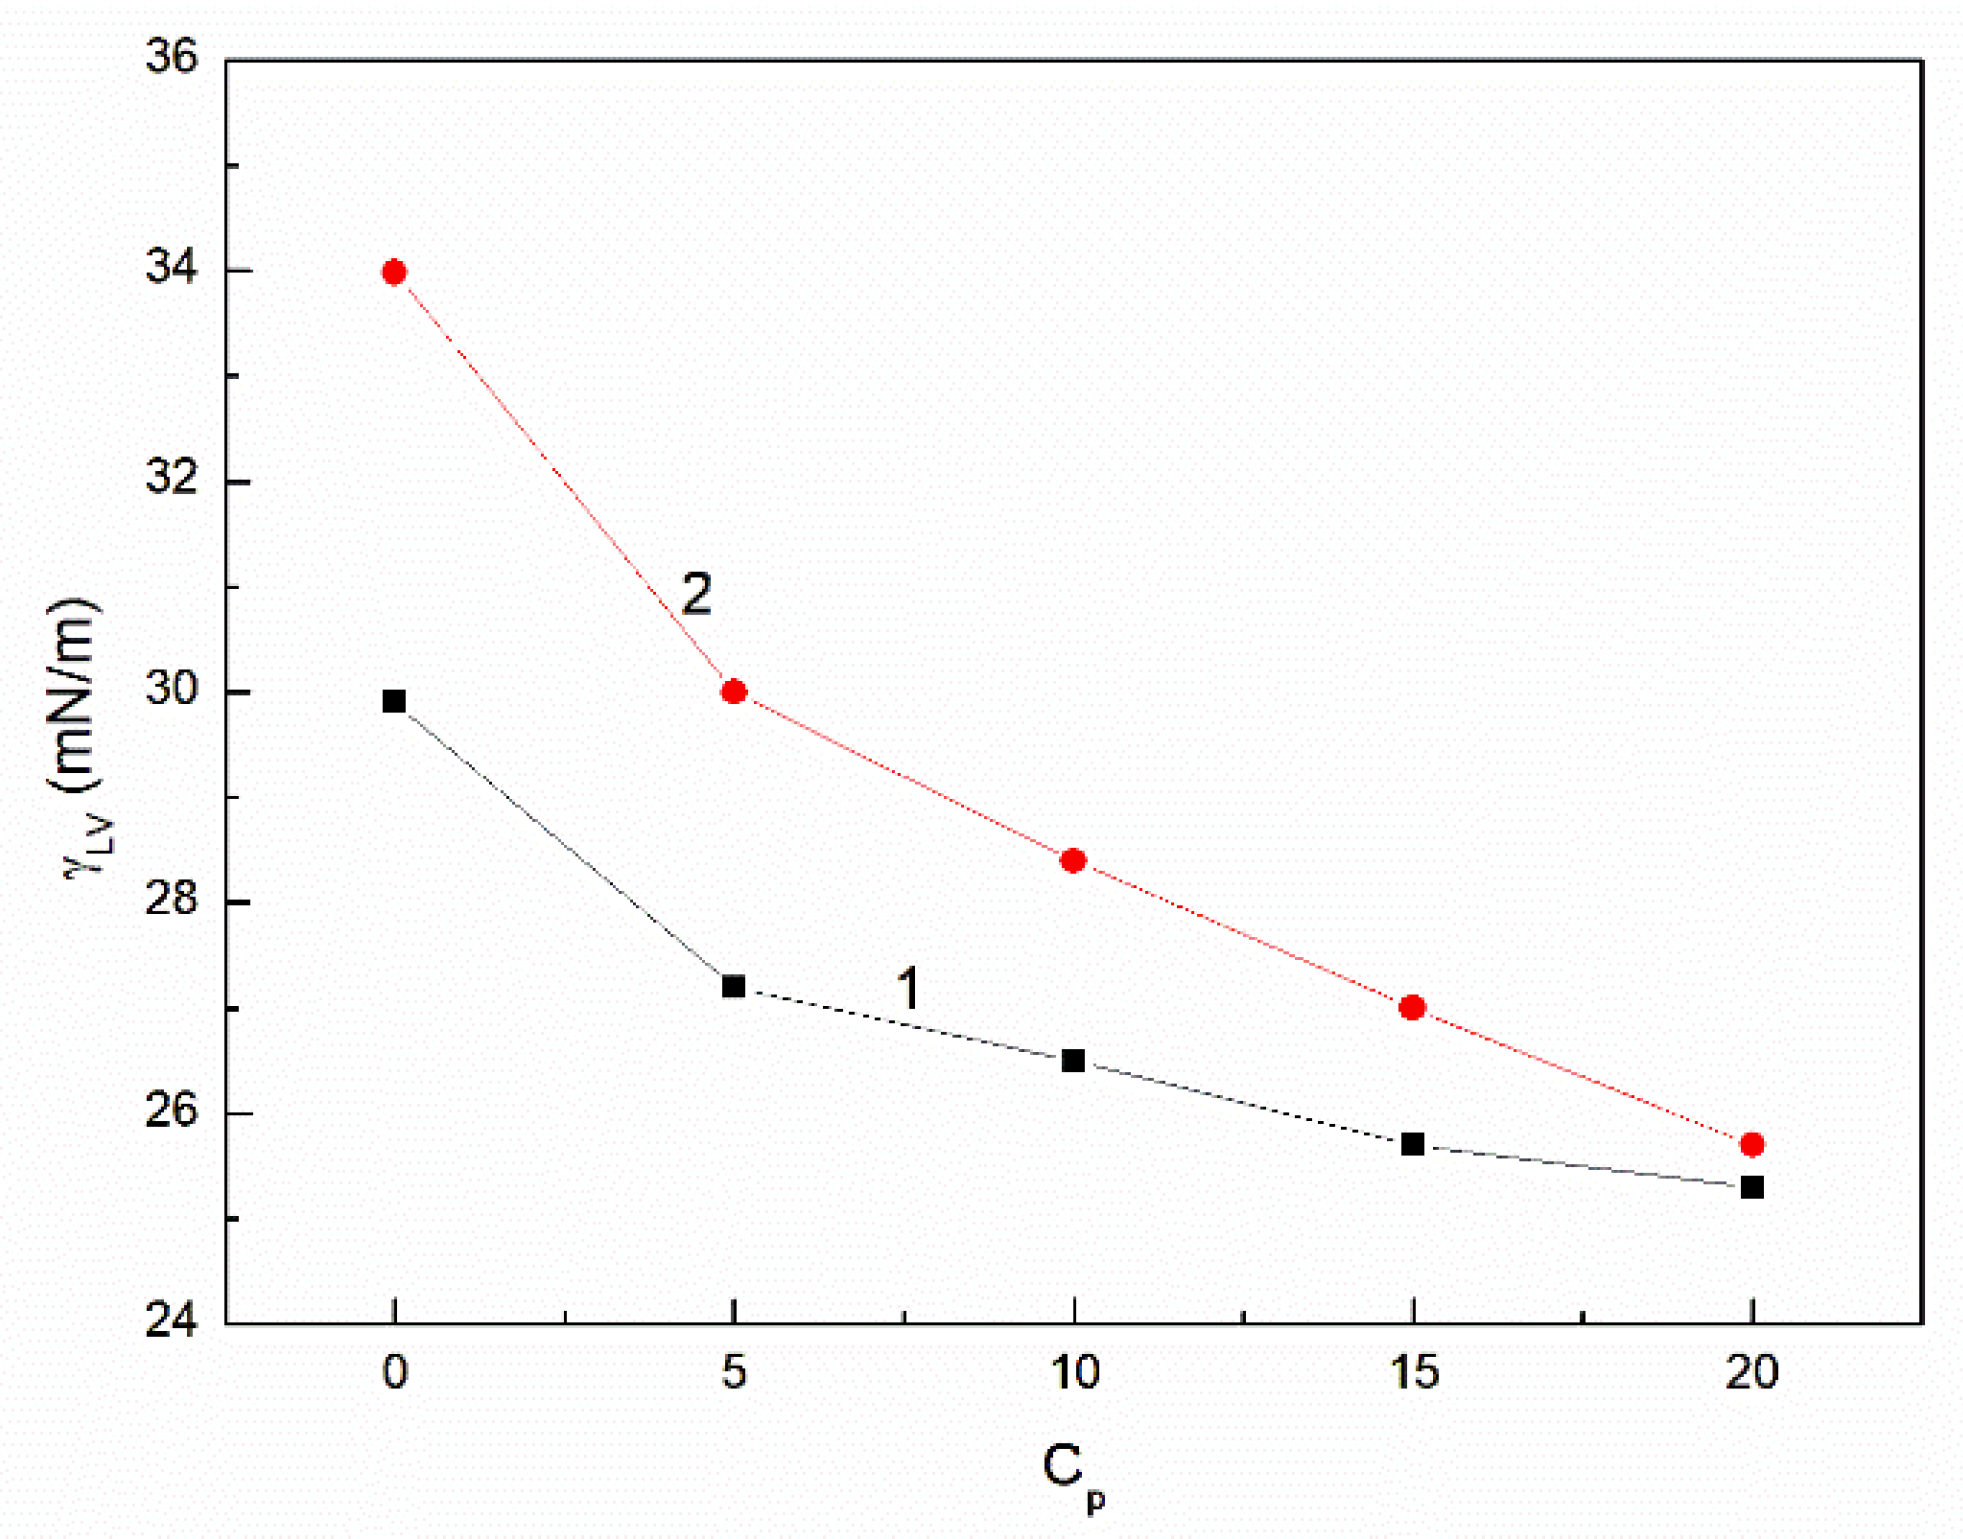
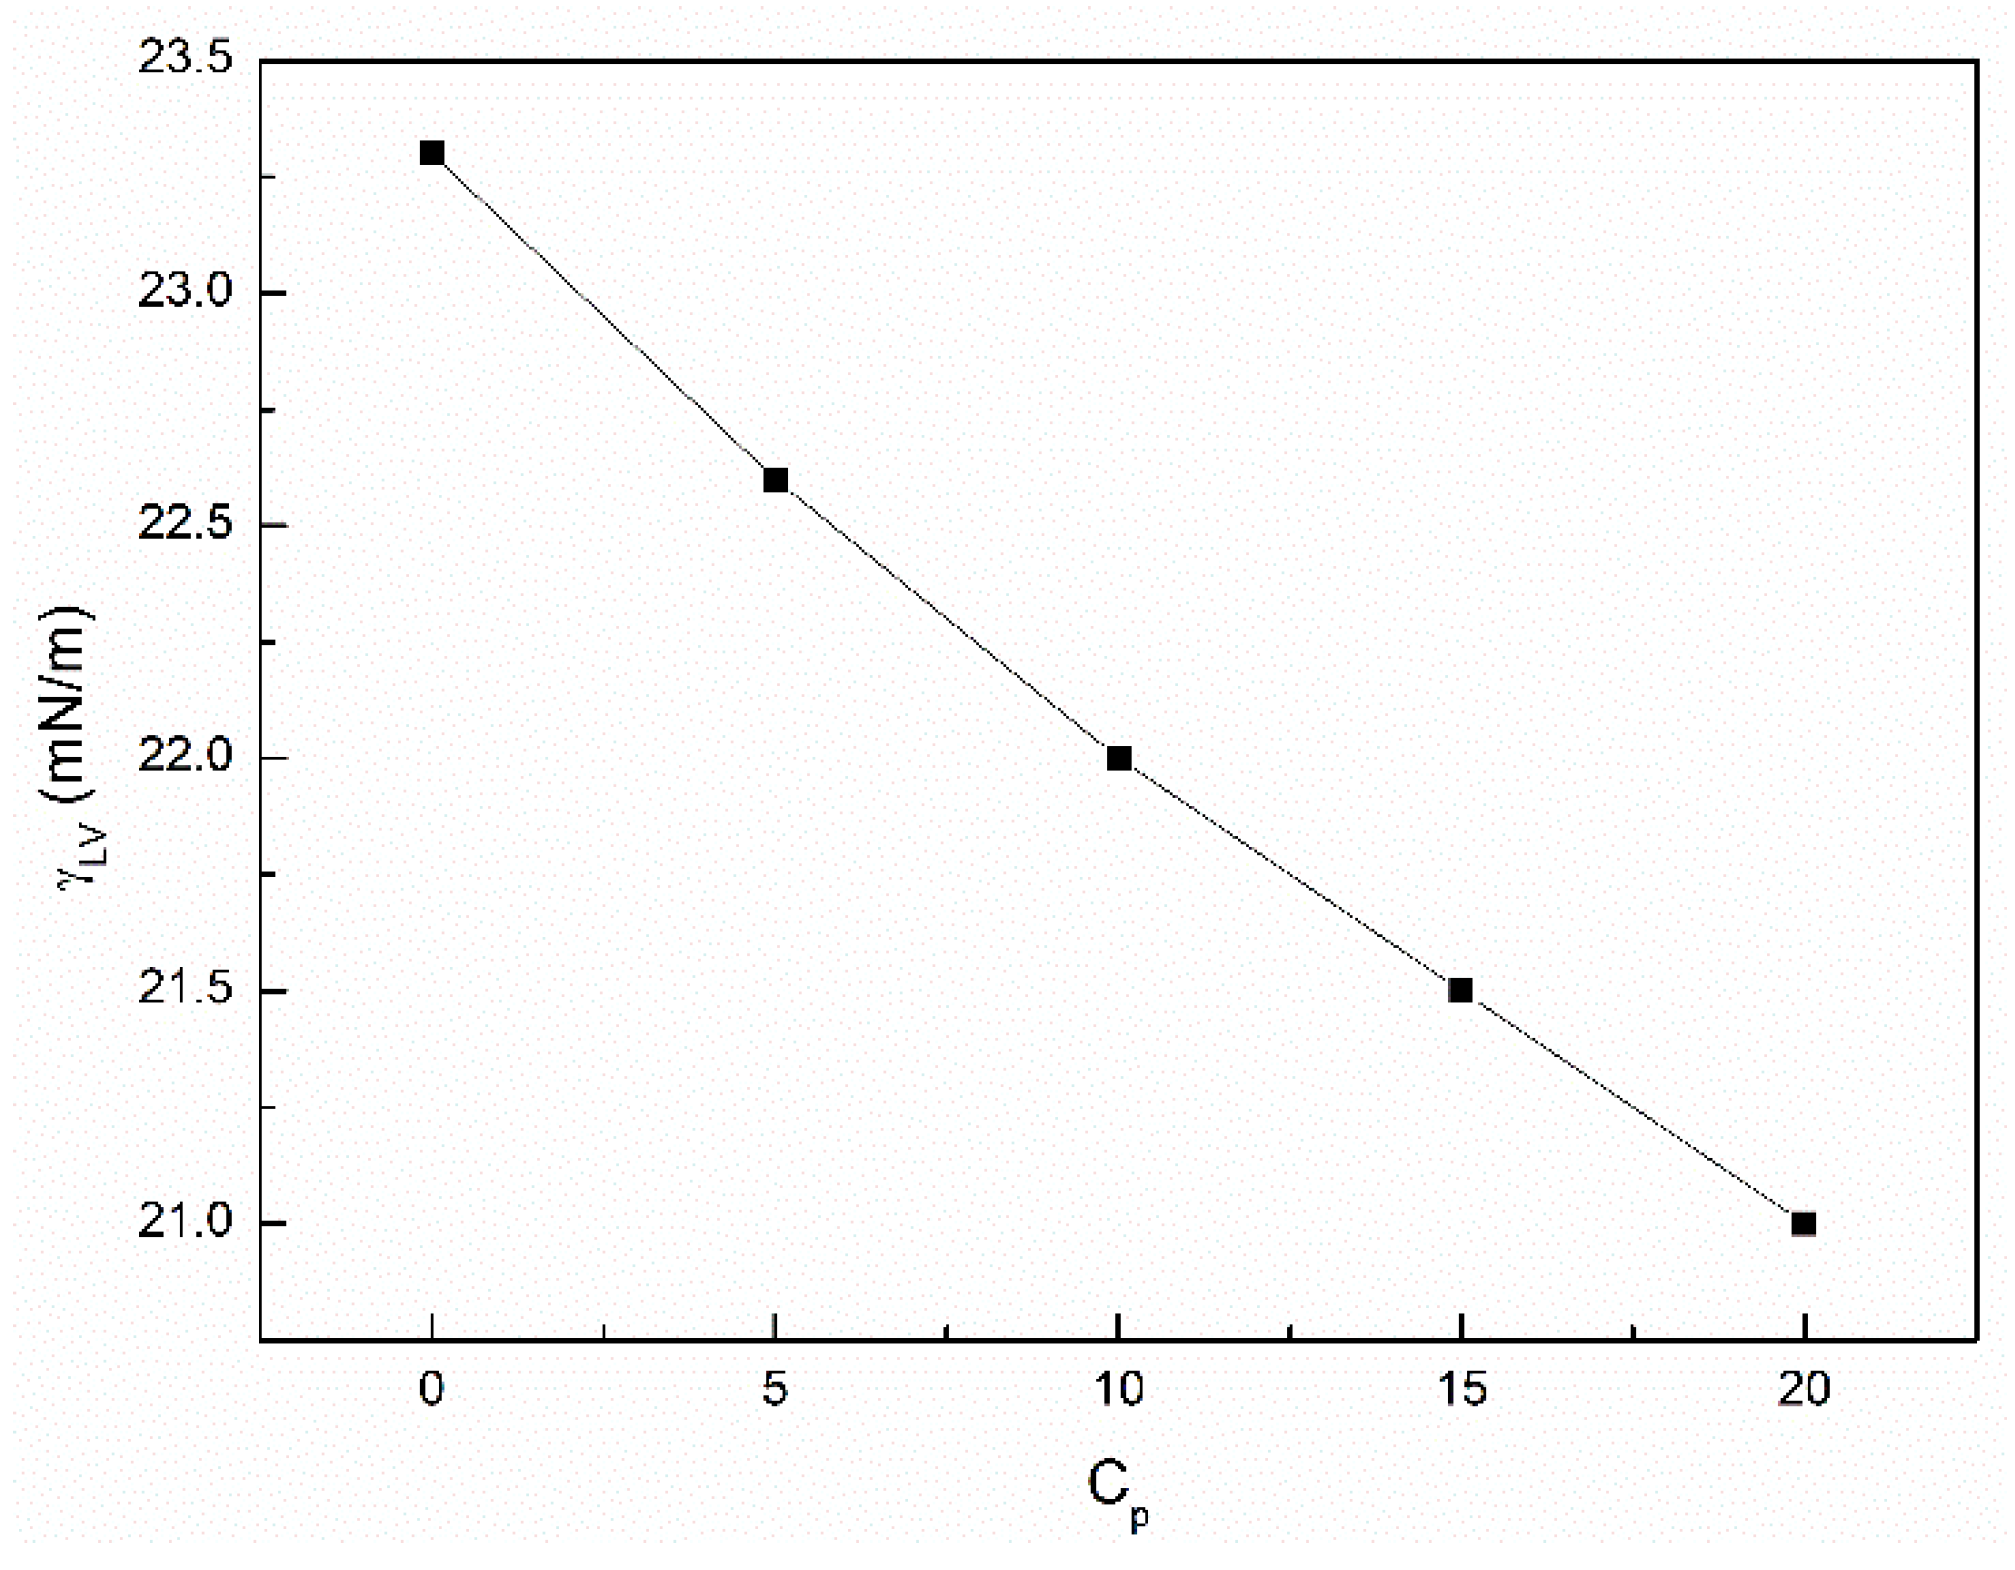
3.2. The Influence of n-Hexane and Ethanol on the Viscosity, Density and Surface Tension of Canola Oil

Canola oil cannot be directly applied for diesel engines that are adapted to diesel fuel. In order to use it as a possible fuel for diesel engines, its physicochemical properties must be changed, especially the viscosity of the oil should be significantly reduced. The viscosity of studied canola oil is equal to 70.45 mPa·s, but it should be noted that it is smaller than for example the viscosity of olive and peanut oil, but greater than those of corn and soybean oils [37,38,39,40,41,42]. This is made possible by the addition to the canola oil substances whose properties such as viscosity, density and surface tension are much smaller than those of the oil. It proved that the addition of n-hexane to canola oil decreases its viscosity, surface tension and density without significant changes of capacity heat [15]. However, despite a significant reduction affected by n-hexane the viscosity of canola oil was significantly larger than that of diesel fuel. From this point of view, for greater improvement of the canola oil viscosity, not only n-hexane, but also ethanol was added. Ethanol was introduced to the mixture of canola oil and n-hexane by contact with the mixture. It proved that the viscosity of canola oil after the contact with ethanol is significantly reduced from 70.45 to 36.61 mPa·s (Figure 3). After the contact of ethanol with the canola oil and n-hexane mixture the dynamic viscosity of the mixture decreases with the n-hexane concentration increase. This decrease is larger than that of the canola oil and n-hexane mixture without the alcohol contact with this mixture. At the concentration of n-hexane equal to 20% the viscosity of the mixture being in contact with ethanol is practically close to that of the canola oil + n-hexane (20%) mixture (Figure 3).
As mentioned above the viscosity of the liquids at a given temperature depends on the interactions between the liquid molecules and the distance between them. The magnitude of these interactions depends on the type of the liquids. In the case of the liquids such as fatty acids whose molecules can be divided into two parts—hydrophobic and hydrophilic—the main contribution to the intermolecular interactions comes from the dispersion and acid-base forces. As the surface tension of n-hexane results only from the dispersion force [26,27] and is considerably smaller than that of fatty acids (Table 1) [43], the presence of n-hexane in canola oil is expected to cause the decrease in the dispersion interactions between the molecules of canola oil components and to increase the distance between these molecules. On the other hand, the contact of ethanol with canola oil causes the decrease in the viscosity from 70.45 to 36.61 mPa·s (Figure 3), as was mentioned above. It seems that during the contact of ethanol with canola oil some substances are extracted to the ethanol phase and the structure of canola oil is changed. Probably the distance between the fatty acid molecules increases slightly. For this reason, the dispersion forces decreases significantly. On the other hand, ethanol penetrates into the oil phase and can influence also on the acid-base intermolecular interactions between the fatty acids. Considering the changes of the canola oil viscosity it should be remembered that the viscosity of n-hexane (0.3102 mPa·s) and ethanol (1.22 mPa·s) (Table 1) is considerably smaller than that for canola oil (70.45 mPa·s) (Table 1) [15,43,44].
The extraction of some substances from canola oil to the ethanol phase is confirmed by the data presented in Figure 4. The viscosity of ethanol being in contact with canola oil is larger than that of pure ethanol. The viscosity increase is caused by the substances from the canola oil dissolved in ethanol. The presence of n-hexane in the oil phase results in the decrease in ethanol viscosity. This indicates that n-hexane is in the ethanol phase. However, the volume of the ethanol phase is decreased after the contact with canola oil. Thus, there is mutual dissolution of n-hexane and ethanol as well as dissolution of some substances from canola oil in the ethanol phase. To show the mutual influence of n-hexane and ethanol dissolution on viscosity, ethanol was contacted with n-hexane. After the contact the viscosity of ethanol phase decreased from 1.22 to 1.049 mPa·s and that of n-hexane increased from 0.3102 to 0.5748 mPa·s. As follows from the data, there is large mutual dissolution of n-hexane and ethanol.
Contrary to viscosity the changes of the density of the canola oil, n-hexane and ethanol mixture from zero to 20% of n-hexane content are insignificant (Figure 5). The density values of this mixture differ only slightly from those of diesel fuel. The changes of the density of ethanol phase after its contact with the canola oil and n-hexane mixture confirm the above conclusions about the mutual dissolution of the mixture and ethanol (Figure 6).
Apart from viscosity and density, the surface tension of canola oil is an important parameter concerning application as a diesel fuel. The surface tension of canola oil is about 5 mN/m larger than that of diesel fuel (Table 1) [45]. It should be remembered that the value of the surface tension of liquid decides about the size of the drops which is important in the diesel engines. The surface tension of the liquid decides also about the wetting properties of the solid [27].
According to the viscosity the contact of ethanol with the canola oil and n-hexane mixture causes a greater decrease in the canola oil surface tension than the addition of only n-hexane to oil (Figure 7). The decrease in the ethanol phase surface tension is also observed (Figure 8). However, the value of the surface tension of ethanol phase after the contact with canola oil without n-hexane is only slightly larger than for pure alcohol (Table 1) [46,47]. This indicates that the substances from canola oil having smaller surface tension than basic components are dissolved in ethanol. As a matter of fact, the presence of the n-hexane in the canola oil reduces the surface tension of the ethanol phase. This is due to the dissolution of n-hexane in the ethanol phase. The surface tension of this phase at the concentration of n-hexane in the canola oil equal to 20 volume percent is equal to 21 mN/m (Figure 8). To determine the maximal influence of n-hexane dissolution on the ethanol surface tension the n-hexane phase was contacted with the ethanol one. It appeared that the surface tension of the n-hexane phase was equal to 19.9 mN/m and that of the alcohol was equal to 20.4 mN/m. This fact suggests that at the concentration of n-hexane in the oil phase equal to 20%, the ethanol phase being in the contact with the canola oil and n-hexane mixture is saturated by n-hexane. The mutual dissolution of ethanol and n-hexane is important when the substances are used for changes of the physical and chemical properties of the canola oil regarding its application as the diesel fuel. The mutual dissolution of n-hexane and ethanol affects the interface tension of canola oil-n-hexane and canola oil-ethanol as well as n-hexane-ethanol. The interface tension of canola oil with n-hexane-ethanol decreases with the increasing concentration of n-hexane in canola oil (Figure 9). This tension at the n-hexane concentration equal to 20% (1.6 mN/m) is close to that of the ethanol-n-hexane interface tension (1.42 mN/m).
The interface tension is connected with the surface tension of the two phases being in the contact. In the literature there are many approaches to express the liquid-liquid and/or solid-liquid interface tension as a function of the surface one. Among them, these of van Oss et al. [27,48] and Owens and Wendt [49] are the most often applied in practice. According to van Oss et al. [27,28] one can write the following:
γ i j = γ i + γ j 2 γ i L W γ j L W 2 γ i + γ j 2 γ i γ j +
where γ is the surface tension of the liquid or the solid and γ L W is the Lifshitz-van der Waals component of γ , γ + and γ are the electron-acceptor and the electron-donor parameters of the acid-base component ( γ A B ) of the surface tension, respectively. The subscripts i and j refer to phases i and j.
Owens and Wendt proposed the following equation [49]:
γ i j = γ i + γ j 2 γ i a γ j a 2 γ i p γ j p
where a and p refer to the dispersion (apolar) and polar components of the surface tension of a given phase.
In the case when the surface tension of at least one phase results only from the Lifshitz-van der Waals or dispersion intermolecular interactions Equations (2) and (5) assumed the simpler forms [26,27]:
γ i j = γ i + γ j 2 γ i L W γ j L W
and
γ i j = γ i + γ j 2 γ i a γ j a
Assuming that there is not mutual dissolution of the n-hexane and alcohol and knowing that the surface tension of n-hexane results only from the Lifshitz-van der Waals intermolecular interactions the n-hexane-ethanol interface tension was calculated from Equation (6) and is equal to 1.91 mN/m. As for n-hexane and ethanol, the Lifshitz-van der Waals and dispersion component has the same value, and the n-hexane-ethanol interface tension calculated from Equation (7) has the same value as that calculated from Equation (6). The measured value of n-hexane-ethanol interface tension is equal to 1.42 mN/m. This indicates that the mutual n-hexane and ethanol dissolution changes the interface tension value. In turn, let us assume that the solution of n-hexane in the ethanol is ideal. In such a case the composition of the solution can be determined based on the surface tension. As mentioned above the surface tension of the ethanol saturated by n-hexane was equal to 20.4 mN/m. Thus, for the ideal n-hexane solution in ethanol the mole fraction of n-hexane is equal to 0.59. In such case Equations (6) and (7) are not fulfilled.

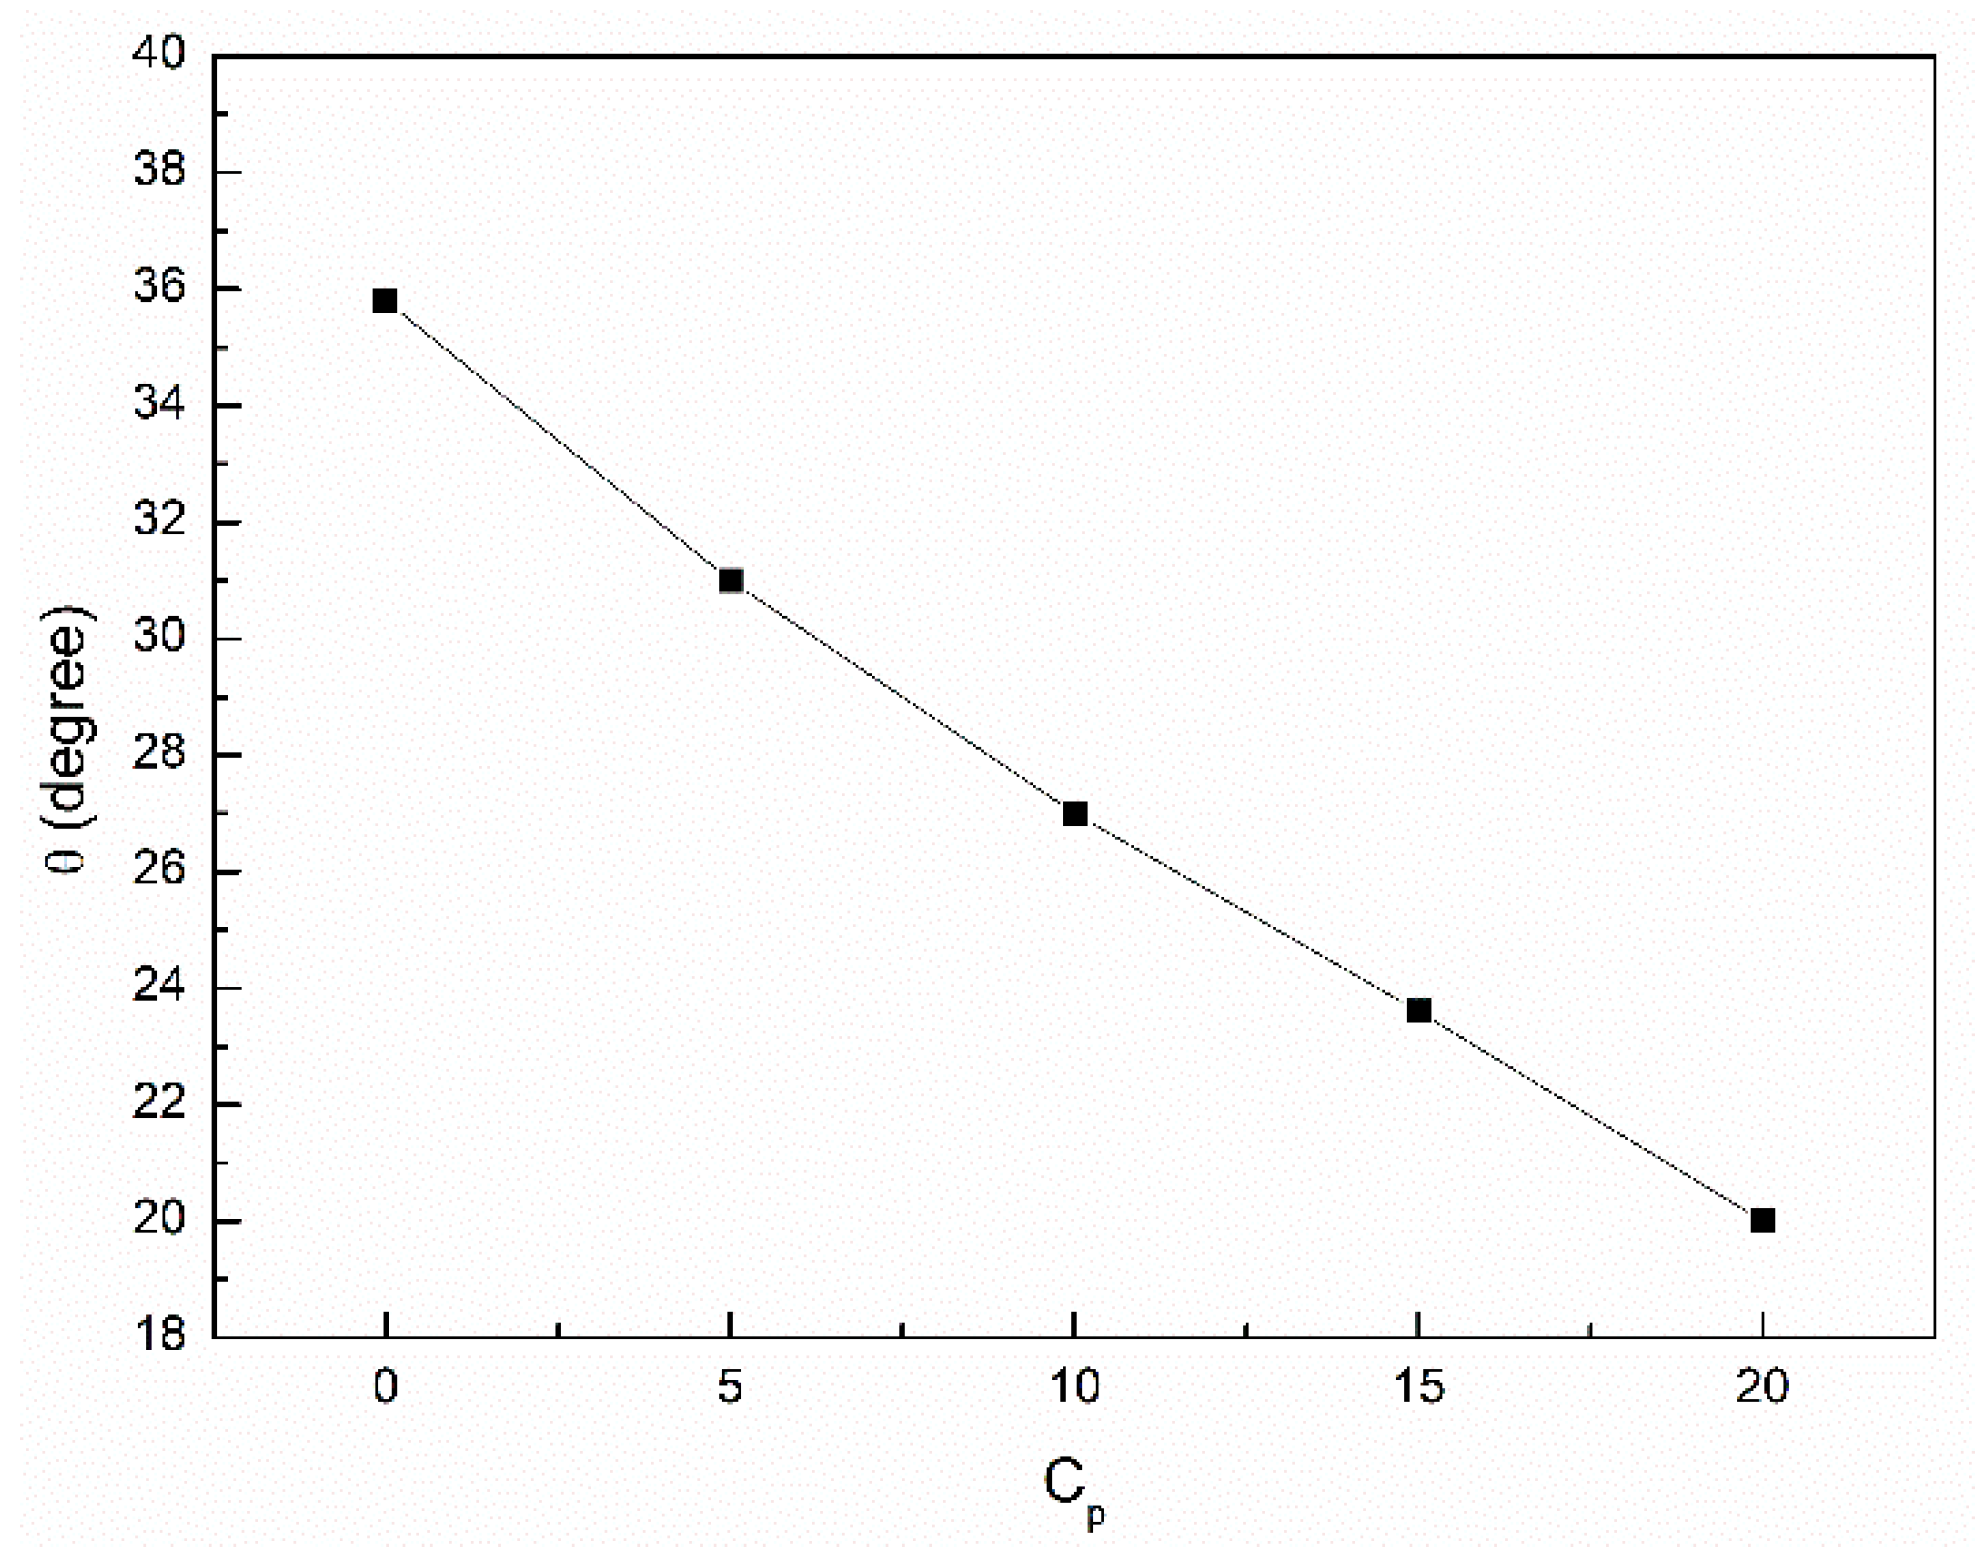
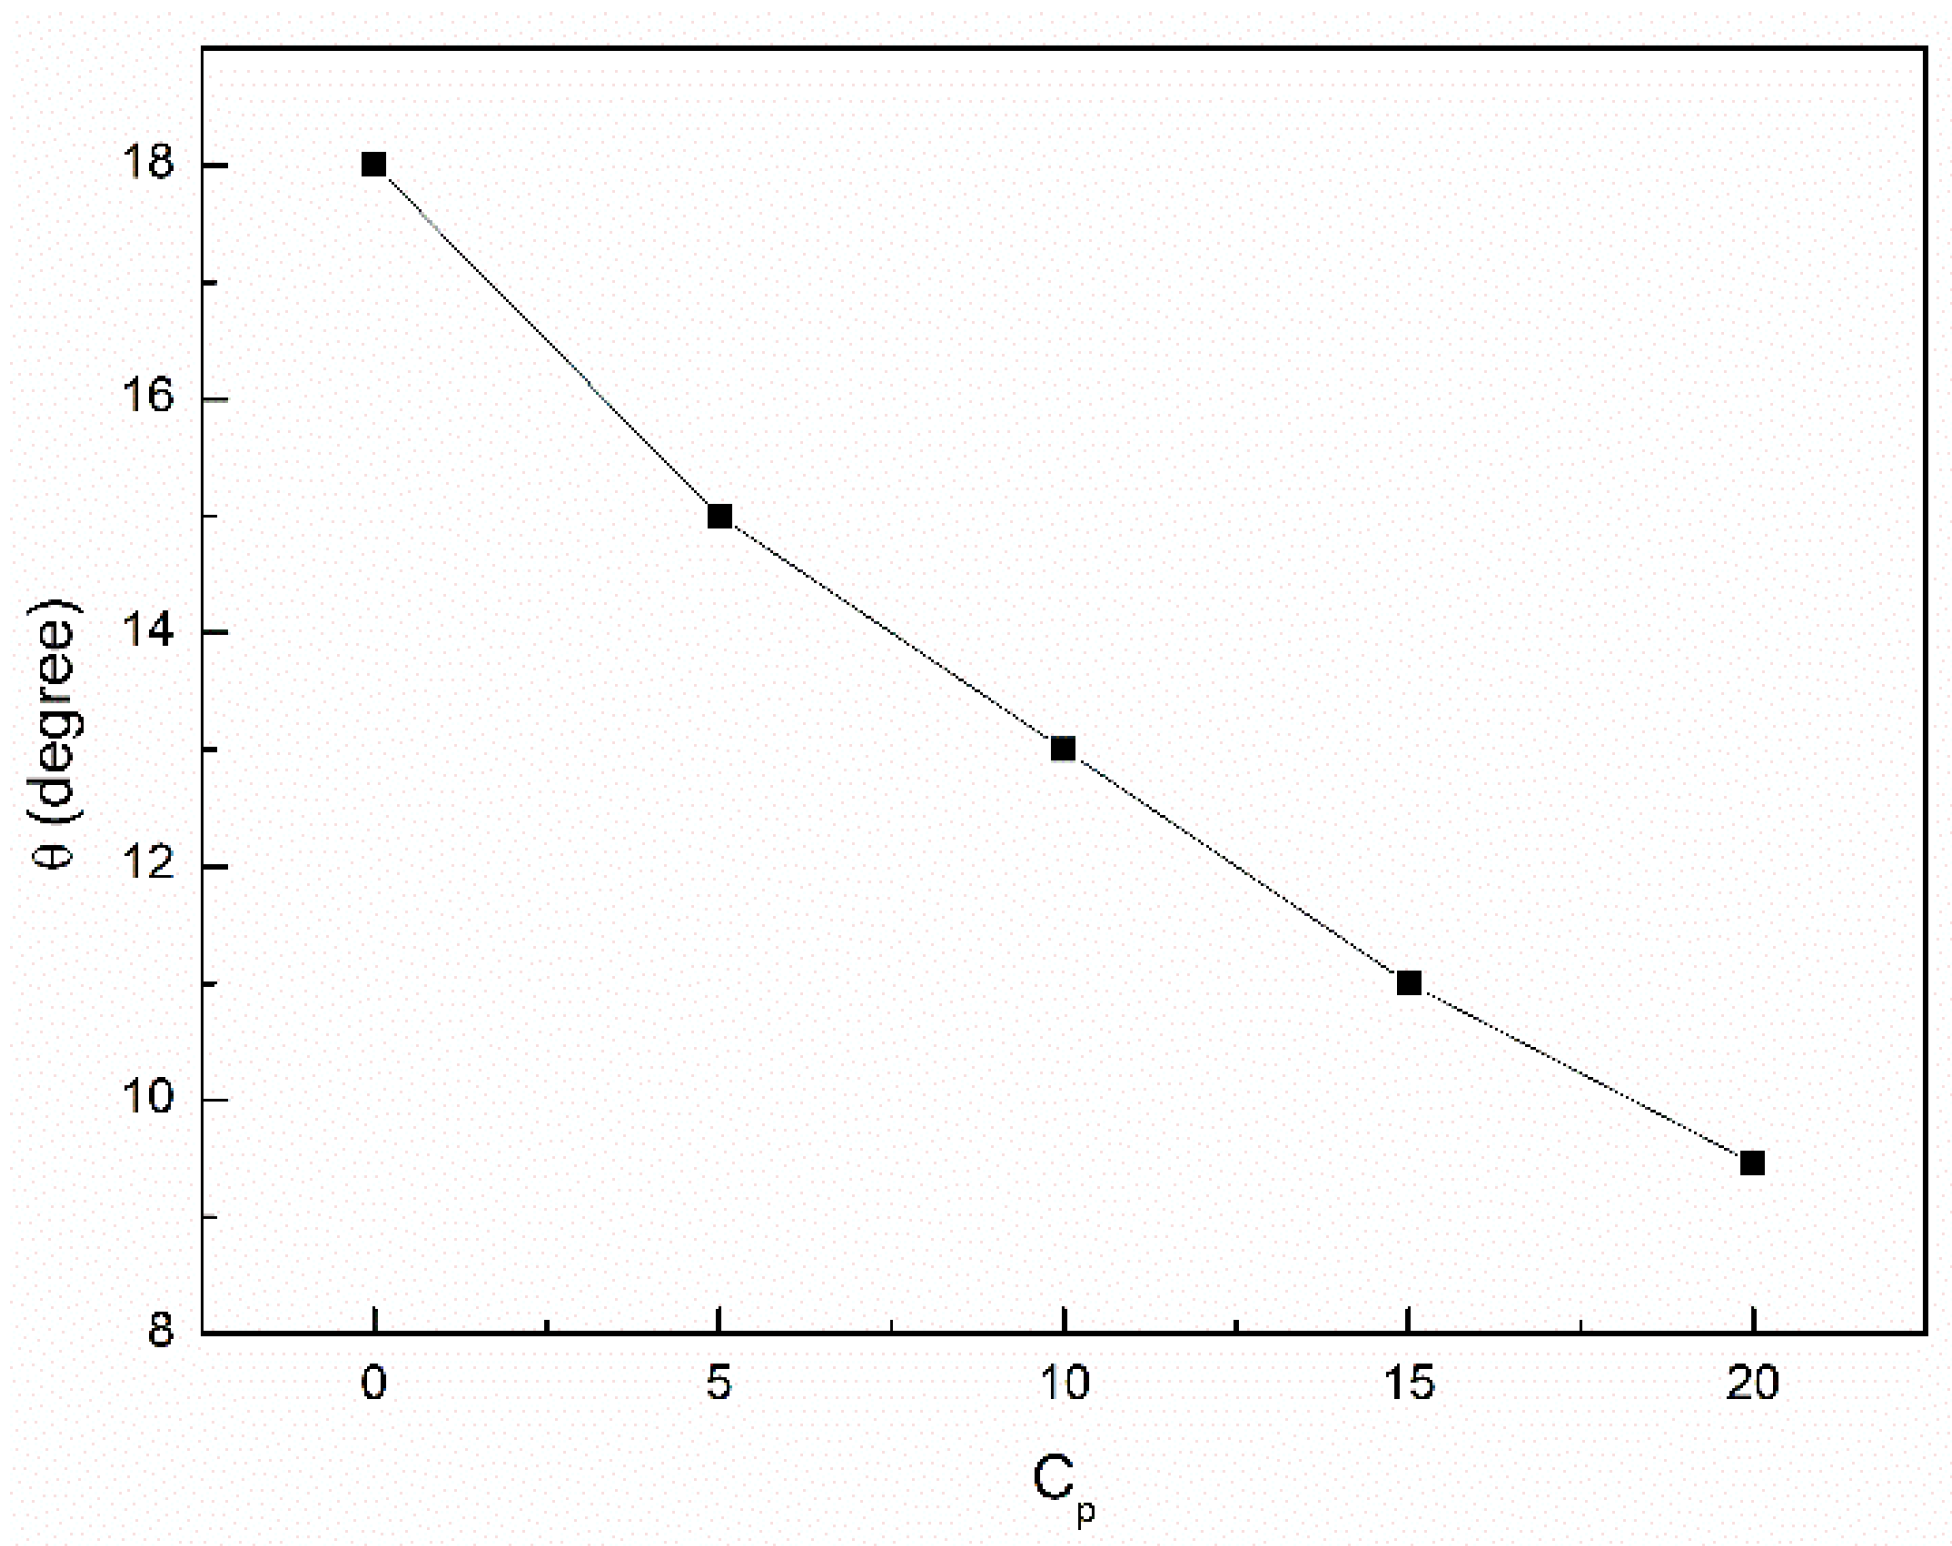
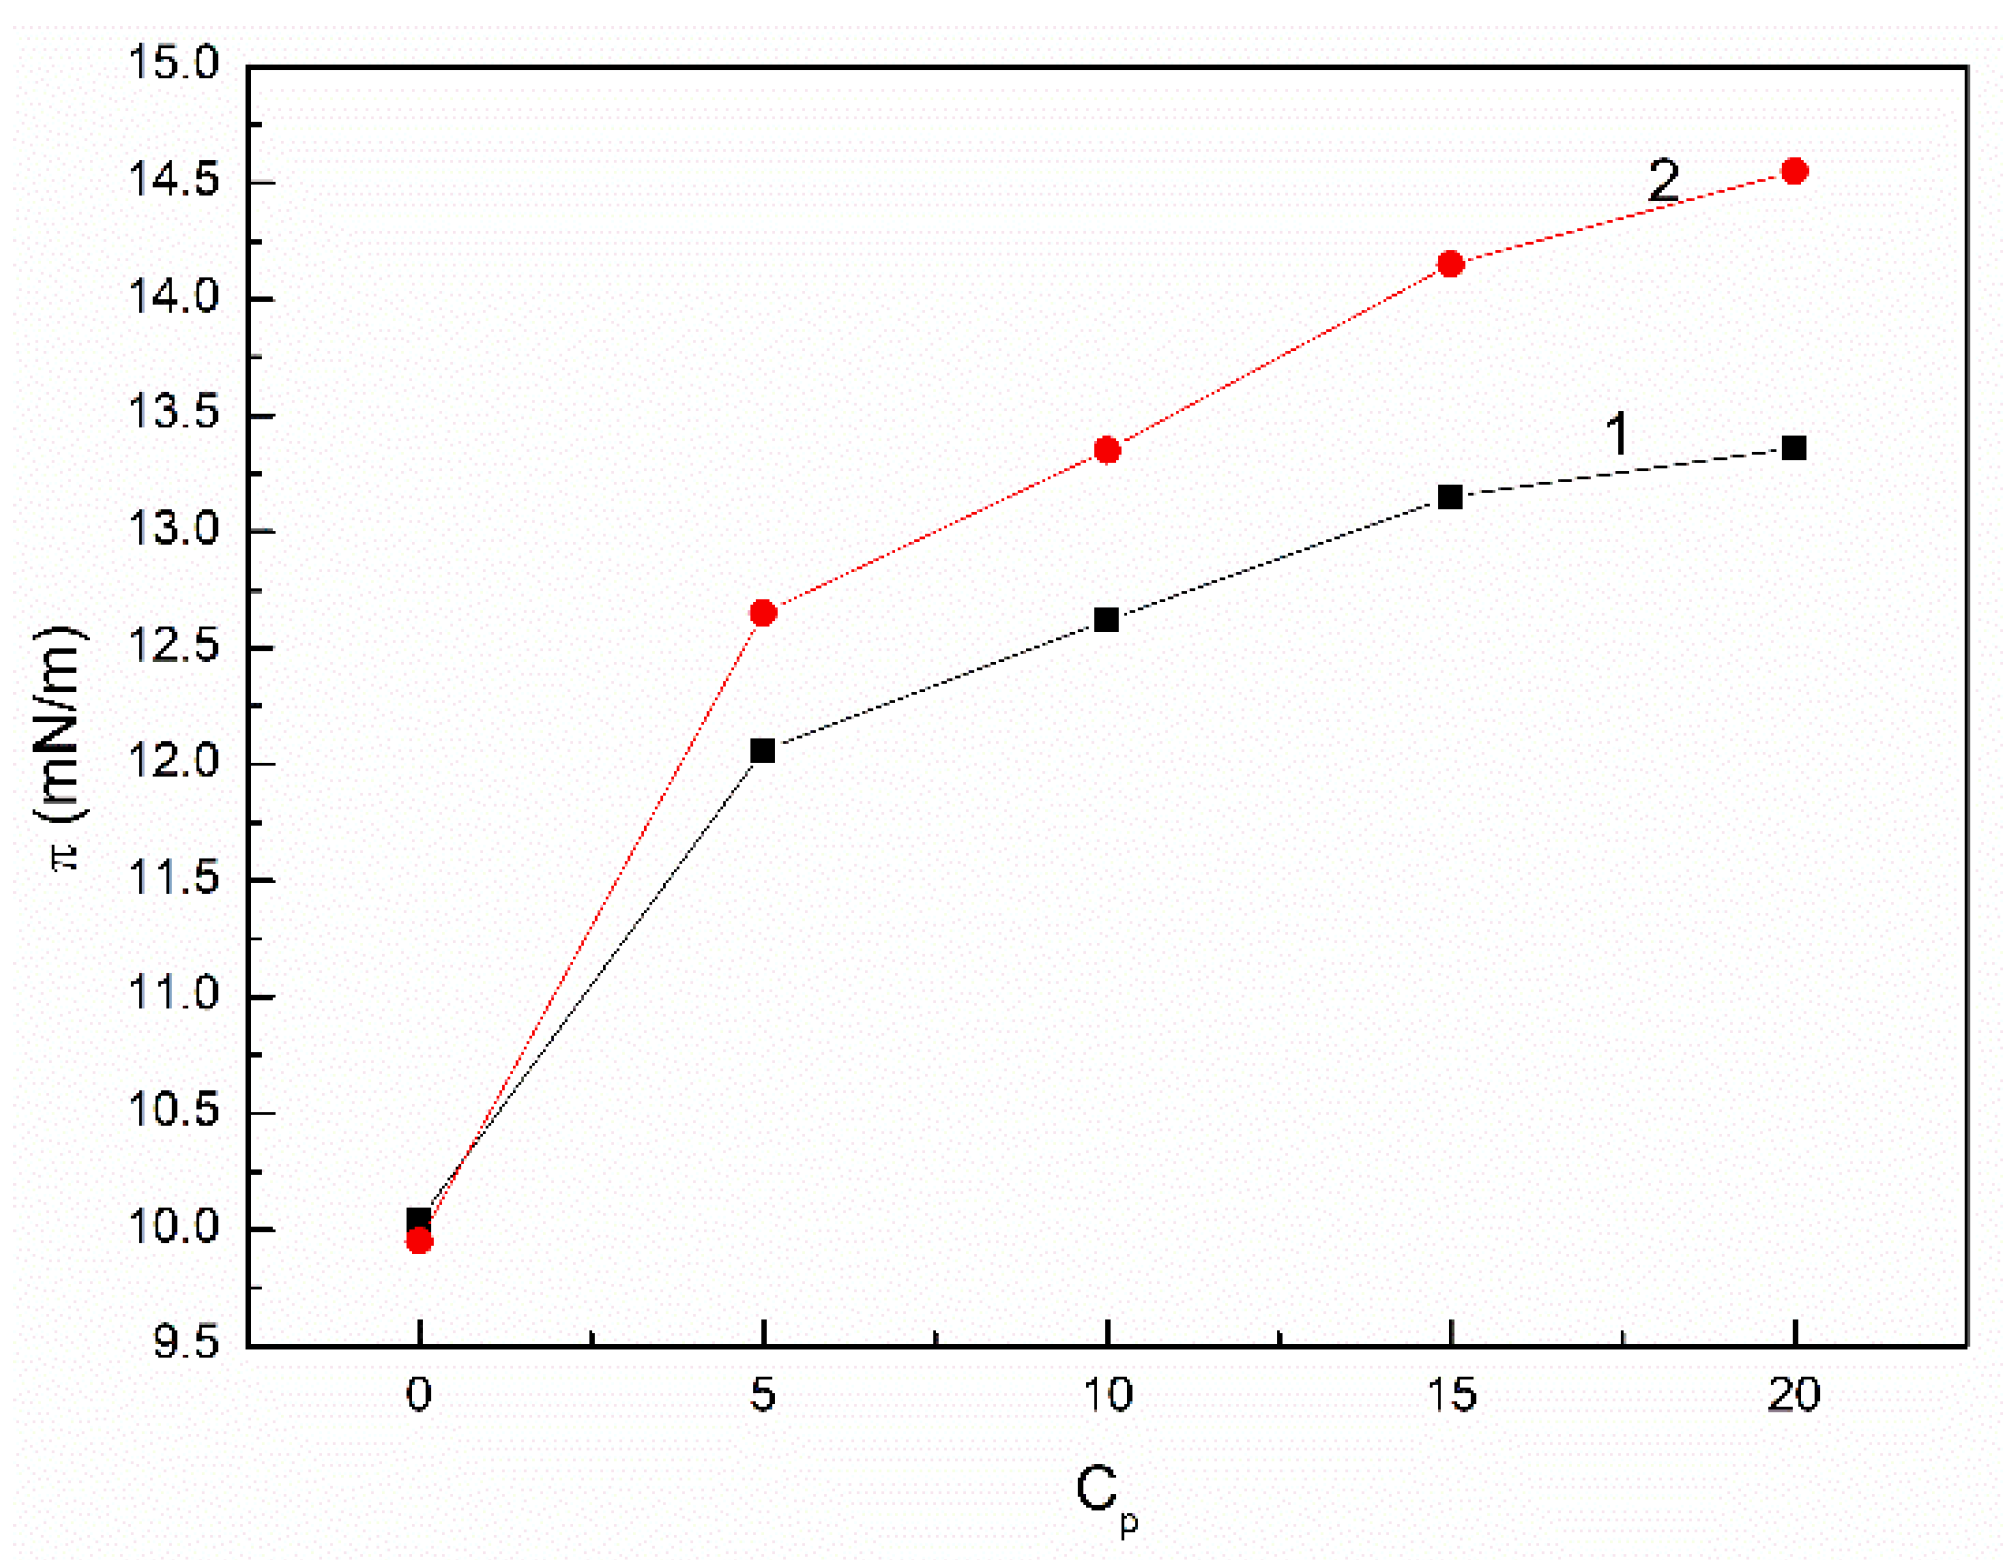
3.3. Wetting Properties of the Canola Oil Mixture with n-Hexane and Ethanol

The surface tension of the mixture of canola oil with n-hexane and ethanol plays an important role in the wetting process, which has also influence on the potential application of canola oil as a diesel fuel. Therefore, the contact angle of the studied mixtures on polytetrafluoroethylene (PTFE) and engine valve was measured (Figure 10, Figure 11 and Figure 12). The contact angle of the canola oil and n-hexane mixture contacted with ethanol on the PTFE and engine valve surface decreases as a function of n-hexane concentration. This decrease is larger than for the canola oil with the n-hexane in the absence of ethanol. The contact angle of ethanol being in the contact with the canola oil and n-hexane mixture also decreases as a function of n-hexane concentration. The contact angle of the canola oil with n-hexane mixture being in contact with ethanol on the engine valve is small and decreases with the n-hexane concentration. It should be stressed that similarly to viscosity there is no linear dependence between the contact angle of the canola oil, n-hexane and ethanol mixture and the composition of the mixture. The decrease in the contact angle as a function of the n-hexane concentration is larger than it results from the values of the canola oil, n-hexane and ethanol surface tension. This indicates that the composition of the surface layer is different from that of the bulk phase.
The value of the contact angle on the surface of the given solid depends not only on the total surface tension of liquid and solid but also on the components and parameters of this tension. This dependence results from the Young equation and the approaches to the interface tension proposed by van Oss et al. and/or Owens and Wendt [27,48,49].
The Young equation has the following form [50]:
γ S V γ S L = γ L V cos θ
where θ is the contact angle. The subscripts SV, SL and LV refer to the solid-air, solid-liquid and liquid-air interface tension, respectively.
Introducing Equation (4) to Equation (8) we obtain the following [27]:
γ L V ( cos θ + 1 ) = 2 γ L V L W γ S V L W + 2 γ L V + γ S V + 2 γ L V γ S V +    
If the surface tension of solid and liquid results from the Lifshitz-van der Waals interactions, then Equation (9) assumes the form:
γ L V ( cos θ + 1 ) = 2 γ L V L W γ S V L W
From Equations (5) and (8) we obtain the following results [49]:
γ L V ( cos θ + 1 ) = 2 γ L V a γ S V a + 2 γ L V p γ S V p
and/or liquid surface tension results from only dispersion interactions [26]:
γ L V ( cos θ + 1 ) = 2 γ L V a γ S V a
Taking into account the contact angle values of the canola oil with n-hexane and the ethanol phase on PTFE and their surface tension as well as that of PTFE (20.24 mN/m) [25] the values of γ L V L W and γ L V a were calculated from Equations (10) and (12), respectively. In fact, the γ L V L W values are equal to γ L V a and they are different only by the definition if they are determined from the contact angle of liquid or solution on the apolar solids surface whose surface tension results from only apolar interactions. The values of γ L V p of canola oil with n-hexane and ethanol are equal to γ L V γ L V a and γ L V A B to γ L V γ L V L W . According to van Oss et al., γ L V A B = 2 γ L V + γ L V . This means that γ L V p = γ L V A B . The apolar and polar components of the surface tension of both phases in the canola oil with the n-hexane/ethanol system decrease with the increasing n-hexane concentration (Figure 13).
This decrease is not straight linearly. There is a synergetic effect in the reduction in not only total surface tension but its components too. The decrease in apolar and polar components of the surface tension of both phases as a function of n-hexane concentration results from the fact that the surface tension of n-hexane is the smallest of all components of the studied system and results from the dispersion intermolecular interactions [26]. However, the concentration of n-hexane at the canola oil with n-hexane-air interface is probably higher than in the bulk phase and therefore there is no linear dependence of the surface tension components and n-hexane concentration. It should be mentioned that the components of the canola oil with n-hexane mixture surface tension after the contact with ethanol were determined based on the contact angle on the PTFE surface. In such case there is no dissolution of n-hexane, canola oil and ethanol in the PTFE and all components are in the liquid phase. However, at the canola oil and n-hexane mixture saturated with ethanol-ethanol interface all components can be present in both phases. Thus, it is interesting to find out whether it is possible to predict the interface tension between these phases based on the components of the surface tension of both phases determined from the contact angle on PTFE. For this purpose, the canola oil with n-hexane-ethanol interface tension was calculated from Equation (5). It proved that the calculated values of the interface tension are smaller than those of the measured ones (Figure 9). This confirms our previous conclusion that based on the components of the surface tension of the liquids determined from the contact angle it is impossible to obtain the same values of the liquid-liquid interface tension as these measured. To confirm this conclusion, we calculated the canola oil with n-hexane-ethanol interface tension from Equation (4). This equation was solved numerically. For the calculation of interface tension there were chosen the electron-acceptor and electron-donor parameters of the acid-base components of the surface tension of the phases being in the contact in such a way as to obtain the maximum value of the interface tension at a given concentration of n-hexane in the canola oil. It appeared that the maximal value of the interface tension possible to obtain was close to that calculated from Equation (3) (Figure 9). These values were obtained with the constant small value of electron-acceptor parameter (Figure 11) and valuable electron-donor one. Why are there such differences between the calculated and measured values of interface tension? The concentration of the particular components of the canola oil solution at the liquid-air and PTFE-liquid interfaces is probably the same. However, at the liquid-liquid interface it is different from that at the liquid-air one.
Contrary to the liquid-liquid interface tension, the components and parameters of the surface tension of the canola oil and n-hexane mixture saturated by ethanol should be useful for prediction of the engine valve wetting. However, the calculations made using the components and parameters of the surface tension of the engine valve as well as the canola oil and mixture saturated by ethanol indicate that the solution of canola oil should spread over the engine valve surface completely. This means that Equation (9) does not describe the equilibrium state of the engine valve-canola solution drop-air system. It seems that around the canola solution drop settled on the engine valve surface the film of liquid is formed. If so then Equation (9) assumes the following form [51]:
γ L V ( cos θ + 1 ) = 2 γ L V L W γ S V L W + 2 γ L V + γ S V + 2 γ L V γ S V + π
where π is the film pressure around the canola solution drop settled on the valve surface.
As follows at the first approximation, the π values are equal to the difference between the surface tension of the engine valve and that of solution (Figure 14). This means that settling the drop of canola oil and n-hexane mixture saturated by ethanol on the engine valve results in the complete spreading and then the contact angle formation. This phenomenon is similar to benzene spreading over the water surface [52].
It results from the above discussion that the presence of ethanol in the canola oil and n-hexane mixture makes the physiochemical properties of canola oil more similar to the diesel fuel. However, the presence of ethanol in this mixture reduce the heat of combustion insignificantly because ethanol combustion heat is equal to 23,439.35 kJ/dm3 [15]. This value is smaller than those of canola oil and n-hexane. On the other hand, during the ethanol contact with the n-hexane and canola oil mixture an amount of n-hexane passes to the ethanol phase. Thus, the changes of combustion heat of the mixture after the contact with ethanol cannot differ insignificantly from those without contact. It should be also mentioned that the amount of oxygen needed to burn 1 dm3 of ethanol is equal to 59.95 mole and is smaller than that of n-hexane. Thus, a small reduction in capacity heat requires fewer oxygen moles.

4. Conclusions

Based on the measured values and their consideration the following can be stated:
  • The surface tension of canola oil is higher than that of unsaturated and saturated fatty acids being its components, which can result from the greater density of particular chemical groups at the liquid-air interface in comparison to the particular components of canola oil.
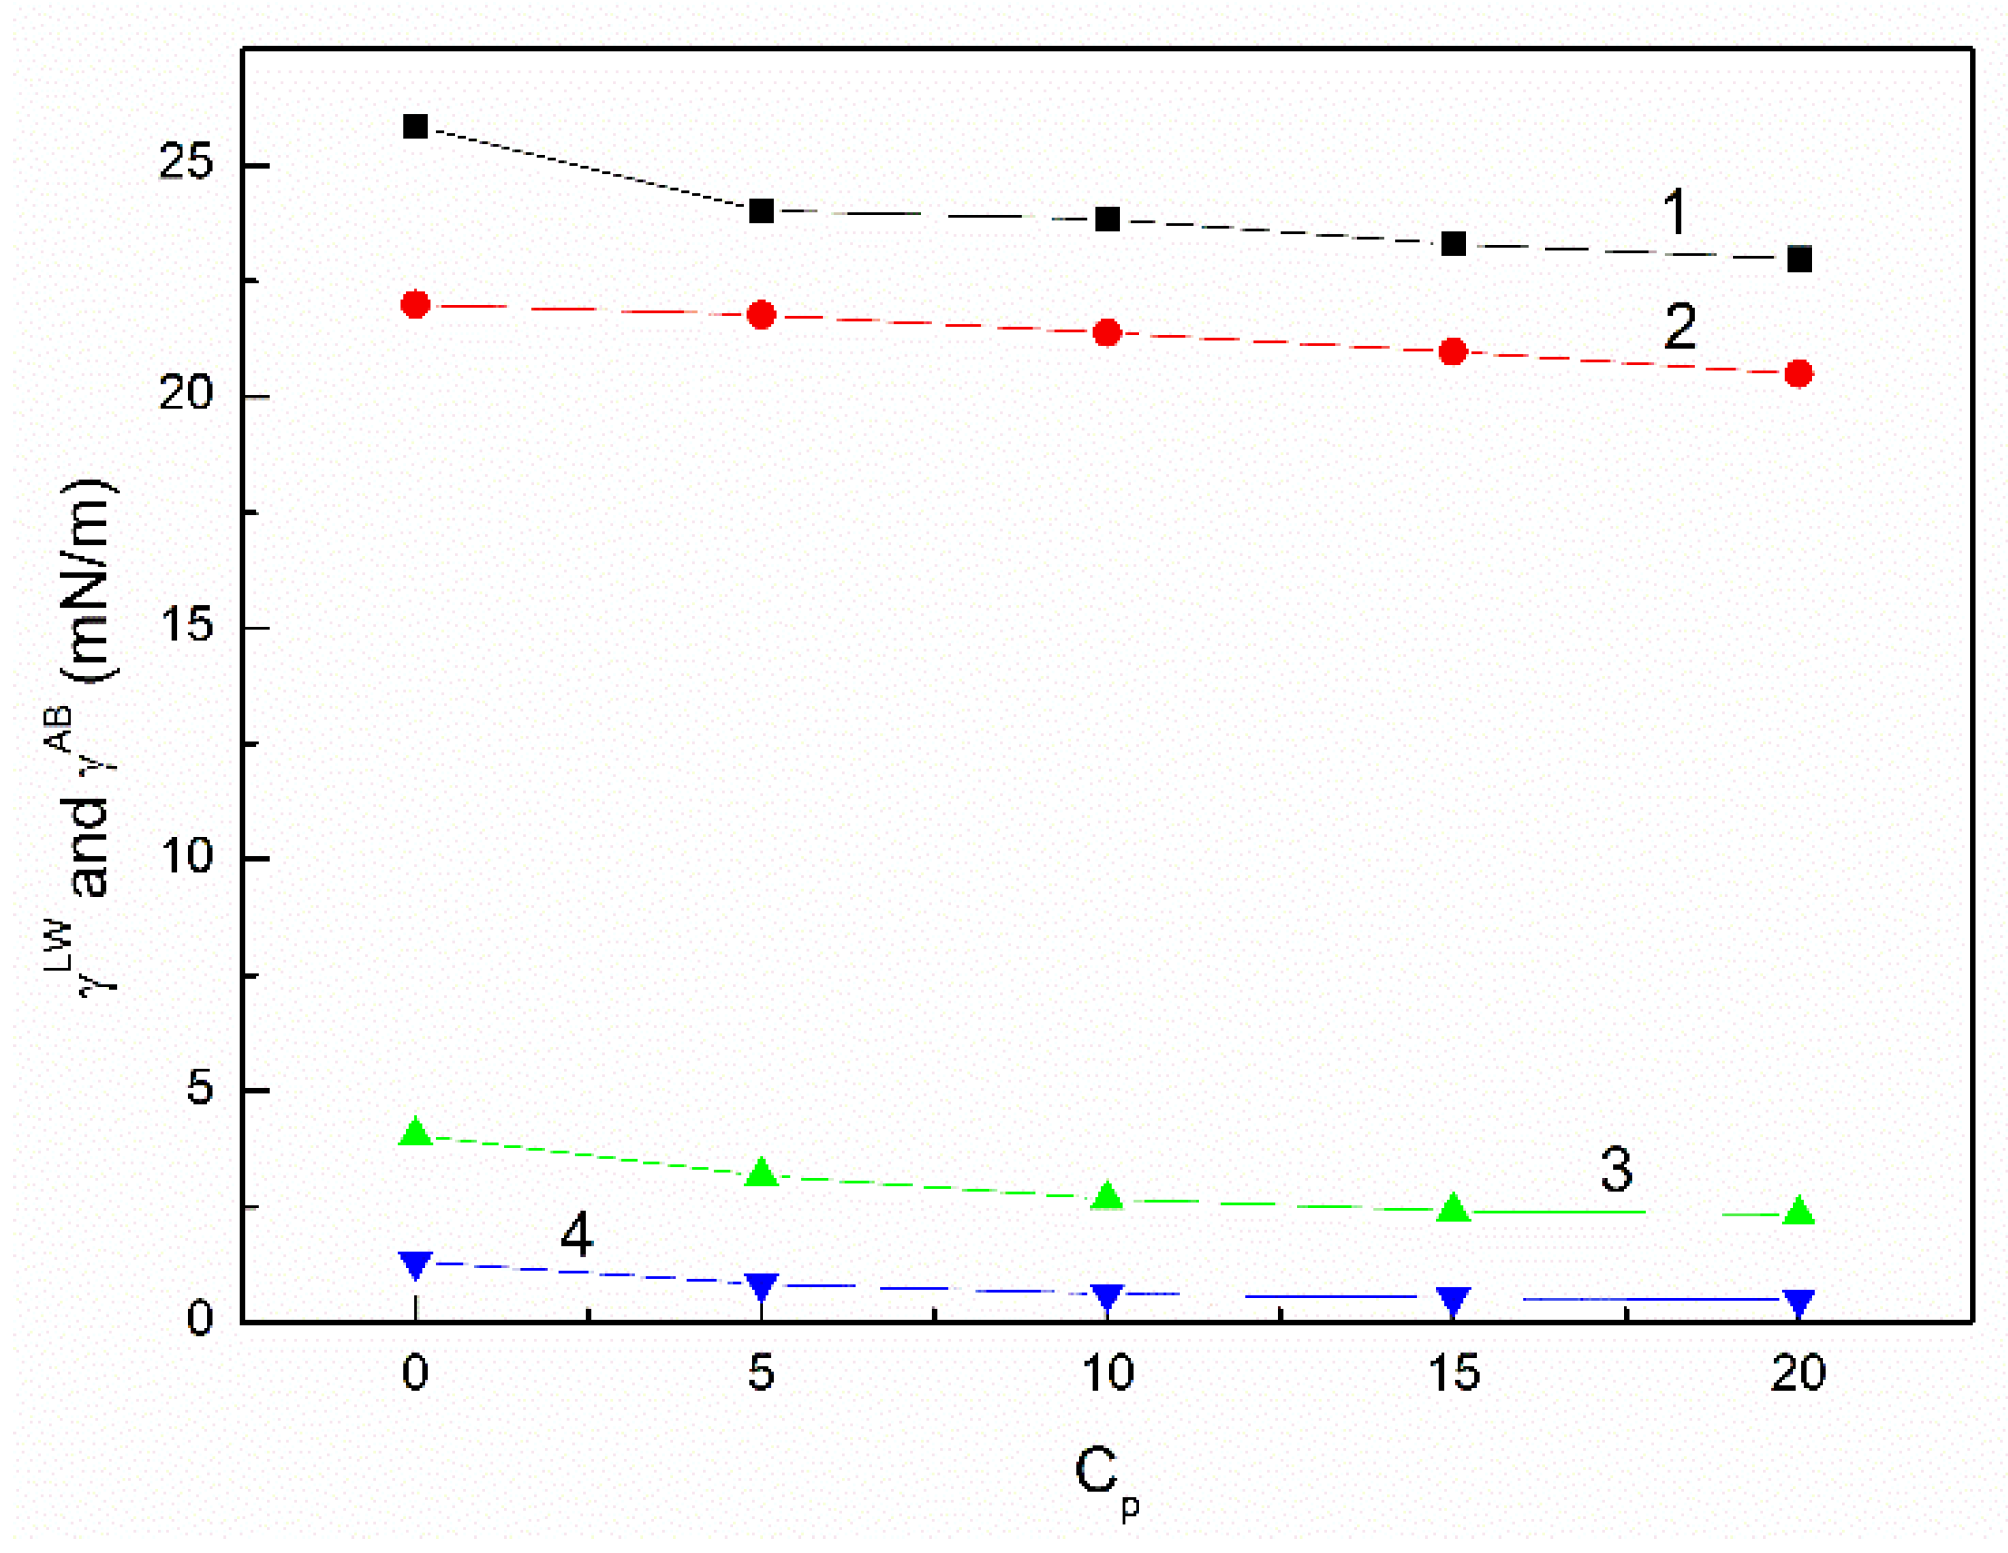
  • The surface tension of canola oil as well as its components results from the Lifshitz-van der Waals, electron-acceptor and electron-donor intermolecular interactions. However, the contribution of the Lifshitz-van der Waals intermolecular interactions to the surface tension is considerably greater than the acid-base one.
  • The density and viscosity of canola oil similar to the surface tension are greater than those for the unsaturated and saturated fatty acids being the components of canola oil. This phenomenon can result from the decrease in the volume of canola oil in comparison to the sum of the volume of individual its components resulting from the increasing intermolecular interactions.
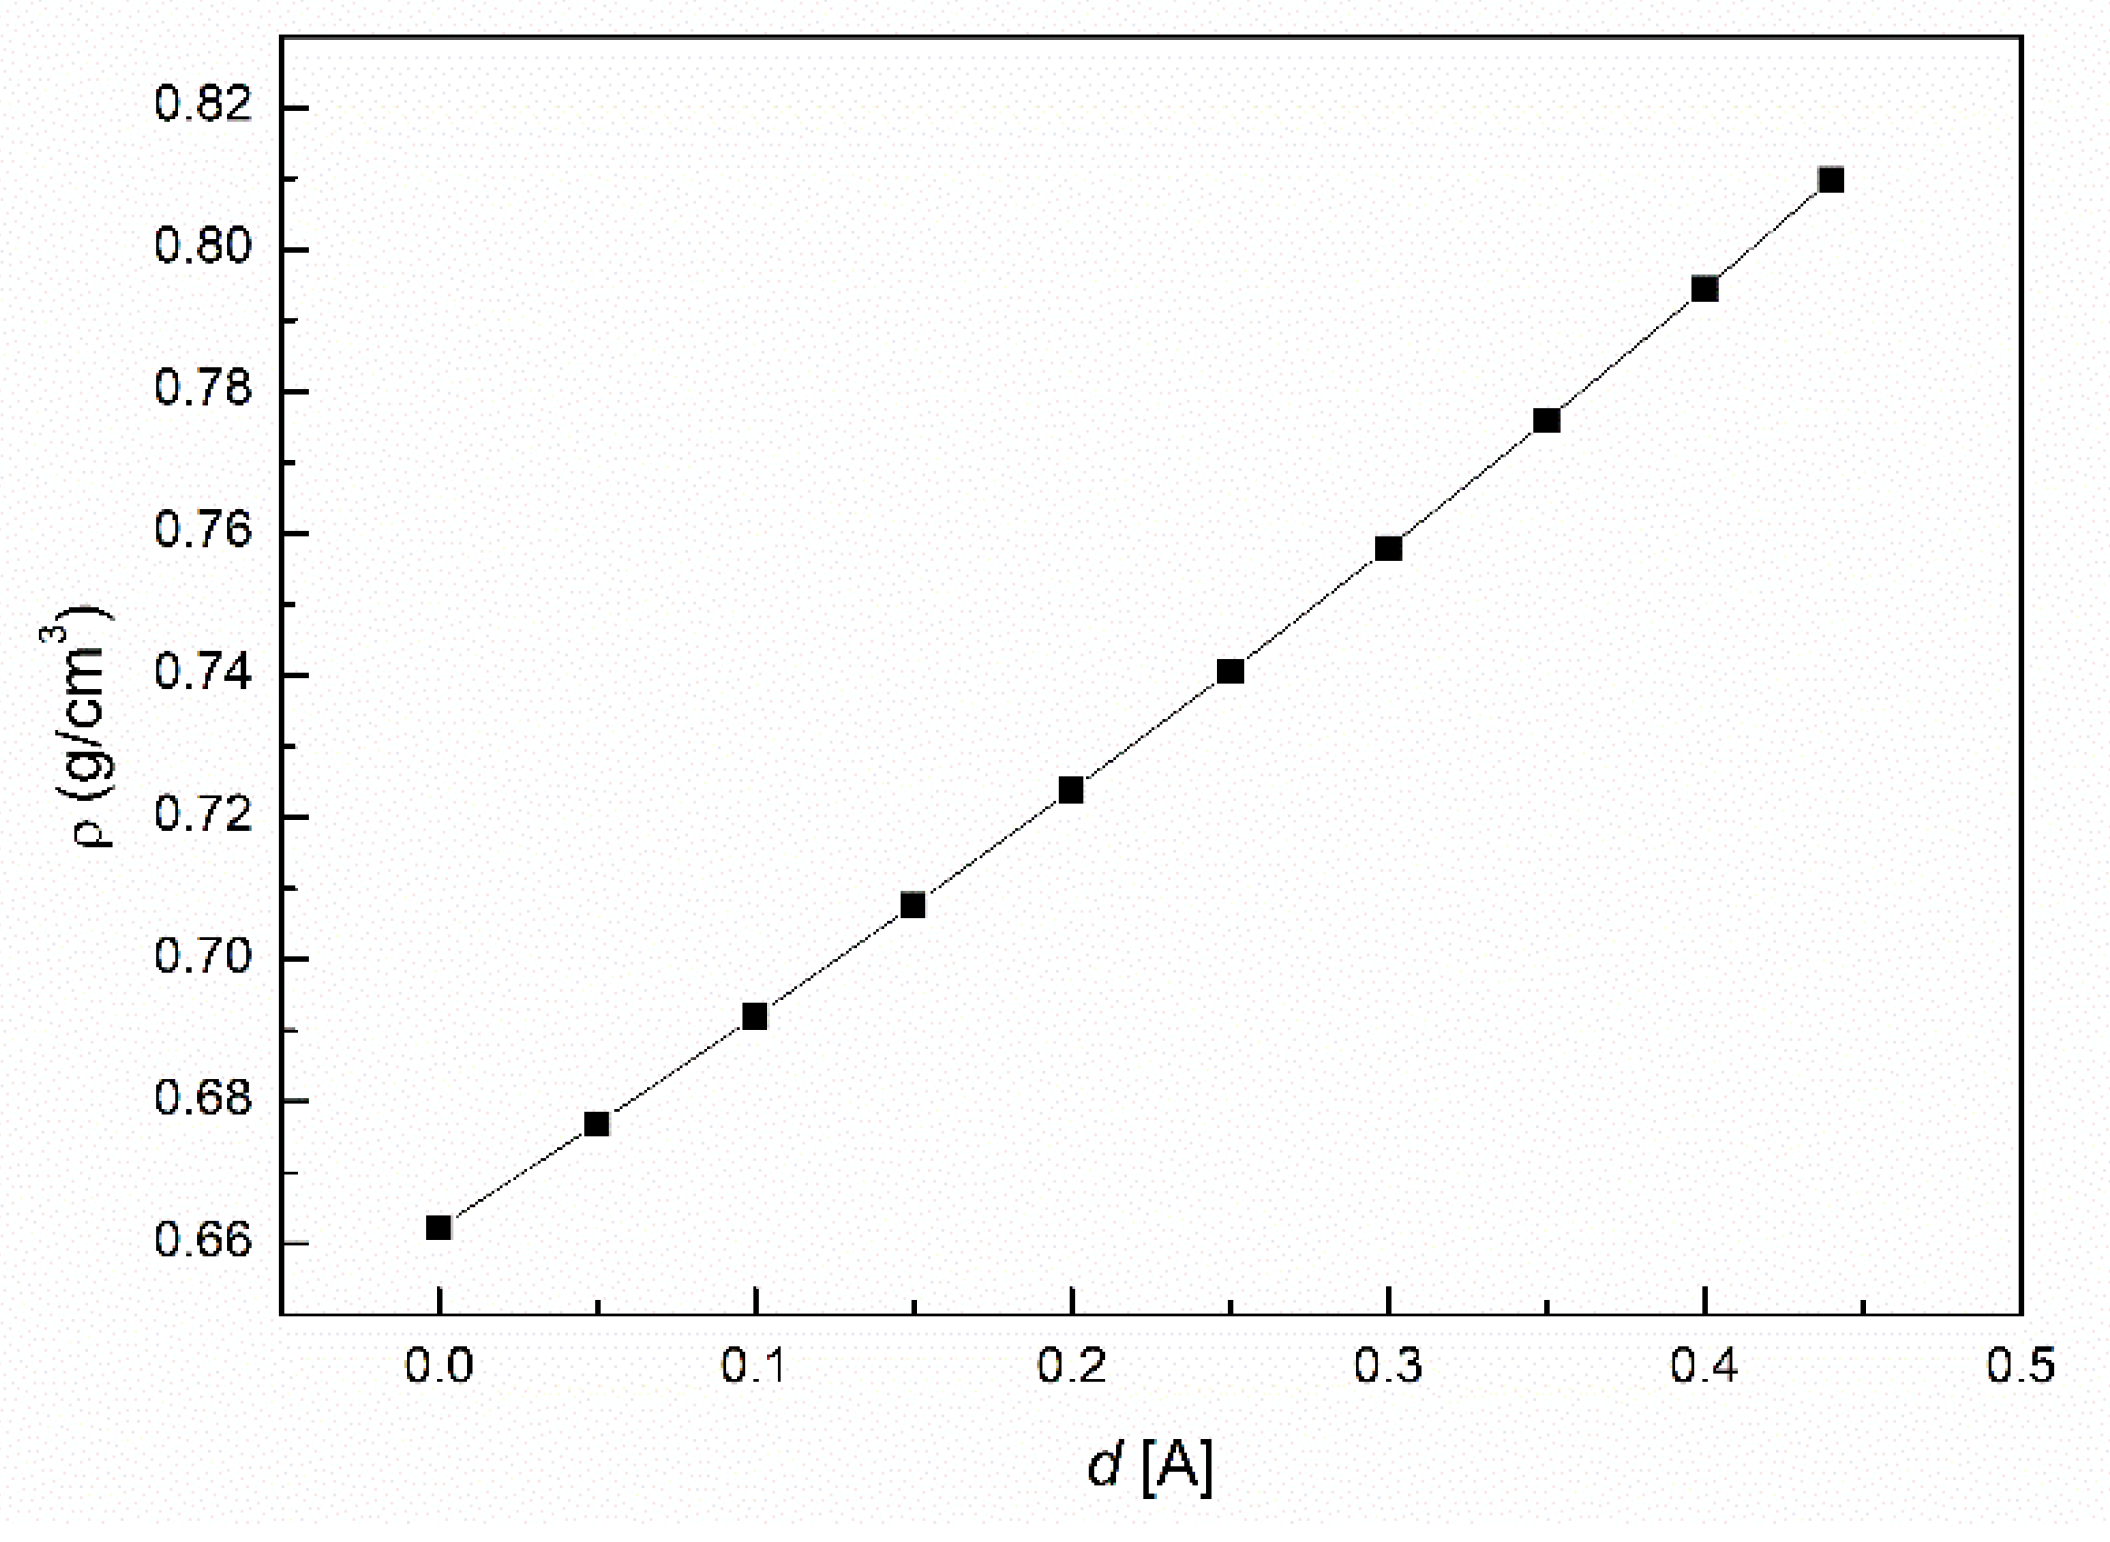
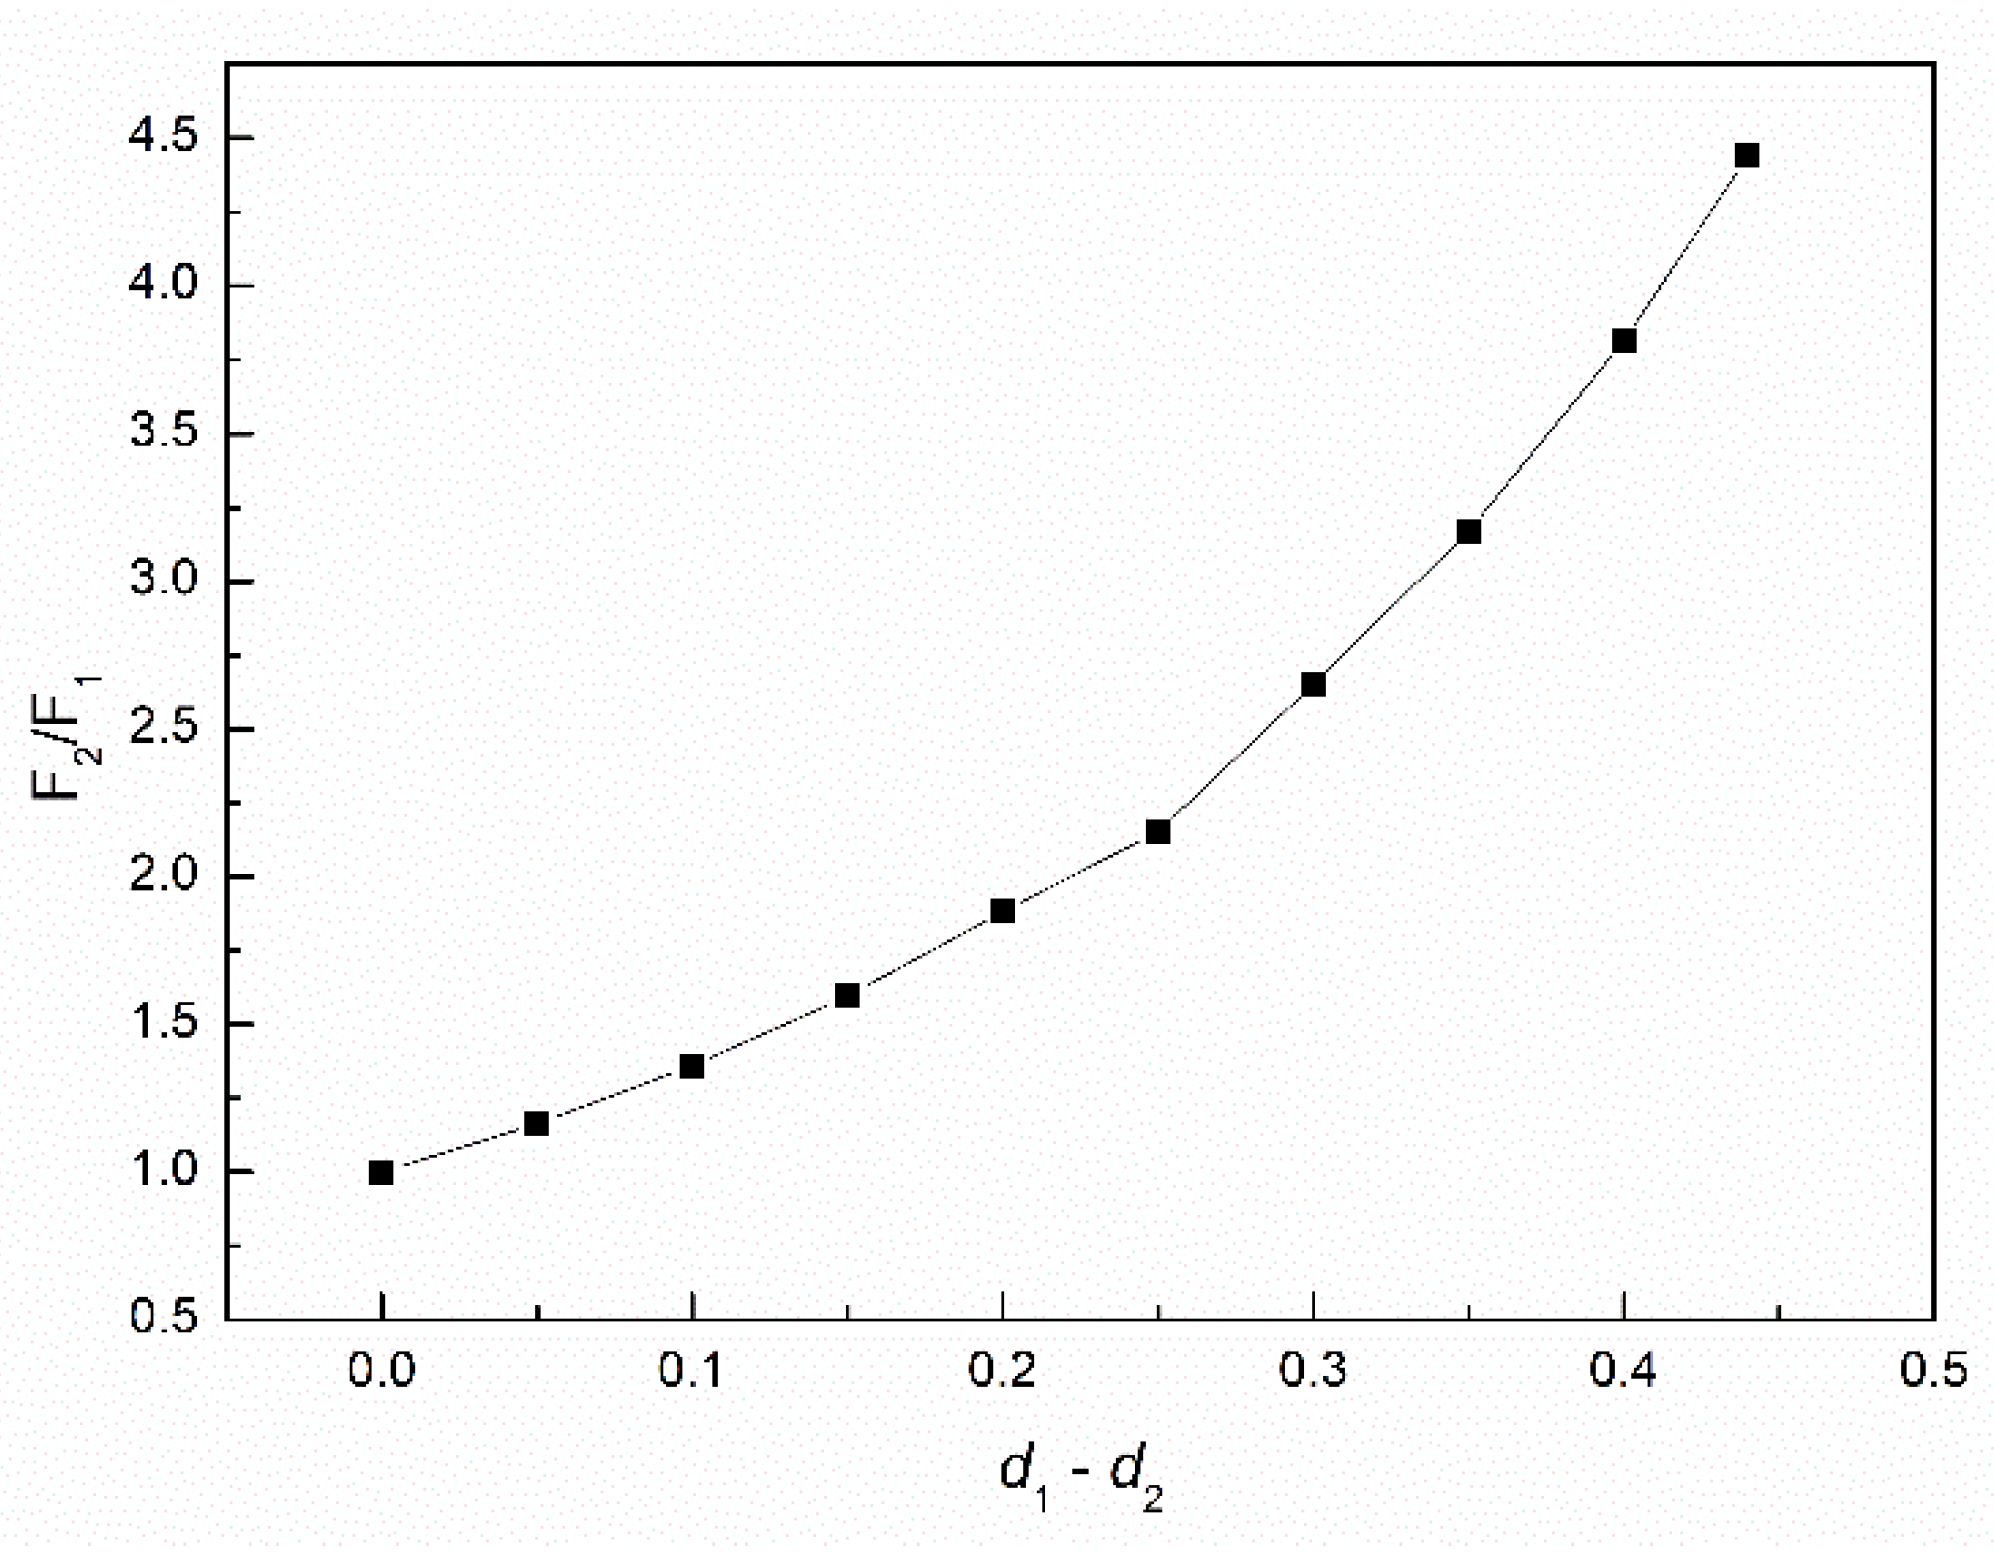
  • The addition of n-hexane and ethanol to canola oil decreases its surface tension, density and viscosity to the larger extent than it results from the difference of surface tension, density and viscosity of canola oil and n-hexane. This phenomenon indicates that probably the n-hexane molecules increase the distance between the molecules of canola oil components.
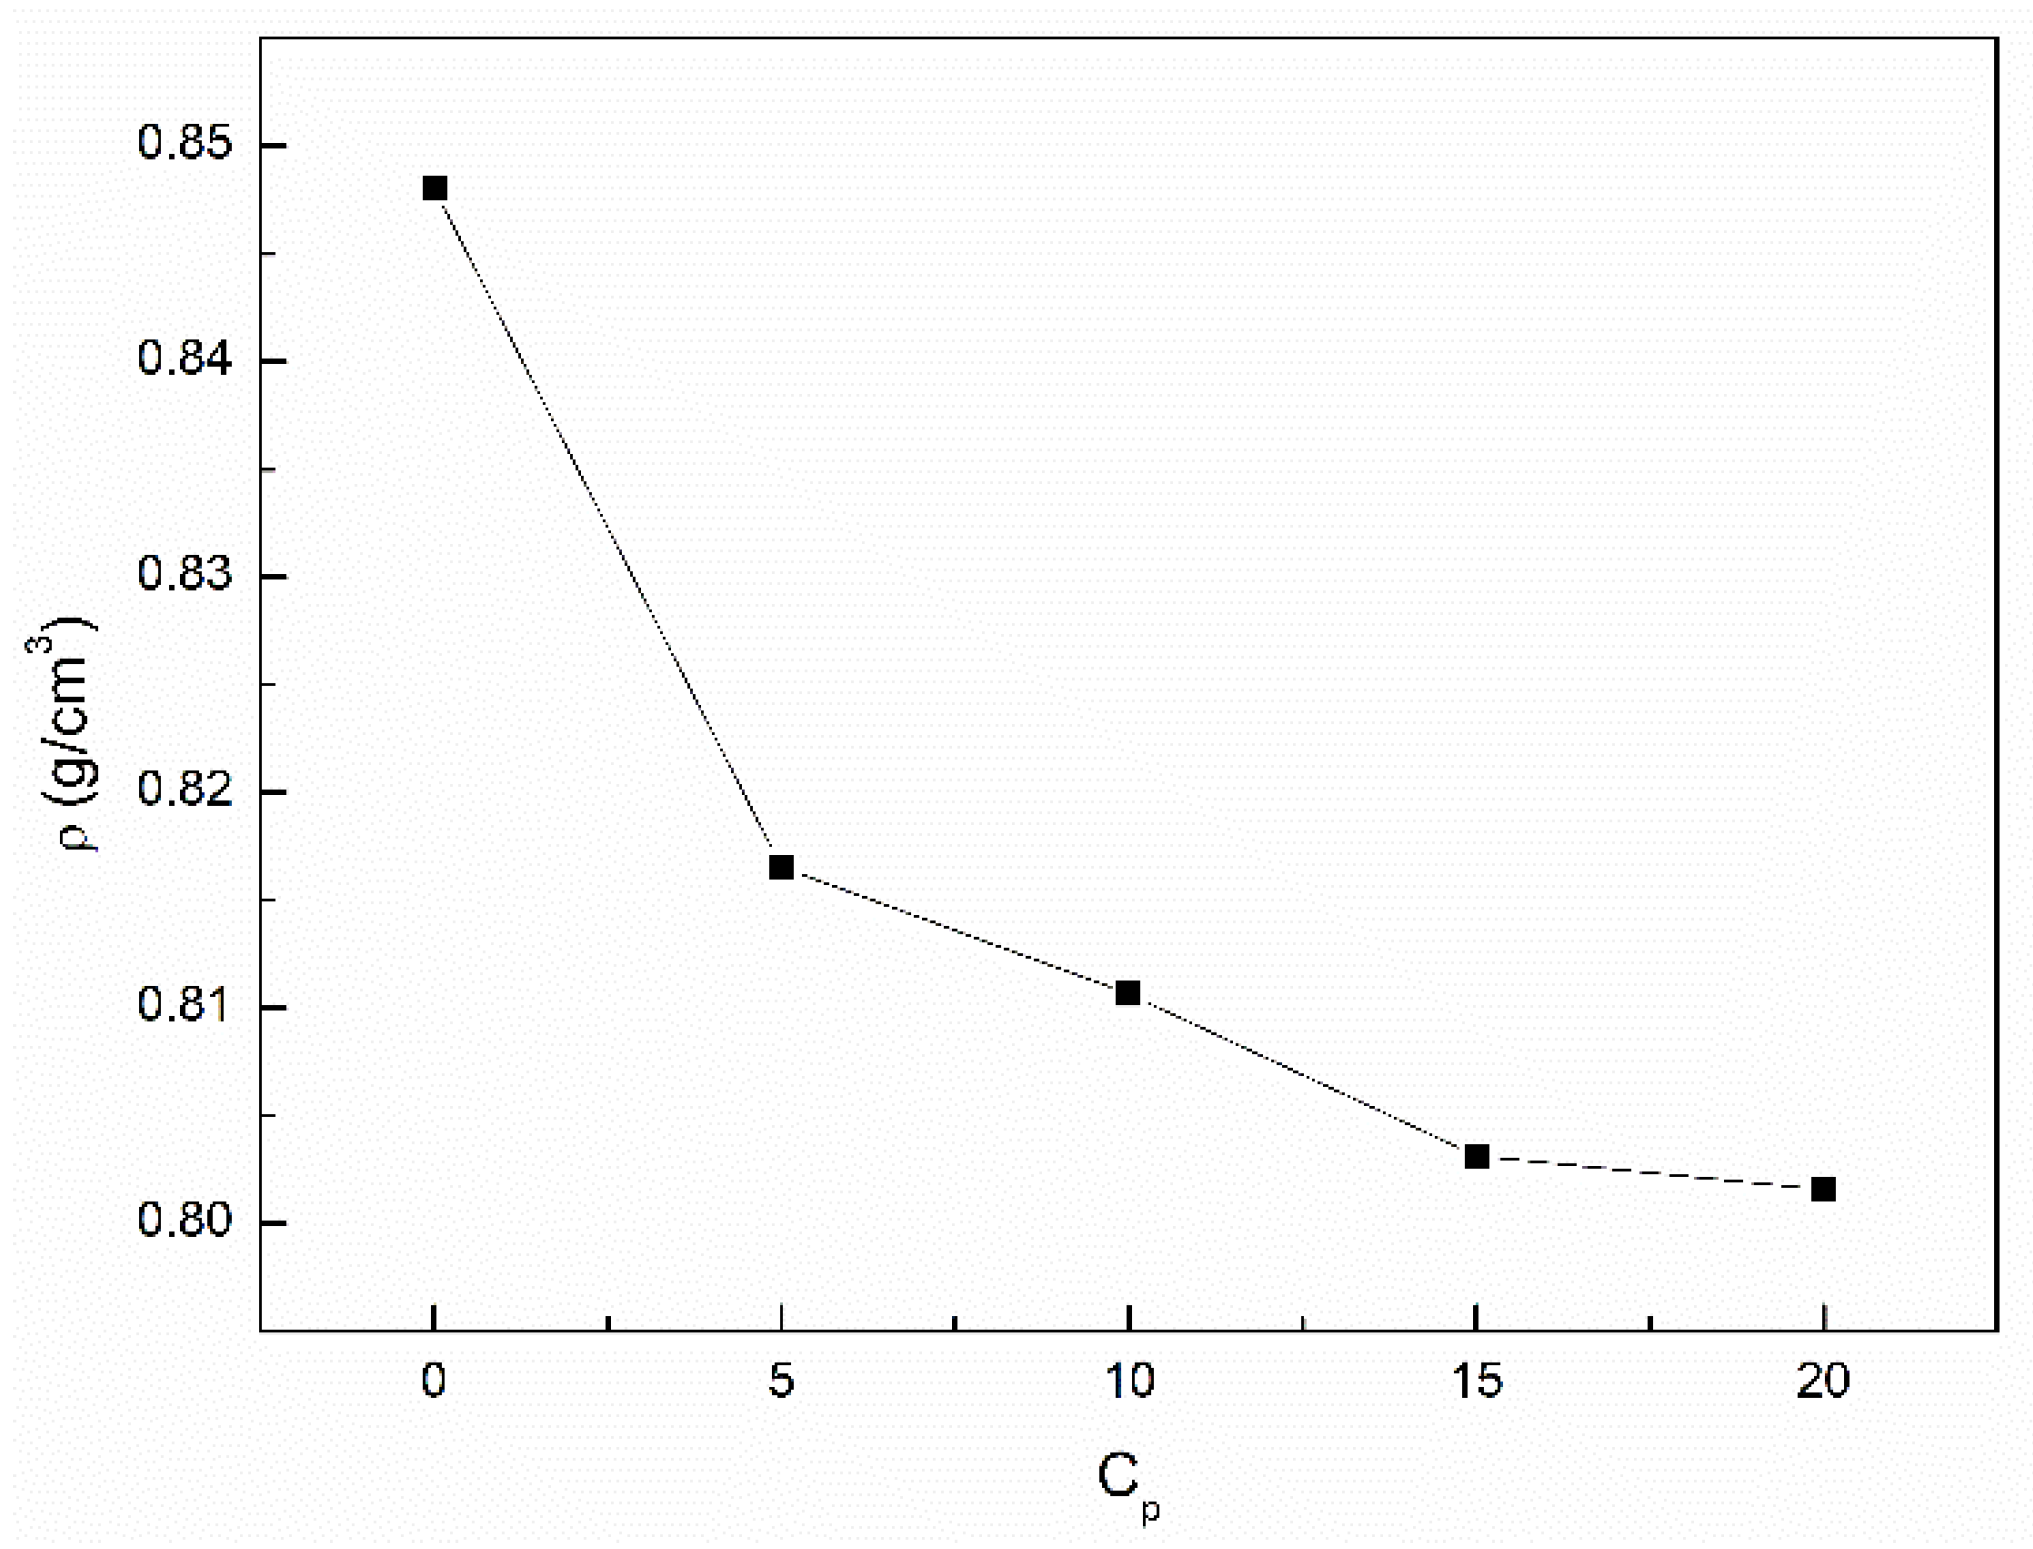
  • As a result of the ethanol contact with the canola oil mixture with n-hexane, there is a further decrease in the surface tension, density and viscosity of canola oil. This decrease is not proportional to the difference between the surface tension, density and viscosity of canola oil and ethanol. This effect results probably from the changes of the structure of the canola oil phase as well as the concentration of the components of canola oil solution at the solution-air interface in comparison to the bulk phase.
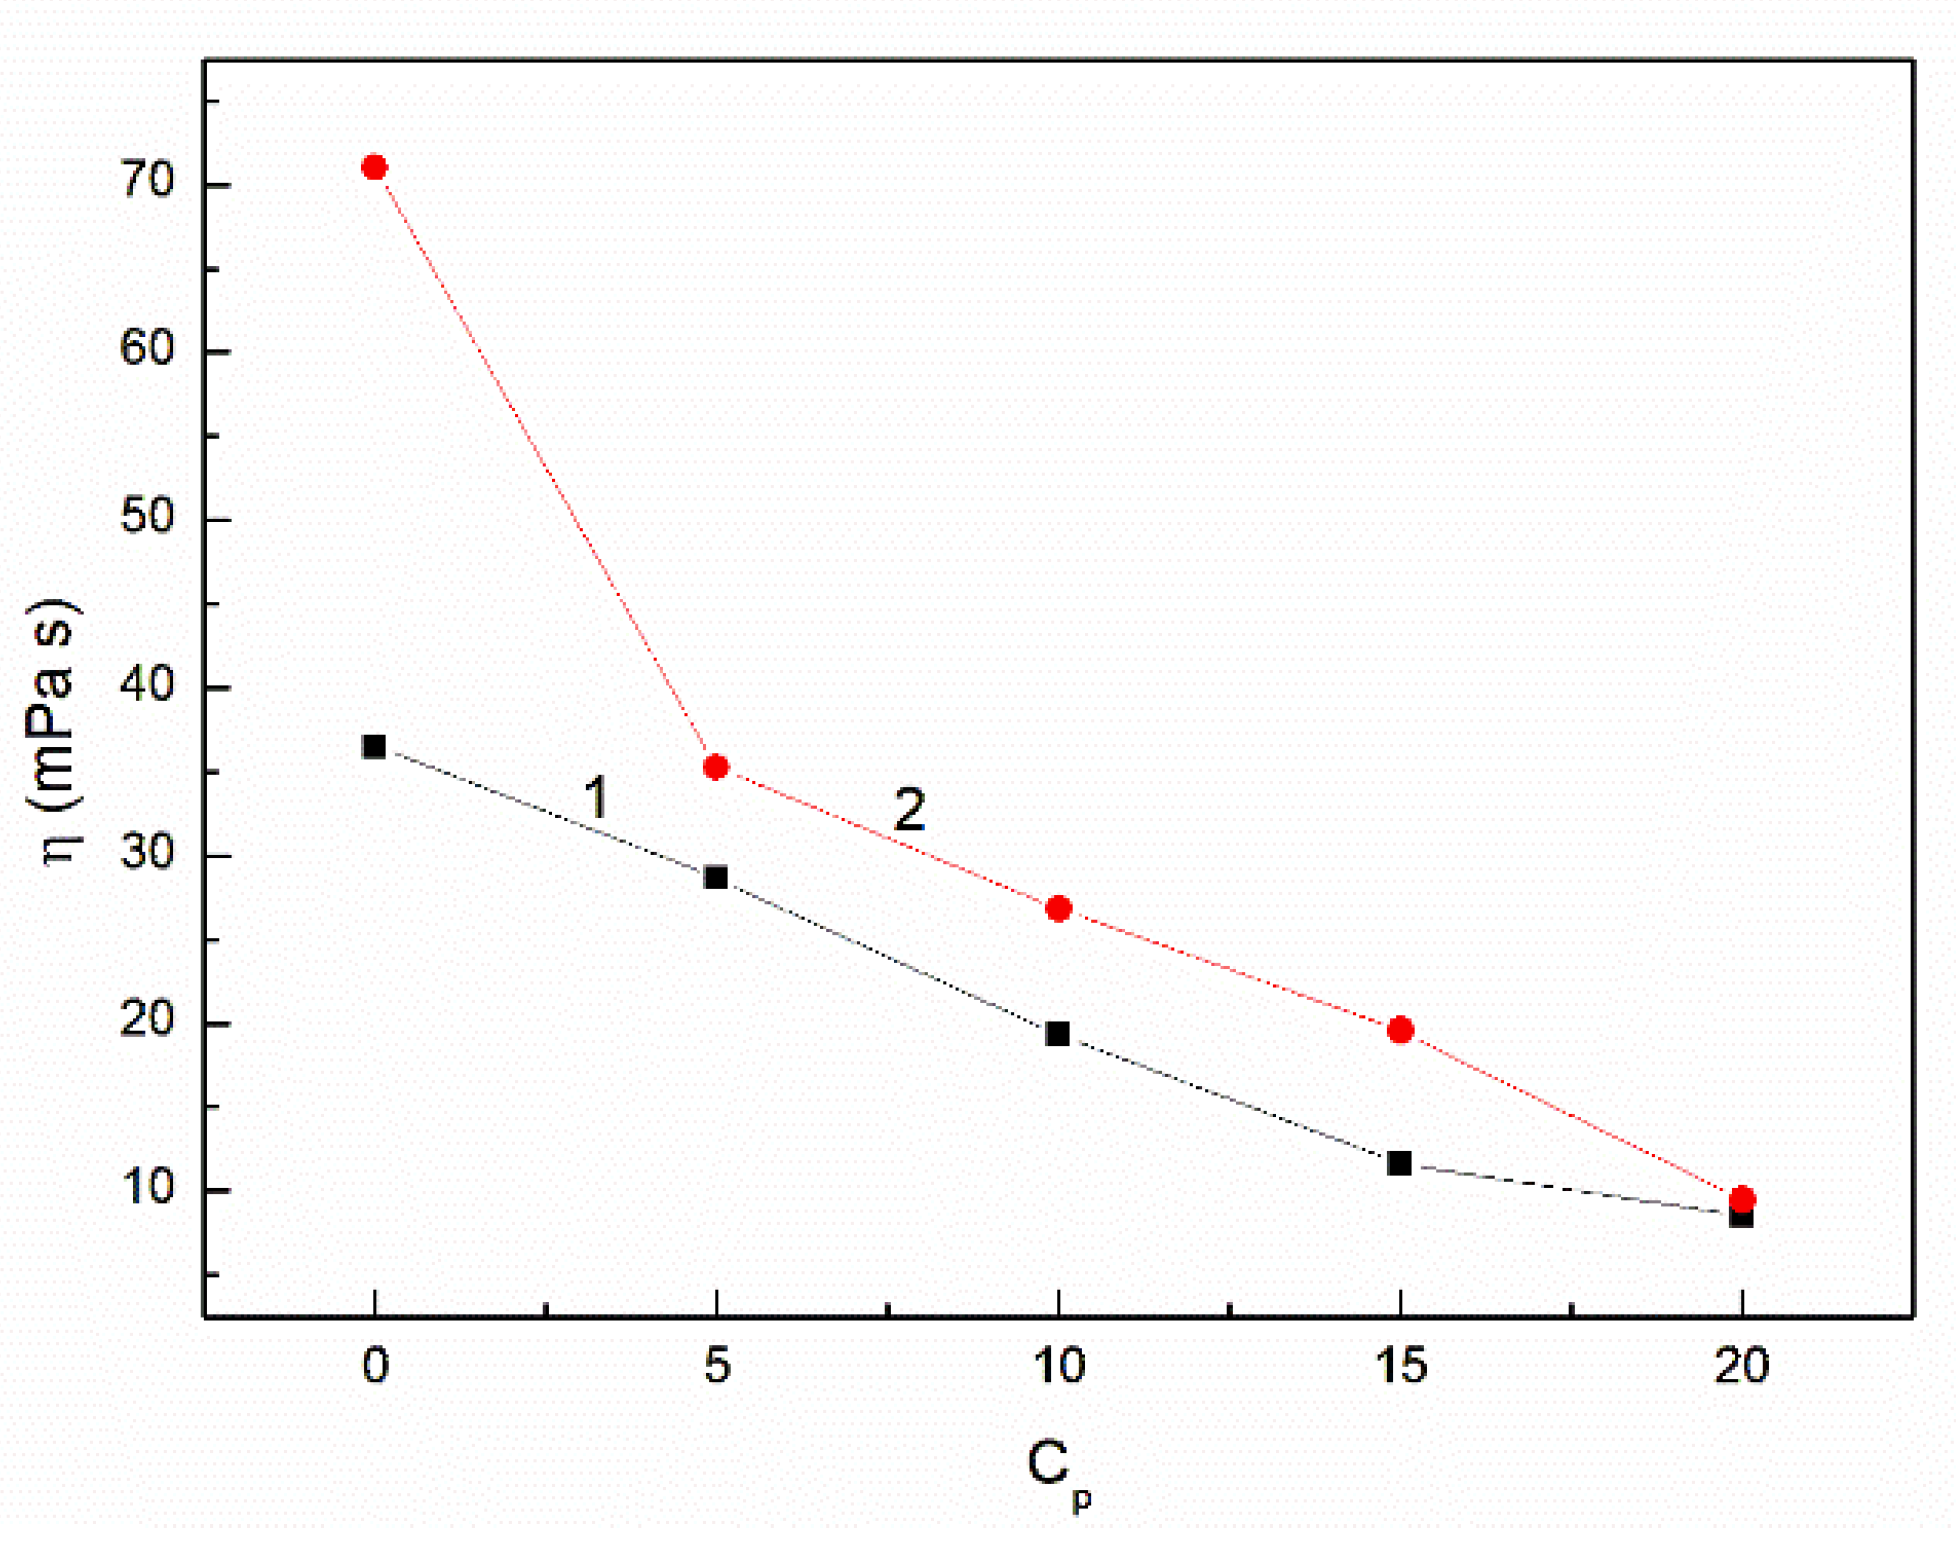
  • At the concentration of n-hexane close to 20% volume the viscosity of the canola oil-n-hexane-ethanol mixture is close to that of the diesel fuel.
  • The addition of n-hexane and ethanol to canola oil changes its wetting properties in relation to the hydrophobic and hydrophilic solids.
  • To sum up it can be stated that the addition of n-hexane and ethanol at a given amount improves the canola oil physical properties regarding its possible application as a fuel in the diesel engine.

Author Contributions

R.L., P.S., A.Z., K.S., B.J.—signed the experiments, analyzed the experimental data, made figures, and participated in the preparation of the manuscript, wrote the part of the manuscript. R.L., P.S., A.Z., K.S., B.J.—conceived the concept of the studies, wrote the main part of the manuscript, and supervised the studies and participated in the manuscript preparation, signed the experiments, analyzed the experimental data, made figures. All authors have read and agreed to the published version of the manuscript.

Funding

The project/research was financed in the framework of the project Lublin University of Technology-Regional Excellence Initiative, funded by the Polish Ministry of Science and Higher Education (contract No. 030/RID/2018/19).

Informed Consent Statement

Not applicable.

Data Availability Statement

Not applicable.

Conflicts of Interest

The authors declare no conflict of interest.

References

  1. Li, Q.; Backes, F.; Wachtmeister, G. Application of canola oil operation in a diesel engine with common rail system. Fuel 2015, 159, 141–149. [Google Scholar] [CrossRef]
  2. Ge, J.C.; Yoon, S.K.; Choi, N.J. Using canola oil biodiesel as an alternative fuel in diesel engines: A Review. Appl. Sci. 2017, 7, 881. [Google Scholar] [CrossRef] [Green Version]
  3. Mahmudul, H.M.; Hagos, F.Y.; Mamat, R.; Abdul Adam, A.; Ishak, W.F.W.; Alenezi, R. Production, characterization and performance of biodiesel as an alternative fuel in diesel engines—A review. Renew. Sustain. Energy Rev. 2017, 72, 497–509. [Google Scholar] [CrossRef]
  4. Datta, A.; Mandal, B.K. A comprehensive review of biodiesel as an alternative fuel for compression ignition engine. Renew. Sustain. Energy Rev. 2016, 57, 799–821. [Google Scholar] [CrossRef]
  5. Balat, M.; Balat, H. Progress in biodisel processing. Appl. Energy 2010, 87, 1815–1835. [Google Scholar] [CrossRef]
  6. Borugadda, V.B.; Somidi, A.K.R.; Dalai, A.K. Chemical/structural modification of canola oil and canola biodiesel: Kinetic studies and biodegradability of the alkoxides. Lubricants 2017, 5, 11. [Google Scholar] [CrossRef] [Green Version]
  7. Ge, J.C.; Yoon, S.K.; Kim, M.S.; Choi, N.J. Application of canola oil biodiesel/diesel blends in a common rail diesel engine. Appl. Sci. 2017, 7, 34. [Google Scholar] [CrossRef] [Green Version]
  8. Roy, M.M.; Wang, W.; Bujold, J. Biodiesel production and comparison of emissions of a DI diesel engine fueled by biodiesel–diesel and canola oil–diesel blends at high idling operations. Appl. Energy 2013, 106, 198–208. [Google Scholar] [CrossRef]
  9. Issariyakul, T.; Dalai, A. Biodiesel Production from Greenseed Canola Oil. Energy Fuels 2010, 24, 4652–4658. [Google Scholar] [CrossRef]
  10. Qi, D.H.; Bae, C.; Feng, Y.M.; Ji, C.C.; Bian, Y.Z. Preparation, characterization, engine combustion and emission characteristics of rapeseed oil based hybrid fuels. Renew. Energy 2013, 60, 98–106. [Google Scholar] [CrossRef]
  11. Knothe, G.; Steidley, K.R. Kinematic viscosity of biodiesel fuel components and related compounds. Influence of compound structure and comparison to petrodiesel fuel components. Fuel 2005, 84, 1059–1065. [Google Scholar] [CrossRef]
  12. Tate, R.E.; Watts, K.C.; Allen, C.A.W.; Wilkie, K.I. The viscosities of three biodiesel fuels at temperatures up to 300 °C. Fuel 2006, 85, 1010–1015. [Google Scholar] [CrossRef]
  13. Longwic, R.; Sander, P. The course of combustion process under real conditions of work of a traction diesel engine supplied by mixtures of canola oil containing n-hexane. IOP Conf. Ser. Mater. Sci. Eng. 2018, 421, 042050. [Google Scholar] [CrossRef] [Green Version]
  14. Górski, K.; Sander, P.; Longwic, R. The assessment of ecological parameters of diesel engine supplied with mixtures of canola oil with n-hexane. IOP Conf. Ser. Mater. Sci. Eng. 2018, 421, 042025. [Google Scholar] [CrossRef]
  15. Longwic, R.; Sander, P.; Jańczuk, B.; Zdziennicka, A.; Szymczyk, K. Modification of canola oil physicochemical properties by hexane and ethanol with regards of its application in diesel engine. Energies 2021, 14, 4469. [Google Scholar] [CrossRef]
  16. Nadeem, M.; Rangkuti, C.; Anuar, K.; Haq, M.R.U.; Tan, I.B.; Shah, S.S. Diesel engine performance and emission evaluation using emulsified fuels stabilized by conventional and gemini surfactants. Fuel 2006, 85, 2111–2119. [Google Scholar] [CrossRef]
  17. Rezkia, B.; Essamlalib, Y.; Aadila, M.; Semlalc, N.; Zahouily, M. Biodiesel production from rapeseed oil and low free fatty acid waste cooking oil using a cesium modified natural phosphate catalyst. RSC Adv. 2020, 10, 41065–41077. [Google Scholar] [CrossRef]
  18. Singh, T.S.; Verma, T.N. Biodiesel production from Momordica charantia (L.): Extraction and engine characteristics. Energy 2019, 189, 116198. [Google Scholar] [CrossRef]
  19. Singh, T.S.; Verma, T.N. Taguchi design approach for extraction of methyl ester from waste cooking oil using synthesized CaO as heterogeneous catalyst: Response surface methodology optimization. Energy Convers. Manag. 2019, 182, 383–397. [Google Scholar] [CrossRef]
  20. Lin, C.Y.; Lin, S.-A. Effects of emulsification variables on fuel properties of two- and three-phase biodiesel emulsions. Fuel 2007, 86, 210–217. [Google Scholar] [CrossRef]
  21. Ghazani, S.M.; García-Llatas, G.; Marangoni, A.G. Micronutrient content of cold-pressed, hot-pressed, solvent extracted and RBD canola oil: Implications for nutrition and quality. Eur. J. Lipid Sci. Technol. 2014, 116, 380–387. [Google Scholar] [CrossRef]
  22. Matthaus, B.; Özcan, M.M.; Juhaimi, F.A. Some rape/canola seed oils: Fatty acid composition and tocopherols. Z. Nat. C J. Biosci. 2016, 71, 73–77. [Google Scholar] [CrossRef] [PubMed]
  23. Eskin, N.A.M.; Przybylski, R. Rape Seed Oil/Canola in Encyclopaedia of Food Sciences and Nutrition, 2nd ed.; Elsevier Science Ltd.: Amsterdam, The Netherlands, 2003. [Google Scholar]
  24. Rustan, A.C.; Drevon, C.A. Fatty Acids: Structures and Properties. In Encyclopedia of Life Sciences; John Wiley & Sons, Ltd.: Chichester, UK, 2005. [Google Scholar]
  25. Jańczuk, B.; Zdziennicka, A.; Wójcik, W. Relationship between wetting of Teflon by cetyltrimethylammonium bromide solution and adsorption. Eur. Polym. J. 1997, 33, 1093–1098. [Google Scholar] [CrossRef]
  26. Fowkes, F.M. Attractive forces at interfaces. Ind. Eng. Chem. 1964, 56, 40–52. [Google Scholar] [CrossRef]
  27. van Oss, C.J. Interfacial Forces in Aqueous Media, 1st ed.; Marcel Dekker: New York, NY, USA, 1994. [Google Scholar]
  28. van Oss, C.J.; Costanzo, P.M. Adhesion of anionic surfactants to polymer surfaces and low-energy materials. J. Adhes. Sci. Technol. 1992, 6, 477–487. [Google Scholar] [CrossRef]
  29. Vogel, A.I. Preparatyka Organiczna, 3rd ed.; WNT: Warszawa, Poland, 2006. [Google Scholar]
  30. Valeri, D.; Meirelles, A.J.A. Viscosities of fatty acids, triglycerides, and their binary mixtures. J. Am. Oil Chem. Soc. 1997, 74, 1221–1226. [Google Scholar] [CrossRef]
  31. Zdziennicka, A.; Krawczyk, J.; Szymczyk, K.; Jańczuk, B. Components and parameters of liquids and some polymers surface tension at different temperature. Colloids Surf. A Physicochem. Eng. Asp. 2017, 529, 864–875. [Google Scholar] [CrossRef]
  32. Zisman, W.A. Relation of the equilibrium contact angle to liquid and solid constitution. In Contact angle wettability and adhesion; Advances in Chemistry Series; Am Chem: Washington, DC, USA, 1964; Volume 43, pp. 1–51. [Google Scholar]
  33. Aguilera, A.F.; Rahkila, J.; Hemming, J.; Nurmi, M.; Torres, G.; Razat, T.; Tolvanen, P.; Eranen, K.; Leveneur, S.; Salmi, T. Epoxidation of tall oil catalyzed by an ion exchange resin under conventional heating and microwave irradiation. Ind. Eng. Chem. Res. 2020, 59, 10397–10406. [Google Scholar] [CrossRef]
  34. Jańczuk, B.; Mendez Sierra, J.A.; Gonzalez-Martın, M.L.; Bruque, J.M.; Wócjik, W. Properties of decylammonium chloride and cesium perfluorooctanoate at interfaces and standard free energy of their adsorption. J. Colloid Interface Sci. 1997, 192, 408–414. [Google Scholar] [CrossRef]
  35. Atkins, P.; de Paula, J.; Keeler, J. Atkins’ Physical Chemistry; Oxford University Press: Oxford, UK, 2017. [Google Scholar]
  36. Good, R.J.; Elbing, E. Generalization of theory for estimation of interfacial energies. Ind. Eng. Chem. 1970, 62, 54–78. [Google Scholar] [CrossRef]
  37. Sahasrabudhe, S.N.; Rodriguez-Martinez, V.; O’Meara, M.; Farkas, B.E. Density, viscosity, and surface tension of five vegetable oils at elevated temperatures: Measurements and modeling. Int. J. Food Prop. 2017, 20, 1965–1981. [Google Scholar] [CrossRef] [Green Version]
  38. Fasina, O.O.; Colley, Z. Viscosity and specific heat of vegetable oils as a function of temperature: 35° to 185°. Int. J. Food Prop. 2008, 11, 738–746. [Google Scholar] [CrossRef]
  39. Anand, K.; Ranjan, A.; Mehta, P.S. Estimating the viscosity of vegetable oil and biodiesel fuels. Energy Fuels 2010, 24, 664–672. [Google Scholar] [CrossRef]
  40. Diamante, L.M.; Lan, T. Absolute viscosities of vegetable oils at different temperatures and shear rate range of 64.5 to 4835 s−1. J. Food Process. 2014, 234583. [Google Scholar] [CrossRef] [Green Version]
  41. Peterson, C.L. Vegetable oil as a diesel fuel: Status and research priorities. Am. Soc. Agric. Eng. 1986, 25, 1413–1422. [Google Scholar] [CrossRef]
  42. Yalcin, H.; Toker, S.O.; Dogan, M. Vegetable oil type and fatty acid composition on dynamic and steady shear rheology of vegetable oils. J. Oleo Sci. 2012, 61, 181–187. [Google Scholar] [CrossRef] [Green Version]
  43. Klein, T.; Yan, S.; Cui, J.; Magee, J.W.; Kroenlein, K.; Rausch, M.H.; Koller, T.M.; Fröba, A.P. Liquid viscosity and surface tension of n-hexane, n-octane, n-decane, and n-hexadecane up to 573 K by surface light scattering. J. Chem. Eng. Data 2019, 64, 4116–4131. [Google Scholar] [CrossRef]
  44. Vázquez, G.; Alvarez, E.; Navaza, J.M. Surface tension of alcohol + water from 20 to 50 °C. J. Chem. Eng. Data 1995, 40, 611–614. [Google Scholar] [CrossRef]
  45. Zdziennicka, A.; Szymczyk, K.; Jańczuk, B.; Longwic, R.; Sander, P. Adhesion of canola and diesel oils to some parts of diesel engine in the light of surface tension components and parameters of these substrates. Inter. J. Adhes. Adhes. 2015, 60, 23–30. [Google Scholar] [CrossRef]
  46. Zana, R. Aqueous surfactant–alcohol systems: A review. Adv. Colloid Interface Sci. 1995, 57, 1–64. [Google Scholar] [CrossRef]
  47. Yano, Y.F. Correlation between surface and bulk structures of alcohol–water mixtures. J. Colloid Interface Sci. 2005, 284, 255–259. [Google Scholar] [CrossRef]
  48. van Oss, C.J.; Chaudhury, M.K.; Good, R.J. Monopolar surfaces. Adv. Colloid Interface Sci. 1987, 28, 35–64. [Google Scholar] [CrossRef] [PubMed]
  49. Owens, D.K.; Wendt, R.C. Estimation of the surface free energy of polymers. J. Appl. Polym. Sci. 1969, 13, 1741–1747. [Google Scholar] [CrossRef]
  50. Rosen, M.J. Surfactants and Interfacial Phenomena, 3rd ed.; Wiley-Interscience: New York, NY, USA, 2004; pp. 34–178. [Google Scholar]
  51. Zdziennicka, A.; Jańczuk, B. Modification of adsorption, aggregation and wetting properties of surfactants by short chain alcohols. Adv. Colloid Interface Sci. 2020, 284, 102249. [Google Scholar] [CrossRef] [PubMed]
  52. Harkins, W.D. Films on liquids. In The Physical Chemistry of Surface Films; Reinhold: New York, NY, USA, 1952; pp. 94–198. [Google Scholar]
Figure 1. The plot of the n-hexane density ( ρ ) vs. the distance between its molecules ( d ) in the range from 2 to 1.56 Å.
Applsci 13 01108 g001
Figure 2. The plot of the ratio of the forces between the n-hexane molecules and the distance in the range from 2 to 1.56 Å to forces at the distance equal to 2 Å vs. the difference between d 1 and d 2 .
Applsci 13 01108 g002
Figure 3. The plot of the viscosity ( η ) of the canola oil + n-hexane + ethanol mixture (curve 1) and canola oil + n-hexane mixture (curve 2) vs. the n-hexane concentration ( C p ). (The first point corresponding to the 0% n-hexane concentration on curve 1 this is the viscosity of canola oil + ethanol mixture; the first point corresponding to 0% n-hexane concentration on curve 2 this is the viscosity of canola oil).
Applsci 13 01108 g003
Figure 4. The plot of the viscosity ( η ) of the ethanol phase contacted with the canola oil + n-hexane mixture vs. the n-hexane concentration ( C p ).
Applsci 13 01108 g004
Figure 5. The plot of the density ( ρ ) of the canola oil + n-hexane + ethanol mixture vs. the n-hexane concentration ( C p ).
Applsci 13 01108 g005
Figure 6. The plot of the density ( ρ ) of the of ethanol phase contacted with canola oil + n-hexane vs. the n-hexane concentration ( C p ).
Applsci 13 01108 g006
Figure 7. The plot of the surface tension ( γ L V ) of the canola oil + n-hexane + ethanol mixture (curve 1) and canola oil + n-hexane mixture (curve 2) vs. the n-hexane concentration ( C p ).
Applsci 13 01108 g007
Figure 8. The plot of the surface tension ( γ L V ) of ethanol phase contacted with canola oil + n-hexane vs. the n-hexane concentration ( C p ).
Applsci 13 01108 g008
Figure 9. The plot of the measured interface tension ( γ L L ) between canola oil + n-hexane and ethanol phases (curve 1) as well as determined from Equation (5) (curve 2) and Equation (4) (curve 3) vs. the n-hexane concentration ( C p ).
Applsci 13 01108 g009
Figure 10. The plot of the contact angle ( θ ) for the canola oil + n-hexane + ethanol mixture on PTFE vs. the n-hexane concentration ( C p ).
Applsci 13 01108 g010
Figure 11. The plot of the contact angle ( θ ) of the ethanol phase contacted with canola oil + n-hexane mixture vs. the n-hexane concentration ( C p ).
Applsci 13 01108 g011
Figure 12. The plot of the contact angle ( θ ) for the canola oil + n-hexane + ethanol mixture on the engine valve vs. the n-hexane concentration ( C p ).
Applsci 13 01108 g012
Figure 13. The plot of the apolar (LW) (curves 1 and 2) and polar (AB) (curves 3 and 4) components of the surface tension of the canola oil + n-hexane phase (curves 1 and 3) and ethanol phase (curves 2 and 4) vs. the n-hexane concentration ( C p ).
Applsci 13 01108 g013
Figure 14. The plot of the π values calculated from Equation (13) (curve 1) and difference between the surface tension of engine valve and that of solution (curve 2) vs. the n-hexane concentration ( C p ).
Applsci 13 01108 g014
Table 1. The composition of the canola oil in percent (%) and the values of the surface tension ( γ L V ), density ( ρ ) and viscosity ( η ) of canola oil components as well as ethanol and n-hexane.
Substance% γ L V
[mN/m]
γ L V L W
[mN/m]
γ L V A B
[mN/m]
ρ
[g/cm3]
η
[mPa·s]
Oleic acid6232.0026.565.440.89526.91
Linoleic acid2026.0922.153.940.901227.20
Alpha-linolenic acid1230.1525.654.500.913427.65
Palmitic acid329.2526.252.000.90527.60 at 70 °C
Stearic acid229.0126.512.500.8429.81 at 70 °C
Trans fat a0.527.5125.002.510.85219.12 at 75 °C
Erucic acid<0.128.1226.122.000.85718.75 at 70 °C
n-heksane 18.5218.520.000.66010.3102
Ethanol 23.2521.451.800.78921.22
Canola oil 33.9832.511.470.916170.45
a—as the representative of the trans fat the glyceryl tristearate was used.
Disclaimer/Publisher’s Note: The statements, opinions and data contained in all publications are solely those of the individual author(s) and contributor(s) and not of MDPI and/or the editor(s). MDPI and/or the editor(s) disclaim responsibility for any injury to people or property resulting from any ideas, methods, instructions or products referred to in the content.

