

Research on Safe Following Distance on an Expressway Based on Braking Process Analysis


Abstract
:1. Introduction
2. Related Work
3. Modeling
3.1. Analysis and Assessment of Braking Distance
3.1.1. Running Status of Automobiles
3.1.2. Analysis of the Automobile Braking Process
- (1)
- The driver’s reaction time t1: the time required for the driver to move the right foot to the brake pedal after the driver detects a dangerous situation and begins to react.
- (2)
- The brake coordination time t2: the time required from starting to step down on the brake pedal to eliminate the brake pedal clearance, clearance of various hinges and bearings and drum brake clearance.
- (3)
- The braking force growth time t3. At this stage, the braking force gradually increases from zero to the maximum; that is, the braking deceleration increases from zero to the maximum, and the car moves through variable deceleration.
- (4)
- The continuous braking time t4. At this stage, the braking force is basically maintained at a stable value; that is, the brake deceleration remains unchanged, and the car goes through uniform deceleration until stopping.
- (5)
- The braking relaxation time t5, that is, the time that is required after stopping until the automatic elimination of braking force.
3.1.3. Problem Simplification
- (1)
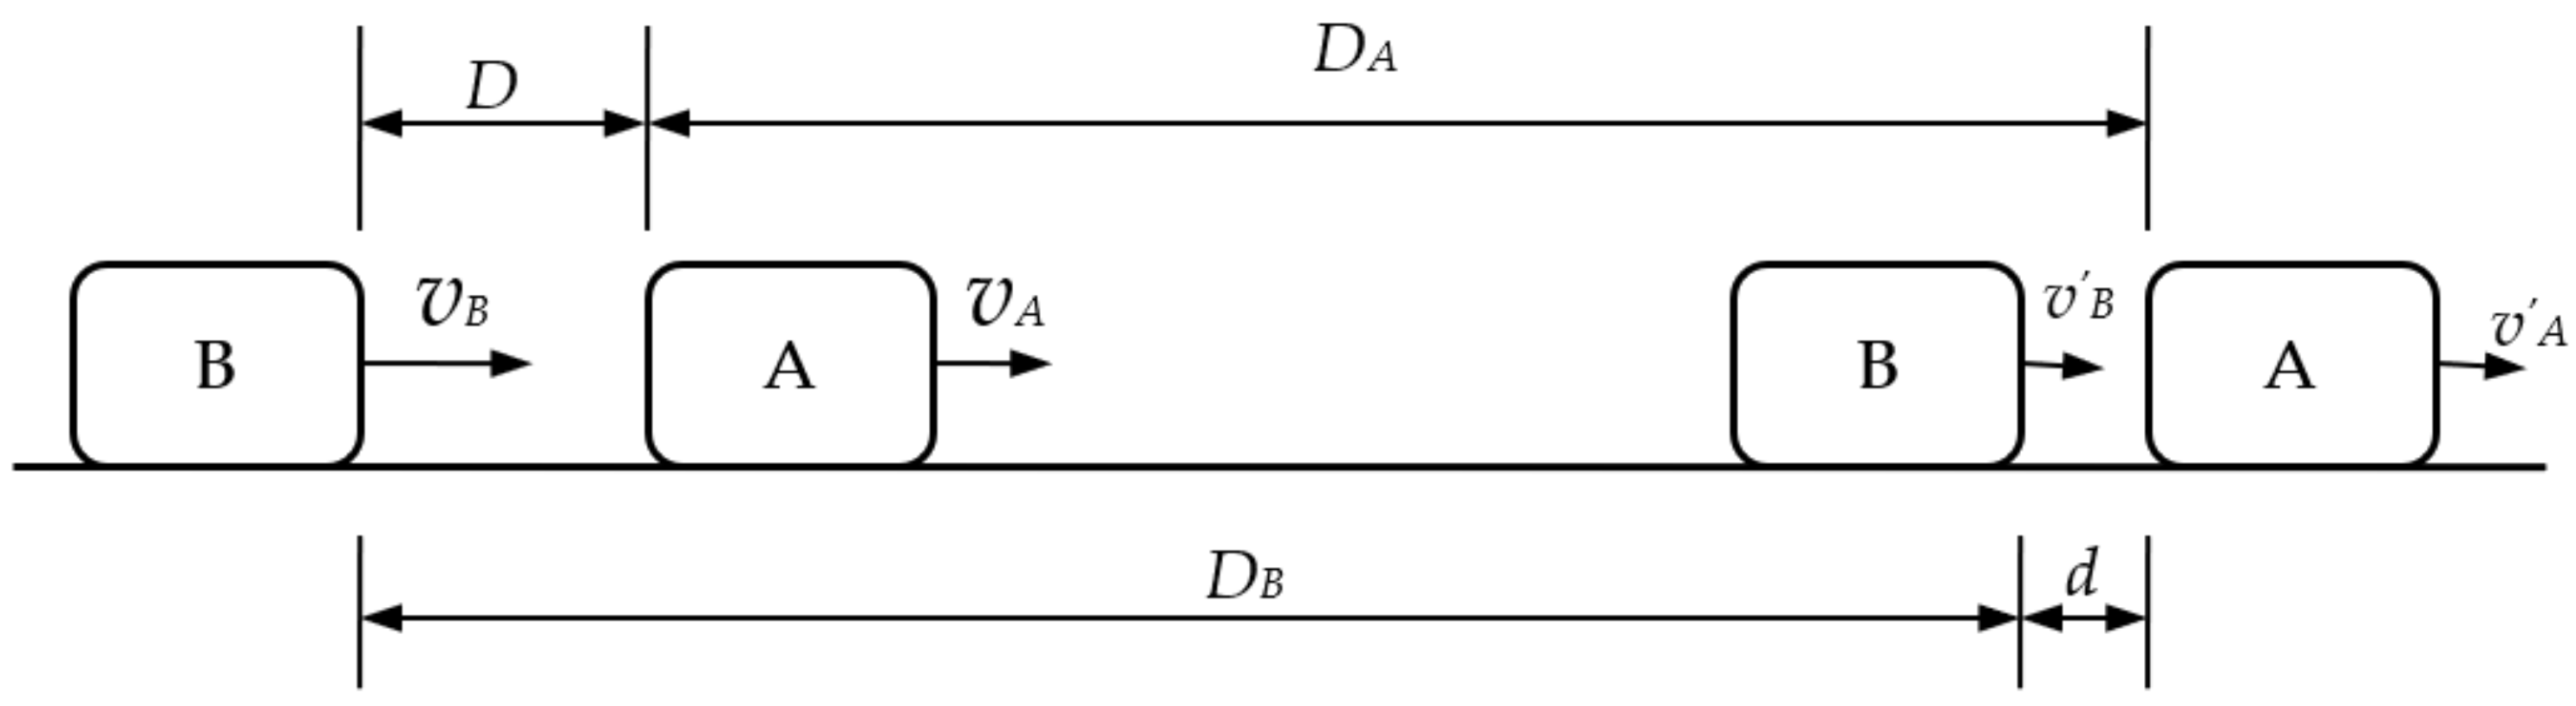
- The car movement in a short time on the expressway is simplified to a uniform movement. Assume that at a certain moment on the expressway, the front car (A) is moving at the speed of VA and the following car (B) is moving at the speed of VB. In this case, the distance between car A and car B is “D”. This is shown in Figure 1.
- (2)
- With the passage of time, the distance between the front car (A) and the following car (B) has two possible changing trends. One is that the distance between the two cars is getting larger and larger, which obviously eliminates the problem of safe following distance between the two cars, so this situation is not the process to be discussed. We are concerned about the other situation, where the distance between the two cars gets smaller and smaller, and if no action is taken, there will be a rear-end collision. Among the possible situations, the most dangerous is that either the front car brakes and the following car accelerates, or the front car brakes and the following car still moves at its original speed. However, those two scenarios are not what the article is talking about here, as, in them, the following car is likely trying to overtake the front car, the two cars are not in the same lane, or the crash is intentional. Obviously, the situation in question is that on the expressway, the front car and the following car are moving in the same direction in the same lane, and the following car does not intend to pass the car in front, but just follows the front car. At a certain moment, car A suddenly brakes. The driver of car B will discover that the distance between the two cars is decreasing, so the following car immediately brakes to avoid a collision between the two cars (assuming that there is no possibility or possible behavior of steering to avoid the crash). In this case, when the following car adopts braking, the front car and the following car will not collide. We define the minimum distance that the two cars must keep at the moment before the front car brakes as the critical safe distance.
- (3)
- We assume that the driving conditions of the two cars are the same and the drivers are in the same condition. That is, it is assumed that the braking parameters of the two cars are the same and the drivers’ abilities to respond are the same.
3.1.4. Braking Distance
- (1)
- Analysis of braking deceleration process of the following car
- (2)
- Braking distance analysis of the front car
3.2. Establishment of a Mathematical Model of Minimum Safe Distance
3.2.1. Analysis of Safe Distance
3.2.2. Discussion of Safe Distance
- (1)
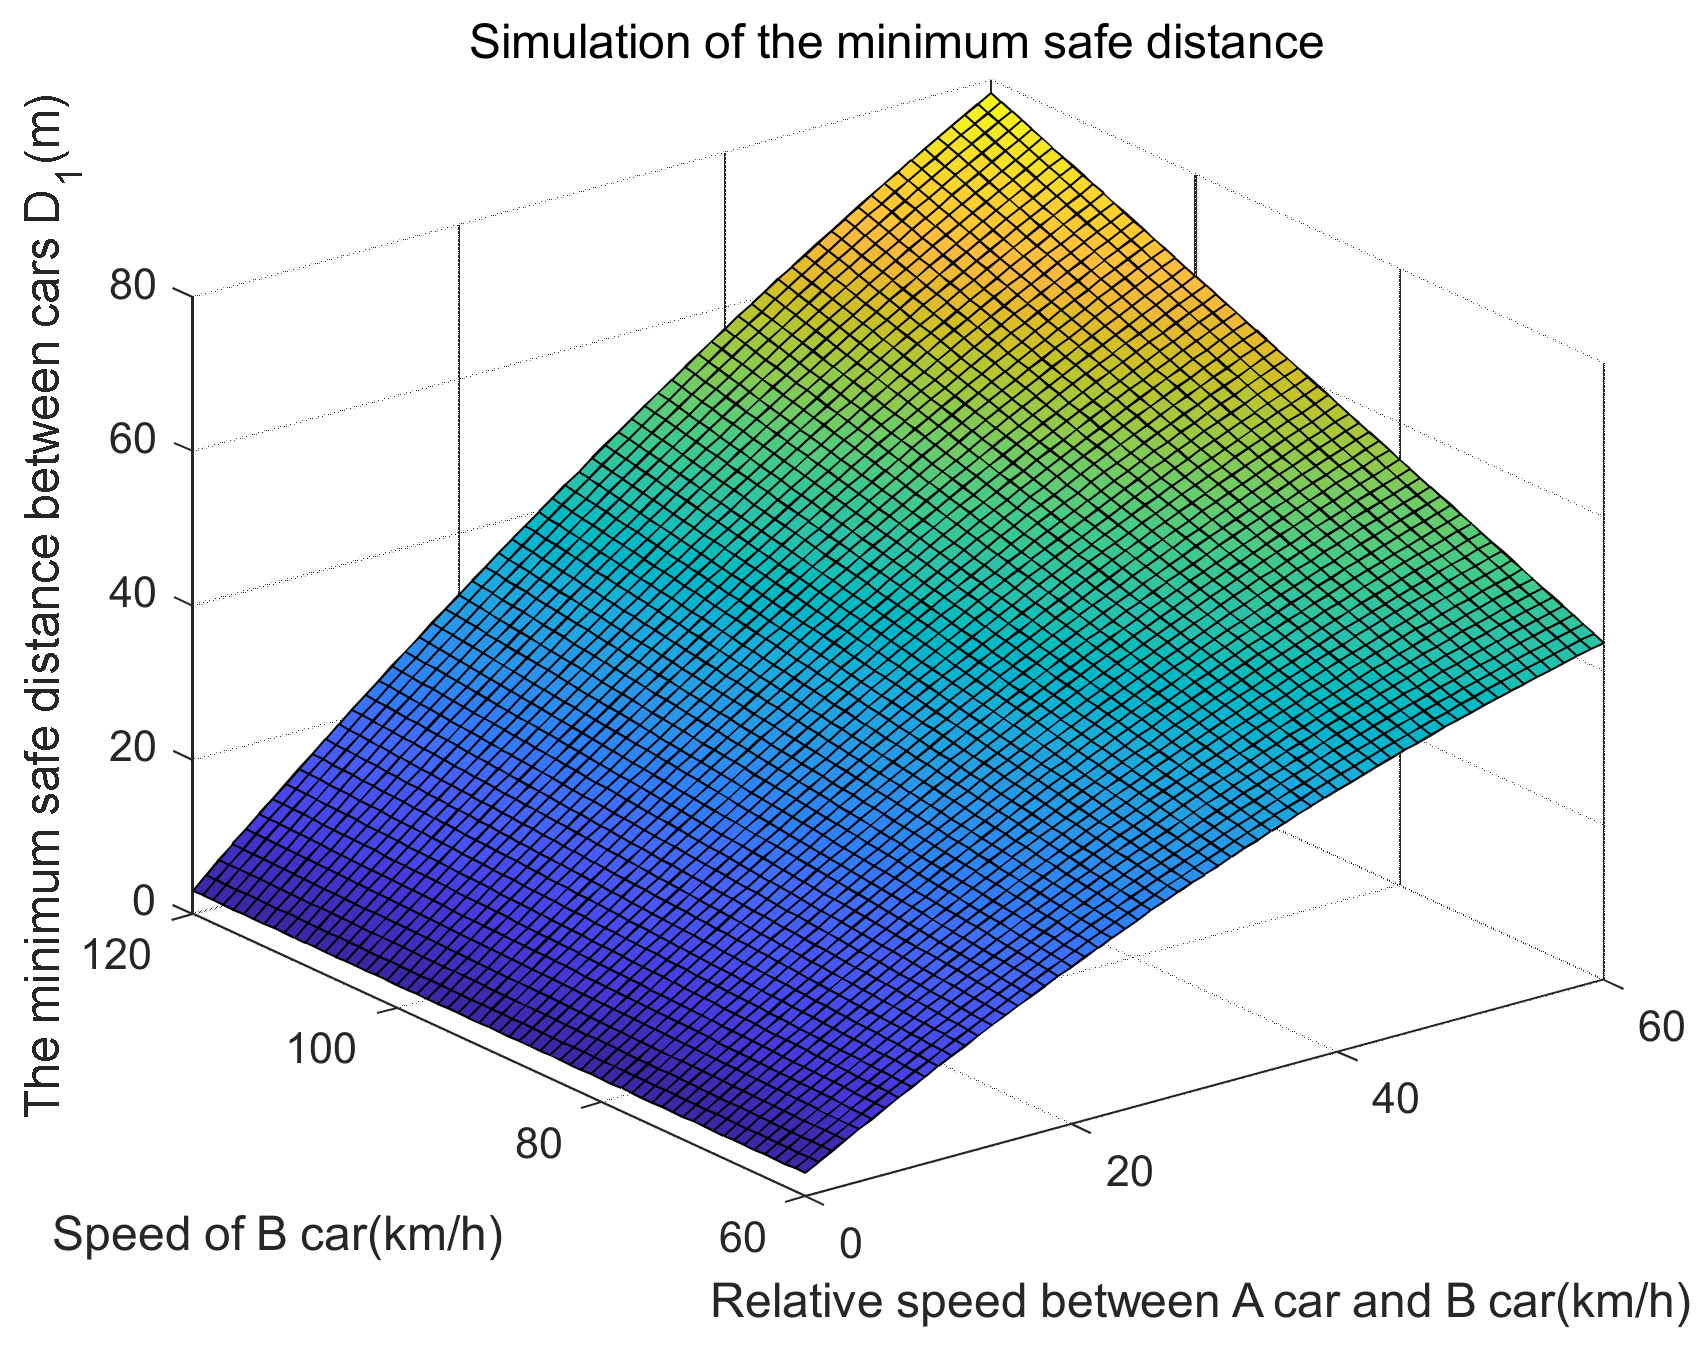
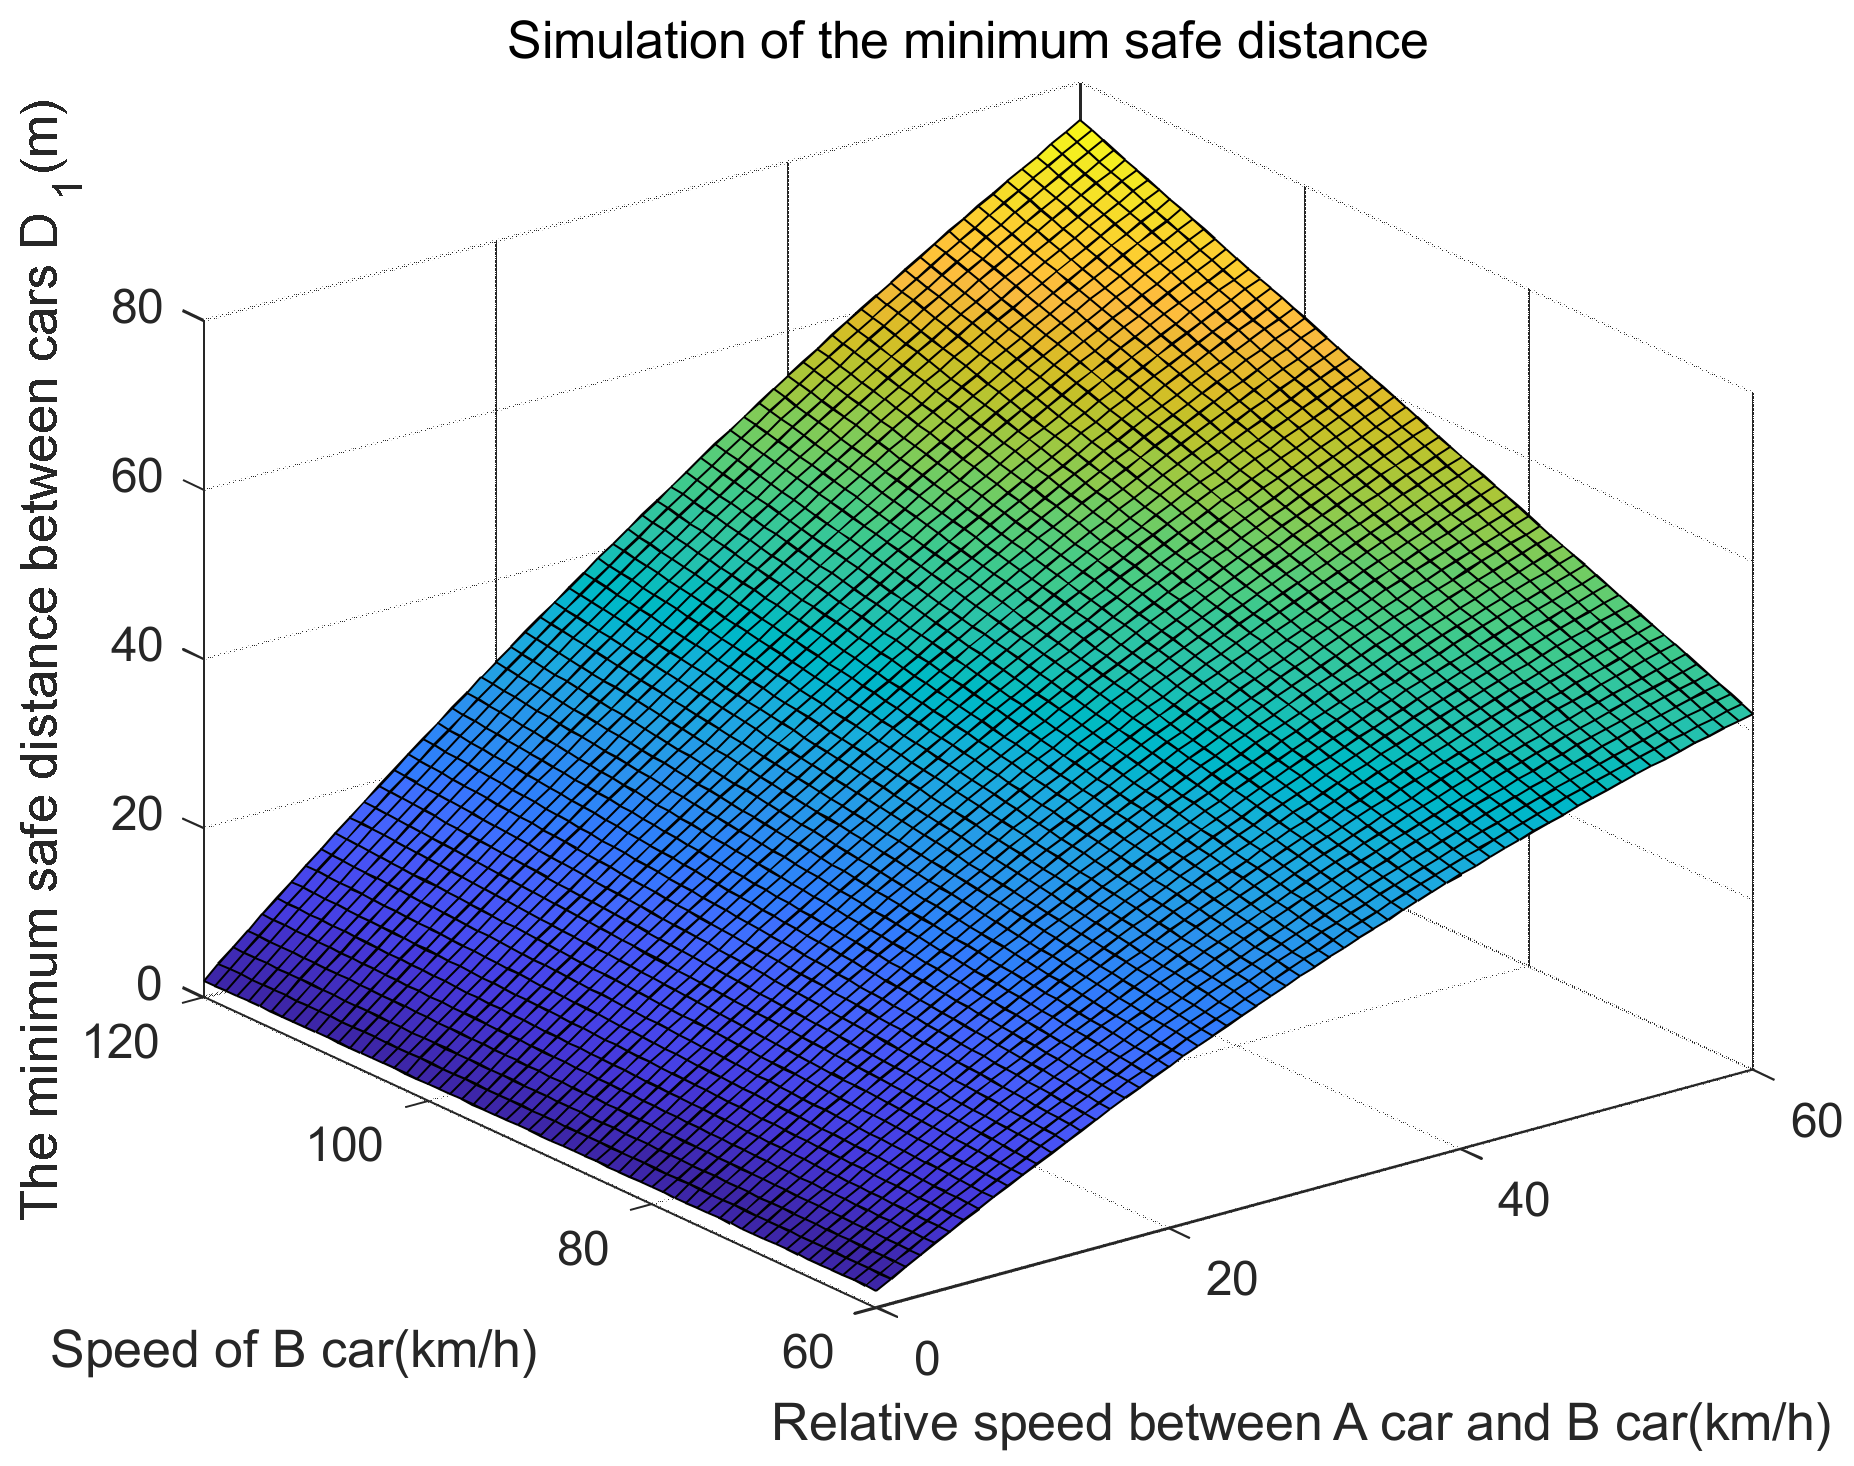
- Minimum safe distance D1
- (2)
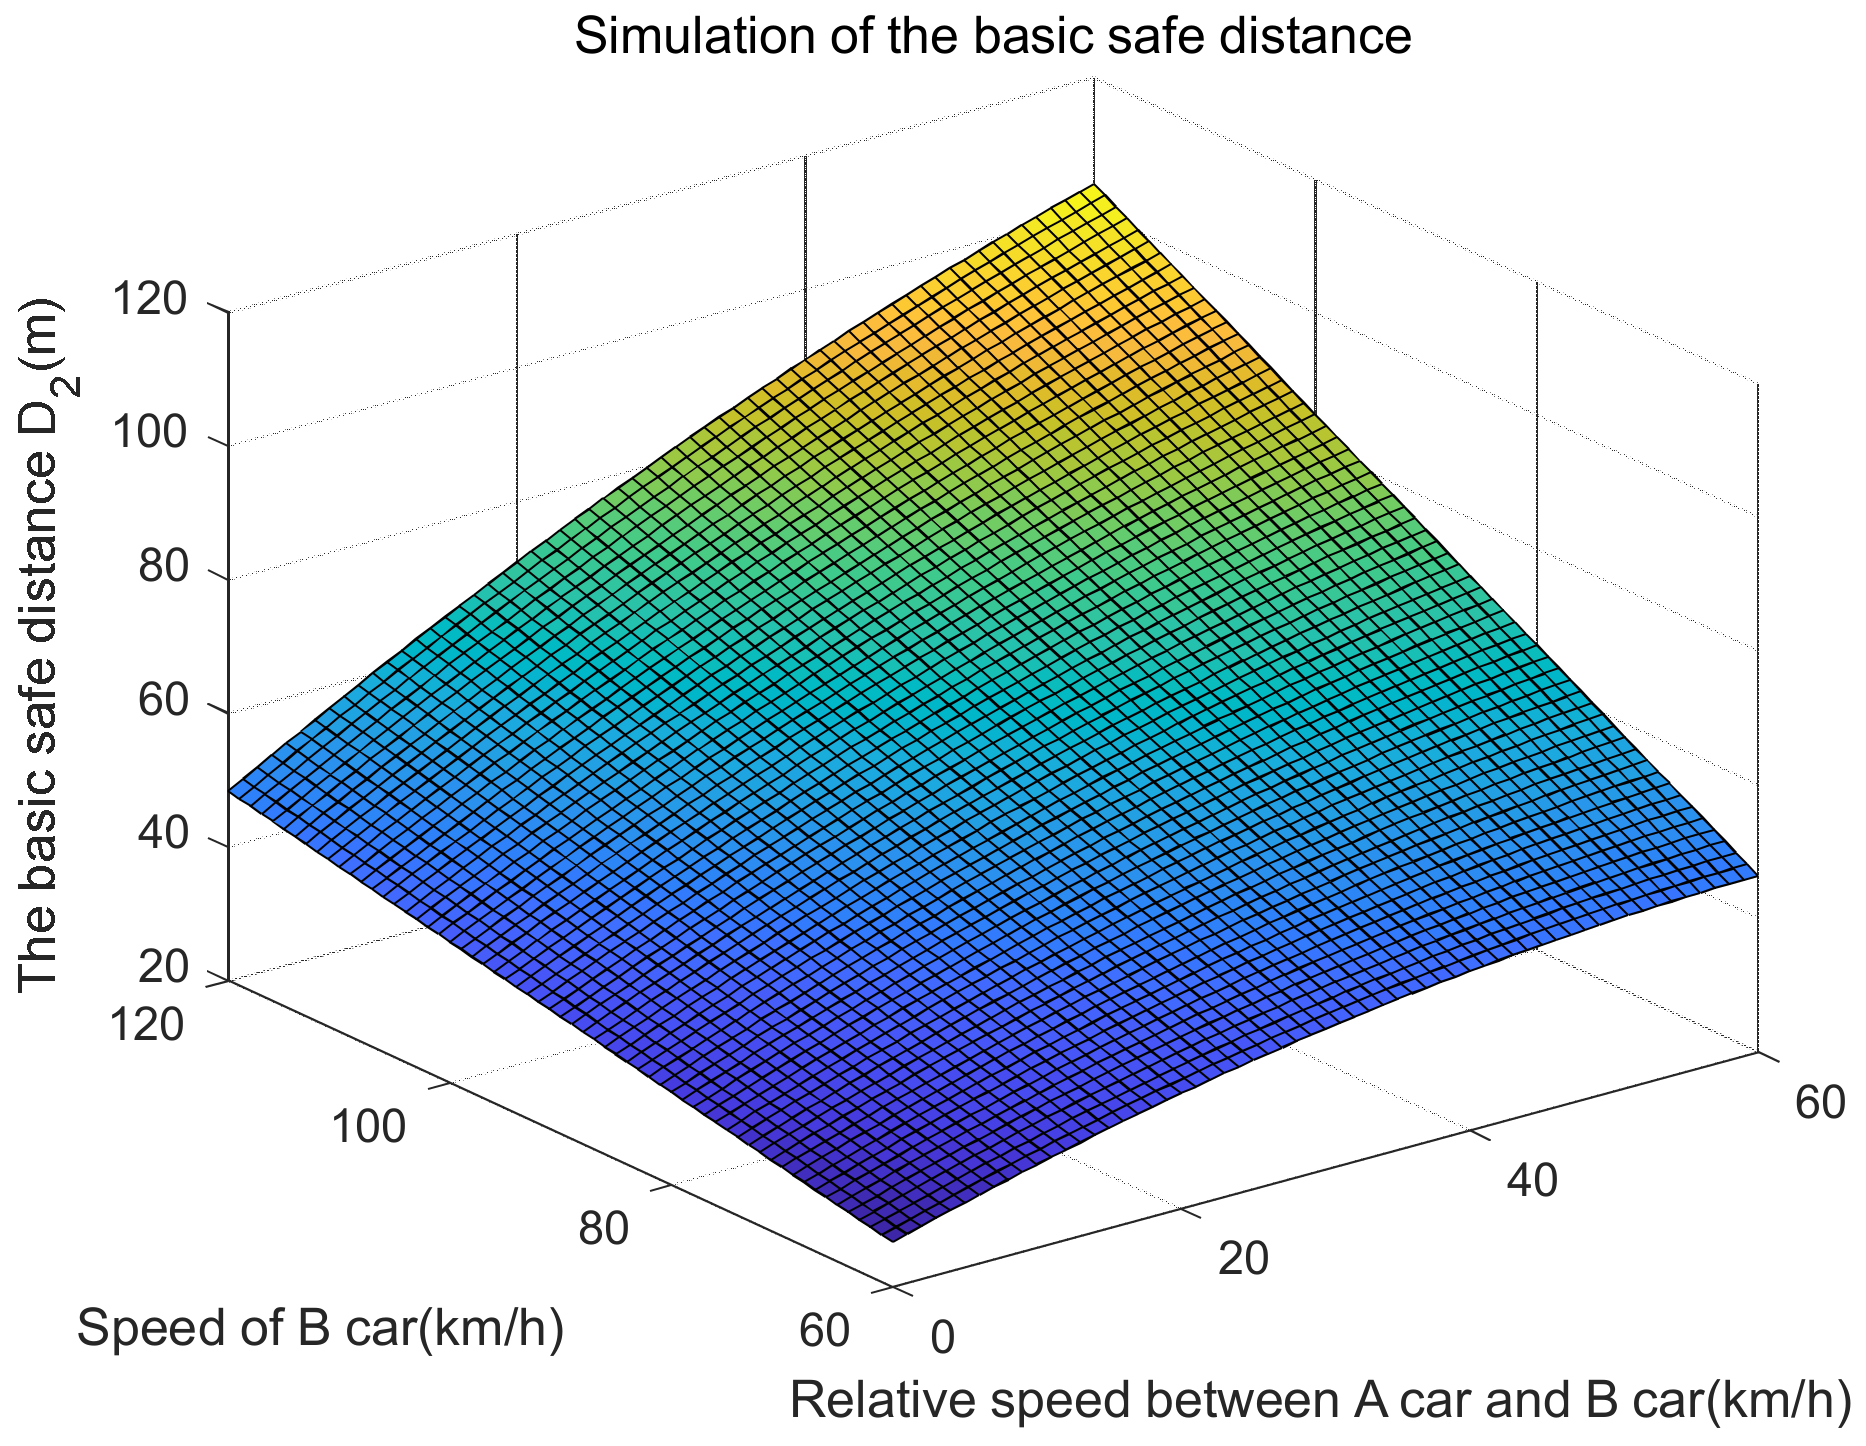
- Basic safe distance D2
- (3)
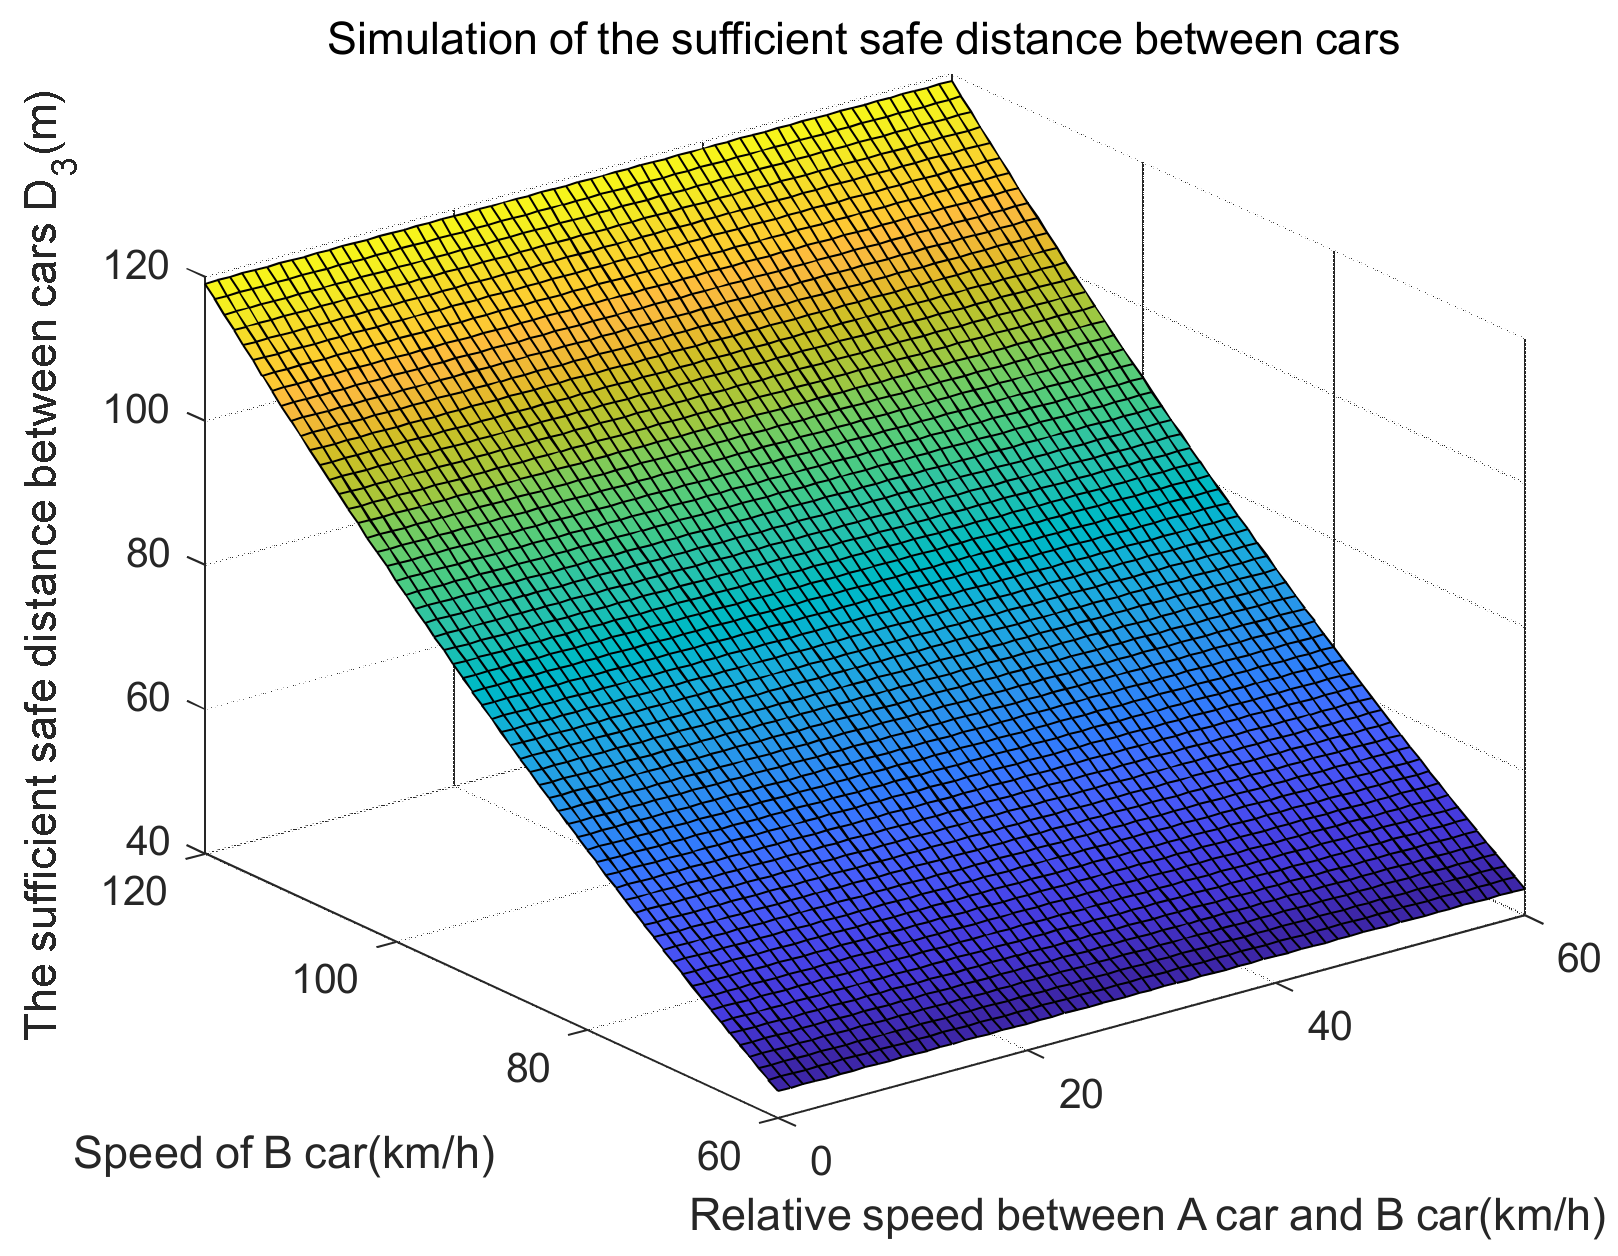
- Sufficient safe distance D3
3.3. Determination of Parameter Values in the Model
3.3.1. Determination of Parameters t1, t2 and t3
3.3.2. Determination of Parameters jAmax and jBmax
3.3.3. Determination of the Value of Parameter “d”
4. Simulation Analysis and Application
4.1. Calculations of Three Safe Distances for Different Road Conditions and Slopes
- (1)
- (2)
- (3)
4.2. Application of Three Kinds of Safe Distance on Expressways
5. Conclusions
- (1)
- Construct the calculation model of expressway parking sight distance based on braking deceleration and study the relationship between safe following distance and stopping sight distance.
- (2)
- Propose the suggested value of expressway stopping sight distance based on braking deceleration under different longitudinal slopes and study different design speeds.
- (3)
- Carry out the vehicle braking deceleration test, to further improve the parameter value of the model and enhance the application value of the research.
Author Contributions
Funding
Institutional Review Board Statement
Informed Consent Statement
Data Availability Statement
Conflicts of Interest
References
- Qian, Y.; Hu, Y. Modern Automobile Safety Technology; Shanghai Jiao Tong University Press: Shanghai, China, 2006. [Google Scholar]
- Peng, Z.; Wang, Y.; Wang, L. A comparative analysis of factors influencing the injury severity of daytime and nighttime crashes on a mountainous expressway in China. Int. J. Inj. Control Saf. Promot. 2021, 28, 503–512. [Google Scholar] [CrossRef] [PubMed]
- He, Z.; Zhang, J.; Xu, P. A Sensor Network-Based Intelligent Control System for Traffic Safe Distance. In Proceedings of the 2013 Sixth International Symposium on Computational Intelligence and Design, ISCID 2013, Hangzhou, China, 28–29 October 2013; pp. 326–329. [Google Scholar]
- Li, W.; Feng, K.; Zhang, H. Anti-rear-end Collision Warning System Based-on Zigbee for Highway Vehicle. Appl. Mech. Mater. 2012, 130–134, 3511–3514. [Google Scholar] [CrossRef]
- Wang, H.; Quan, W.; Wang, Y.; Liu, X. Modeling of Safe Driving Distance on the Basis of Vehicle-to-Vehicle Communication. Transp. Res. Rec. 2013, 2381, 28–35. [Google Scholar] [CrossRef]
- Wang, Q.; Xu, S.; Xu, H. A Fuzzy Control Based Self-Optimizing PID Model for Autonomous Car Following on Highway. In Proceedings of the 2014 International Conference on Wireless Communication and Sensor Network, WCSN 2014, Wuhan, China, 13–14 December 2014; pp. 395–399. [Google Scholar]
- Cao, W.; Wu, X.; Huang, H. Anti-Rear-End Collision Safe Running and Its Warning of Vehicle on Highway. In Proceedings of the 2016 Eighth International Conference on Measuring Technology and Mechatronics Automation (ICMTMA), Macau, China, 11–12 March 2016; pp. 97–101. [Google Scholar]
- Gargoum Suliman, A.; Karim, E.-B.; Joseph, S. Assessing Stopping and Passing Sight Distance on Highways Using Mobile LiDAR Data. J. Comput. Civ. Eng. 2018, 32, 65–85. [Google Scholar]
- Andrzej, S.; Adam, K.; Szymon, Z.; Andrzej, C. Examining Impact of Speed Recommendation Algorithm Operating in Autonomous Road Signs on Minimum Distance between Vehicles. Remote Sens. 2022, 14, 28–38. [Google Scholar] [CrossRef]
- Zhang, H.; Huang, Y.; Deng, K. Safety Analysis on Road Sight Distance. In Proceedings of the 2008 International Conference on Intelligent Computation Technology and Automation (ICICTA), Changsha, Hunan, 20–22 October 2008; pp. 461–465. [Google Scholar]
- Fambro, D.; Fitzpatrick, K.; Koppa, R. New Stopping Sight Distance Model for Use in Highway Geometric Design. Transportation Research Record. J. Transp. Res. Board 2000, 1701, 1–8. [Google Scholar] [CrossRef]
- Hassan, Y.; Sayed, T.; Tabernero, V. Establishing Practical Approach for Design Consistency Evaluation. J. Transp. Eng. 2001, 127, 295–302. [Google Scholar] [CrossRef]
- Crisman, B.; Marchionna, A.; Perco, P. Photogrammetric Surveys for the Definition of a Model for a Passing Sight Distance Computation. In Proceeding of the 20th International Symposium on Highway Geometric Design. Mainz: Road and Transportation Research Association, Mainz, Germany, 14–17 June 2000; pp. 110–118. [Google Scholar]
- Nehate, G.; Rys, M. 3D Calculation of Stopping-sight Distance from GPS Data. J. Transp. Eng. 2006, 132, 691–698. [Google Scholar] [CrossRef]
- Hassan, Y.; Sayed, T. Effect of Driver and Road Characteristics on Required Preview Sight Distance. Can. J. Civ. Eng. 2011, 29, 276–288. [Google Scholar] [CrossRef]
- Zhang, C.; Yang, S.; Zhao, Y.; Pan, B. Methods of Three-dimensional Sight Distance Inspection for Highway. J. Chang. Univ. Nat. Sci. Ed. 2009, 29, 54–57. [Google Scholar]
- Jiang, H.; Li, F. Modeling of Stopping Sight Distance and Analysis of Safe Speed on the Freeway with Different Road Conditions. J. Xi’an Technol. Univ. 2012, 32, 25–30. [Google Scholar]
- Yang, Y. Safety of Stop Sight Distance of Freeway Passing Lane for Passenger Car in Mountainous Area. J. Chang. Univ. Nat. Sci. Ed. 2014, 34, 42–48. [Google Scholar]
- Xun, S. Research on Sight Distance Inspection Technology of Mountain Highway; Kunming University of Science and Technology: Kunming, China, 2017. [Google Scholar]
- Yang, F.; Bai, H.; He, Y.; Wei, H. Study on Method of Evaluating Stopping Sight Distance of Median Strip in Expressway. J. Highw. Transp. Res. Dev. 2018, 35, 45–51. [Google Scholar]
- Luo, Y.; Zhang, F.; Zhang, Y. Model of minimum safety vehicle distance for trucks on curved slope combined section of expressway. Highw. Automob. Transp. 2019, 13, 39–43. [Google Scholar]
- Zhong, Y.; Yao, J. A formula of the critical safety distance between two moving vehicles. J. Hunan Univ. Nat. Sci. Ed. 2001, 28, 54–58. [Google Scholar]
- Zheng, A. The analysis of the motorway vehicle gap and design the device of protectiving vehicle collision. J. Wuhan Univ. Technol. 2002, 24, 62–65. [Google Scholar]
- Yang, P.; Tang, Y.; Ge, L.; Zhang, Y. Simulation Study on Minimum Vehicle Safety Distance Model in Following State. Heilongjiang Transp. Sci. Technol. 2013, 36, 166–168. [Google Scholar]
- Yu, Z. Automobile Theory; China Machine Press: Beijing, China, 2005. [Google Scholar]
- Li, X.; Tang, H. Numerical emulation of car braking dynamics model on superhighway. J. Syst. Simul. 2007, 2, 668–670. [Google Scholar]


| Pavement Condition | Asphalt, Concrete Pavement (Dry) | Asphalt, Concrete Pavement (Wet) | Dirt Road, Gravel Road (Snow) | Ice Road |
|---|---|---|---|---|
| The adhesion coefficient φ value | 0.8 | 0.7 | 0.6 | 0.15 |
| i = 0, d = 3 | Relative Velocity Vr (km/h) (Vr = VB − VA) | VB (km/h) | ||||||
|---|---|---|---|---|---|---|---|---|
| 0 | 10 | 20 | 30 | 40 | 50 | 60 | ||
| The minimum safe distance D1 (m) | 3.0000 | 60 | ||||||
| 3.0000 | 14.1227 | 24.2809 | 80 | |||||
| 3.0000 | 16.0517 | 28.1389 | 39.2616 | 49.4198 | 100 | |||
| 3.0000 | 17.9807 | 31.9969 | 45.0486 | 57.1358 | 68.2585 | 78.4167 | 120 | |
| i = 0, d = 3 | Relative Velocity Vr (km/h) (Vr = VB − VA) | VB (km/h) | ||||||
|---|---|---|---|---|---|---|---|---|
| 0 | 10 | 20 | 30 | 40 | 50 | 60 | ||
| The basic safe distance D2 (m) | 24.6667 | 60 | ||||||
| 31.8889 | 39.4005 | 45.9475 | 80 | |||||
| 39.1111 | 48.5517 | 57.0278 | 64.5394 | 71.0864 | 100 | |||
| 46.3333 | 57.7029 | 68.1080 | 77.5486 | 86.0247 | 93.5363 | 100.0833 | 120 | |
| i = 0, d = 3 | Relative Velocity Vr (km/h) (Vr = VB − VA) | VB (km/h) | |||
|---|---|---|---|---|---|
| 60 | 80 | 100 | 120 | ||
| The sufficient safe distance between cars D3 (m) | 43.6844 | 60 | |||
| 64.9653 | 80 | ||||
| 90.1042 | 100 | ||||
| 119.1011 | 120 | ||||
| i = 0.3, d = 2 | Relative Velocity Vr (km/h) (Vr = VB − VA) | VB (km/h) | ||||||
|---|---|---|---|---|---|---|---|---|
| 0 | 10 | 20 | 30 | 40 | 50 | 60 | ||
| The minimum safe distance D1 (m) | 2.0000 | 60 | ||||||
| 2.0000 | 12.8612 | 22.7928 | 80 | |||||
| 2.0000 | 14.7205 | 26.5114 | 37.3726 | 47.3042 | 100 | |||
| 2.0000 | 16.5798 | 30.2300 | 42.9505 | 54.7413 | 65.6026 | 75.5341 | 120 | |
| i = 0.3, d = 2 | Relative Velocity Vr (km/h) (Vr = VB − VA) | VB (km/h) | ||||||
| 0 | 10 | 20 | 30 | 40 | 50 | 60 | ||
| The basic safe distance D2 (m) | 23.6667 | 60 | ||||||
| 30.8889 | 38.1390 | 44.4595 | 80 | |||||
| 38.1111 | 47.2205 | 55.4003 | 62.6504 | 68.9708 | 100 | |||
| 45.3333 | 56.3020 | 66.3411 | 75.4505 | 83.6302 | 90.8803 | 97.2008 | 120 | |
| i = 0.3, d = 2 | Relative Velocity Vr (km/h) (Vr = VB − VA) | VB (km/h) | |||
|---|---|---|---|---|---|
| 60 | 80 | 100 | 120 | ||
| The sufficient safe distance between cars D3 (m) | 42.0569 | 60 | |||
| 62.8497 | 80 | ||||
| 87.3611 | 100 | ||||
| 115.5911 | 120 | ||||
| i = −0.3, d = 5 | Relative Velocity Vr (km/h) (Vr = VB − VA) | VB (km/h) | ||||||
| 0 | 10 | 20 | 30 | 40 | 50 | 60 | ||
| The minimum safe distance D1 (m) | 5.0000 | 60 | ||||||
| 5.0000 | 16.4045 | 26.8070 | 80 | |||||
| 5.0000 | 18.4087 | 30.8153 | 42.2198 | 52.6223 | 100 | |||
| 5.0000 | 20.4129 | 34.8236 | 48.2323 | 60.6389 | 72.0435 | 82.4459 | 120 | |
| i = −0.3, d = 5 | Relative Velocity Vr (km/h) (Vr = VB − VA) | VB (km/h) | ||||||
| 0 | 10 | 20 | 30 | 40 | 50 | 60 | ||
| The basic safe distance D2 (m) | 26.6667 | 60 | ||||||
| 33.8889 | 41.6823 | 48.4736 | 80 | |||||
| 41.1111 | 50.9087 | 59.7042 | 67.4976 | 74.2889 | 100 | |||
| 48.3333 | 60.1351 | 70.9347 | 80.7323 | 89.5278 | 97.3212 | 104.1126 | 120 | |
| i = −0.3, d = 5 | Relative Velocity Vr (km/h) (Vr = VB − VA) | VB (km/h) | |||
|---|---|---|---|---|---|
| 60 | 80 | 100 | 120 | ||
| The sufficient safe distance between cars D3 (m) | 46.3609 | 60 | |||
| 68.1678 | 80 | ||||
| 93.9831 | 100 | ||||
| 123.8067 | 120 | ||||
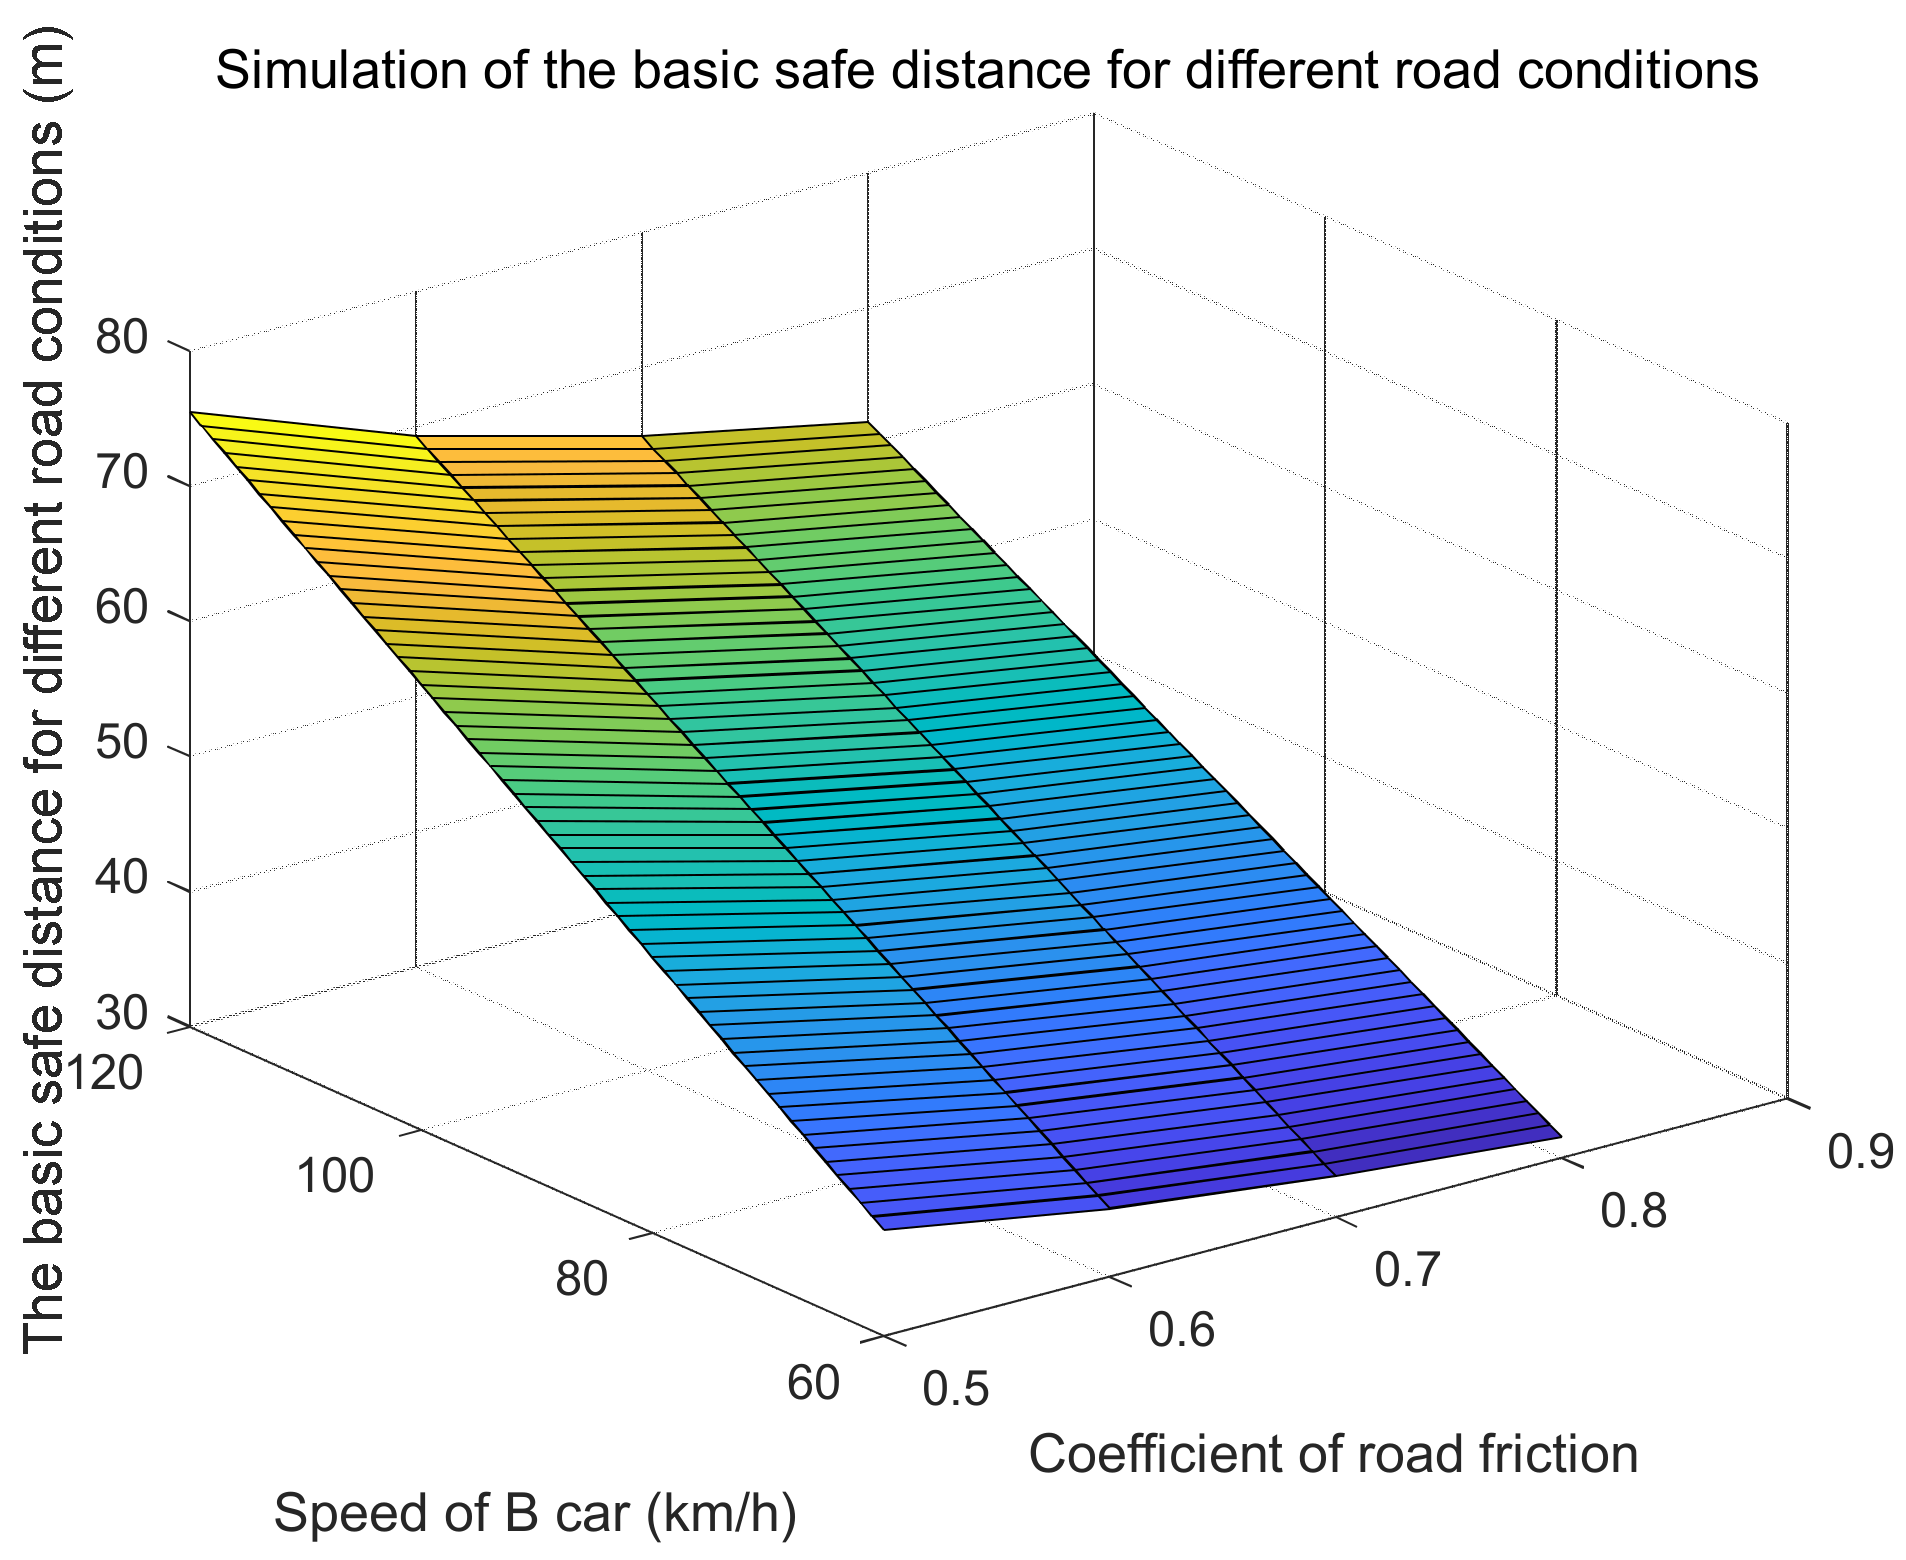
| Vr = VB − VA = 20 km/h | Coefficient of Road Adhesion φ | VB (km/h) | |||
|---|---|---|---|---|---|
| 0.5 | 0.6 | 0.7 | 0.8 | ||
| The basic safety distance between cars D2 (m) | 54.5361 | 50.8616 | 48.2369 | 46.2684 | 80 |
| 68.0576 | 63.3332 | 59.9586 | 57.4276 | 100 | |
| 81.5790 | 75.8047 | 71.6802 | 68.5869 | 120 | |
Disclaimer/Publisher’s Note: The statements, opinions and data contained in all publications are solely those of the individual author(s) and contributor(s) and not of MDPI and/or the editor(s). MDPI and/or the editor(s) disclaim responsibility for any injury to people or property resulting from any ideas, methods, instructions or products referred to in the content. |
© 2023 by the authors. Licensee MDPI, Basel, Switzerland. This article is an open access article distributed under the terms and conditions of the Creative Commons Attribution (CC BY) license (https://creativecommons.org/licenses/by/4.0/).
Share and Cite
Wu, X.; Fu, S. Research on Safe Following Distance on an Expressway Based on Braking Process Analysis. Appl. Sci. 2023, 13, 1110. https://doi.org/10.3390/app13021110
Wu X, Fu S. Research on Safe Following Distance on an Expressway Based on Braking Process Analysis. Applied Sciences. 2023; 13(2):1110. https://doi.org/10.3390/app13021110
Chicago/Turabian StyleWu, Xinye, and Shude Fu. 2023. "Research on Safe Following Distance on an Expressway Based on Braking Process Analysis" Applied Sciences 13, no. 2: 1110. https://doi.org/10.3390/app13021110
APA StyleWu, X., & Fu, S. (2023). Research on Safe Following Distance on an Expressway Based on Braking Process Analysis. Applied Sciences, 13(2), 1110. https://doi.org/10.3390/app13021110