Article

Numerical Assessment of Interacting Structural Units on the Seismic Damage: A Comparative Analysis with Different Modeling Approaches

by
Mattia Schiavoni
1,
Ersilia Giordano
1,
Francesca Roscini
2 and
Francesco Clementi
1,*
1
Department of Civil and Building Engineering, and Architecture, Polytechnic University of Marche, Via Brecce Bianche 12, 60131 Ancona, Italy
2
Niccolò Cusano University, Via Don Carlo Gnocchi 3, 00166, Rome, Italy
*
Author to whom correspondence should be addressed.
Appl. Sci. 2023, 13(2), 972; https://doi.org/10.3390/app13020972
Submission received: 11 December 2022 / Revised: 31 December 2022 / Accepted: 4 January 2023 / Published: 11 January 2023
(This article belongs to the Special Issue Advanced Seismic Evaluation of Relevant Architectures)

Abstract

:
The conservation of the historical and artistic heritage is one of the main priorities of Italian and international policy. The great variety of masonry buildings that make up this heritage is characterized by different combinations of materials and construction techniques. Then, several damage scenarios could be observed as a result, requiring appropriate retrofitting interventions. A rather accurate structural behavior analysis, especially for horizontal load conditions, allows for elaborating a correct seismic assessment. Albeit there are various numerical tools available to examine them, each one’s process starts by means of certain assumptions that could not be applied indiscriminately. This paper aims to compare two different types of modeling techniques to evaluate their strengths and weaknesses. To achieve this goal, an earthquake-damaged complex in Central Italy was chosen as a case study. The structure was modeled using a finite element (continuous) and a distinct element (discontinuous) method. Both approaches underwent a nonlinear dynamic analysis using the strong motions recorded during the 2016 seismic sequence. The results show that both approaches can evaluate the weak structural points. However, in some cases, the distinct element method appeared more accurate in reproducing the cracks.

1. Introduction

Heritage masonry constructions demonstrated over the years their extreme weakness against the dynamic loads, i.e., earthquakes. The most recent strokes, which took place in Central Italy between 2016 and 2017, highlighted the vulnerability of the masonry structures [1,2,3,4,5]. Numerous factors, including their irregular geometry, uneven evolution across time, inadequate conservation status, and noneffective box-like behavior, influence their high vulnerability [6,7,8].
In ordinary practice, the evaluation of masonry structures is carried out by an equivalent frame [9,10] derived from the damage observation after very destructive earthquakes, where the vertical masonry panels make up for the piers, as the bands between the openings do for the spandrels. Both are damageable elements connected with rigid nodes, wherein the damage is not expected. The regularity of the structures, a correct distribution, an alignment of the openings, and an absence of staggering of intermediate floors represent the hypotheses underlying a correct application of the equivalent frame method. However, these assumptions fall in historical buildings due to the chaotic evolution through time [11].
Since the 1990s, scientific research has started studying increasingly effective modeling tools for analyzed heritage masonry constructions [12,13]. In this field, there are two most popular methods, which provide a better numerical response when compared with real damage: the block-based (discontinuous) and the continuous (homogenization) models. In the first one, the masonry response is simulated by considering the distinct roles played by the blocks and the mortar. It includes detailed micro-modeling, where both blocks and mortar are represented [14,15], along with simplified micro-modeling where the mortar thickness is incorporated into the blocks’ dimensions [5,10,16,17]. The block-based (discontinuous) approach can be modeled with both finite element (FE) and discrete element (DE) methods.
In the FE one, the masonry is represented by sufficiently regular elements, interacting with each other for the interposition of interfaces [18]. The latter are, generally, governed by frictional or cohesive laws, wherein the parameters might be calibrated thanks to proper experimental tests. In the DE method, the masonry is always made of blocks that interact between themselves through the contact surfaces, where, generally, non-smooth or smooth (contact) laws are used. The main advantage of using the block-based (discontinuous) approaches is the possibility to consider the separation of the blocks as well as the possible crumbling of the multi-leaf masonry walls. This allows for studying, in a unified way, the in-plane and the out-of-plane behavior of the wall panels and their possible evolution over time. Recently, it has been possible to find a combination of the two methods [19,20].
On the other hand, the continuous method makes no distinction between the elements composing the masonry. Typically, the walls are assumed perfectly connected to each other also in their orthogonal intersections, allowing for a detailed description of the in-plane structural response. The heterogeneity of the material is assumed as a continuous deformable body that can simulate the behavior under static and dynamic loads by means of appropriate constitutive laws [21,22,23,24,25]. These constitutive laws can be drawn either directly by the responses calibrating from standard experimental tests [26] or indirectly by considering values obtained for similar masonry [27] or by national or international regulations [28,29]. Comparing with the first block-based (discontinuous) model, this process takes less time for the modeling and the analysis execution.
In this paper, the numerical versatility of the block-based (discontinuous) approach, with the DE method, is compared to the continuous one by the classical FE method with solid elements. Both methods are applied to a relevant case study, i.e., the town hall of Accumoli village, in the hinterland of the Lazio Region (Figure 1) in Rieti Province (Central Italy). Most of the village suffered widespread damage since the first shock on 24 August 2016, and the case study is the only structure still standing in the oldest part of this town.
In Section 2.1 and Section 2.2, the historical developments, the geometric configuration, the materials, and the suffered damage are shown. The data are used to generate the continuous and block-based (discontinuous) models reported in Section 2.3. Both models are subjected to nonlinear dynamic analyses, applying the three main events recorded in the Central Italy seismic sequence to take into account the effect of the cumulative damage. The main results (Section 3) and conclusions (Section 4) are finally reported.

2. Materials and Methods

2.1. Historical Developments and Geometric Configuration

There is little historical information about the building. It seems to be the most ancient palace in the Accumoli village (Figure 1). The earliest evidence that proved its existence dates to the XII Century, when the village was under the Naples kingdom.
The square plan of the tower and the two arched windows of the entrance suggest that it was designated, from its earliest days, as a public building (Figure 2). In terms of the complex’s geometric arrangement, three buildings can be identified: the civic tower on the south-east, the main structure on the south (also known as the Podestà Palace), and an annex on the north (Figure 2).
The tower has a square cross-section of 6.15 m on each side and a maximum height of 20 m. The walls’ thicknesses are almost constant and equal to 1.2 m. It shows four single-arch windows in correspondence with the bell cell and three embrasures along the height. Inside, there is one masonry cross vault, whereas the pitched roof is made with reinforced concrete. Regular cut stones characterize the external tower masonry, and the walls’ thickness suggests the presence of an inner core of rubble stone.
The two floors of the Podestà Palace have a rectangular cross-section that measures 8.60 × 14.00 m2. The maximum building height, estimated at the ridge of the roof, accounts for a value of 12.8 m. On the first floor, there is the entrance, consisting of an arched portico. The “Piano Nobile” is located on the first floor. The slabs are made of wood, except for a masonry cross vault on the stairwell. The palace-bearing structure is composed of regular cut stone.
On the south side, there is a one-floor annex of 10.50 × 3.80 m2 in dimensions.

2.2. Damage Suffered Following the 2016–2017 Central Italy Earthquake

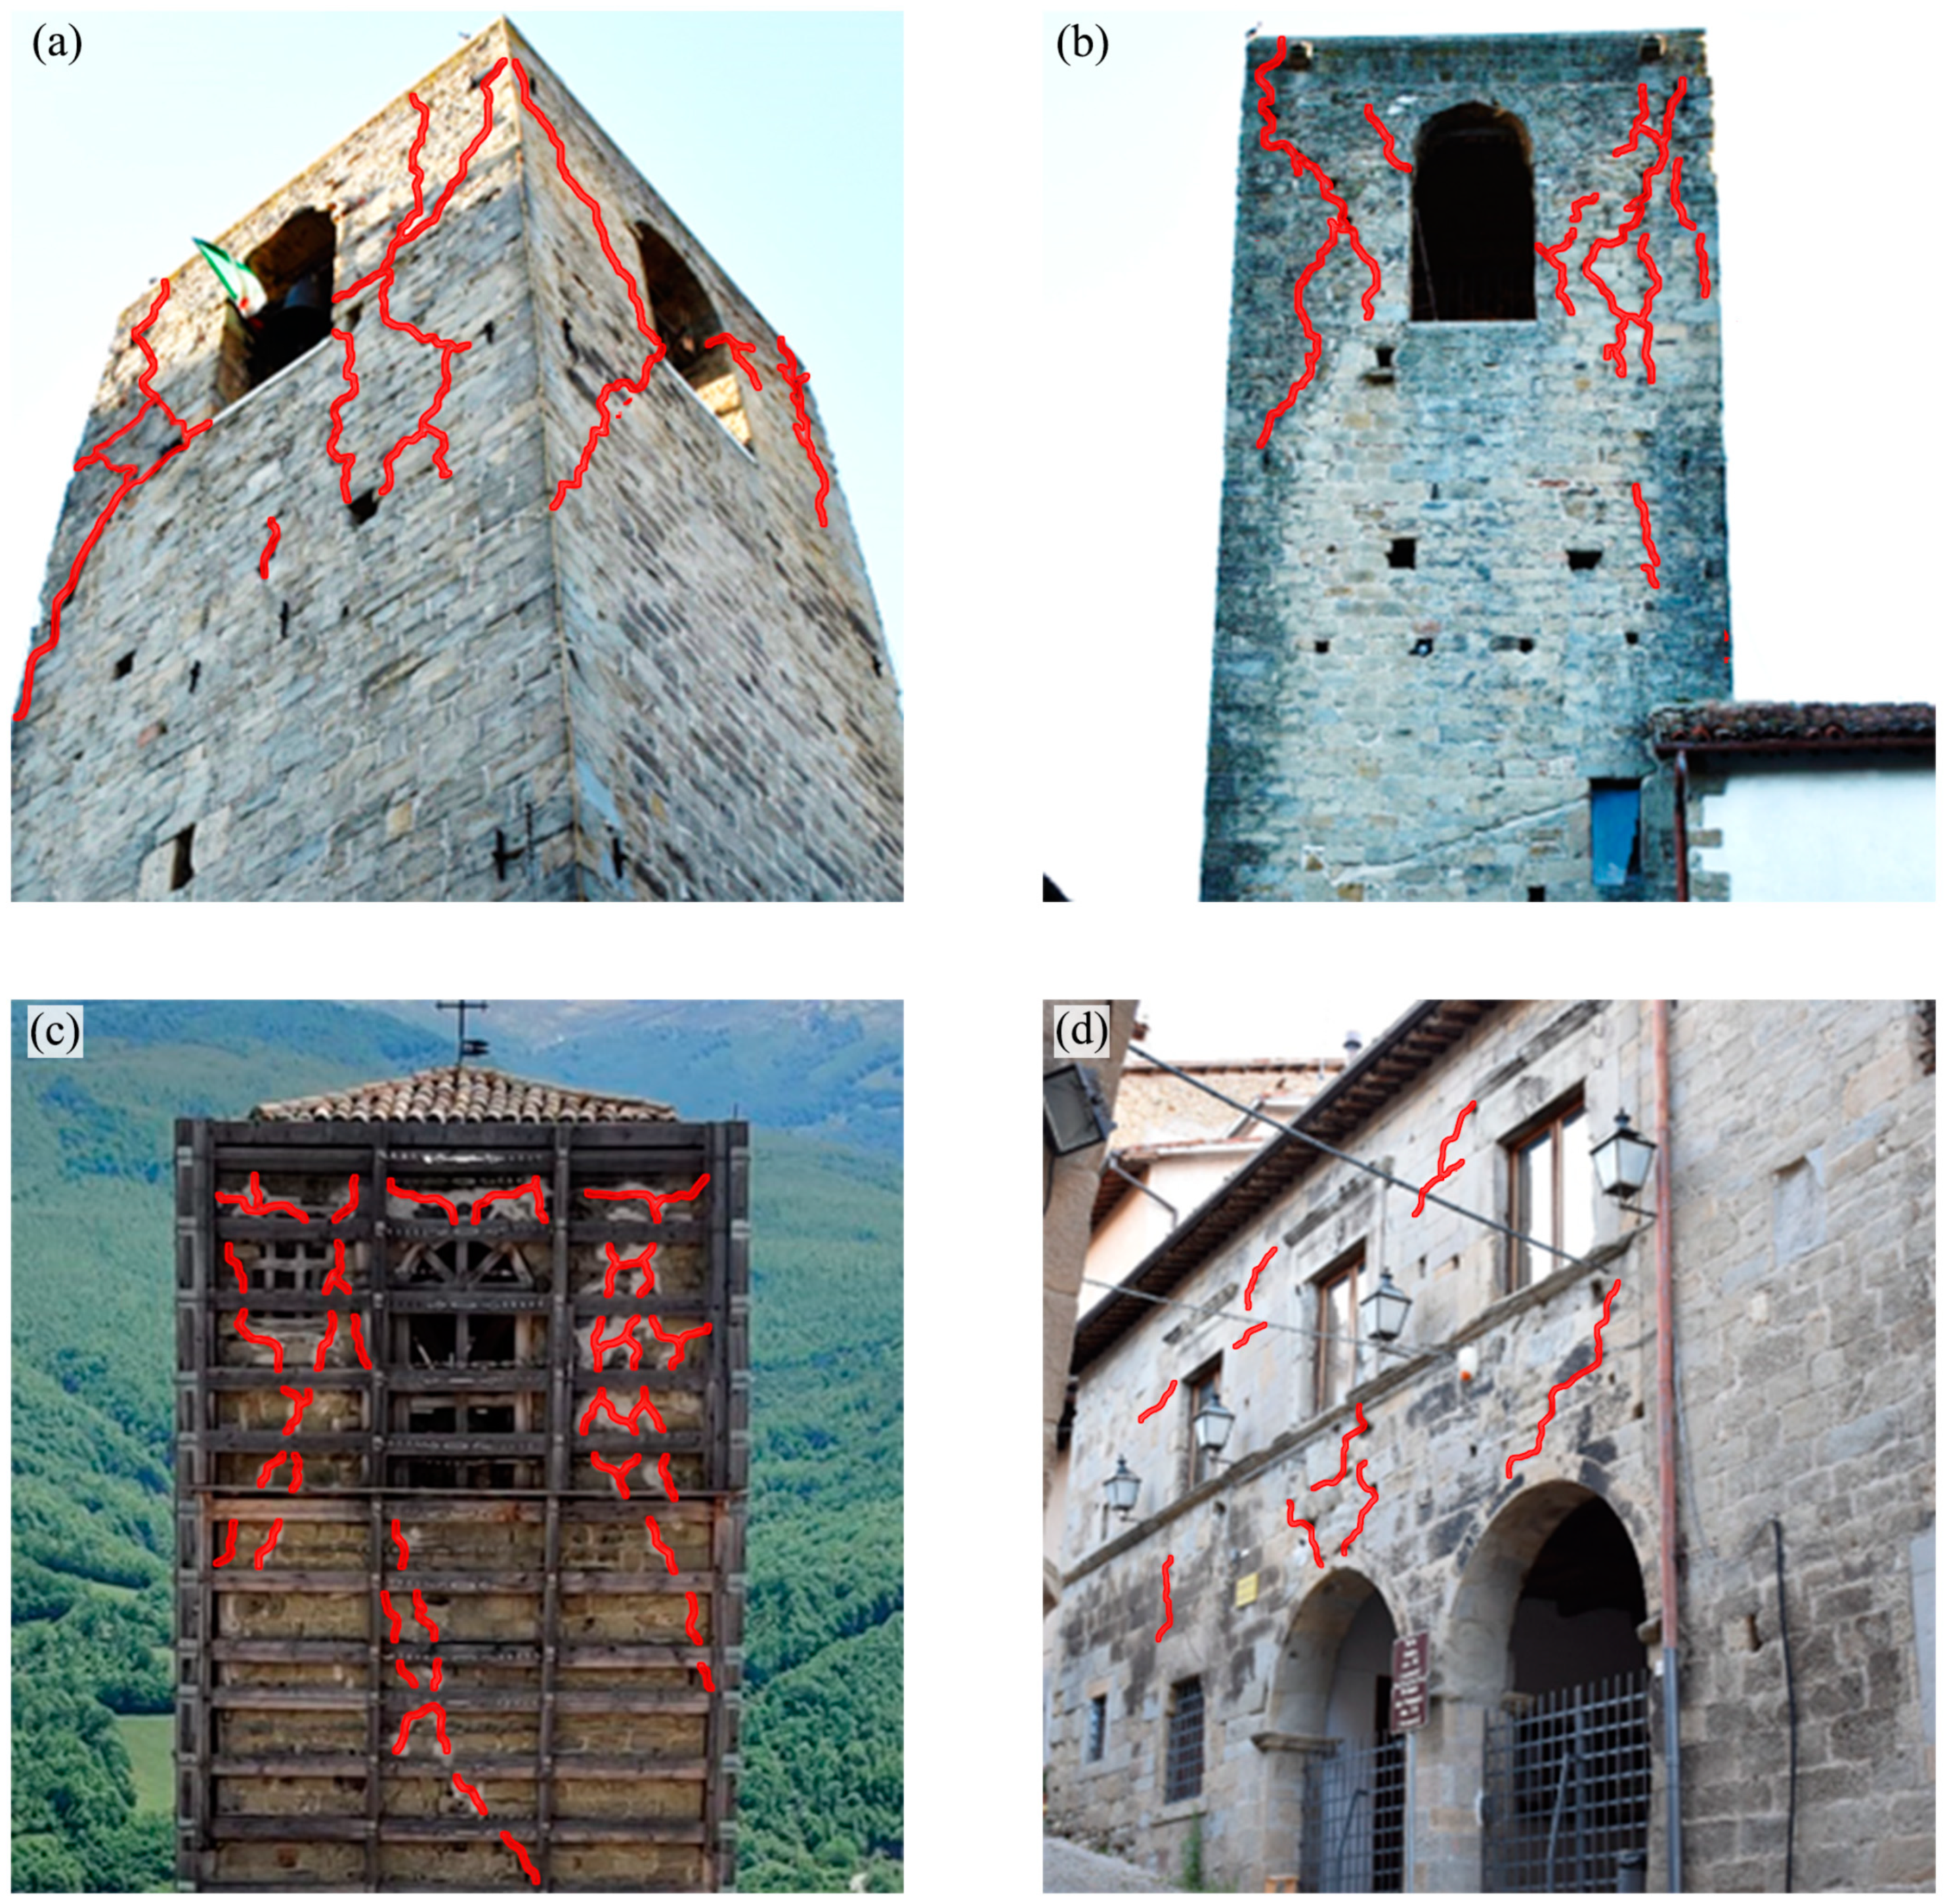
The structure showed deep cracks following the earthquake. The most affected area is the tower, as visible in Figure 3. It showed a torsion-flexural deformation on its upper part, masonry disaggregation on the support surface of the roof, and spread diagonal cracks in each bell cell corner. These latter cracks provide unequivocal proof that their out-of-plane processes have been activated. Small cracks also emerged in the interaction between the Podestà Palace and the tower, as well as inside the portico’s openings.
Before the last strong quake occurred on 30 October 2016, the firefighters secured it. They enclosed the tower with a system of ties and wood elements to avoid its collapse if other strong quakes would have occurred (Figure 3).

2.3. Numerical Models

The structure was analyzed with a continuous (CM) and a discontinuous (DM) (namely as a “block-based (discontinuous) approach”) model.
The CM was designed with the commercial software Midas FEA NX© 2022 V1.1 [30]. The masonry was simplified with a homogeneous isotropic material. Its nonlinearity was considered with the concrete damage plasticity method (CDP). The CDP allows for the representation of different masonry capacities in tension and compression through the definition of distinct laws.
The DM, on the other hand, was implemented with LMGC90© version 2021, where the structure’s geometry was imported as a discrete block assembly [31,32]. Since this was a simplified micro-modeling approach, the blocks’ dimensions included the mortar’s thickness. The blocks were arranged to replicate, with sufficient accuracy, the existing pattern. The nonlinearity of masonry, concentrated in the interaction of blocks, was simulated by the non-smooth contact dynamic (NSCD) method.

2.3.1. Concrete Damage Plasticity Model (CDP)

The CDP was formulated to model the brittle behavior of concrete, even though it proved to be suitable to catch the response of all brittle materials, such as masonry. It is an isotropic plasticity model presented for the first time by Lubliner [33] and subsequently implemented by Lee and Fenves [34]. The first formulation introduced the concept of distinct responses in tension and compression [33]. However, the improvement [34] was considered thanks to the contribution of the stiffness recovery, following the cracks’ closing under cycle loads.
The damage is defined by the effective configuration (damaged). To accomplish this, the equivalence between tension stress in undamaged ( σ 0 ) and damaged ( σ ) configurations must be imposed, taking the damage parameter (d) into account:
σ = d · σ 0 ,
written under the hypothesis of strain equivalence:
ε = ε 0 .
In the plasticity theory, the strain tensor can be expressed as the sum of its elastic and plastic components:
ε = ε e + ε p
where the elastic stress can be written as a function of the elastic damage stiffness matrix E using the Hooke law:
σ = E ( ε ε p )
To consider the damage irreversibility, the degraded stiffness matrix is expressed as:
E = 1 d E 0 ,
where E 0 identifies the undamaged elastic stiffness matrix. When the material is intact, the d value is zero, whereas, when it is completely broken, it assumes a value of one. This consideration affects the relationship between stress and strain, which becomes:
σ = 1 d E 0 ε ε p .
To account for the higher stiffness degradation in tension ( d t ) compared to that in compression ( d c ) , under mono axial stress (Figure 4a,b), two distinct damaged variable laws must be defined:
σ t = 1 d t E 0 ε t ε t p ,
σ c = 1 d c E 0 ε c ε c p .
Equations (7) and (8) assume increasing values as the elastic strain increases. Instead, under cyclic loads, the crack closure produces a partial elastic stiffness recovery, especially passing from tension to compression status. In this case, it is assumed that:
1 d = 1 s t d c 1 s c d t .
The scalars s t and s c hold the stiffness recovery during the load inversion. They are defined as functions of weight factors as:
s t = 1 w t r σ _ ^ ,
s c = 1 w c 1 r σ _ ^ ,
where r σ _ ^ is equal to zero if the principal stresses are all positive and, when the primary stresses are all negative, it takes unity. w t and w c are the scalar considering the stiffness recovery: assuming zero, the stiffness recovery is not considered; if they are equal to one, a complete recovery is allowed.
To define the boundary of the elastic domain, a yield strength function based on the Drucker–Prager is employed (Figure 4c):
F ( σ _ , κ ) = 1 1 α [ α I 1 + 3 I 2 + β ( κ ) σ _ ^ m a x γ σ _ ^ m a x ] c c ( κ )
with:
I 1 the first invariant of effective stress;
I 2 the second invariant of effective stress;
σ _ ^ maximum principal effective stress.
Although, α and β are two constants defined using the initial uniaxial compressive yield stress f b 0 and the initial equiaxial compressive yield stress as:
α = f b 0 f c 0 2 f b 0 f c 0 ,
β = c c ( κ ) c t ( κ ) α 1 1 + α ,
and c c ( κ ) and c t κ are the effective cohesion in compression and tension, respectively.
Finally, the constant γ is calculated as:
γ = 3 1 K c 2 K c 1
where K c ( 0.5 K c < 1 ) is a parameter that defines the yield surface shape. It can assume a value between 0.5 and 1.
The CDP models the non-associated potential flow employing the Drucker–Prager hyperbolic function. It is defined by the dilatation angle ( ψ ) , the eccentricity ε e c c e n , and the tensile strength f t 0 , (16):
G = ε e c c e n f t 0 t a n   t a n ψ 2 + 3 J 2 + 1 3 I 1 t a n   t a n ψ .
An additional parameter is typically presented, i.e., the viscosity used to avoid numerical convergence problems.

2.3.2. Non-Smooth Contact Dynamics Model (NSCD)

The NSCD method implemented in the LMGC90© version 2021 [31,32] uses an implicit integration scheme and integrates non-smooth contact laws. Considering two bodies in a plane, one candidate A i and one antagonist A j , and their possible points of contact C i and C j , with n the vector orthogonal to the point of contact C i (Figure 5a), the distance between the two points of contact will be:
g = ( C j C i ) n .
Defining u ˙ n and u ˙ t , the normal and tangential velocity of C j with respect to C i , and r n and r t , the normal and tangential reaction forces of A i on A j , two contact laws were used:
1.
Signorini’s law of impenetrability (Figure 5b):
g 0 , r n 0 , g r n = 0 ,
if   g = 0 u ˙ n 0 r n 0 u ˙ n r n = 0 .
This law specifies a perfectly plastic impact, i.e., Newton’s law returns a restitution coefficient equal to zero. As a result of the impact, there are no bounces and, in the case of stones and bricks, there is a low coefficient of restitution and, for this reason, it can be neglected.
2.
The dry-friction Coulomb’s law (Figure 5c):
r t μ r n : { r t < μ r n u ˙ t = 0 , r t = μ r n u ˙ t = λ r t r t ,
where μ is the friction coefficient and λ is a positive real arbitrary number.
The equation of motion can be written in this way:
M q ¨ = f q , q ˙ , t + l ,
where M is the mass matrix, q ¨ is the acceleration, and f ( q , q ˙ , t ) is the vector of the internal and external discretized forces acting on the system; meanwhile, l is a measure of the impulse of contact resultant.
The couples that characterize each contact, ( u ˙ n , u ˙ t ) and ( r n , r t ), are related by linear maps that depend, respectively, on the global vector q ˙ and l .
The l and the velocity q ˙ are a discontinuous function of time given that Equations (18) and (19) are non-smooth. The velocities are discontinuous and the equation of motion is integrated into time intervals t i , t i + 1 in this way:
M q ˙ i + 1 q ˙ i = t i t i + 1 f q , q ˙ , t d t + l _ i + 1 ,
where l _ i + 1 is the impulse in the interval time and q ˙ i + 1 is the variable that approximates the right limit of the speed in the time t i + 1 .
The reactions are approximated in the average of the impulse in t i , t i + 1 in the global (22) and local contacts (18)–(19). The deformability of the blocks is neglected, obtaining the dynamic iteration between the elements exclusively by sliding and rotation of the blocks.

2.4. Numerical Model Characteristics

The geometry of the structure was precisely recreated in both models (Figure 6), paying attention to each structural component and opening. The ground presence on the walls of the ground floor was considered by adding vertical rollers and big blocks adjacent to them in both the CM and DM.
The CM, in which the geometry was discretized with 4-node solid brick elements, had 92986 elements, 23091 nodes, and 69276 degrees of freedom (Figure 6a). In the DM, conversely, the masonry was represented as a blocks’ assembly; the size of them was chosen to obtain a fair compromise between computational costs and accuracy of results. The model is composed of 6790 3D rigid blocks, establishing a mutual interaction in normal and tangential directions.
The tower walls’ thicknesses were split into three measures to distinguish between the external layers, of 0.4 m each, and the inner core, of 0.4 m. The blocks used to simulate the inner core were simply allocated close to the external ones. The masonry panels are characterized by a poor connection between the layers within the wall. For this reason, the numerical simulation is implemented through the distinction between an internal layer and two external layers. In particular, the internal part is modeled by greater blocks than the other layers. Therefore, regarding the masonry damage study, this choice has allowed the investigation of the crumbling phenomenon with focus on the external layers. The wall’s layer connection was ensured by means of a through stone each square meter (Figure 6b). This choice could guarantee a limited connection, avoiding a complete independency between the layers.
The models require distinct parameters to simulate masonry behavior. Regarding the CM generated with the Midas FEA NX© 2022 V1.1, it is necessary to define elastic moduli and masses for the linear response. Conversely, for the nonlinearity, the parameters of the yield surface and the two mono-axial laws in tension and compression, with their respective damage evolutions, are defined. In the DM made with the LMGC90© version 2021, the blocks are characterized by only their density. In addition, to specify the interaction laws, the definition of the friction values is required (see Table 1).
According to the survey conditions, the entire structure is conceived with cut regular stone masonry. The only difference is in the tower, which has an inner core made with rubble stones. The materials’ parameters are considered as reported in the Italian Code [28,29].
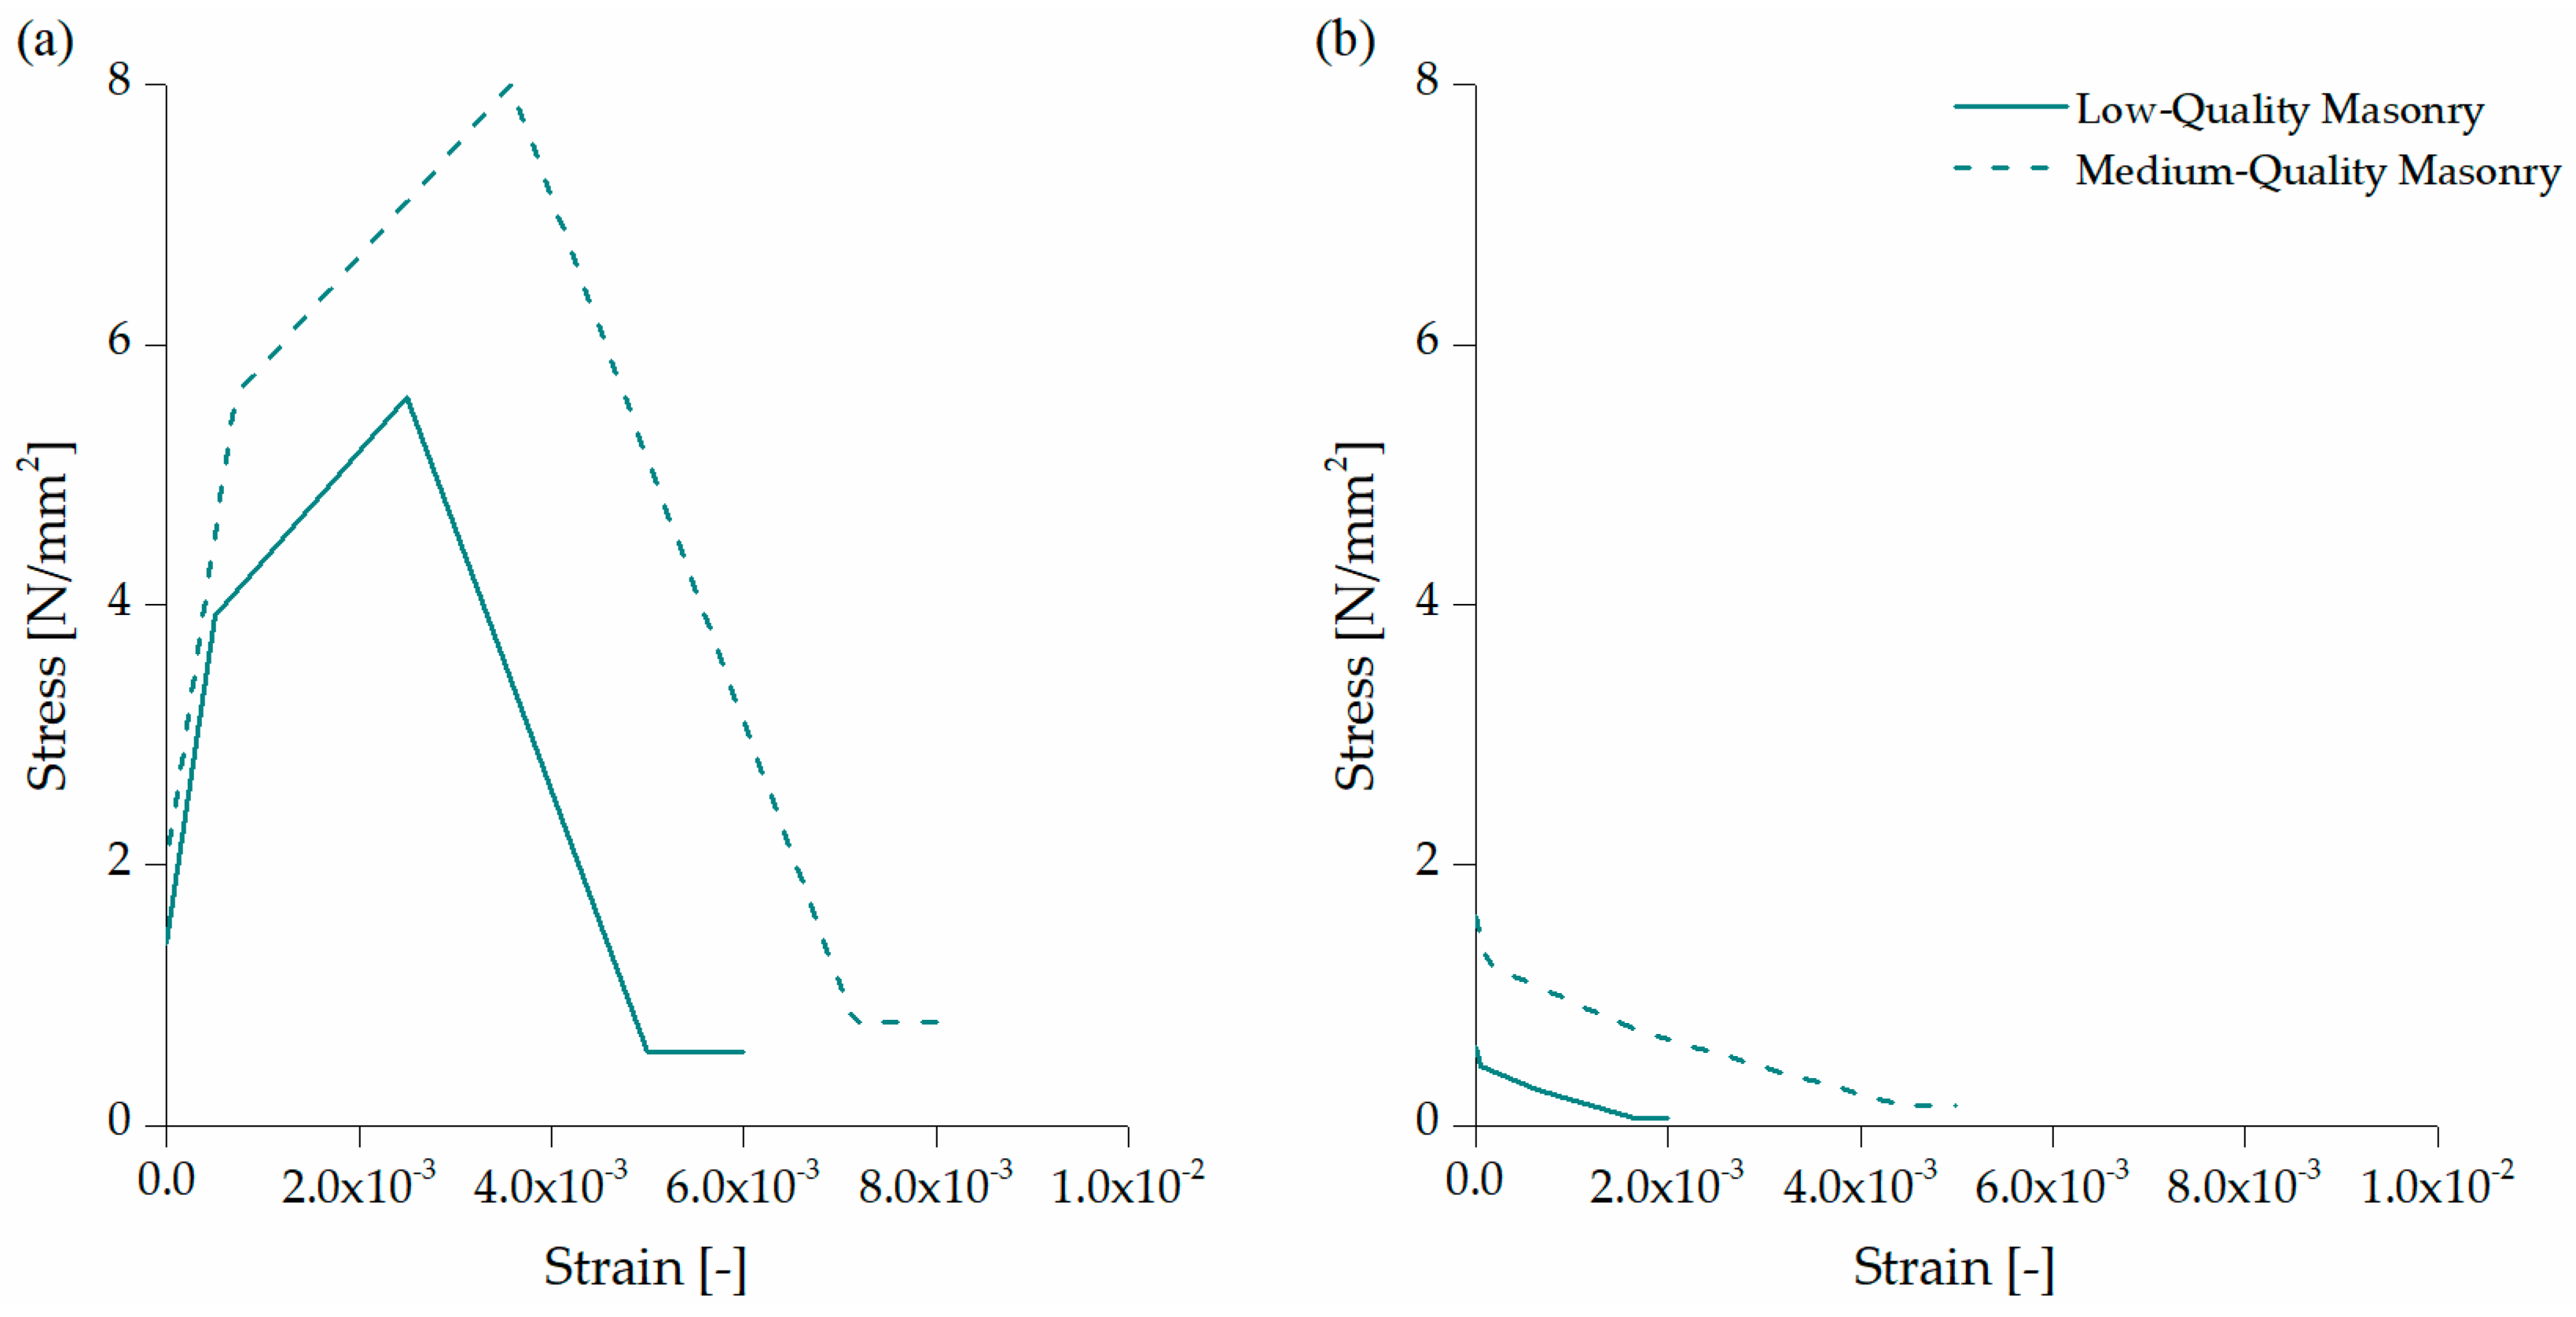
In the CM, three materials are defined: one for the complex and tower, one for the bell cell, and the last for the roof. There was evidence in observing the structure and the cracks’ pattern that the quality of the masonry was good in the Podestà Palace and annex, and also in the tower body, although this latter presented an inner core. For these reasons, the ‘Medium-quality masonry properties’ (see Table 1) is assigned. However, the bell cell, due to its exposition to the atmospheric agents, showed a mechanical reduction in the mortar in the joints, which is simulated by lowering its nonlinear parameters (“Low-quality masonry properties” in Table 1). Finally, the roof is modeled with the elastic parameters of the concrete, considering it in the analysis as over-resistant and, therefore, avoiding the post-elastic behavior characterization. The mono-axial tensile and compressive laws are shown in Figure 7. The yield surface parameters employed are presented in Table 1.
On the other hand, in the discrete model, all the complex is assigned with the density of the cut stone, 2200 kg/m3, except for the inner core and the roof. The inner core was given a density of 1900 kg/m3, while the roof was assigned a density of 2500 kg/m3, equal to concrete. The joints’ friction was specified as follows: 0.9 between the blocks and the ground; then, the value of 0.3 is applied both between the inner core stones of the tower and at the contact surface of the inner core and the external layers of the tower (including the blocks crossing the entire wall’s thickness). Finally, the value of 0.5 is used between the remaining blocks. Those values were chosen based on previous studies [35,36,37].
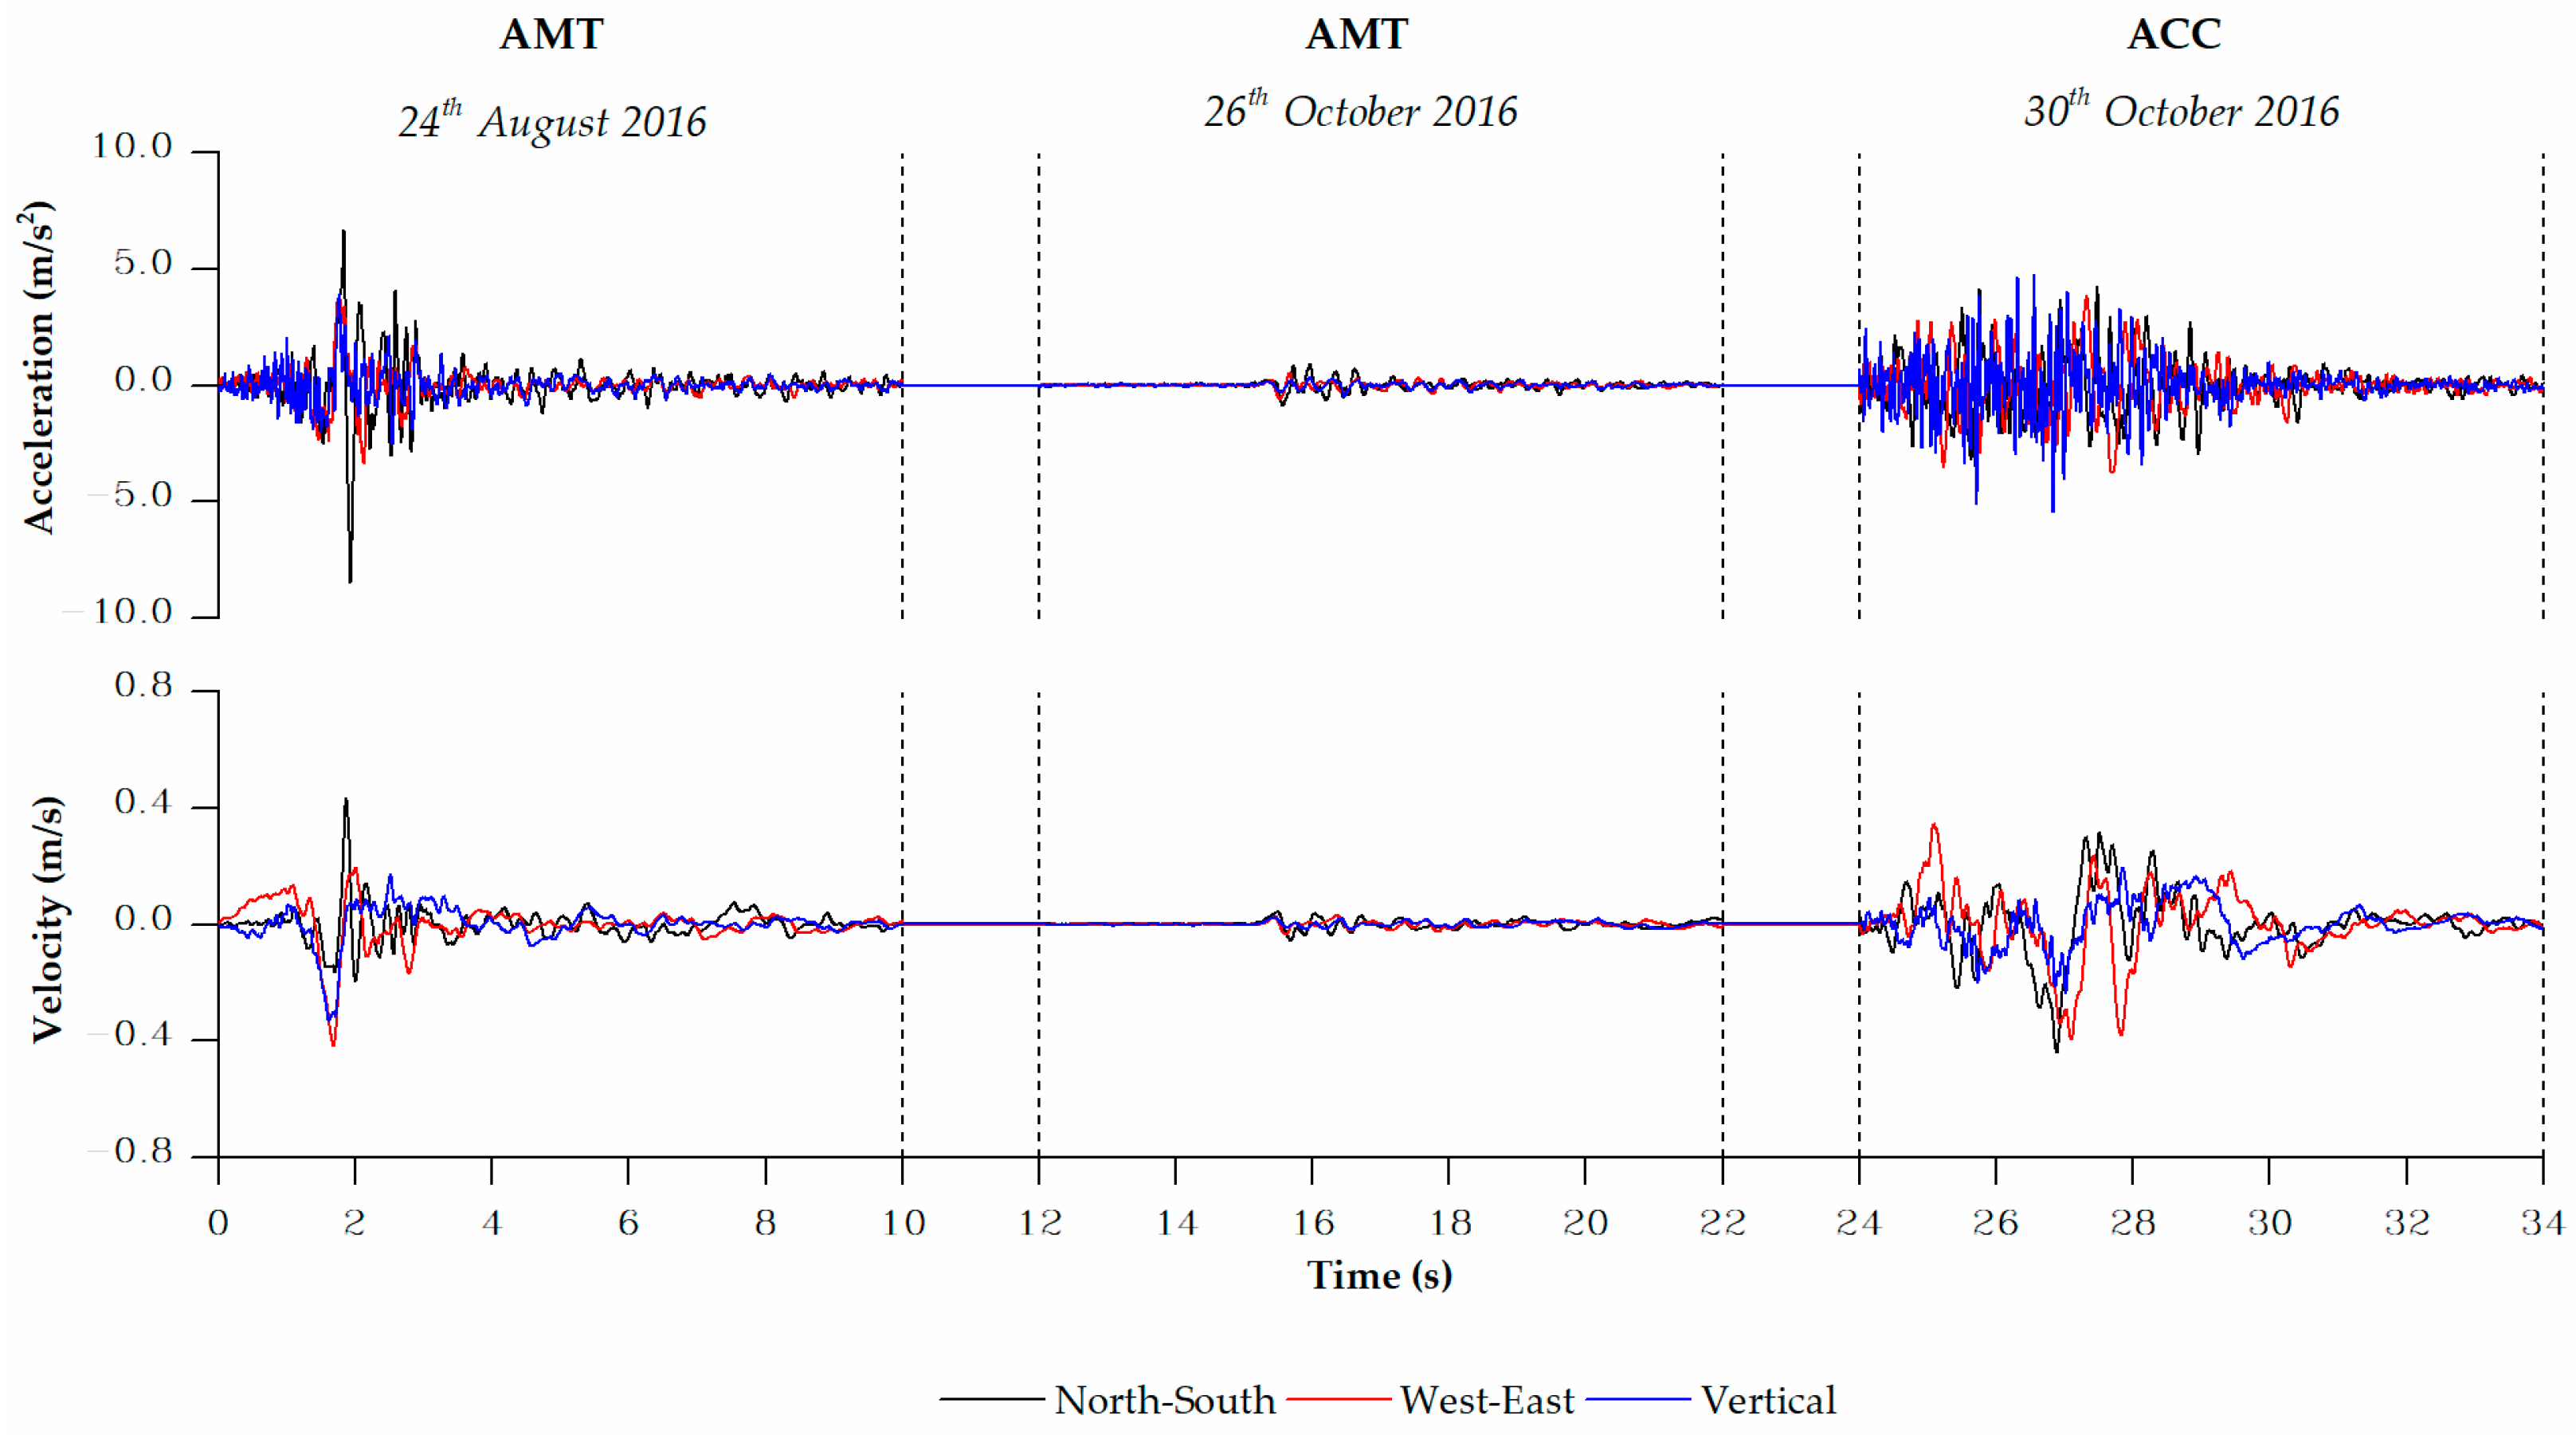
The CM and DM underwent nonlinear dynamic analyses to assess the complex’s response during the Central Italy seismic sequence. The three main shocks that occurred on 24 August, 26 October, and 30 October 2016 were considered. The station of Amatrice (AMT), nearby Accumoli village, was selected only for the first two shocks, since, in the Accumoli station (ACC), the quality of the recordings is good enough only for the last shock considered. The accelerations and velocities recorded were applied at the CM and DM foundations, respectively.
Table 2 lists the main characteristics of these earthquakes. Class EC8 indicates the type of ground on which the earthquake was recorded; Rjb is the Joyner–Boore distance or, rather, the smallest spacing between the rupture site and the rupture surface projection; Rrup is the shortest distance between the rupture site and the rupture surface; and Repi is the distance calculated by the geometric swap.
To expedite the computation, only 10 s of each earthquake’s strong motion were considered. These were applied in a series, every two seconds of rest, for a total time of 34 s (Figure 8). All three directions were considered. A load step of 0.005 s was set to perform the analysis. As regards the damping, in the CM model, it was determined using the Rayleigh method considering the 1st and 77th modes and a damping of 3% [23]. The 77th mode was selected so that, in the X and Y directions, the participation mass reached a value of 85%. The DM model neglected the damping effects, which are crucial to the continuum model, and the dissipated energy was related to the contribution of friction.

3. Results

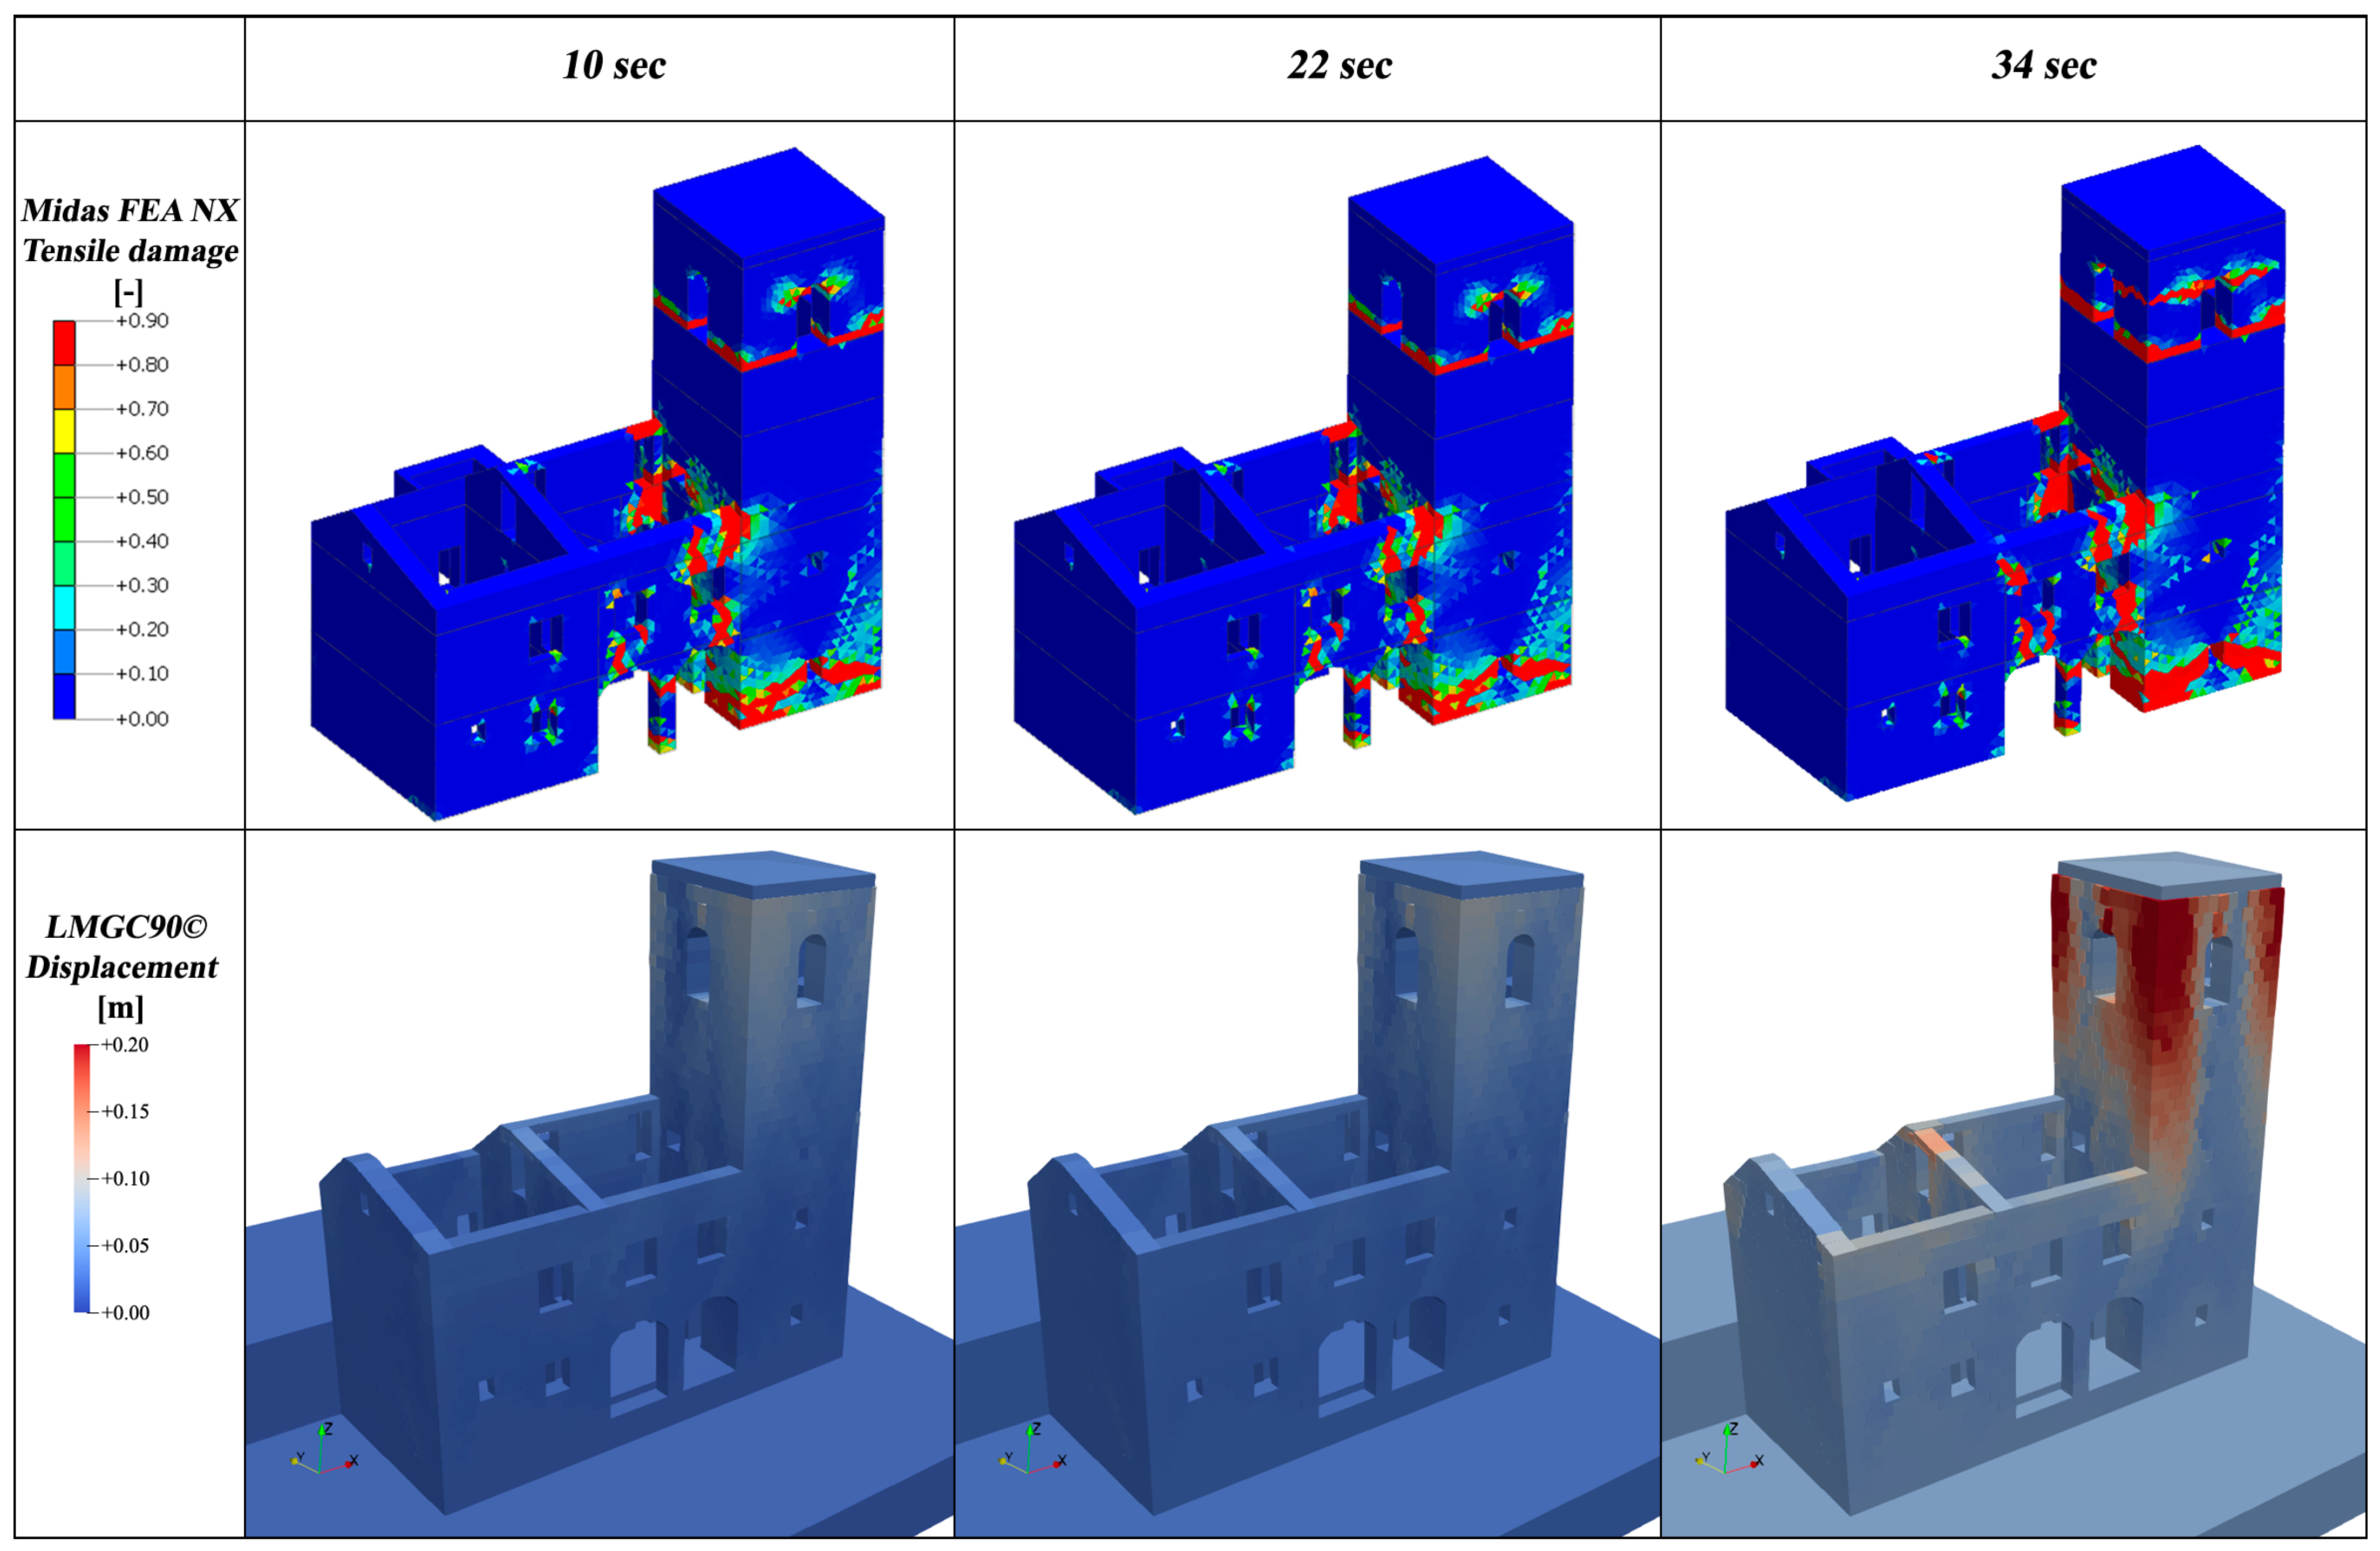
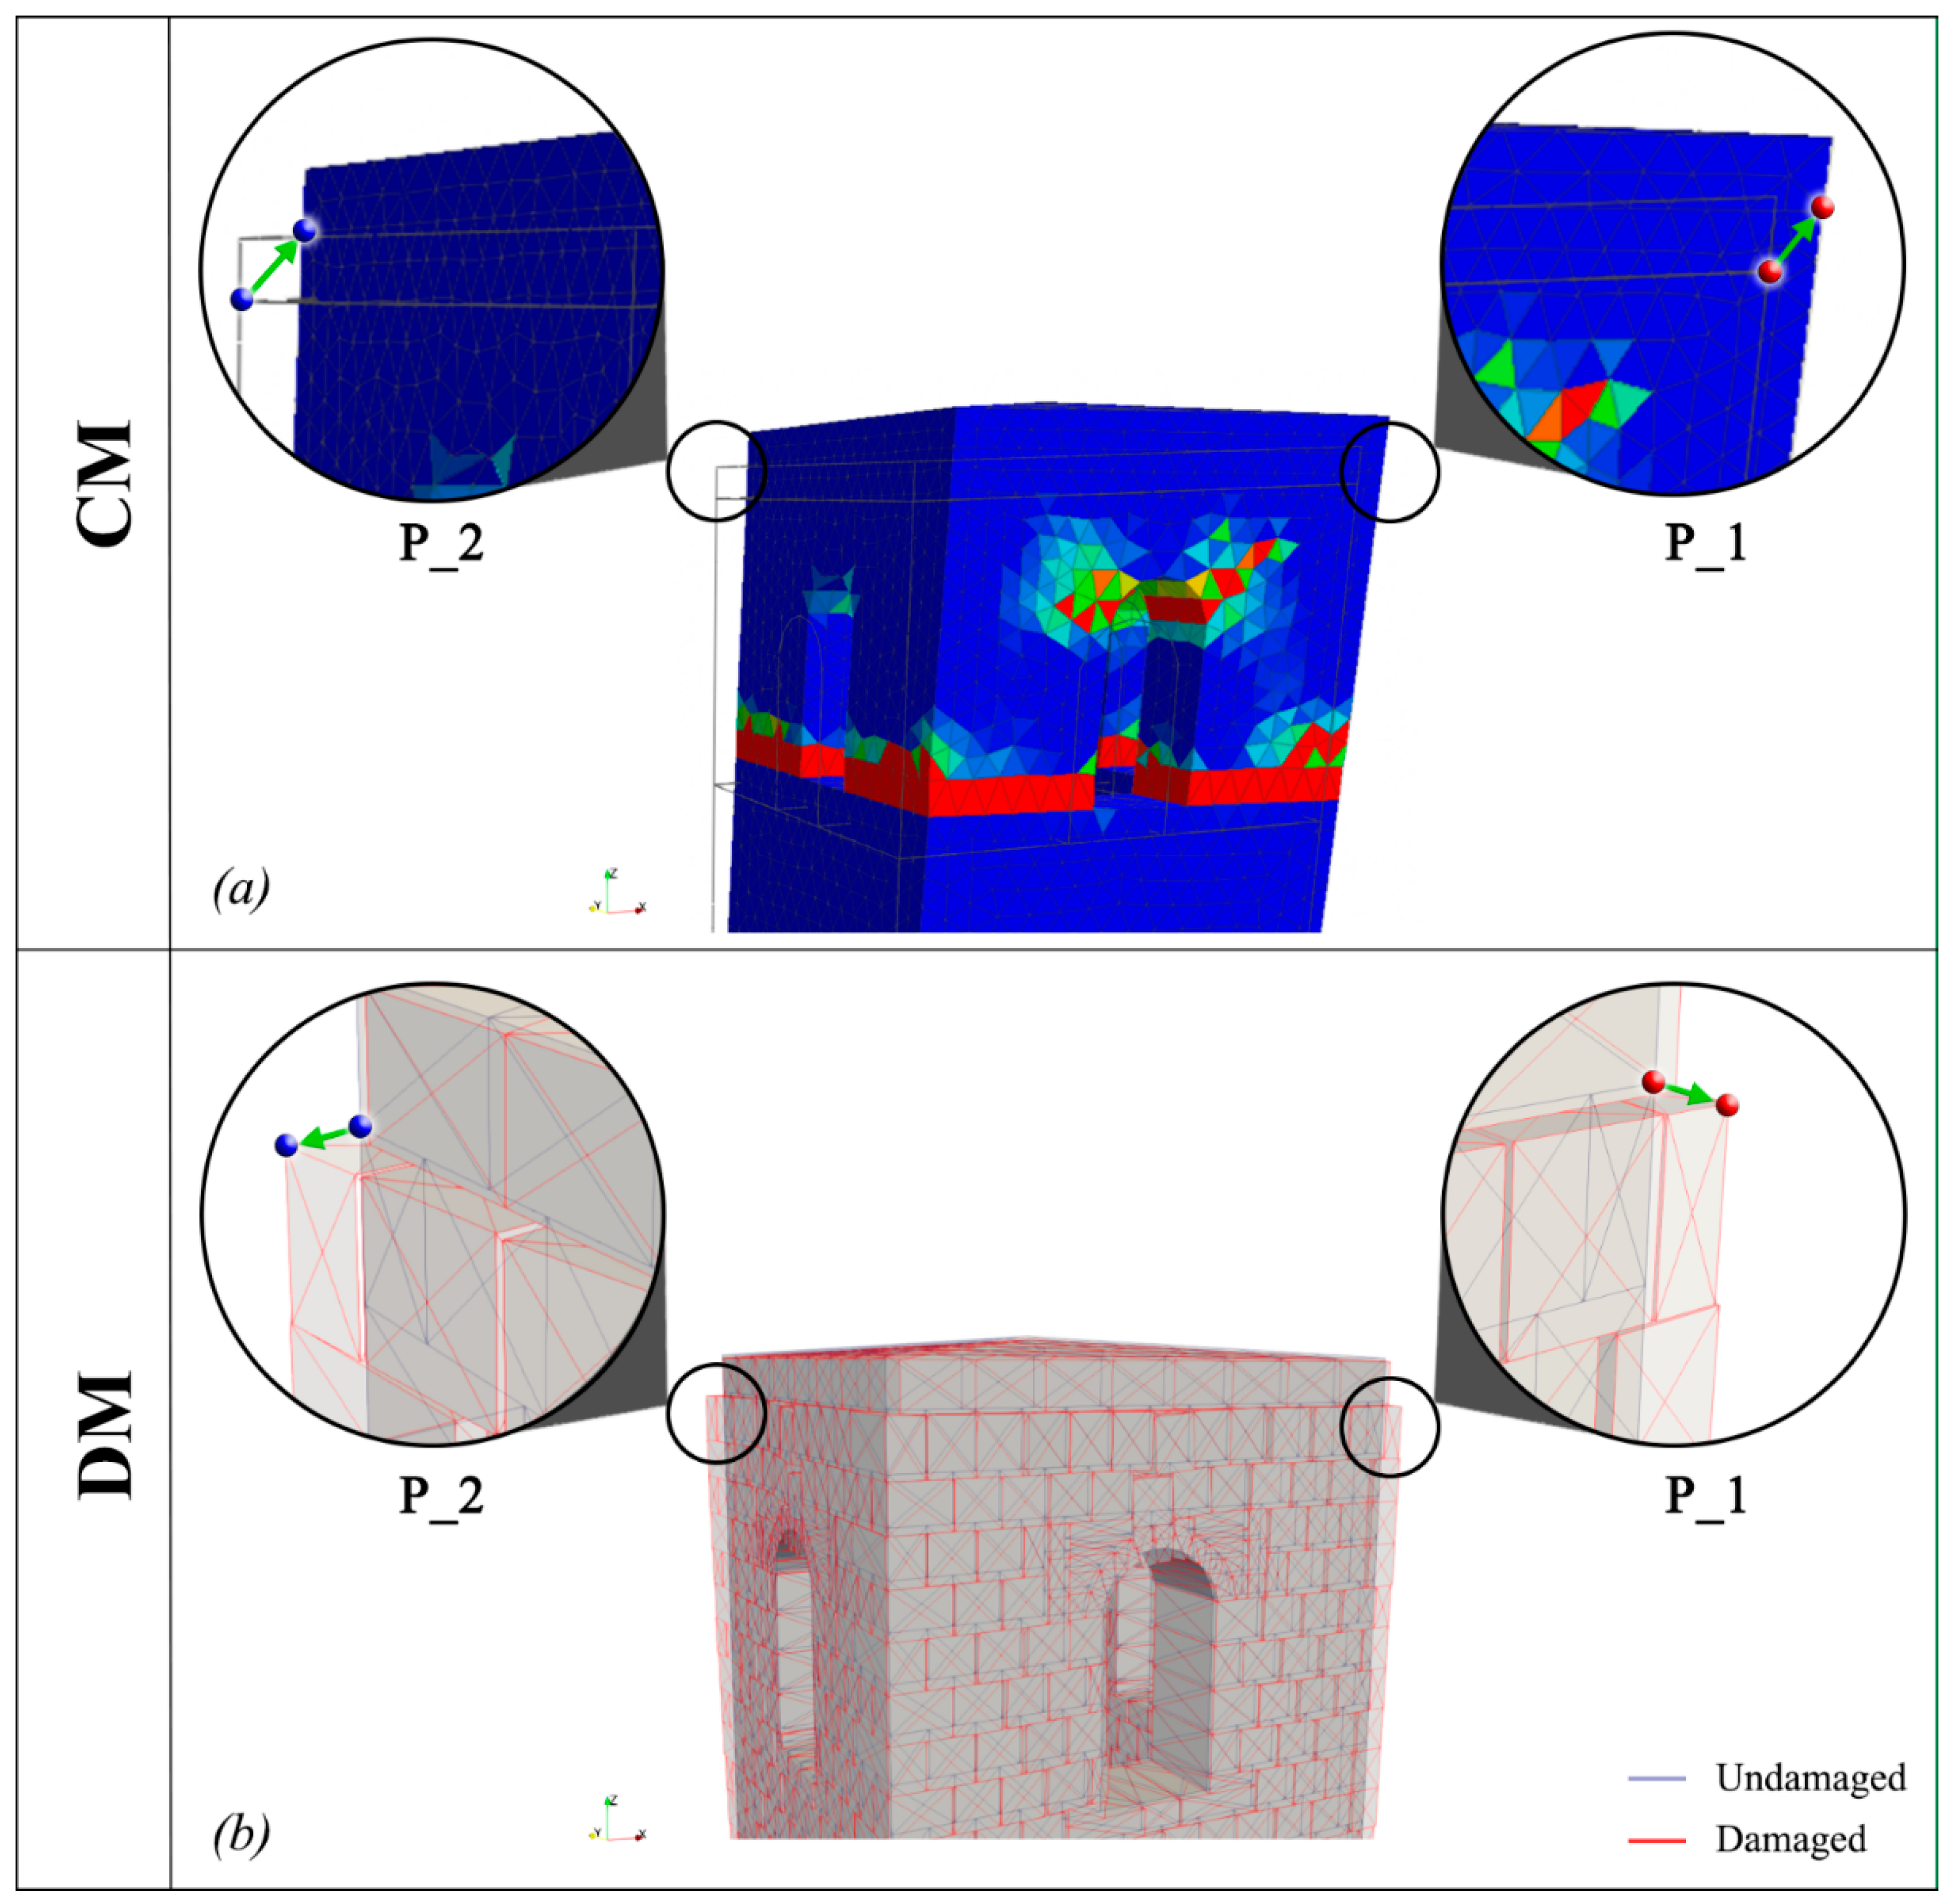
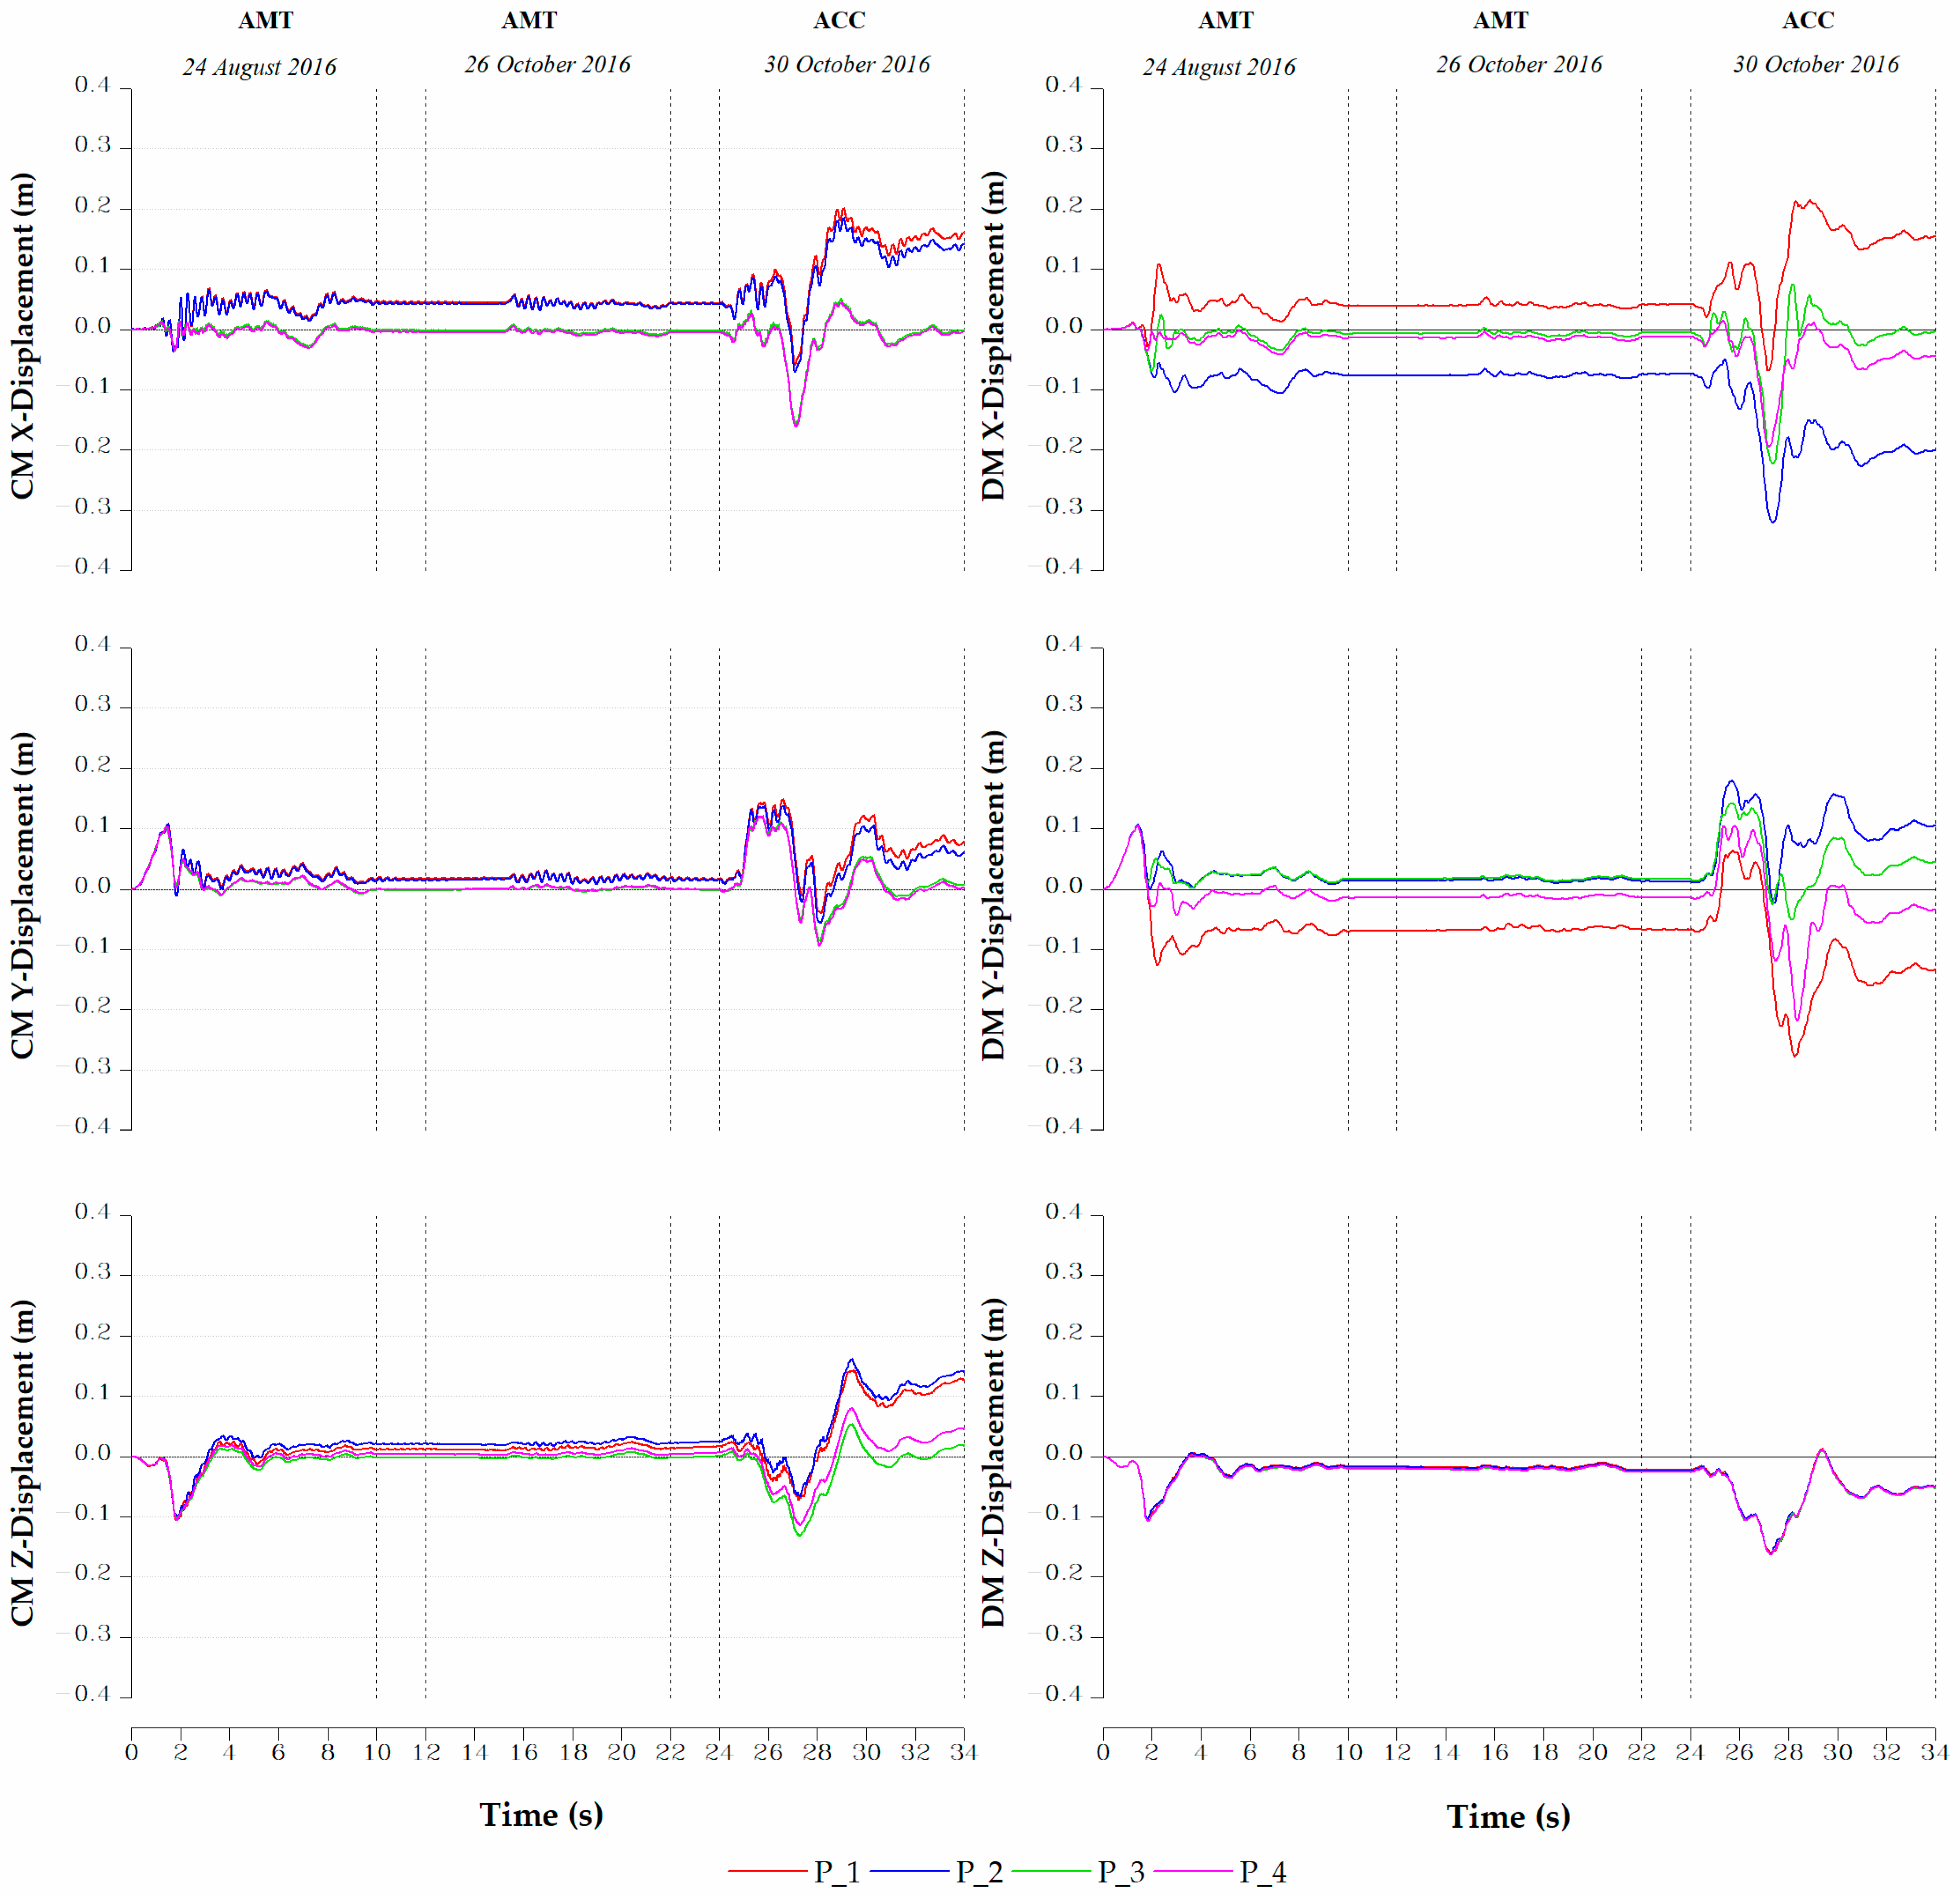
The numerical models’ results are compared in terms of damage (Figure 9 and Figure 10) and displacements (Figure 11). For this purpose, four control points along the external roof’s perimeter were considered: two on the tower (P_1 and P_2) and two on the palace (P_3 and P_4), as shown in Figure 6.
The largest plastic deformations at the end of the analyses are labeled as P_1 and P_2 in the X-direction for both the CM (Figure 9 and Figure 10a,b) and DM (Figure 9 and Figure 10c,d). In the CM, these points measure 0.15 m and 0.14 m, respectively. In the DM, they can reach the values of 0.16 m and −0.21 m. They also show considerable cumulative displacements in the Y-direction, achieving values like those detected in the X-direction. Comparing the displacements’ time histories between CM and DM, although their values calculated in different control points are similar, the two approaches do not provide an identical representation of the masonry behavior. In contrast to the CM, wherein all the points go in the same direction, the DM allows them to move in opposite directions. That difference could be highlighted by the comparison of the damage plots. The CM at the end of the sequence displays horizontal cracks between the arched windows and the bell cell corners. On the other hand, in the DM, the four corners of the tower show the largest displacements, indicating that the tower’s walls are opening. Indeed, the joints’ slide identifies masonry wedges that start at the end of the tower’s connection with the palace and widen in the roof direction. From the overlapping of the numerical and the real cracks pattern of the tower (Figure 12), it is clear how the DM outcomes are closer to reality than the CM, highlighting the prevalence of the walls’ out-of-plane behavior over the in-plane one.
The time-histories displacements in the Z-direction indicate that, at the simulation ending phase, all the upper points report positive values on the CM and negative values on the DM. The main reason for this difference can be linked, in the last case, to the joints’ sliding that tilts the blocks, slightly lowering the reference points. However, their raising could be observed in the CM, owing to the plastic deformation. Therefore, these results could not be comparable (Figure 10).
The points under investigation on the Podestà Palace (P_3 and P_4) show lower cumulative displacements than those allocated on the tower; in the CM, they are close to zero, whereas, in the DM, they are within a range of ±0.04 m. In contrast to what was observed in the tower, the numerical cracks in the palace obtained with the CM and the DM are equivalent. They are mostly vertical and positioned near the palace’s entrance openings (Figure 12).
Finally, the analyses carried out led to the damage evolution. The displacements time histories reveal that the structure reported irreparable injuries during the quake of 24 August, which increased after the occurrence of the last event, unlike the earthquake registered on 26 October, which, given its moderate intensity, left the complex’s condition unaltered. By calculating the relative displacements following each event, it can be determined that the third earthquake damaged the structure much more than the first one. Considering P_1, its relative displacement is 0.12 m and 0.04 m in the X-direction for both models.

4. Conclusions

The paper presented the assessment of the structural response of an iconic complex severely damaged by the Central Italy earthquake that occurred in 2016–2017. The structure is located in Accumoli village, one of the epicenters of the seismic sequence that stroked the Apennine area. The village is destroyed, and only the complex analyzed is still standing thanks to the immediate securing of the firefighters following the second quake. This building is important for its historical value, being the oldest in the town, but also for its symbolic value, having been the town hall.
Its behavior under earthquakes was studied using two different approaches to assess the masonry response: a continuous (CM) and discontinuous (DM) model. In the first one, a homogenization between the bricks and mortar characteristics was considered. In the second one, each block was reported separately, and the mortar characteristics were considered with interaction laws. The masonry nonlinearity was simulated in the CM using the concrete damage plasticity (CDP) model and, in the DM, with the non-smooth contact dynamic (NSCD) method.
To analyze the structural response, the models underwent nonlinear dynamic analysis, applying in series the three main shocks of the seismic swarm. The comparison between the displacements of different points considered was similar according to these two approaches. However, the comparison between the numerical and the real damage highlights that both the models may reproduce the cracks that occurred in the palace, but only the discontinuous is able to replicate the tower response. Indeed, the continuous is formulated to work well when the masonry texture turns out to be not the main parameter that governs the response. In the old towers, this is not always true, as the heterogeneity of the masonry and the unclear interaction with the palace bring us to consider the discretization as bad with a continuous approach. In the absence of regular masonry, as typically happens along the Apennine area of Italy, the discrete models provide more consistent results with respect to the observed damage, as the block–block interaction is fundamental [16,36,37].
Finally, it is important to underline an aspect that needs more investigation, namely the palace–tower interaction. The cracks shown by both the numerical models are more severe than they appeared in real life; to this end, it might be interesting to elaborate additional models in which the building presents different degrees of connection with the tower, e.g., the connection of the external or internal layer only.

Author Contributions

Conceptualization, F.C.; methodology, F.C., M.S., E.G. and F.R.; software, M.S. and E.G.; validation, F.C., M.S., E.G. and F.R.; formal analysis M.S. and E.G.; investigation, M.S. and E.G.; data curation, M.S. and E.G.; writing—original draft preparation, M.S. and E.G.; writing—review and editing, F.C. and F.R.; supervision, F.C. and F.R. All authors have read and agreed to the published version of the manuscript.

Funding

This research received no external funding.

Institutional Review Board Statement

Not applicable.

Informed Consent Statement

Not applicable.

Data Availability Statement

Not applicable.

Acknowledgments

The authors express their gratitude to the Italian Ministry of University (Italy) for the support under the program “Dipartimento di Eccellenza” of the Department of Civil and Building Engineering, and Architecture—Polytechnic University of Marche (Ancona, Italy).

Conflicts of Interest

The authors declare no conflict of interest.

References

  1. Sorrentino, L.; Cattari, S.; da Porto, F.; Magenes, G.; Penna, A. Seismic behaviour of ordinary masonry buildings during the 2016 central Italy earthquakes. Bull. Earthq. Eng. 2019, 17, 5583–5607. [Google Scholar] [CrossRef] [Green Version]
  2. Lagomarsino, S.; Penna, A.; Galasco, A.; Cattari, S. TREMURI program: An equivalent frame model for the nonlinear seismic analysis of masonry buildings. Eng. Struct. 2013, 56, 1787–1799. [Google Scholar] [CrossRef]
  3. Milani, G. Lesson learned after the Emilia-Romagna, Italy, 20-29 May 2012 earthquakes: A limit analysis insight on three masonry churches. Eng. Fail. Anal. 2013, 34, 761–778. [Google Scholar] [CrossRef]
  4. Mallardo, V.; Malvezzi, R.; Milani, E.; Milani, G. Seismic vulnerability of historical masonry buildings: A case study in Ferrara. Eng. Struct. 2008, 30, 2223–2241. [Google Scholar] [CrossRef]
  5. Malena, M.; Angelillo, M.; Fortunato, A.; de Felice, G.; Mascolo, I. Arch bridges subject to pier settlements: Continuous vs. piecewise rigid displacement methods. Meccanica 2021, 56, 2487–2505. [Google Scholar] [CrossRef]
  6. García-Macías, E.; Ubertini, F. Seismic interferometry for earthquake-induced damage identification in historic masonry towers. Mech. Syst. Signal Process. 2019, 132, 380–404. [Google Scholar] [CrossRef]
  7. Cavalagli, N.; Comanducci, G.; Ubertini, F. Earthquake-Induced Damage Detection in a Monumental Masonry Bell-Tower Using Long-Term Dynamic Monitoring Data. J. Earthq. Eng. 2018, 22, 96–119. [Google Scholar] [CrossRef]
  8. Bartoli, G.; Betti, M.; Vignoli, A. A numerical study on seismic risk assessment of historic masonry towers: A case study in San Gimignano. Bull. Earthq. Eng. 2016, 14, 1475–1518. [Google Scholar] [CrossRef]
  9. Clementi, F.; Milani, G.; Ferrante, A.; Valente, M.; Lenci, S. Crumbling of Amatrice clock tower during 2016 Central Italy seismic sequence: Advanced numerical insights. Frat. Integrità Strutt. 2019, 14, 313–335. [Google Scholar] [CrossRef] [Green Version]
  10. Ferrante, A.; Schiavoni, M.; Bianconi, F.; Milani, G.; Clementi, F. Influence of Stereotomy on Discrete Approaches Applied to an Ancient Church in Muccia, Italy. J. Eng. Mech. 2021, 147, 04021103. [Google Scholar] [CrossRef]
  11. Standoli, G.; Salachoris, G.P.; Masciotta, M.G.; Clementi, F. Modal-based FE model updating via genetic algorithms: Exploiting artificial intelligence to build realistic numerical models of historical structures. Constr. Build. Mater. 2021, 303, 124393. [Google Scholar] [CrossRef]
  12. D’Altri, A.M.; Sarhosis, V.; Milani, G.; Rots, J.; Cattari, S.; Lagomarsino, S.; Sacco, E.; Tralli, A.; Castellazzi, G.; de Miranda, S. Modeling Strategies for the Computational Analysis of Unreinforced Masonry Structures: Review and Classification. Arch. Comput. Methods Eng. 2020, 27, 1153–1185. [Google Scholar] [CrossRef]
  13. Lemos, J.V. Discrete Element Modeling of Masonry Structures. Int. J. Archit. Herit. 2007, 1, 190–213. [Google Scholar] [CrossRef]
  14. Sandoval, C.; Arnau, O. Experimental characterization and detailed micro-modeling of multi-perforated clay brick masonry structural response. Mater. Struct. 2017, 50, 34. [Google Scholar] [CrossRef]
  15. Calderón, S.; Sandoval, C.; Arnau, O. Shear response of partially-grouted reinforced masonry walls with a central opening: Testing and detailed micro-modelling. Mater. Des. 2017, 118, 122–137. [Google Scholar] [CrossRef]
  16. Ferrante, A.; Loverdos, D.; Clementi, F.; Milani, G.; Formisano, A.; Lenci, S.; Sarhosis, V. Discontinuous approaches for nonlinear dynamic analyses of an ancient masonry tower. Eng. Struct. 2021, 230, 111626. [Google Scholar] [CrossRef]
  17. Lourenço, P.B.; Rots, J.G. Multisurface Interface Model for Analysis of Masonry Structures. J. Eng. Mech. 1997, 123, 660–668. [Google Scholar] [CrossRef]
  18. Lourenço, P.B. Recent advances in masonry modelling: Micromodelling and homogenisation. In Multiscale Modeling in Solid Mechanics: Computational Approaches; Imperial College Press: London, UK, 2009; pp. 251–294. [Google Scholar]
  19. Bagnéris, M.; Cherblanc, F.; Bromblet, P.; Gattet, E.; Gügi, L.; Nony, N.; Mercurio, V.; Pamart, A. A complete methodology for the mechanical diagnosis of statue provided by innovative uses of 3D model. Application to the imperial marble statue of Alba-la-Romaine (France). J. Cult. Herit. 2017, 28, 109–116. [Google Scholar] [CrossRef] [Green Version]
  20. Reccia, E.; Cazzani, A.; Cecchi, A. FEM-DEM Modeling for Out-of-plane Loaded Masonry Panels: A Limit Analysis Approach. Open Civ. Eng. J. 2012, 6, 231–238. [Google Scholar] [CrossRef] [Green Version]
  21. Giordano, E.; Clementi, F.; Nespeca, A.; Lenci, S. Damage Assessment by Numerical Modeling of Sant’Agostino’s Sanctuary in Offida During the Central Italy 2016–2017 Seismic Sequence. Front. Built Environ. 2019, 4. [Google Scholar] [CrossRef]
  22. Facchini, L.; Betti, M.; Corazzi, R.; Kovacevic, V.C. Nonlinear seismic behavior of historical masonry towers by means of different numerical models. Procedia Eng. 2017, 199, 601–606. [Google Scholar] [CrossRef]
  23. Illampas, R.; Ioannou, I.; Lourenço, P.B. Seismic appraisal of heritage ruins: The case study of the St. Mary of Carmel church in Cyprus. Eng. Struct. 2020, 224, 111209. [Google Scholar] [CrossRef]
  24. Valente, M.; Milani, G. Seismic assessment of historical masonry structures through advanced nonlinear dynamic simulations: Applications to castles, churches, and palaces. In Numerical Modeling of Masonry and Historical Structures; Elsevier: Amsterdam, The Netherlands, 2019; pp. 163–200. [Google Scholar]
  25. Malena, M.; de Felice, G.; Marfia, S. AnMas: Anisotropic strength domain for masonry. Eng. Struct. 2022, 257, 114050. [Google Scholar] [CrossRef]
  26. Salachoris, G.P.; Magagnini, E.; Clementi, F. Mechanical characterization of “Scaglia Rossa” stone masonry through experimental and numerical analyses. Constr. Build. Mater. 2021, 303, 124572. [Google Scholar] [CrossRef]
  27. Valente, M.; Milani, G. Non-linear dynamic and static analyses on eight historical masonry towers in the North-East of Italy. Eng. Struct. 2016, 114, 241–270. [Google Scholar] [CrossRef]
  28. Ministero delle Infrastrutture e dei Trasporti Aggiornamento delle “Norme Tecniche per le Costruzioni”–NTC 2018; Gazzetta Ufficiale: Rome, Italy, 2018; pp. 1–198. (In Italian)
  29. Ministero delle Infrastrutture e dei Trasporti Circolare 21 Gennaio 2019 n. 7 C.S.LL.PP. In Istruzioni per L’applicazione Dell’aggiornamento delle “Norme Tecniche per le Costruzioni” di cui al D.M. 17/01/2018. Suppl. ord. alla G.U. n. 35 del 11/2/19; Gazzetta Ufficiale: Rome, Italy, 2019; pp. 1–338. (In Italian)
  30. Midas FEA NX Analysis Reference 2020. Available online: https://www.midasoft.com/ (accessed on 6 January 2023).
  31. Chetouane, B.; Dubois, F.; Vinches, M.; Bohatier, C. NSCD discrete element method for modelling masonry structures. Int. J. Numer. Methods Eng. 2005, 64, 65–94. [Google Scholar] [CrossRef] [Green Version]
  32. Dubois, F.; Acary, V.; Jean, M. The Contact Dynamics method: A nonsmooth story. Comptes Rendus Mécanique 2018, 346, 247–262. [Google Scholar] [CrossRef]
  33. Lubliner, J.; Oliver, J.; Oller, S.; Oñate, E. A plastic-damage model for concrete. Int. J. Solids Struct. 1989, 25, 299–326. [Google Scholar] [CrossRef]
  34. Lee, J.; Fenves, G.L. Plastic-Damage Model for Cyclic Loading of Concrete Structures. J. Eng. Mech. 1998, 124, 892–900. [Google Scholar] [CrossRef]
  35. Vasconcelos, G.; Lourenço, P.B. Experimental characterization of stone masonry in shear and compression. Constr. Build. Mater. 2009, 23, 3337–3345. [Google Scholar] [CrossRef]
  36. Ferrante, A.; Clementi, F.; Milani, G. Dynamic Behavior of an Inclined Existing Masonry Tower in Italy. Front. Built Environ. 2019, 5. [Google Scholar] [CrossRef]
  37. Ferrante, A.; Clementi, F.; Milani, G. Advanced numerical analyses by the Non-Smooth Contact Dynamics method of an ancient masonry bell tower. Math. Methods Appl. Sci. 2020, 43, 7706–7725. [Google Scholar] [CrossRef]
  38. Luzi, L.; Hailemikael, S.; Bindi, D.; Pacor, F.; Mele, F.; Sabetta, F. ITACA (ITalian ACcelerometric Archive): A Web Portal for the Dissemination of Italian Strong-motion Data. Seismol. Res. Lett. 2008, 79, 716–722. [Google Scholar] [CrossRef]
Figure 1. The Accumoli village (Central Italy).
Applsci 13 00972 g001
Figure 2. Ground (a) and first (b) floor layouts, and the south (c), west (d), east (e), and north (f) façades, respectively. (All the dimensions are expressed in meters)
Applsci 13 00972 g002
Figure 3. Damage suffered by the structure following the Central Italy Earthquakes. Bell cell (a) south-east, (b) north, (c) west façade, and (d) Podestà Palace south façade.
Applsci 13 00972 g003
Figure 4. Inelastic mono axial curve in compression (a) and tension (b), and yield surface in the Westergaard space (c).
Applsci 13 00972 g004
Figure 5. Bodies in possible contact in a plane (a), the Signorini’s (b) and dry-friction Coulomb’s (c) laws.
Applsci 13 00972 g005
Figure 6. Comparison between CM (a) and DM (b) with zooms on the civic tower and a cross vault. In the DM, the inner core stones are reported in yellow (colors in the online version). On the 3D views of the structure, the control points considered to plot the results are reported.
Applsci 13 00972 g006
Figure 7. CDP constitutive laws defined in compression (a) and tension (b).
Applsci 13 00972 g007
Figure 8. Acceleration and velocity time histories applied to CM and DM, respectively, in order to represent the effect of a seismic sequence.
Applsci 13 00972 g008
Figure 9. Damage at the end of each event in the CM (Midas FEA NX©) and DM (LMGC90©).
Applsci 13 00972 g009
Figure 10. Differences between the undamaged and damaged states of CM (a) and DM (b) in the bell cell.
Applsci 13 00972 g010
Figure 11. Displacements’ time histories of the four control points obtained with CM and DM.
Applsci 13 00972 g011
Figure 12. Comparison of the actual cracks and the numerical damage, obtained with CM and DM. (a) Bell tower north façade; (b) bell tower west façade; (c) bell tower south-east corner; (d) Podestà Palace south façade.
Applsci 13 00972 g012
Table 1. Materials’ parameters used in the continuous and the discontinuous model.
Medium-Quality Masonry PropertiesLow-Quality Masonry PropertiesConcrete
Young’s Module (MPa)280031,500
Poisson’s module (−)0.250.3
Mass (kN/m3)2225
Strength in compression (MPa)8.05.6-
Strength in tension (MPa)1.60.46-
Parameters to define the CDP Yield surface
Dilatation angle, ψ 10°-
Correction parameter, k c 0.666-
Eccentricity, ε e c c e n 0.1-
Biaxial strength ratio, f b 0 / f c 0 1.16-
Viscosity 0.01-
Non-Smooth Contact Dynamic Method
Friction masonry structure 0.50
Friction inner core0.30
Table 2. The main characteristics of the three quakes considered [38].
Seismic EventMLDepth (km)StationClass EC8Rjb
(km)
Rrup
(km)
Repi
(km)
N-S
PGA (m/s2)
E-W
PGA (m/s2)
Z
PGA (m/s2)
24 August 20166.08.1AMTB *1.384.628.503.68−8.513.91
26 October 20165.97.5AMTB *25.926.133.30−0.590.910.49
30 October 20166.19.2ACCA *2.25.718.60−3.954.34−5.47
*: that site classification is not based on a direct Vs, 30 measurement.
Disclaimer/Publisher’s Note: The statements, opinions and data contained in all publications are solely those of the individual author(s) and contributor(s) and not of MDPI and/or the editor(s). MDPI and/or the editor(s) disclaim responsibility for any injury to people or property resulting from any ideas, methods, instructions or products referred to in the content.