Abstract
In this work, we propose a deep-learning-based mapping model for simulating and predicting the flow field of Reynolds-averaged Navier–Stokes (RANS) and large eddy simulation (LES) of propellers. The model employs image processing and computer vision methods to process the two-dimensional propeller RANS and LES simulation data. First, images are obtained by simulating the flow fields with the location data used to acquire a set of features specific to the corresponding positions. Second, the regression models for the flow fields and the mapping between the two different flow fields are established to predict the LES flow field at that position. Specifically, we utilize a deep convolutional neural network (CNN) for feature extraction from the flow field, which is then integrated with a nonlinear module for the purposes of regression and mapping. The effectiveness and accuracy of the proposed model in flow field prediction are demonstrated by its application to propeller RANS and LES simulations. It is shown that the overall error rate between the LES flow field predictions generated using this method and actual flow field data is 7.92%. Additionally, we also evaluate the model’s generalization ability, stability, and robustness by testing it on the data of propeller flow fields at different Reynolds numbers. The results verify the applicability of the proposed model in various problems of flow field simulation and prediction.
1. Introduction
The turbulence problem encompasses various engineering fields, so that finding a solution for this problem is of great significance in these fields. During the past decades, researchers have continuously conducted exploration and research of turbulence. The concept of rapid distortion of a fluid [1,2] and the proposition of different scaling rates and the demonstration of turbulent boundary layers [3] have given us a better understanding of turbulent flow. With the advancement of computer technologies and the implementation of particle image velocimetry (PIV), research on turbulence has become increasingly profound and detailed. While previous efforts have deepened our comprehension of turbulent flow, the fundamental issues related to turbulent flow [4], and its effective application in engineering remain unaddressed. Turbulent flow is still a significant hurdle for success in the engineering of aviation, aerospace and navigation. The essence of turbulent flow, the physical laws governing its evolution, and optimal utilization in engineering have always been important research topics attracting the attention of researchers.
Numerical computation methods for turbulence flow can be categorized into direct numerical simulation (DNS), large eddy simulation (LES), and Reynolds-averaged Navier–Stokes (RANS) based on grid resolution scales. With improvement in computer performance and the development of parallel computing, DNS and LES have been increasingly utilized both in research and engineering. However, for complex geometries and flows with a high Reynolds number, the substantial increase in grid size severely limits the applicability of these methods. In contrast, although the accuracy of the RANS model is inferior to the former two methods, its user-friendly nature and high efficiency have made it widely adopted in engineering practice [5]. Particularly in the aerospace domain, where the Reynolds numbers of flows are generally high, turbulence computation mainly depends on existing RANS models.
Reynolds-averaged numerical simulation (RANS) is the most extensively employed turbulence numerical simulation method in engineering. Most of the RANS models are based on the assumption of eddy viscosity, which yields satisfactory results for attached flows. However, in the case of complex flows such as separated flow, the relationship between Reynolds stress and strain is no longer that of a simple linear correlation. The anisotropy of turbulent flow makes turbulence modeling significantly challenging [6], and consequently, the calculation results of the RANS model often exhibit significant deviations from the actual flows. In addition, empirical parameters in the model are often determined based on some specific flows, which increases the model’s uncertainty and subsequently affects its applicability.
Large eddy simulation (LES) is a turbulence numerical simulation method that lies between direct numerical simulation (DNS) and Reynolds-averaged numerical simulation (RANS). It filters the Navier–Stokes equations, dividing the flow field into large-scale and small-scale components. LES directly simulates the large-scale eddies, while a sub-grid-scale model is used to model and solve the small-scale components. However, on the near-wall surface, since there is no inertial sub-region, the number of grids for LES near the wall surface is always required to reach the fineness of DNS. This also leads to a large consumption of computing resources for LES simulation, which limits its application in engineering applications, especially engineering computation for flows with complex shapes. Therefore, many researchers have attempted to integrate RANS and LES models to establish complex system models to reduce computational costs while achieving accurate simulation results.
In fact, there are two main types of approaches to establishing complex system models. The first one is based on the framework of theoretical models, where an ideal system description is made according to the governing equations of the physical problem. This type of model typically requires researchers to have a deep understanding of the physical processes and be able to translate them into mathematical models. Most of the current turbulence models, such as the k-ω model [7] and the Spalart-Allmaras (SA) model [8], are developed by using this approach. The second type is based on data-driven approaches, which involve direct construction of black-box or grey-box models based on sample data obtained from system simulations or experiments. How to effectively utilize large datasets, extract key information from them, and guide the development of fluid mechanics have become focuses of researchers’ attention.
Machine learning techniques, such as radial basis function neural networks (BRFNN), random forests (RF), support vector machines (SVM), and neural networks (NNS), have been widely applied in many areas such as speech and image recognition [9,10], signal processing [11], and model reduction [12]. The combination of machine learning and turbulence modeling has become an emerging research direction in the field of fluid mechanics. Existing research findings have strongly validated its feasibility and indicate the positive prospects of machine learning in future applications of turbulence modeling [13]. However, there are still many challenges and unsolved problems in this field. For instance, how to improve the generalization ability, robustness, and stability of the models is the main concern of researchers. Existing studies showed that the model performance tends to degrade to varying degrees when there are significant differences between the predicted data and the training data or when there are changes in the geometric shape. This is to some extent an inherent limitation of data-driven methods. Additionally, some aspects in the model construction, such as data processing and feature engineering, selection of model objects, and constraint conditions, can also influence the final performance of the models.
Therefore, in order to address the challenges of complex system modeling and to partially overcome the issues encountered in applying machine learning to turbulence, this paper proposes a sample mapping model for simulating the flow field of a propeller by using a deep-learning-based approach to combining Reynolds-averaged Navier–Stokes (RANS) and large eddy simulation (LES). The model is constructed by training on existing RANS and LES flow field samples, with the mapping between numerical values of simulation samples for propeller flow fields. By learning the mapping relations between RANS and LES, we can obtain flow field predictions close to those predicted via LES but with higher computational efficiency.
The contributions of this paper can be summarized as follows. First, we propose a novel, neural-network-based mapping method of transforming RANS data to LES data, addressing the issues associated with both simulation methods. Second, we extensively evaluate the performance of several neural network models for feature extraction on a dataset comprising over a thousand sets of RANS and LES simulated data of swirling flow fields. Finally, we demonstrate the generalization capability of our model by applying it to two-dimensional swirling flow field simulation data generated at different Reynolds numbers.
2. Related Work
2.1. RANS Simulation
Reynolds-averaged Navier–Stokes (RANS) simulation is a classical numerical simulation method widely used in the field of fluid mechanics. Instead of directly solving the Navier–Stokes equation (NS equation) for turbulent flow, the RANS method applies time-averaging to the Reynolds equation [14]. It utilizes assumed Reynolds stress to establish a connection between turbulent fluctuation values and time-averaged values. In addition, it introduces a turbulent flow model to close the Reynolds time mean equations. The RANS time-averaging approach avoids directly solving turbulent flow, thus significantly improving computational speed and efficiency. Consequently, it has become the most commonly employed numerical simulation method in engineering. The RANS turbulence models includes the SA one-equation model and two-equation models. For example, k-ε and k-ω models are widely used two-equation models. Some studies, including those conducted by GonzàLez [15] and Chea [16], utilized the RANS method for unsteady numerical simulation of flow fields. Ahmed [17] applied the RANS method to investigate the hydraulic performance of axial flow pumps. Xiang et al. [18] conducted numerical simulations on wind turbines, exploring the wind field and wind-sand erosion issues. The RANS method has been applied in practical engineering problems due to its low computational time and the requirement of low grid resolution. When the accuracy of the results is not critical, the RANS method can save computational costs and expedite the simulation process.
2.2. LES Simulation
Large eddy simulation (LES) is a numerical method used to investigate turbulent flows and is particularly suitable for resolving flow phenomena. In LES, small eddies in the flow field are filtered through a filter function, while the large eddies and smaller eddies are directly solved using the NS equation. The additional impact of the small eddies on the large eddies is considered through sub-grid scale (SGS) models. For instance, Lu [19] carried out LES simulations to analyze lift and drag around a cylinder and used SGS models to capture the detailed characteristics of the flow field. Researchers have also attempted to apply LES to practical engineering. Kye et at. [20,21] employed LES to study the diffuser of a centrifugal pump and analyzed the flow behavior and the interaction between guide vanes. They found that LES can improve the accuracy of numerical simulations when the working conditions deviate from the design. Scholars have also investigated two-dimensional and three-dimensional LES, highlighting the limitation of simplifying three-dimensional flows to two-dimensional, since it ignores spanwise fluctuations of large eddies and leads to inaccurate calculations. Bouri [22] investigated flows around a square column and found that the two-dimensional LES fails to reflect actual flow behavior. The above-mentioned research indicates that LES and detached eddy simulation (DES) methods have been gradually transitioned to engineering applications. With the computational requirements taken into account, direct application of high-precision numerical simulation methods in engineering is challenging. However, with continuous advancements in computer technology and simulation methods, LES simulations have played a significant role in exploring turbulent flows and solving practical engineering problems.
2.3. Application of Deep Learning in Turbulence Modelling
In recent years, machine learning and deep learning methods have been used in the field of fluid mechanics, demonstrating immense potential in applications such as turbulence modeling.
Various machine learning techniques have been applied to modify traditional RANS models to enhance the flow prediction, including modifying model parameters with Bayesian methods [23], introducing a correction factor for the turbulence production term using neural networks [24], adding a spatially distributed correction field via field inversion and Gaussian process [25], etc. However, the various types of corrections trained for traditional RANS models are usually not physically interpretable.
Other than simply adding corrections to existing model parameters, more comprehensive efforts have been made to construct new Reynolds stress closures via physics-informed machine learning. A random forest method was used in Wang [26] to train Reynolds stress discrepancy functions, but the performance of mean quantities needs to be further validated. At the same time, the gene expression programming (GEP) method has been introduced [27] to develop explicit algebraic (Reynolds) stress models (EASM) based on the stress tensor decomposition proposed by Pope [28].
Although machine learning for turbulence model development is becoming a growing trend, obstacles and problems still exist in training and implementing the models to engineering applications. Using machine learning to enhance traditional turbulence models for improved accuracy in flow predictions remains an area that requires continuous and thorough exploration.
In the field of turbulence model mapping, according to our investigation, there is currently no existing work that utilizes deep learning to extract features from flow field data and regress these features to map them to more accurate large eddy simulation (LES) data. Nevertheless, this research topic remains significant as deep learning regression and mapping hold the potential to rapidly and accurately acquire complex and precise flow field data, significantly reducing the time and resources required for traditional fluid dynamics calculations. Additionally, it provides a novel approach for modifying traditional RANS models.
3. Method
The problem of mapping between RANS and LES flow field simulations using the actuator disk can be analogized to the problem of image feature extraction and mapping. The objective of the problem is to transform RANS data points into LES ones. During the process, all the data points within the same file are first converted into image information. Then, for each RANS point that needs to be predicted, its location information is combined with the overall flow field image and fed into a neural network. Through inference, the LES data point corresponding to its location information is obtained. Therefore, the overall model function can be represented as follows:
where are the predicted axial, tangential, and radial velocity components at the LES point, respectively, is the feature extraction network, is the image information, represent the position information, and is the regression model.
3.1. Data Processing of Propeller Flow Field Image
Since the flow field data used includes the simulation data of the two-dimensional propeller flow field under the same Reynolds number, each sample has multiple points (about 30,000) and is distributed on the area with three velocity components . Therefore, the point data should be processed before model construction.
First, discrete point data should be converted into images in order to process the flow field simulation data using image processing techniques. We converted approximately 30,000 discrete points from each CSV file into uniformly distributed matrix-format data. Therefore, the first step is to process each set of flow field simulation data. Initially, a point is plotted on the image based on y and z coordinates of each point, with its color representing the magnitude of the corresponding velocity. The lighter colors indicate lower velocities, while the darker colors represent higher velocities. Figure 1 shows an example of a flow field simulation image depicting the actuator disk generated by plotting 30,000 points. Since each set of RANS data corresponds to three velocity components, each set can generate three simulation images for the actuator disk flow field.

Figure 1.
Images of flow field for three velocity components.
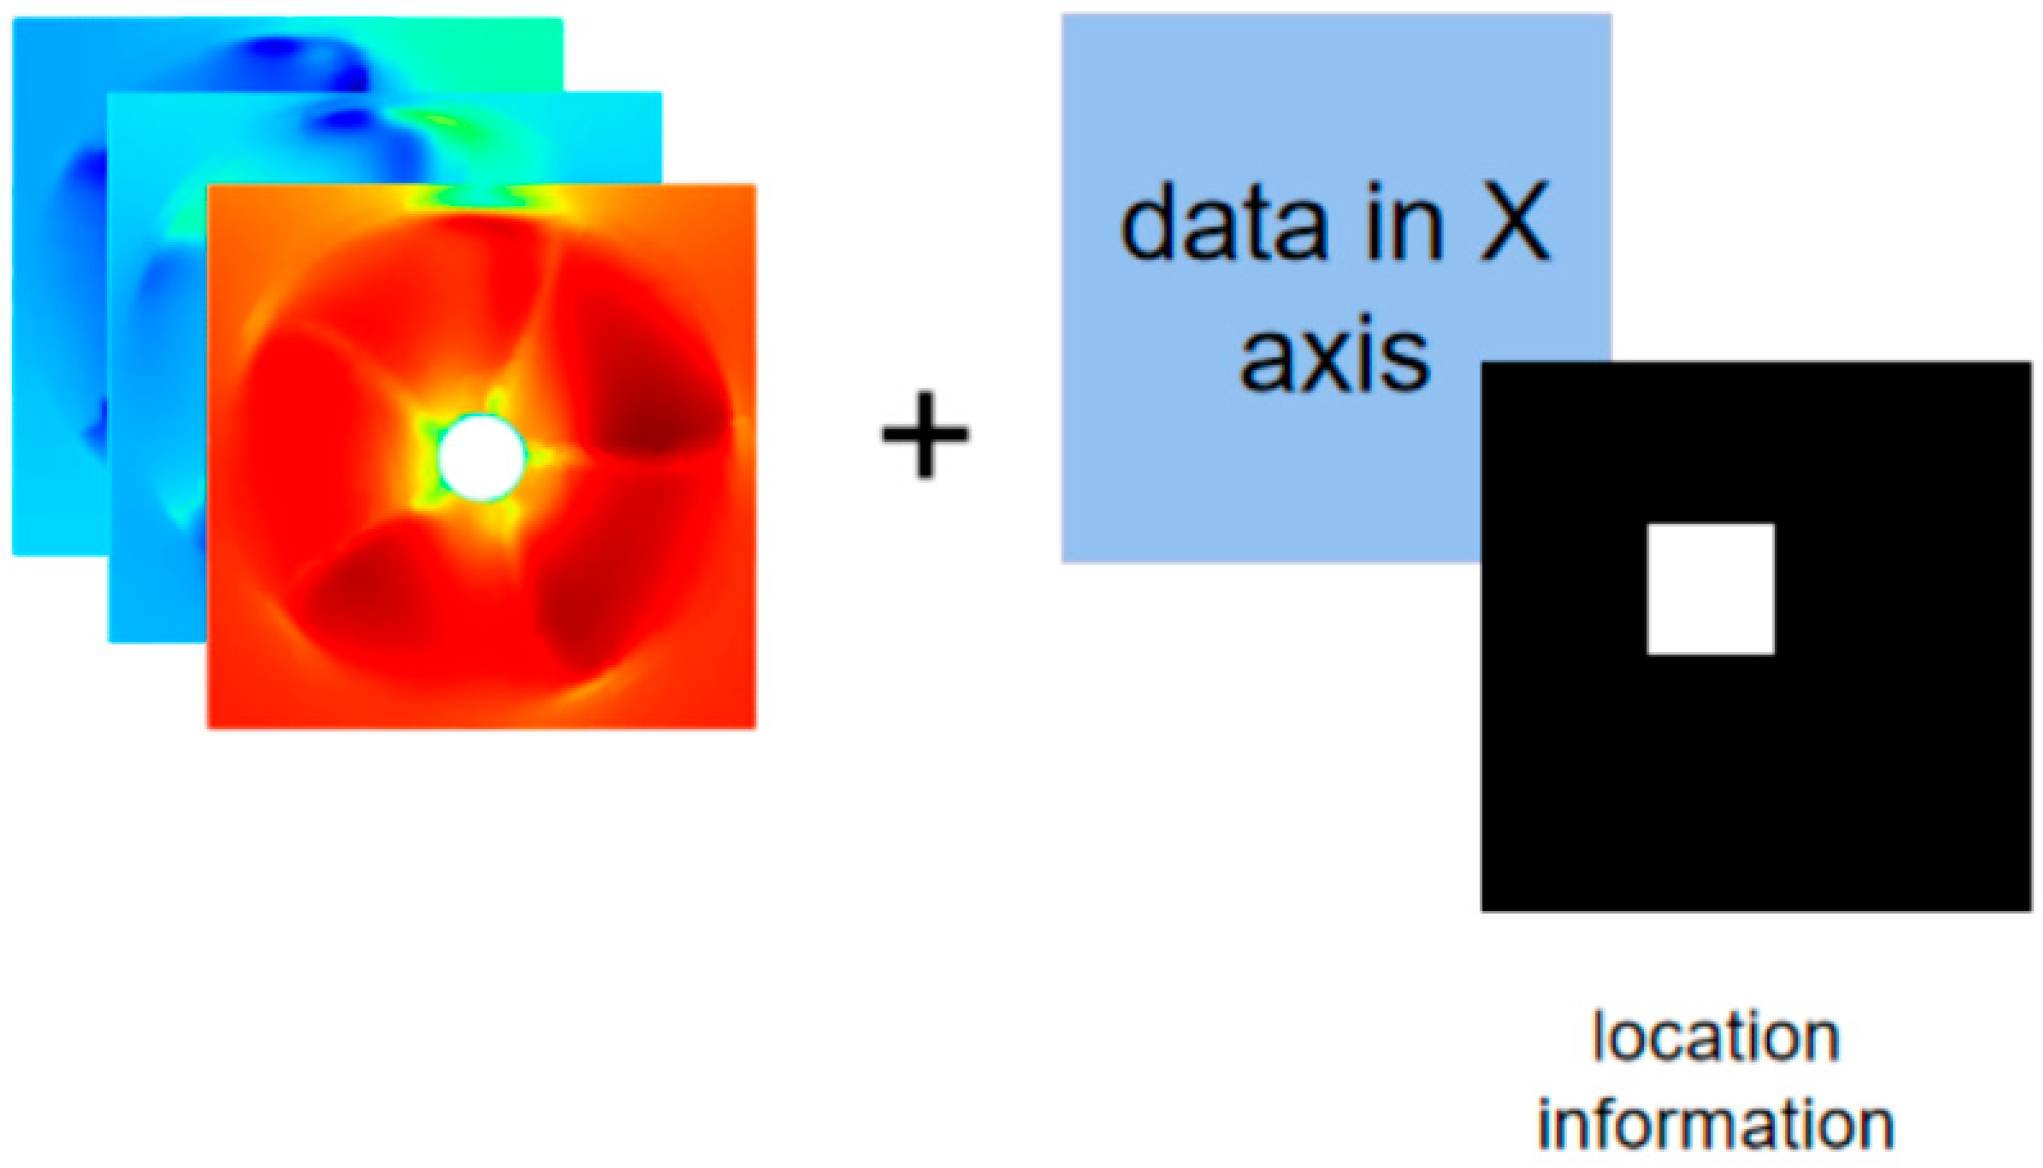
We export the generated data as images of size 256 × 256 × 3, which are the images of flow field data carrying global information. As the input and output consist of data points of flow fields, we also need to process the input images to include the position information of the measured points. During data processing, two additional channels containing matrices consisting of only 0 and 1 pixels are added to the input images. The specific approach involves matching the position information of given data with the corresponding image, mapping the position to a nearby pixel in the image, and setting the pixels within a 10 × 10 matrix box around that pixel to be 1 while keeping the remaining positions as 0. This generates a channel and carries a single-channel 256 × 256 matrix containing axis information, which remains fixed in the original file. Finally, the input matrix, integrated with the image information, is shown in Figure 2.
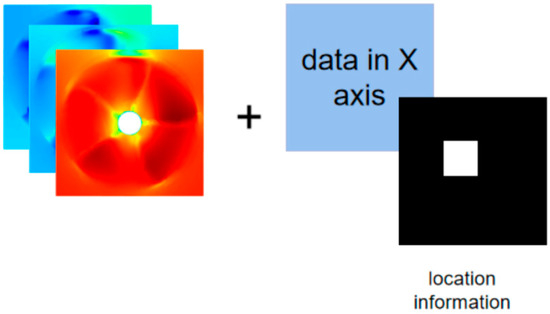
Figure 2.
The input data for the network.
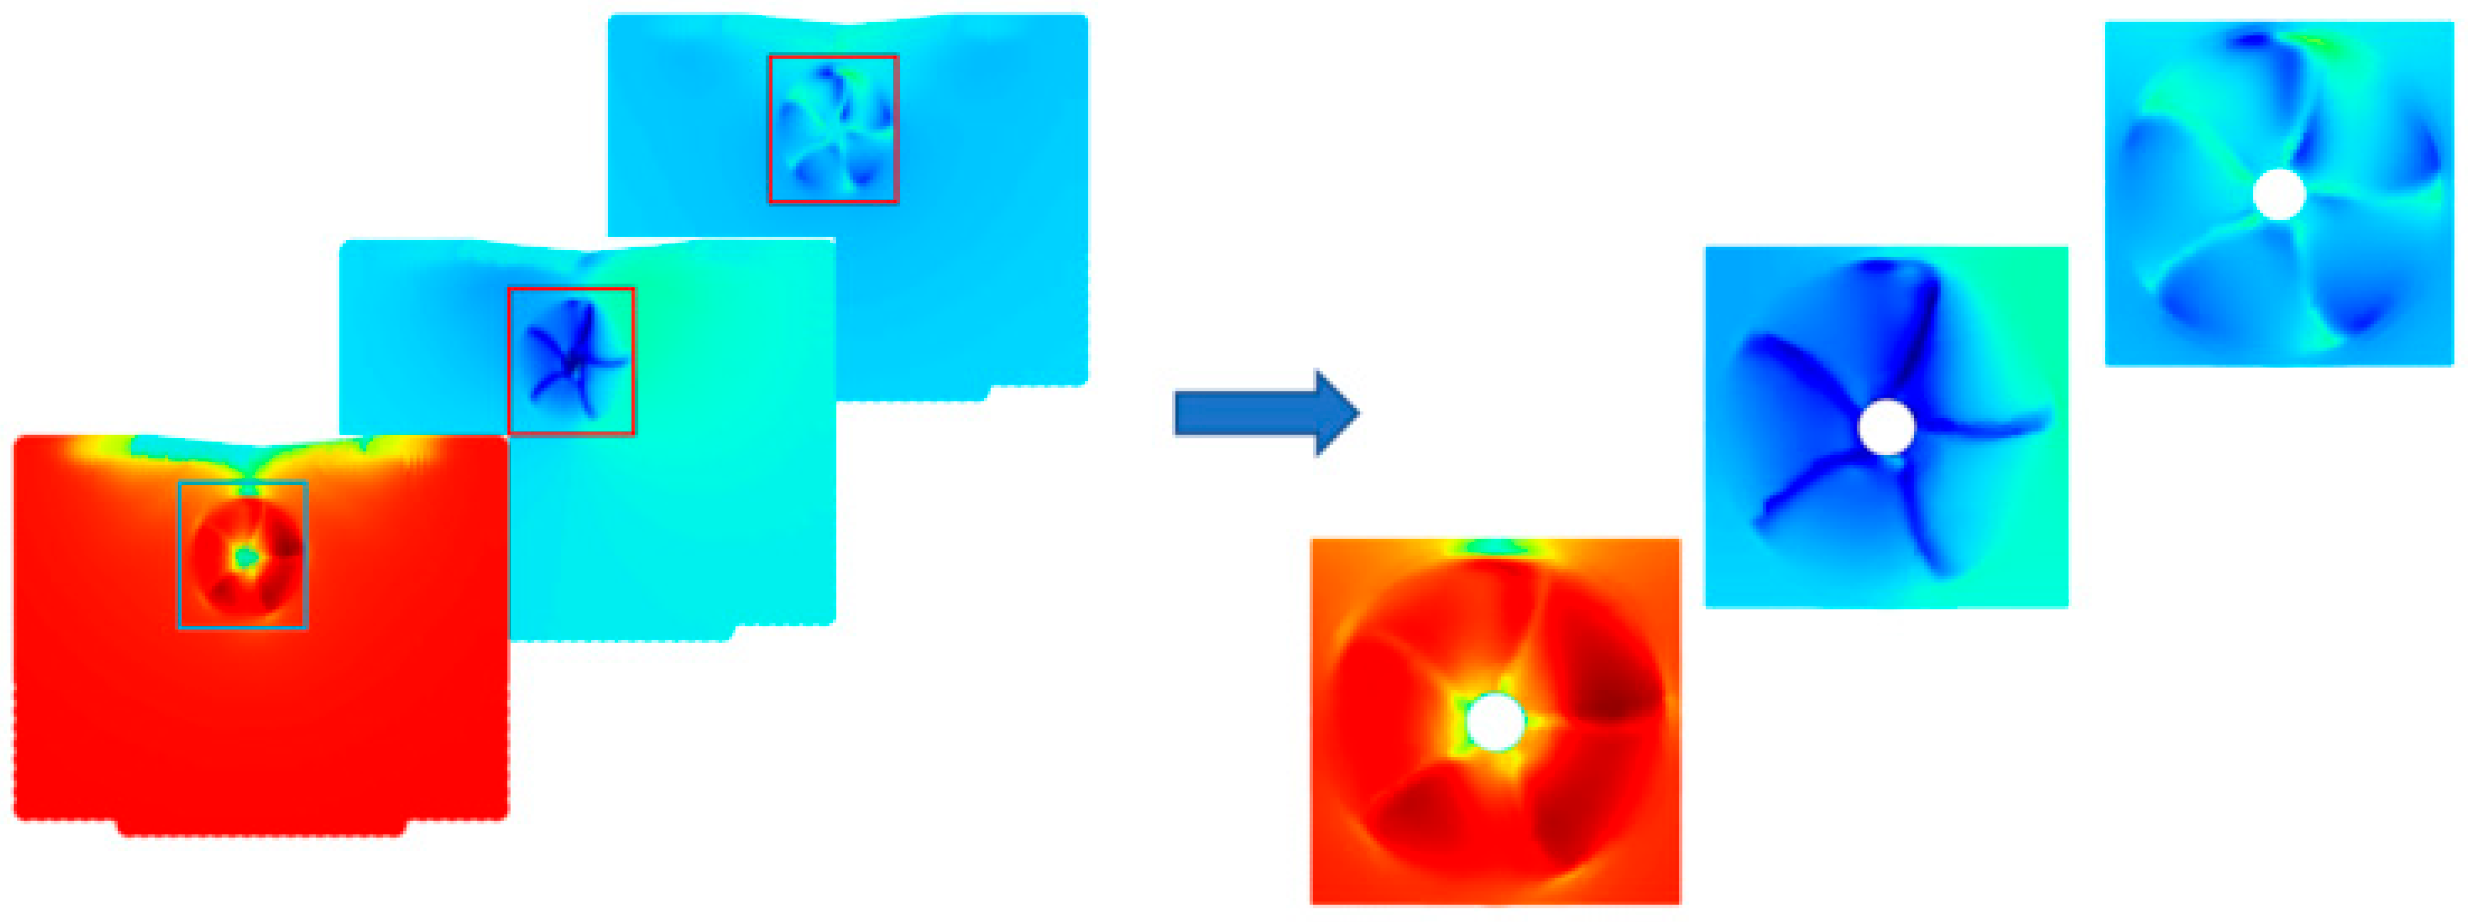
Considering that the simulation data of the propeller on civilian ships is generally concentrated around the propeller, in order to improve the accuracy and precision of the obtained features, we apply a special treatment to the points located in the central region of the propeller. A plot is created around an area of 0.26 × 0.26 m2 surrounding the propeller using the aforementioned method, and thus, a 256 × 256 central propeller image is generated in Figure 3. This significantly enhances the accuracy of the images and velocities, facilitating better feature extraction and mapping of the flow fields.
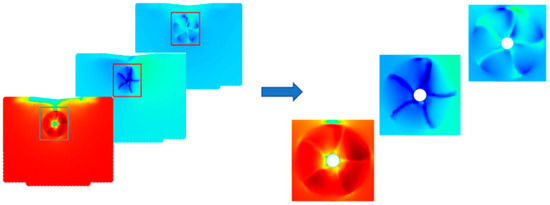
Figure 3.
Schematic diagram of the central area of the image.
3.2. Feature Extraction and Regression Model
We begin by extracting features and performing regression on the flow field data. This involves extracting region-based features from each input image of the flow velocities to obtain the features of the flow field in a region. After that, regression is performed on these features to obtain the original flow velocities.
In this work, several methods of extracting flow field features are investigated. Each flow field image inherently contains spatial information, while consecutive flow field data exhibit temporal variations. Therefore, we first attempt to extract spatial features independently and then examine a two-stream model that combines temporal sequence information for extraction and fusion. In addition, since each flow field has information of three velocity components, we develop two different methods for different input methods for velocities to predict velocity information. Finally, multiple nonlinear mapping modules are employed to regress the extracted features into the three velocity components at the coordinates of the input RANS data point.
3.2.1. Feature Extraction for Single Velocity Component
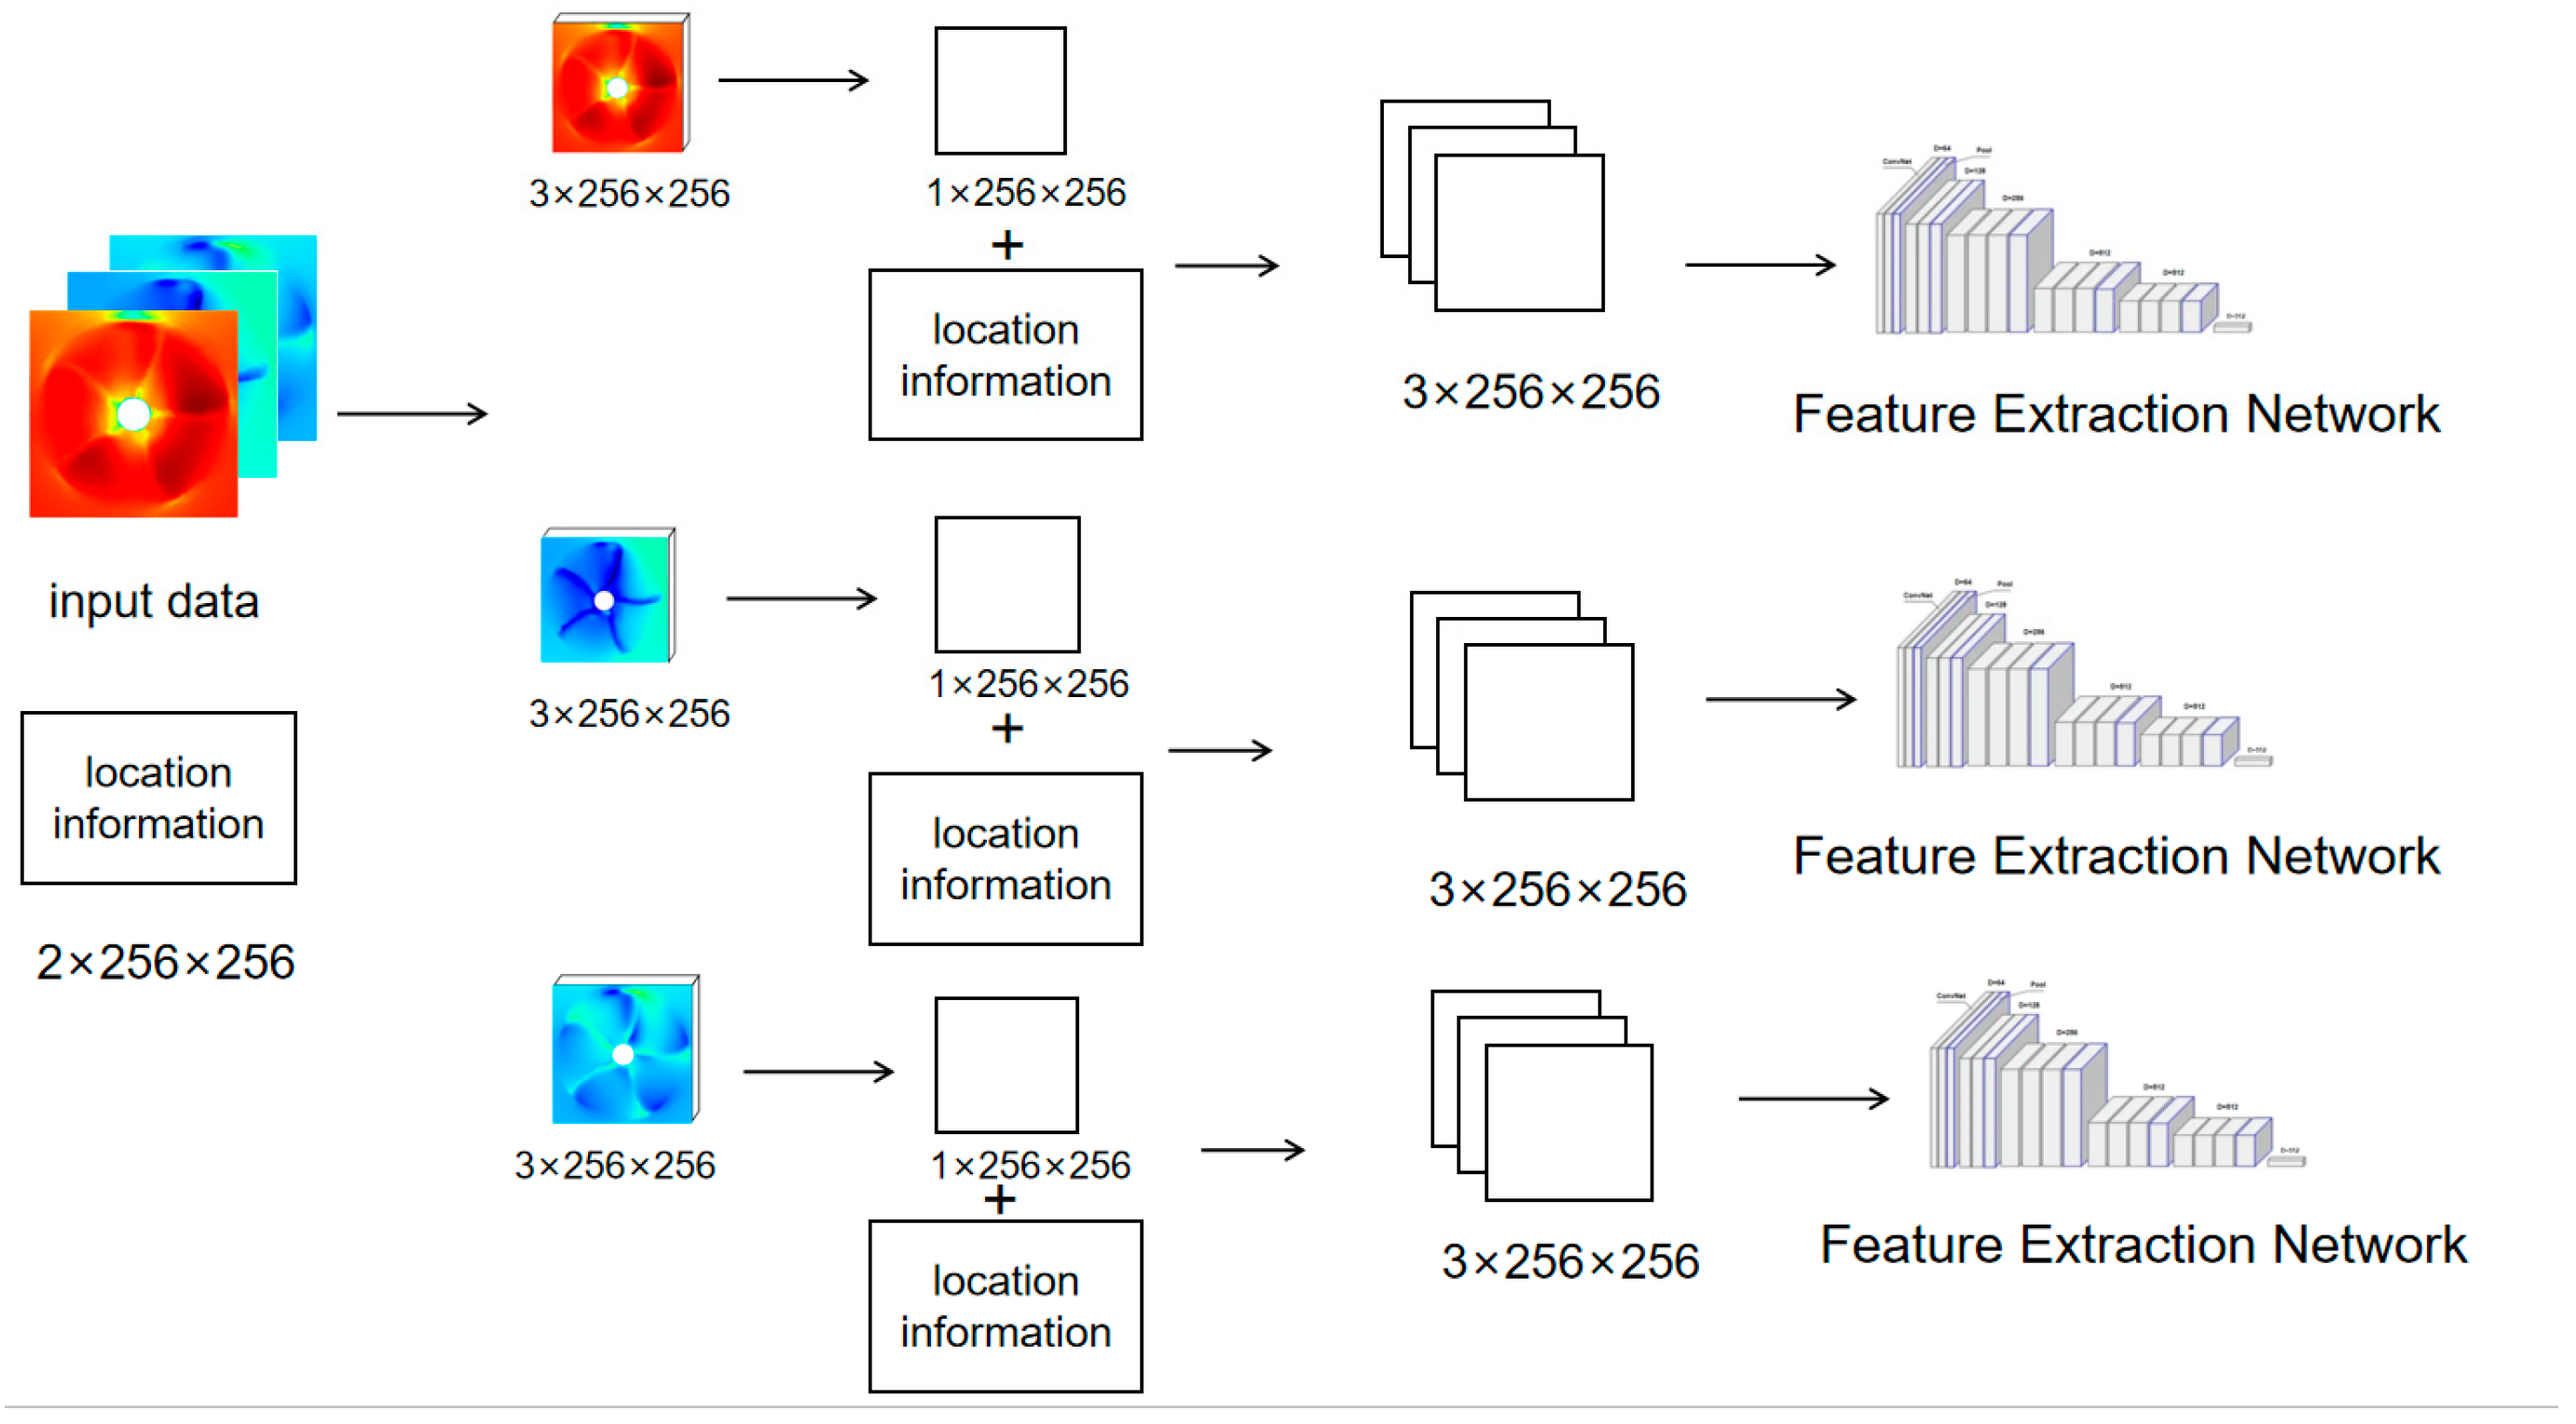
Since the flow field data contains three velocity components at each point in the flow field, we initially consider separating the three velocity components for feature extraction and mapping. Each model focuses on extracting features and mapping the features from individual inputted velocity images and position images. The output is the predicted LES velocity component of the RANS image at the input position. Figure 4 illustrates the specific architecture for feature extraction for a single velocity component. This approach allows the model to learn the features of different velocity components separately.
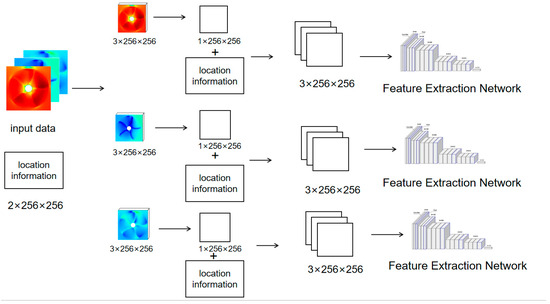
Figure 4.
Feature extraction model for single velocity component.
3.2.2. Feature Extraction for Three Velocity Components
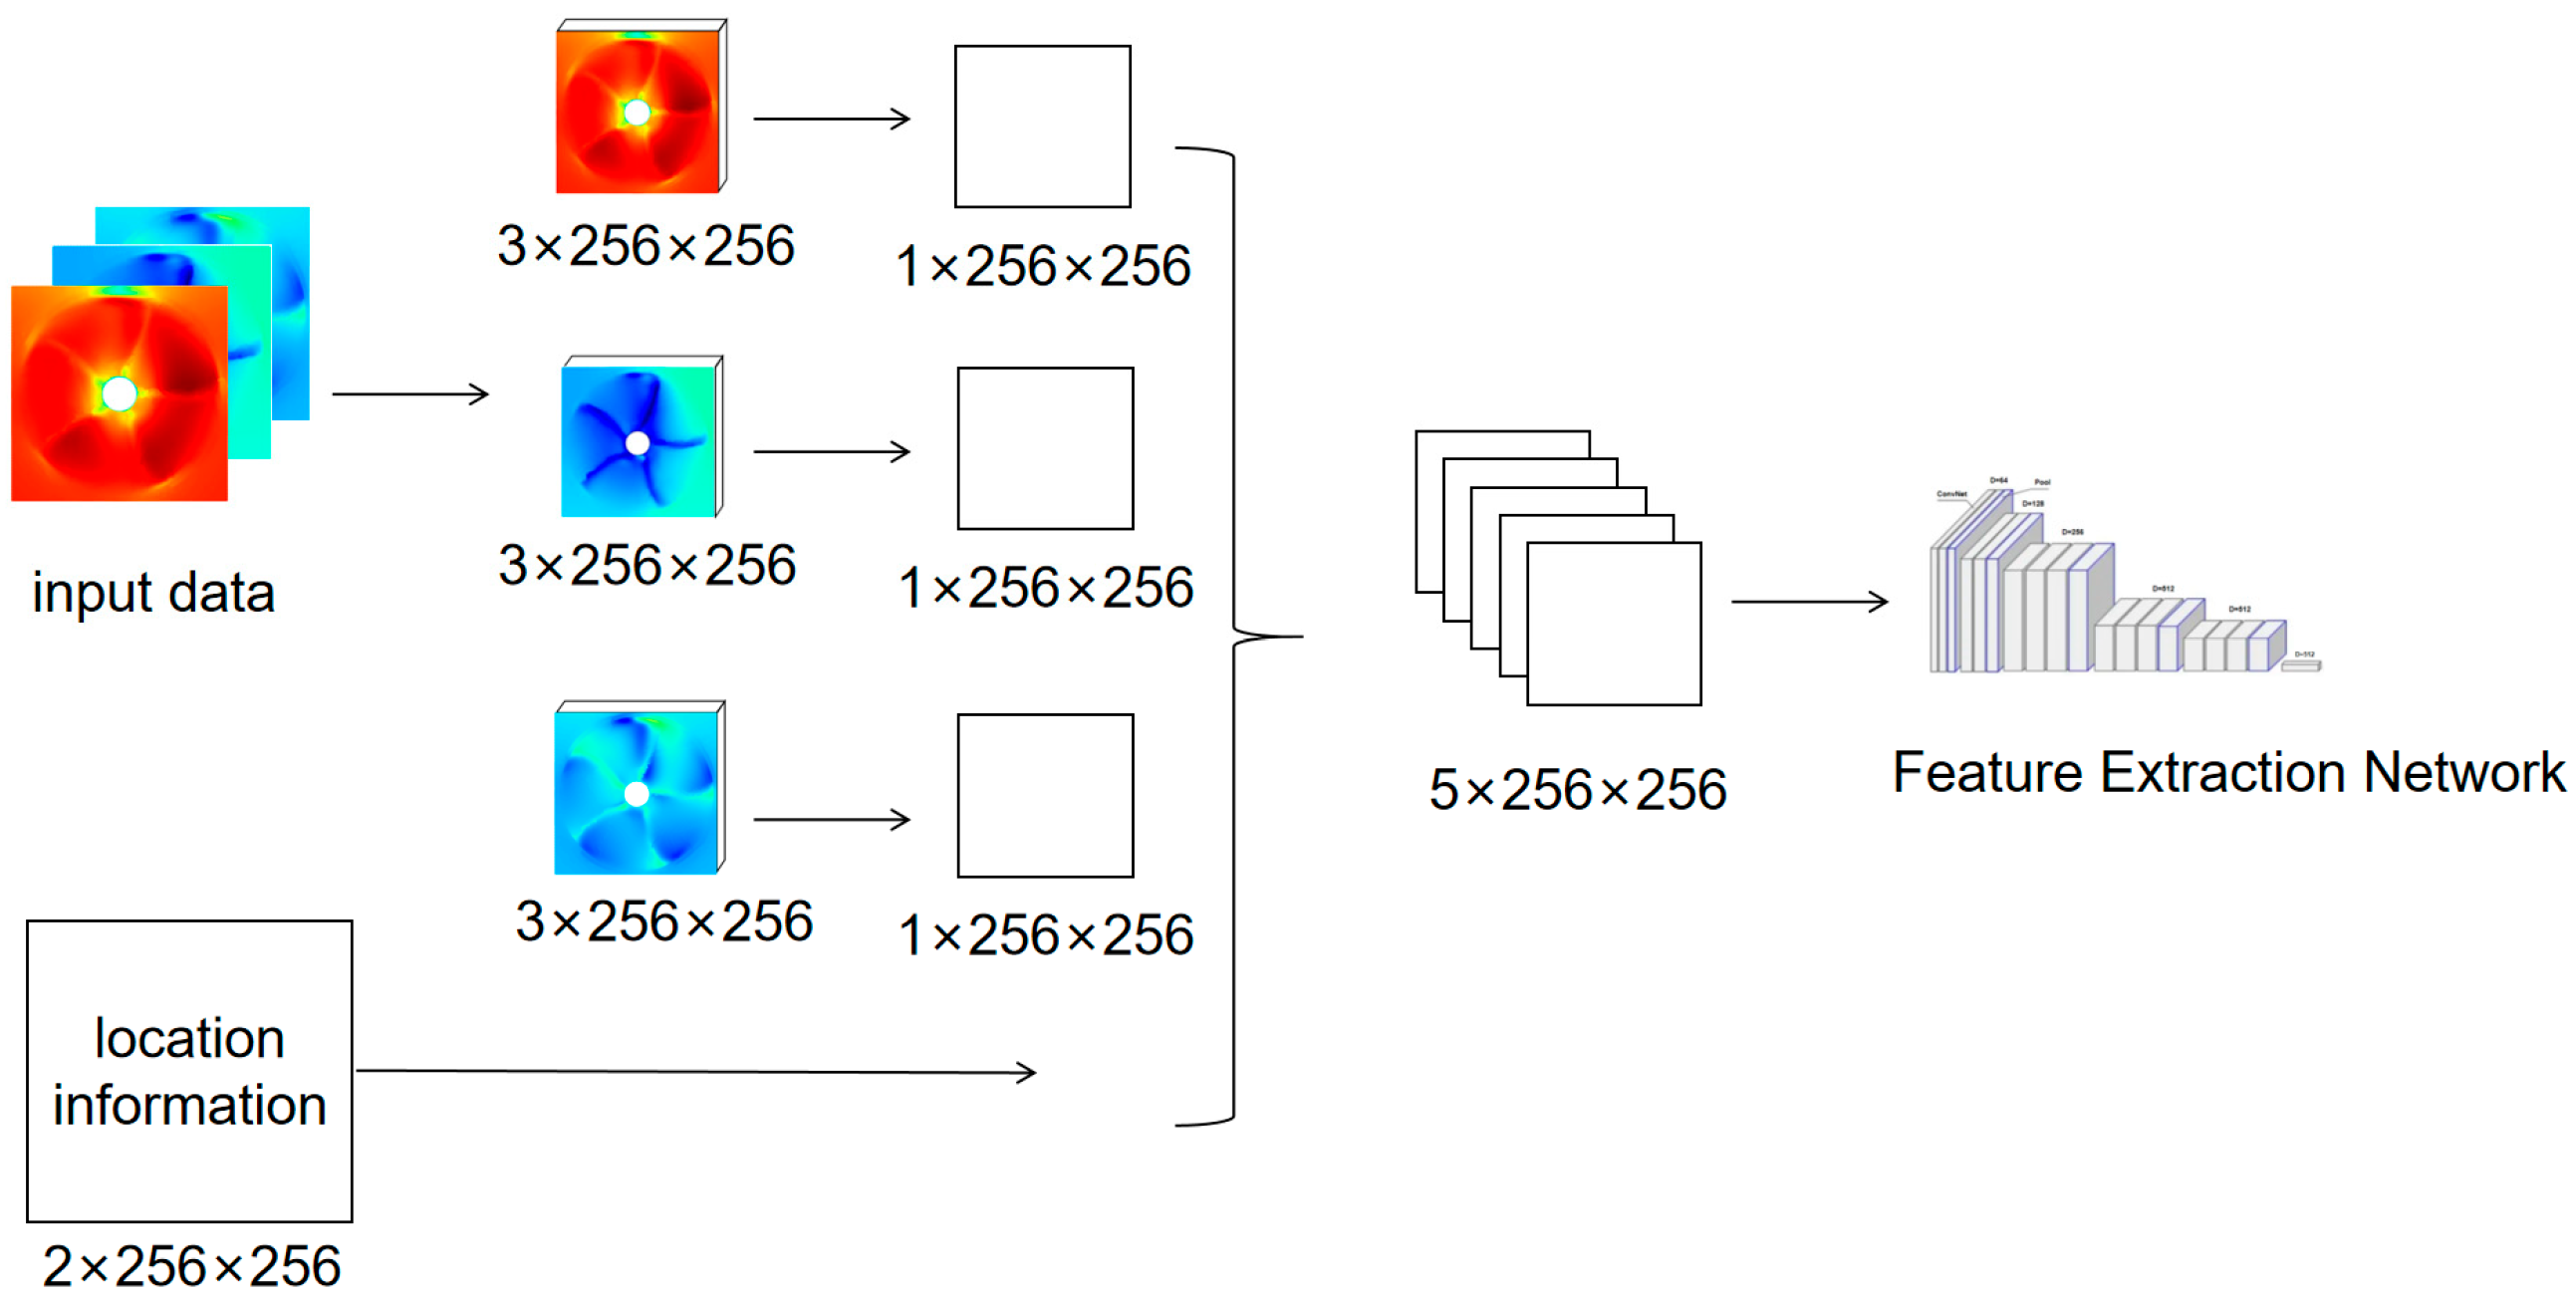
Considering that there may be certain correlations among the three different velocity components in the flow field data, we also explore combining the three velocity components as the input for feature extraction and mapping. Each model compresses and concatenates the input velocity images and position images, then performs feature extraction and mapping. The output is the predicted LES velocity of the RANS image at the input position. Figure 5 illustrates the specific architecture for feature extraction for the combination of three velocity components.
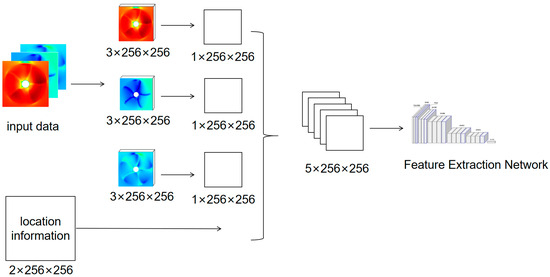
Figure 5.
Feature extraction model for combination of three velocity components.
3.2.3. Feature Extraction for Three Velocity Component
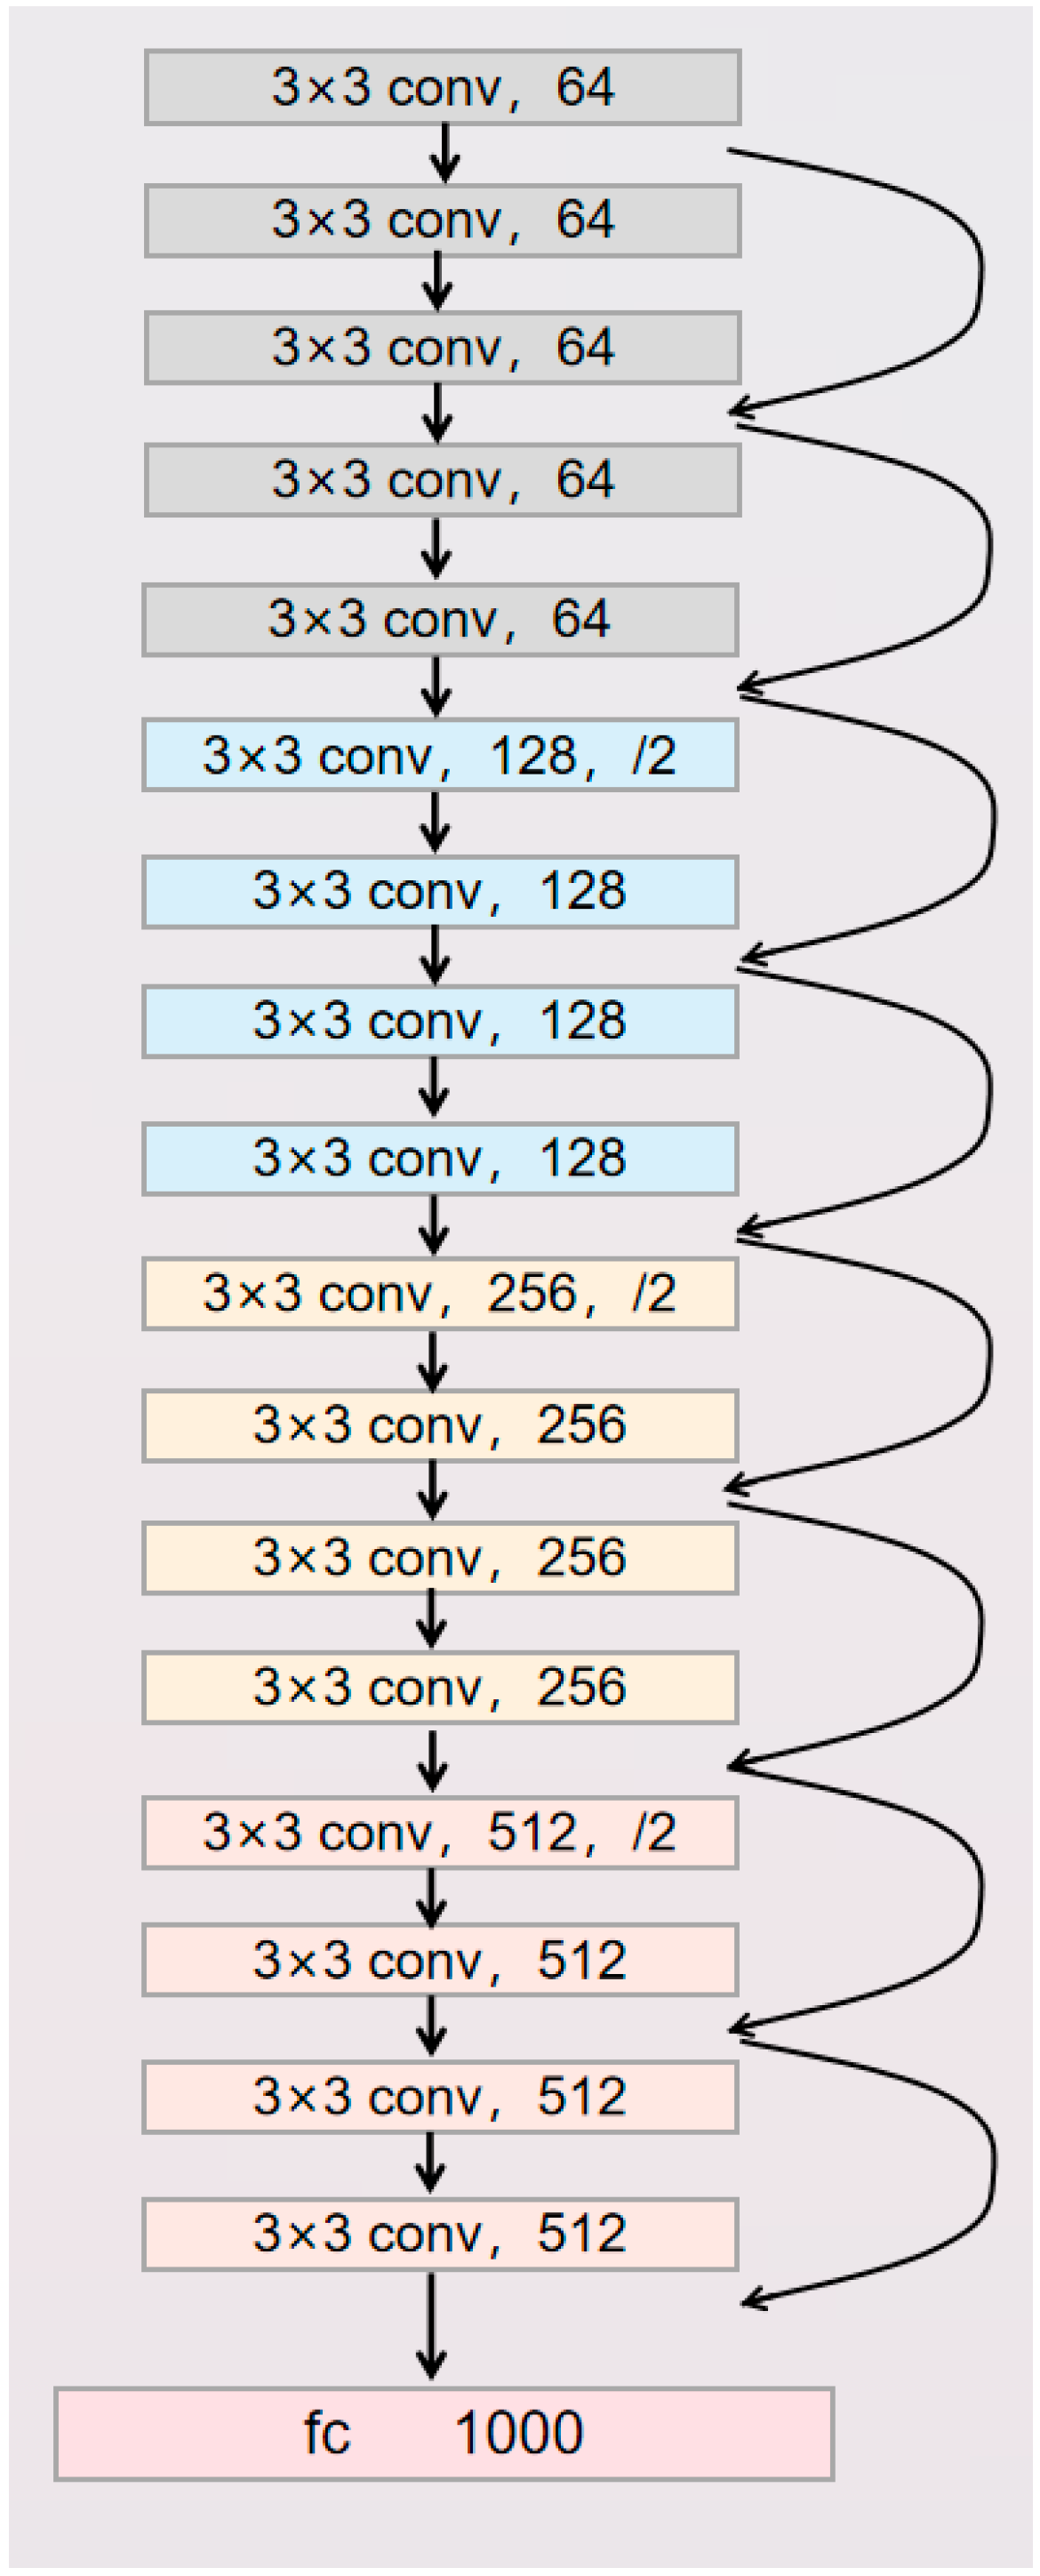
A flow velocity image contains the information of the propeller and the surrounding flow field. Therefore, we utilize ResNet-18 as the backbone network for feature extraction. ResNet-18, with its deep network and residual connections, can effectively extract and propagate image features. The training speed for ResNet-18 is faster than the latest models with attention mechanisms and it can better extract texture features.
The main structure of ResNet-18 is illustrated in Figure 6. The model operates by taking the preprocessed image as the input and making it pass through a 1 × 1 convolutional layer for compression. The position information and global image are then concatenated to transform the input into an image size of n × 256 × 256, where n represents the number of input velocities plus 2. This is followed by multiple residual blocks to further extract features. After flattening, the model generates a desired 512-dimensional feature vector.
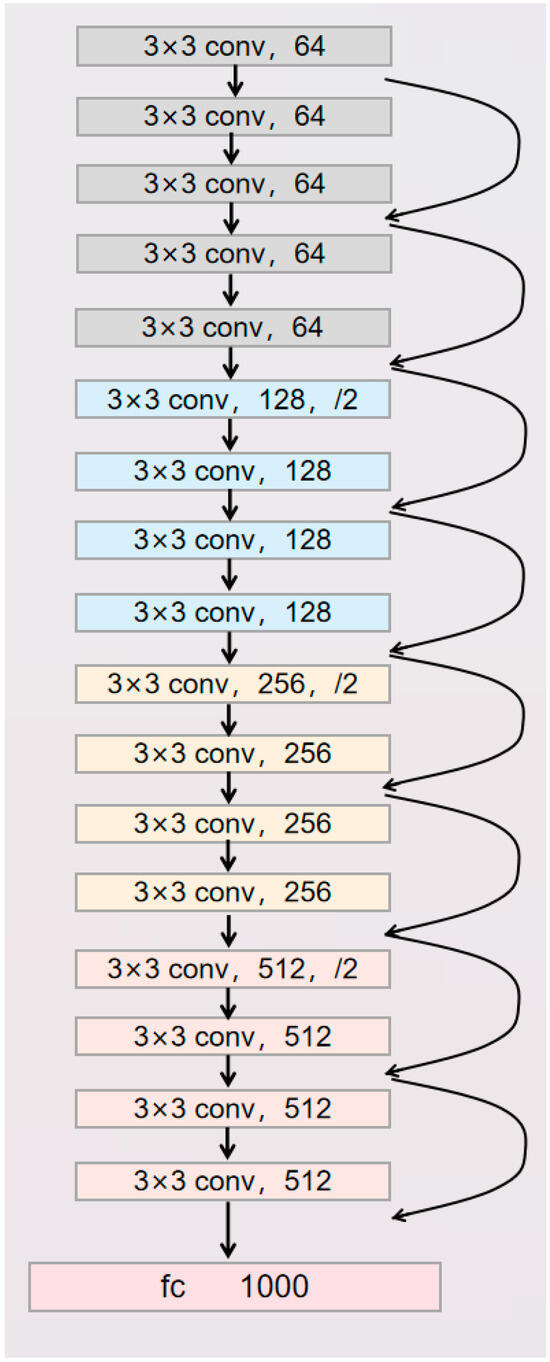
Figure 6.
The structure of ResNet-18.
3.2.4. Two-Stream Model
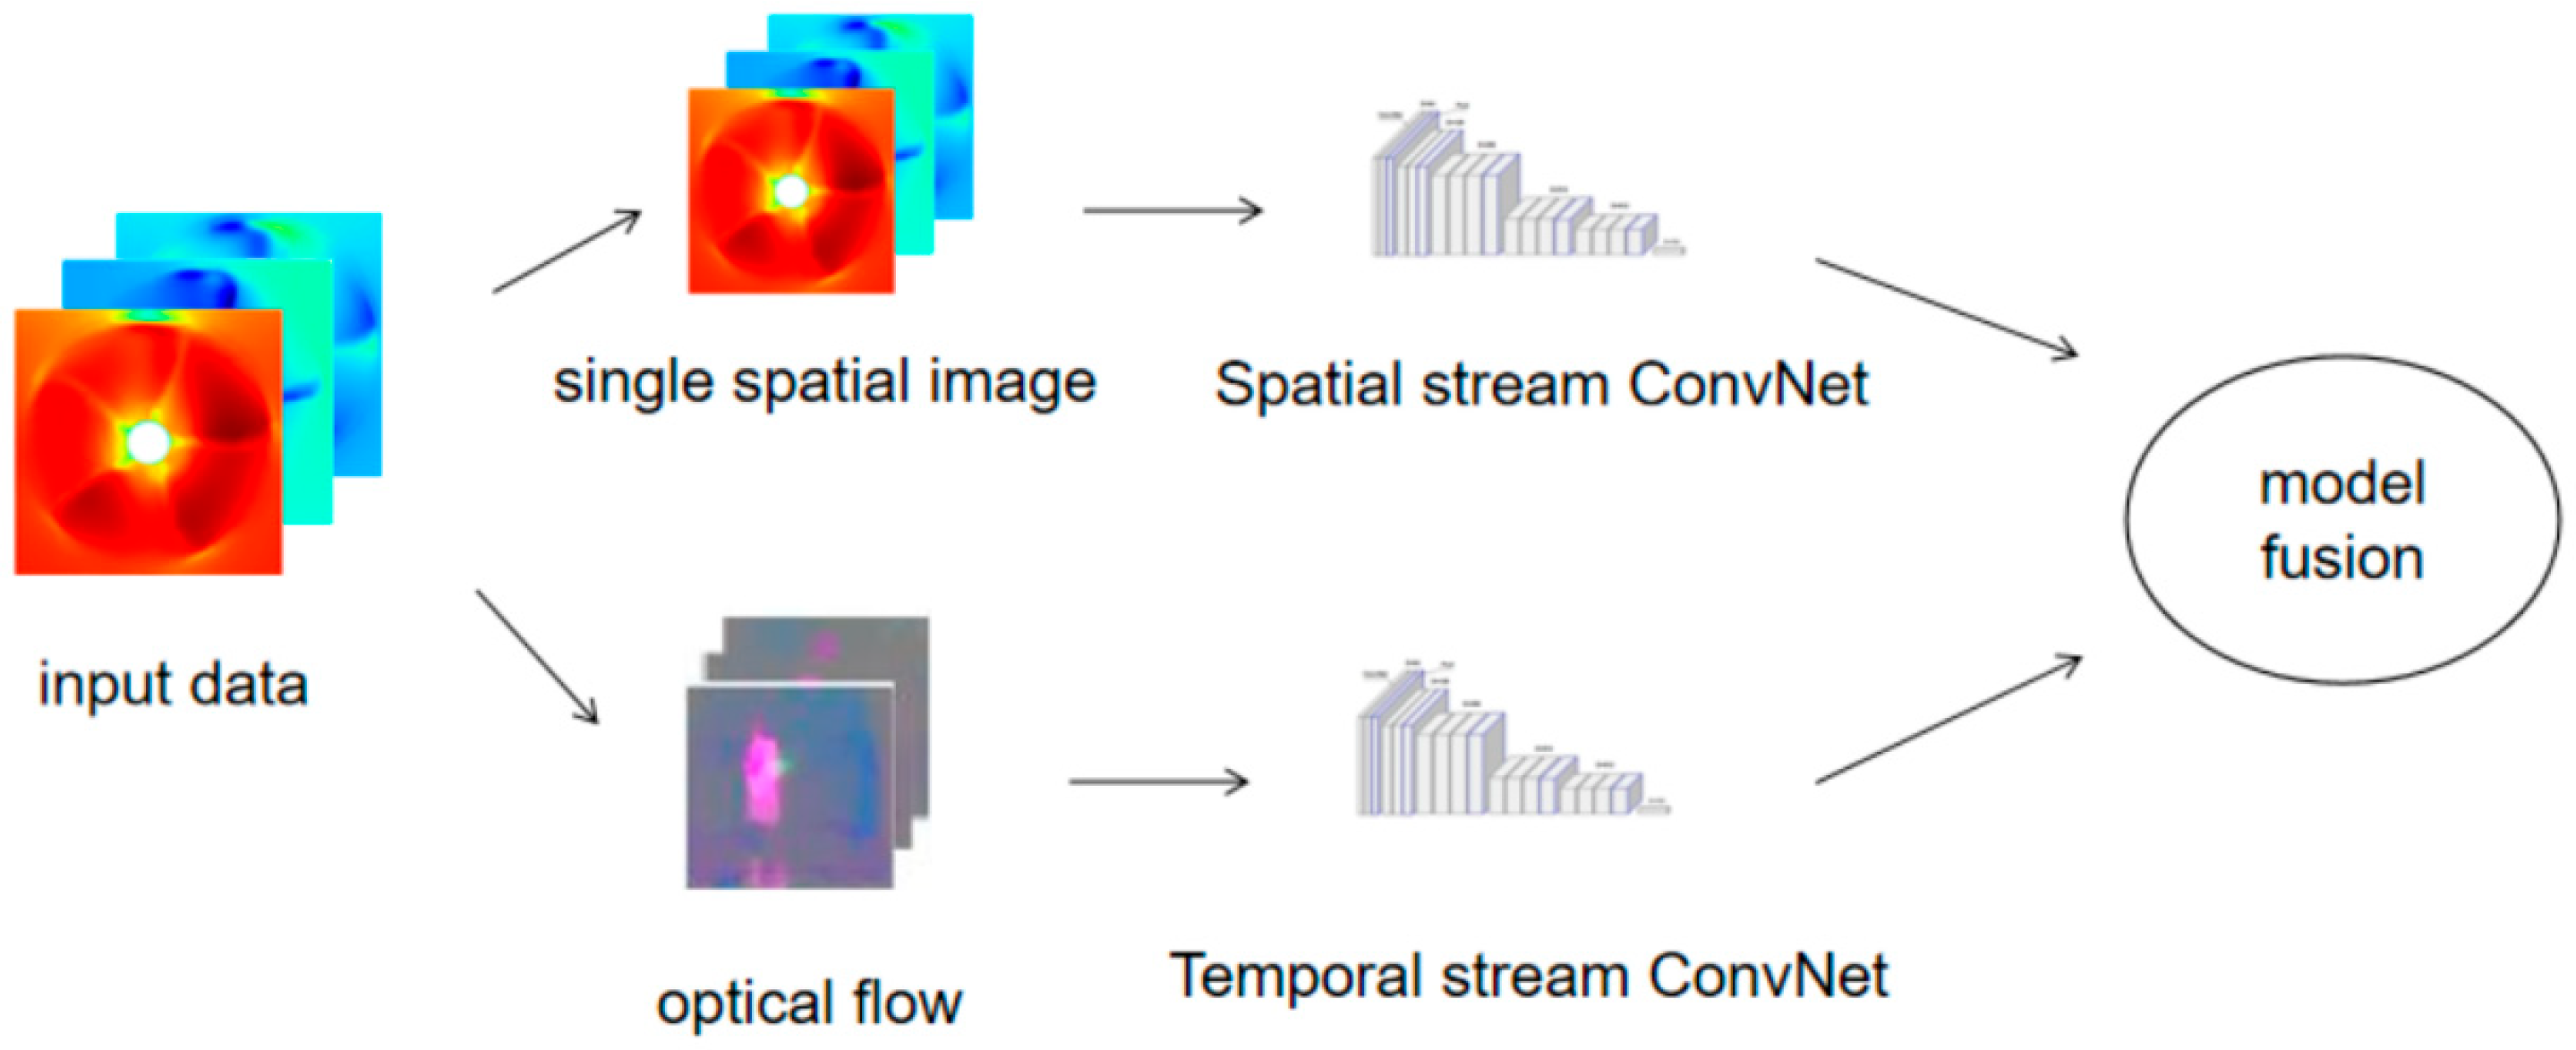
The dataset we use for the simulation of ship propeller RANS and LES flow fields is sampled under the same time interval within a continuous time period. As a result, there exists a fixed temporal pattern between the two kinds of images. Considering that the simulations of RANS and LES flow fields of ship propellers exhibit both characteristics of static flow fields and temporal variations in the sequence of frames, we employ a two-stream network architecture, as shown in Figure 7, to simultaneously extract and fuse the features from these two types of images.
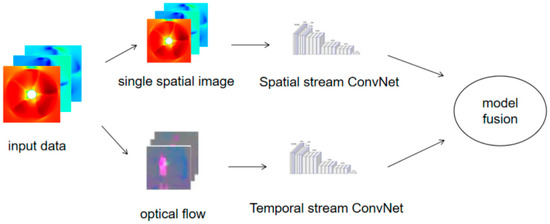
Figure 7.
The structure of two-stream network.
The two-stream architecture enables the network to process both appearance and motion information in videos. By fusing or jointly learning the outputs of the two independent processes, the network can effectively utilize the complementary information between static frames and inter-frame motion, thereby improving the accuracy of motion recognition. The two-stream network consists of spatial stream ConvNet and temporal stream ConvNets, which respectively extract spatial and temporal features from videos. The two types of features are then fused, followed by training multiple fully-connected layers for feature regression.
In the temporal stream ConvNets of the two-stream network, the input typically consists of motion information between multiple video frames. Optical flow is used to capture the motion information between adjacent frames, and convolutional layers and pooling layers are employed to extract features and reduce the dimensionality of the optical flow images. Combining multiple optical flow maps can capture dynamic information and motion patterns in the video but avoids the limitations of a single optical flow map in capturing complex motion patterns or integrating motion information from multiple time steps to better reflect dynamic changes in the video.
However, the motion in images of the propeller flow field is relatively simple and direct, with the variations in the main flow field caused by the movement of the propeller blades. Therefore, it is unnecessary to overlay multiple optical flow maps of the flow field as the input. Instead, we can select consecutive pairs of images within the time interval of each prediction to form the optical flow.
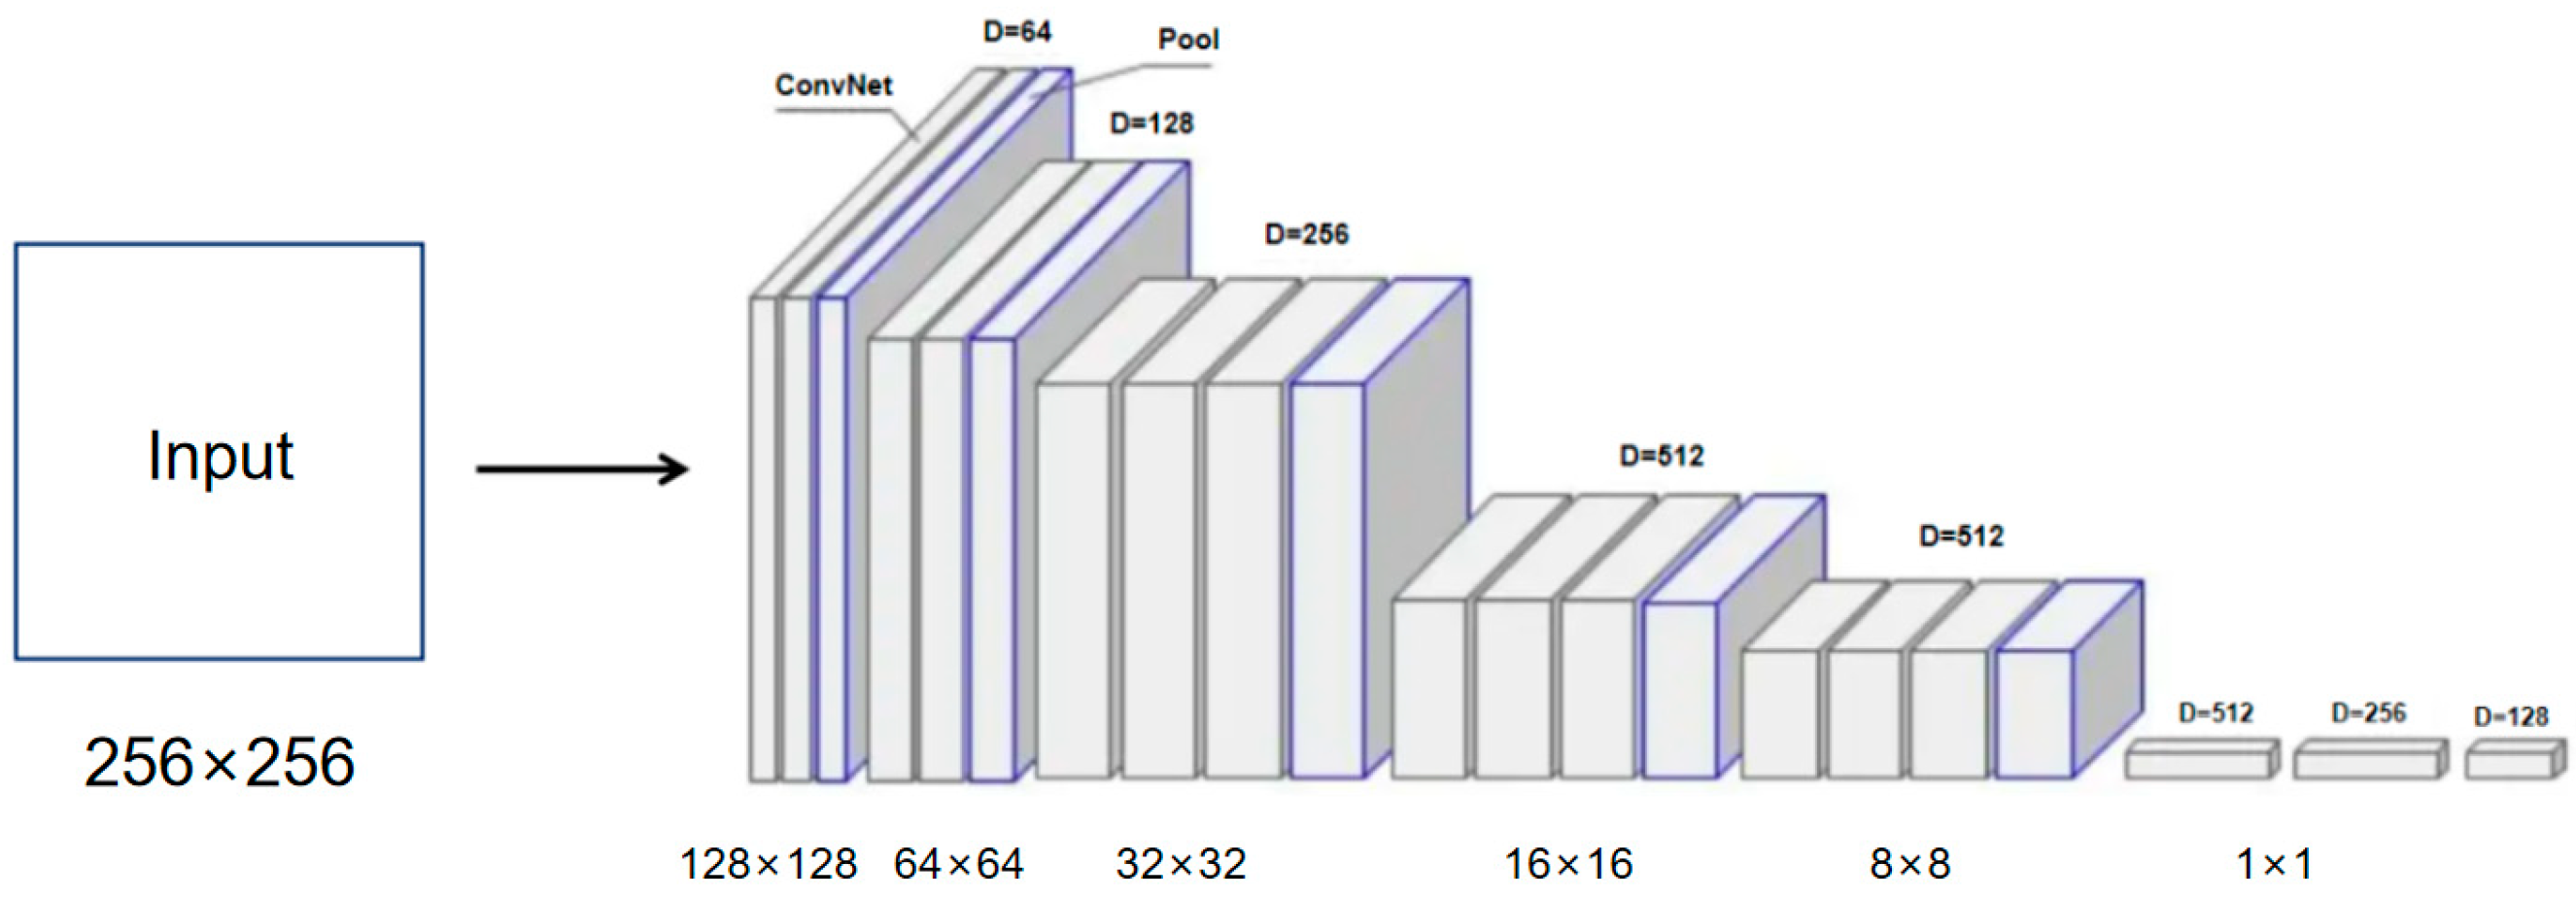
The main components of the spatial stream ConvNet and temporal stream ConvNets are illustrated in Figure 8. The input images, with a size of 256 × 256, undergo multiple convolutional and pooling layers. Each layer is separated using max-pooling, and ReLU activation functions are applied to all hidden units. The network continuously downsamples the features to implement dimensionality reduction and feature extraction. Finally, the network outputs the feature vector of the original image.
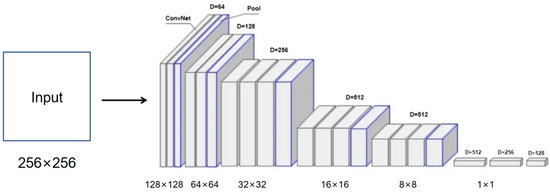
Figure 8.
The structure of ConvNet.
3.2.5. Feature Regression Module
For each feature extraction model, we have added a regression module to achieve regression of the extracted features. Specifically, the input is a flattened feature vector of size 512 × 1, obtained from feature extraction. This vector then passes through the multiple layers of non-linear regression modules, as depicted in Figure 9. The non-linear regression module consists of a fully connected layer followed by a ReLU activation function, along with a dropout operation with a default rate of 0.5. After regression through multiple non-linear modules, the final 512-dimensional feature is regressed and fused into three predicted values, representing the three velocity components in the flow field.

Figure 9.
The feature regression module.
3.3. Subsection
Based on the separate feature extraction from RANS and LES images, we need to obtain a map between the two feature vectors to achieve the whole process of inferences and mappings from global data of the flow fields to combined images and from local positions to local features and finally the regression for velocity information. The specifics of this process can visualized in Figure 10. By performing non-linear mapping between the feature vectors, we can obtain local information of the images and then achieve regression.

Figure 10.
The process of inference and mapping.
The mapping module is illustrated in Figure 11. Firstly, the 512-dimensional vector is linearly mapped, followed by a fully connected layer and ReLU activation function. The output is a vector with a length of 256 × 1. It goes through two identical network structures, continuously integrating the feature information, and finally outputs the feature vector as the input to the regression model for LES. The velocity information of the LES model is then generated using the regression module.

Figure 11.
The structure of mapping module.
4. Experiments
4.1. Dataset and Model Training
The dataset used in the experiments of this work was obtained using a simulation of RANS and LES flow fields. The computational mesh for the simulation employed a non-structural cut-body configuration and the simulation data were generated using Hexpress software (Version 6.2). The number of mesh elements was approximately 12 million. In the simulation, the flow was characterized via a Reynolds number of 1.4 × 10⁷, a CFL (Courant–Friedrichs–Lewy) number of 0.3, and a y + value of 24, and the propeller’s advance speed was described using a coefficient of 0.925. In a comparison with experimental data using the model, the error for hull resistance calculated was 0.6%, the error for propeller thrust was −4.5%, and the error for torque was 1.6%. It comprises 1000 samples, with each sample containing simulation data of RANS and LES in the central region of the propeller. The flow field information in both cases is in CSV format and includes spatial coordinates (x, y, z), with x always being 0 for two-dimensional data and velocity (u, v, w). Each sample consists of approximately 30,000 points with three velocity components (. The points are distributed within the range of . The data sampling was performed at intervals of during the rotation of the propeller, with the speed of the propeller rotation fixed. As a result, there is an inherent regularity in the continuous samples regarding time intervals and angle variations of images.
We split 70% of the dataset for training, 10% for validation, and 20% for testing. As we also conducted training for the two-stream network, feature extraction for optical flow was performed by computing the flow between two consecutive images in time. The computed optical flow and the subsequent image were used as inputs for the two-stream network.
The training process for various methods was conducted on two GPUs (3080Ti). Each method was trained for 20 epochs by using the mean squared error (MSE) loss function, as defined by
where x represents the predicted value and y is the ground truth.
4.2. Experimental Results of Feature Extraction Model for Flow Fields
4.2.1. Flow Field Customization Error Rate
In accuracy evaluation for the results of flow field simulations, it is common to use the following error rate as an evaluation index:
where is the ground truth and is the predicted value. However, the accuracy evaluation for propeller flow field simulations has several challenges. One of the main issues is that the magnitude of the error rate changes with the magnitude of the true value. For example, if the error value is 0.01 and the true value is 0.001, the error rate would be 1000%. However, if the true value is 0.1, the error rate would be 10%. Thus, directly using this error rate as an evaluation index has a lack of objectivity. To address this issue, we propose a comprehensive error rate as
where is the actual value and is the predicted value. Such a comprehensive error rate would not be affected by the fact that the real value of a certain point is too small.
4.2.2. Experiments of Input Flow Field Sizes
We initially conducted experiments to investigate the impact of different input flow field sizes on the experimental outcomes, as detailed in Table 1. We began by comparing tests performed on the entire flow field and a central region around the propeller in the flow field. For the central region prediction, only the velocity information within that specific area was forecasted, while the remaining portions were directly compared using original RANS flow field data. The ultimate findings indicated significantly improved performance when focusing on the central region, outperforming direct predictions of the entire flow field. Subsequently, further experiments were conducted with varying flow field sizes. Initially, the image dimensions were set based on the propeller diameter, and experiments were conducted within a specific range around this size. Ultimately, a size of 0.26 × 0.26 m2 was identified as the optimal result. All subsequent experiments employed this size as the input.

Table 1.
Comparison of experimental results for different input flow field sizes.
4.2.3. Experiments of Model Performance and Feature Extraction
After fixing the flow field size at 0.26 × 0.26, we conducted comparative experiments with varying input velocity channel quantities and different feature extraction networks, using a test dataset of flow fields with a size of 200. For both RANS and LES data, we trained two separate models using the same neural network architecture and compared their error rates individually.
Table 2 and Table 3 summarize the results of model performance on the testing set, which contains approximately 200 samples. From the tables, it can be observed that the single-velocity prediction model achieves approximately 0.3% higher accuracy compared to the three-velocity prediction model, but at the cost of a significantly increased processing time. Moreover, it is evident that the two-stream network outperforms the ResNet-18 feature extraction network in terms of accuracy of feature extraction, which highlights the advantages of incorporating temporal information for feature regression of propeller RANS and LES.

Table 2.
Regression error rate for feature extraction of RANS velocity in the data set (the average prediction time represents the running time of every hundred samples in the neural network).

Table 3.
Regression error rate of feature extraction for LES velocity in the dataset.
It can also be observed that almost all the results exhibits a gradual increase in the error rates for the three velocity components. Upon analyzing the RANS and LES data, we found that the average values of the three velocities decrease sequentially, while the variances increase accordingly. Since neural networks require data normalization as a preprocessing step, involving subtracting the mean and dividing by the standard deviation, the normalization of the three velocity components amplifies prediction deviations disproportionately. Consequently, the current situation arises when the comprehensive error rate is calculated using Equation (4).
4.3. Experimental Results of Feature Extraction Mapping for Flow Fields
Based on the experiments mentioned above, it can be concluded that the two-stream network for three velocity components is more advantageous for feature extraction and exhibited better performance. Therefore, we selected the two-stream network for three velocity components as the backbone feature extraction network for training the mapping model.
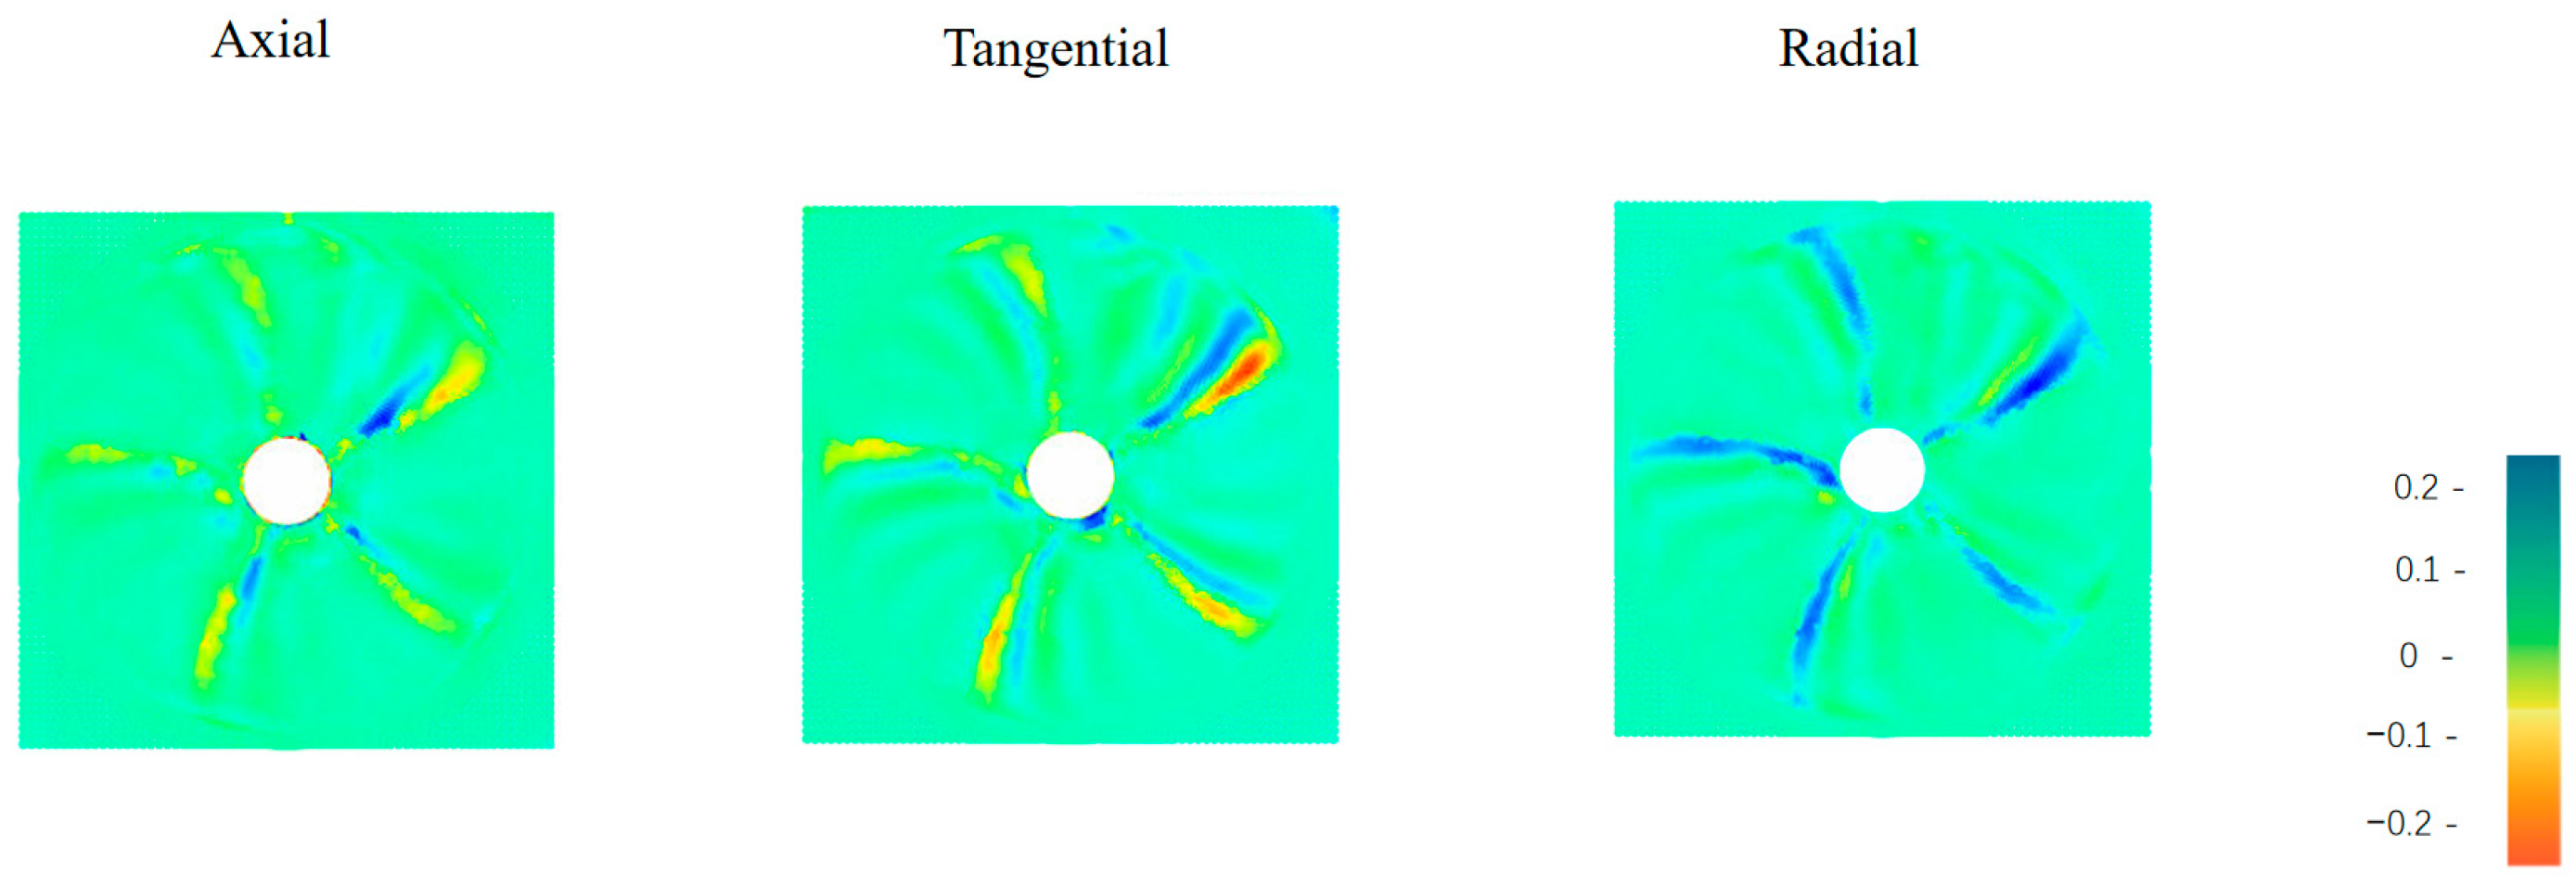
Table 4 summarizes the results of experiments for the mapping module on the test dataset, which consists of approximately 200 samples. In the experiments, we first pre-trained the mapping module using the two types of features obtained and then integrated them into a complete model for training. From the table, it can be observed that all the mapping error rates for the three velocity components are below 10%, indicating excellent model performance. Furthermore, we interpolated the mapping results with the ground truth values and obtained the interpolation plots as shown in Figure 12. It is obvious from the plots that the errors in the predicted data are mainly concentrated around the location of the propeller blades.

Table 4.
The error rate of the mapping between RANS and LES for the dataset.
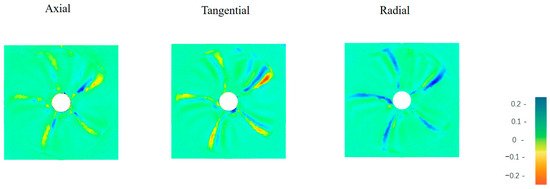
Figure 12.
The distribution of error rates.
We have extracted some data from the propeller center area and presented it in Table 5. Table 5 includes the (x, y, z) coordinates of each point, along with the predicted and actual results for the three speed parameters at those points.

Table 5.
The data from the propeller center area.
4.4. Generalization Verification
We also collected a set of two-dimensional propeller flow simulation data based on different propeller models using OpenFOAM and used it to validate the model’s generalization performance. The computational mesh for the simulations adopts a non-structural cut-volume configuration, and the simulation data are generated using Hexpress software (Version 6.2). The number of grid cells is approximately 11.3 million. In the simulation, the flow characteristics are that the Reynolds number is 1.2 × 10⁷, the CFL (Courant–Friedrichs–Lewy) number is 0.4, the y + value is 24, and the propeller forward speed is described using a coefficient of 1.11. Comparing the model with experimental data, the calculated hull resistance error is 1.3%, the propeller thrust error is −3.7%, and the torque error is 1.2%. Without pre-training, we selected 200 data samples from the dataset to test the model and obtained the error rates, with the results presented in Table 6. Analysis of the results in the table reveals that even for the simulation images of propeller flow at different Reynolds numbers, our model still showed its stability and robustness, enabling effective feature extraction and mapping.

Table 6.
The error rates of RANS and LES mapping in the dataset with different Reynolds numbers.
5. Conclusions
In this work, we proposed a mapping model for the mapping between RANS and LES data based on deep learning methods. The model processes and visualizes both types of flow field data, then utilizes a deep convolutional neural network to extract flow field features and combines them with a nonlinear module for mapping and regression of the two types of flow field features. The experimental results showed that the LES results were accurately predicted by the model based on the RANS simulation data for propeller flow, with an error rate of only 7.92%. By comparing the predicted results produced by the models with actual RANS and LES simulation results, we observed a significant improvement in accuracy and speed with the deep-learning-based mapping model. Furthermore, the model also exhibited good generalization performance across different Reynolds numbers.
The findings of this research provide a new approach and tool for propeller flow simulations. By incorporating deep learning techniques, we can more accurately predict LES results of propeller flow, thereby saving computational power and time required for generating flow simulation data. This has significant practical implications for propeller design and performance analysis.
Although the model proposed in this paper offers advantages in terms of accuracy and speed, it also comes with certain limitations. First, the performance of the model is constrained by the availability of limited training data and the coverage of data ranges, so that it is unable to encompass all propeller operating conditions and design scenarios. Second, deep learning models demand substantial computational resources, which may limit their applicability in resource-constrained environments. Additionally, the black-box nature of the model could raise concerns related to interpretability and trustworthiness. The challenges related to generality, uncertainty modeling, and other aspects also require further research and improvement. Therefore, it is essential to consider these limitations comprehensively in real-world engineering applications.
In summary, this work achieved positive results in mapping RANS and LES flow simulation data for propeller flow using a deep-learning-based approach. This research serves as a valuable example of applying deep learning in the field of fluid mechanics and introduces new ideas and methods for the development of simulation of flow fields.
Author Contributions
Conceptualization, J.J.; Methodology, J.J.; Validation, X.L.; Formal analysis, Y.Y.; Investigation, Y.Y. and J.S.; Resources, L.L.; Data curation, Y.Y.; Writing—original draft, Y.Y.; Writing—review & editing, J.J. and J.S.; Visualization, M.S.; Supervision, J.S.; Project administration, J.J. All authors have read and agreed to the published version of the manuscript.
Funding
The research was funded by National Key R&D Program of China 2022YFB3306200.
Institutional Review Board Statement
No applicable.
Informed Consent Statement
No applicable.
Data Availability Statement
No applicable.
Conflicts of Interest
The authors declare no conflict of interest.
References
- Bathelor, G.; Proudman, I. The effect of rapid distortion of a fluid in turbulent motion. Q. J. Mech. Appl. Math. 1954, 7, 83–103. [Google Scholar] [CrossRef]
- Hunt, J.C.; Carruthers, D.J. Rapid distortion theory and the ‘problems’ of turbulence. J. Fluid Mech. 1990, 212, 497–532. [Google Scholar] [CrossRef]
- KLines, J.; Reynolds, W.C.; Schraub, F.; Gad-El-Hak, M. The structure of turbulent boundary layers. J. Fluid Mech. 1967, 30, 741–773. [Google Scholar] [CrossRef]
- Zhou, H.; Zhang, H.-X. What is the essence of the so-called century contrast, despite the RANS model’s inferior accuracy compared to the former two methods. Sci. Sin. Phys. Mech. Astron. 2012, 42, 1–5. [Google Scholar] [CrossRef]
- Durbin, P.A. Some recent developments in turbulence closure modeling. Annu. Rev. Fluid Mech. 2015, 50, 77–103. [Google Scholar] [CrossRef]
- Mollicone, J.P.; Battista, F.; Gualtieri, P.; Casciola, C.M. Effect of geometry and Reynolds number on the turbulent separated flow behind a bulge in a channel. Physics 2017, 781, 100–133. [Google Scholar] [CrossRef]
- Wilcox, D.C. Reassessment of the scale-determining equation for advanced turbulence models. AIAA J. 1988, 26, 1299–1310. [Google Scholar] [CrossRef]
- Spalart, P.R.; Allmaras, S.R. A one-equation turbulence model for aerodynamic flows. In Proceedings of the 30th Aerospace Sciences Meeting and Exhibit, Reno, NV, USA, 6–9 January 1992; p. 439. [Google Scholar]
- Zhang, Y.; Chan, W.; Jaitly, N. Very deep convolutional networks for end-to-end speech recognition. In Proceedings of the 2017 IEEE International Conference on Acoustics, Speech and Signal Processing (ICASSP), New Orleans, LO, USA, 5–9 March 2017; pp. 4845–4849. [Google Scholar]
- Lin, T.Y.; Roychowdhury, A.; Maji, S. Bilinear convolutional neural networks for fine-grained visual recognition. IEEE Trans. Pattern Anal. Mach. Intell. 2018, 40, 1309–1322. [Google Scholar] [CrossRef]
- Wen, X.; Liu, Y.; Li, Z.; Chen, Y.; Peng, D. Data mining of a clean signal from highly noisy data based on compressed data fusion: A fast-responding pressure-sensitive paint application. Phys. Fluids 2018, 30, 097103. [Google Scholar] [CrossRef]
- Kou, J.; Zhang, W. A hybrid reduced-order framework for complex aeroelastic simulations. Aerosp. Sci. Technol. 2019, 84, 880–894. [Google Scholar] [CrossRef]
- Nathan, K.J. Deep learning in fluid dynamics. J. Fluid Mech. 2017, 814, 1–4. [Google Scholar]
- Tao, W.Q. Numerical Heat Transfer; Xi’an Jiaotong University Press: Xi’an, China, 2001. [Google Scholar]
- GonzaLez, J.; Santolaria, C. Unsteady Flow Structure and Global Variables in a Centrifugal Pump. J. Fluids Eng.-Trans. ASME 2006, 128, 937–946. [Google Scholar] [CrossRef]
- Cheah, K.W.; Lee, T.S.; Winoto, S.H.; Zhao, Z.N. Numerical Flow Simulation in a Centrifugal Pump at Design and Off-Design Conditions. Int. J. Rotating Mach. 2007, 2007, 83641. [Google Scholar] [CrossRef]
- Al-Obaidi, A.R. Analysis of the Effect of Various Impeller Blade Angles on Characteristic of the Axial Pump with Pressure Fluctuations Based on Time- and Frequency-Domain Investigations. Iran. J. Sci. Technol. Trans. Mech. Eng. 2021, 45, 441–459. [Google Scholar] [CrossRef]
- Xiang, B.; Miao, W.P.; Li, C.; Kamada, Y.; Murata, Y.; Shimizu, K.; Nakai, A.; Kasuya, T. Effect of blade solidity on wind field aerodynamic characteristics in vertical axis wind turbine group. J. Eng. Therm. Energy Power 2020, 35, 135–142. [Google Scholar]
- Lu, X.; Ling, G. A large eddy simulation of the near wake of a circular cylinder. Acta Mech. Sin. 2002, 18, 18–30. [Google Scholar]
- Kye, B.; Park, K.; Choi, H.; Lee, M.; Kim, J.-H. Flow characteristics in a volute-type centrifugal pump using large eddy simulation. Int. J. Heat Fluid Flow 2018, 72, 52–60. [Google Scholar] [CrossRef]
- Posa, A.; Lippolis, A. A LES investigation of off-design performance of a centrifugal pump with variable-geometry diffuser. Int. J. Heat Fluid Flow 2018, 70, 299–314. [Google Scholar] [CrossRef]
- Bouris, D.; Bergeles, G. 2D LES of vortex shedding from a square cylinder. J. Wind. Eng. Ind. Aerodyn. 1999, 80, 31–46. [Google Scholar] [CrossRef]
- Edeling, W.N.; Cinnella, P.; Dwight, R.P.; Bijl, H. Bayesian estimates of parameter variability in the k-ε turbulence model. J. Comput. Phys. 2014, 258, 73–94. [Google Scholar] [CrossRef]
- Zhang, Z.J.; Duraisamy, K. Machine learning methods for data-driven turbulence modeling. In Proceedings of the AIAA Computational Fluid Dynamics Conference, Moffett Field, CA, USA, 22–26 June 2015; pp. 2015–2460. [Google Scholar]
- Parish, E.J.; Duraisamy, K. paradigm for data-driven predictive modeling using field inversion and machine learning. J. Comput. Phys. 2016, 305, 758–774. [Google Scholar] [CrossRef]
- Wang, J.-X.; Wu, J.-L.; Xiao, H. Physics-informed machine learning approach for reconstructing reynolds stress modeling discrepancies based on DNS data. Phys. Rev. Fluids 2017, 2, 034603. [Google Scholar] [CrossRef]
- Weatheritt, J.; Sandberg, R.D. A novel evolutionary algorithm applied to algebraic modifications of the rans stress–strain relationship. J. Comput. Phys. 2016, 325, 22–37. [Google Scholar] [CrossRef]
- Pope, S.B. A more general effective-viscosity hypothesis. J. Fluid Mech. 1975, 72, 331–340. [Google Scholar] [CrossRef]
Disclaimer/Publisher’s Note: The statements, opinions and data contained in all publications are solely those of the individual author(s) and contributor(s) and not of MDPI and/or the editor(s). MDPI and/or the editor(s) disclaim responsibility for any injury to people or property resulting from any ideas, methods, instructions or products referred to in the content. |
© 2023 by the authors. Licensee MDPI, Basel, Switzerland. This article is an open access article distributed under the terms and conditions of the Creative Commons Attribution (CC BY) license (https://creativecommons.org/licenses/by/4.0/).


