1. Introduction
According to an EU Health report from 2014 [
1], cardiovascular diseases (CVDs) account for almost 40% of all deaths in EU countries and are present in more than 30% of the population in the United States (US) [
2]. Therefore, many studies have been conducted in this area in the past to better understand the cardiac cycle and vasculature. Special interest is given to cardiomyopathies, which is a general name for all anomalies in the ventricular endocardium leading to a stretched, thickened, or stiff heart chamber. There are four types of cardiomyopathies [
3] but the greatest attention is paid to hypertrophic (HCM) and dilated (DCM) [
4]. HCM is characterized by thickened heart muscle that produces an increased heart size. It is estimated that HCM occurs in 1 in 500 adults, mostly young healthy people, and athletes, and is the leading cause of sudden death. DCM is characterized by the dilation of the heart, with the muscle wall progressively thinning. Decreased systolic function and an ejection fraction < 50% are common in DCM [
5].
The treatment of cardiomyopathy using existing types of therapies may only partially improve outcomes; hence, it is still necessary to introduce new and efficient types of treatment. Different types of cardiomyopathies require the use of different drugs and methods of treatment. With the recently developed MUSICO platform [
6,
7], which is capable of simulating the effects of genetic mutations on muscle activity, it became possible to understand how small molecules (drugs) affect muscle contraction. According to simulations of the muscles at the micro level performed using the MUSICO software (
https://www.solindies.com/, accessed on 23 October 2023) and based on the main activity performed by drugs, it was found that drugs can be divided into three groups: namely, drugs that modulate the calcium transient and affect muscle contractility (disopyramide and digoxin), drugs that change kinetic parameters (mavacamten and dATP), and drugs that affect macroscopic parameters (Entresto
®),
Table 1.
Disopyramide is a drug that slows the speeding-up of the LV ejection flow, extends the flow acceleration time [
16], and in HCM patients, can affect the level of Ca
2+ transient, which reduces the contractility of the heart muscle [
8]. Digoxin can be used in DCM patients, and it increases the intracellular calcium concentration transient [
17,
18,
19], but also myocardial contractility, stroke volume, and blood pressure [
9]. It is proven that mavacamten affects the contractility of the heart muscle, and produces a significant decrease in tension during resting [
4,
20]. The influence of this drug is still under investigation in HCM patients. 2-deoxy adenosine triphosphate (dATP) is proven to be a molecule with a lot of potential in the treatment of DCM [
21,
22]. dATP has been shown to increase the contractility of heart tissue in heart failure patients [
12], and systolic pressure in heart failure [
13]. Finally, it was shown in [
15] that Entresto
® contributes to the remodelling of the walls of the heart chambers and to changes in the elasticity of blood vessels, which leads to a decrease in the resistance to blood flow. The changes in calcium concentration in the muscle cells, obtained for the aforementioned drugs and presented in
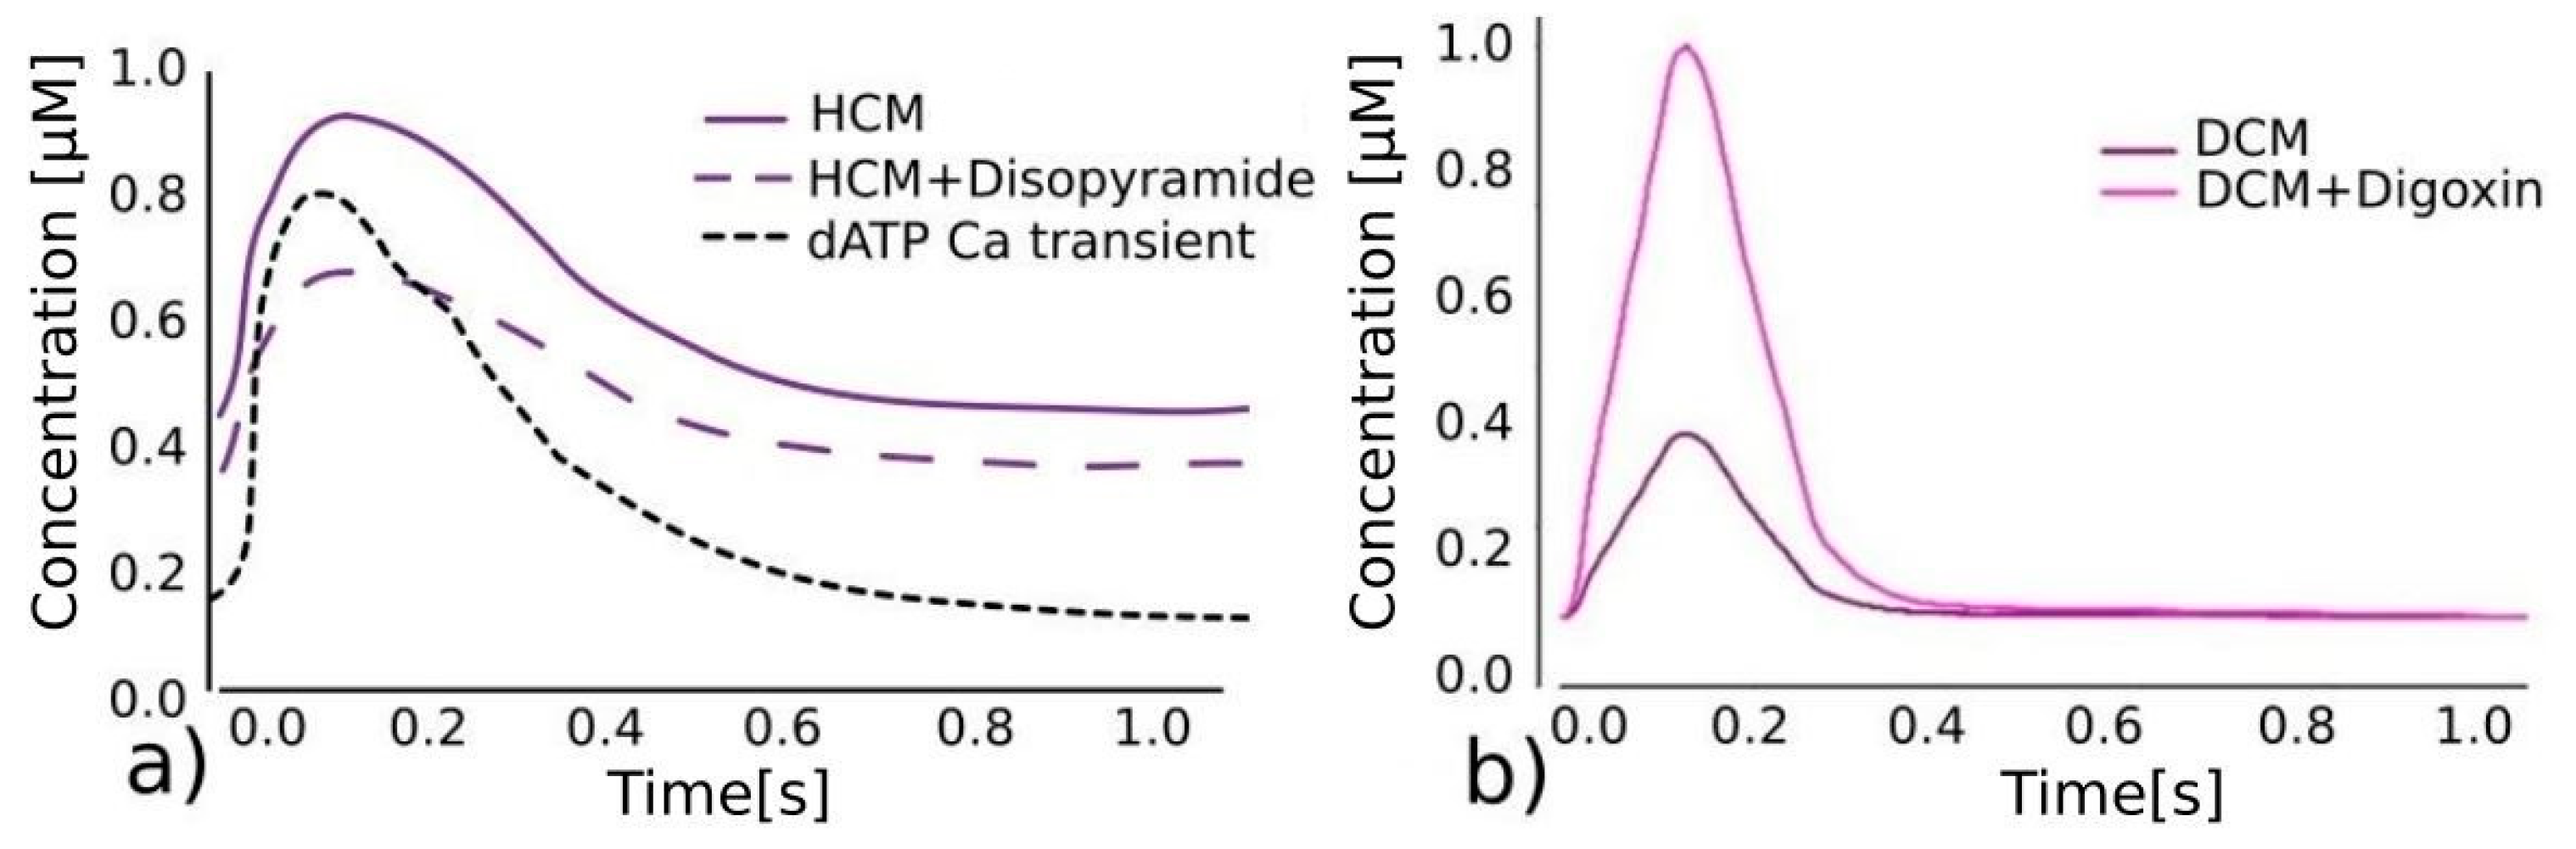
Figure 1, represent the basis for further application in in silico clinical trials.
In silico clinical trials allow for testing drugs in “virtual patients” using computational modelling and a variety of simulation techniques. Among the computer methods, the finite element (FE) method is the most frequently used for investigating the effects of various drugs on cardiac function, as described in papers [
4,
23]. A recently introduced methodology presented in [
24] couples macro and micro scales using the FE modelling of fluid–solid interaction (FSI) and molecular drug interactions in the cardiac muscle cells using the MUSICO [
6] platform. This integrative modelling approach couples several temporal and spatial scales [
7] from pathological to tissue and organ levels. The presented drugs from
Table 1 are simulated in [
24] and an assessment of the effects of the drugs on pressure and volume changes is presented for simplified geometries of the relevant HCM and DCM patients. The biophysical muscle models integrated into MUSICO are based on the underlying molecular processes behind muscle contraction. Using the MUSICO solver integrated with the FE code, simulation of the muscle function itself requires considerable computational power. Taking into account the coupling of this approach with FE, where simulations of complex heart models during the heartbeat cycle would require the usage of a large number of finite elements, it is necessary to think about coupling methods that will lead to high-performance computations, which opens up the possibility of real clinical application.
Figure 1.
Effects of different drugs on calcium transient. (
a) Referent calcium transient predictions for HCM [
6], disopyramide lowering total calcium transient (purple dashed line) [
4] and dATP significantly lowering diastolic calcium concentration, reducing wall stiffness, and increasing contractility (black dashed line) [
25]. (
b) Calcium transient predictions for DCM without (purple) and with (pink) digoxin, significantly lowering calcium concentration [
24].
In this paper, we present an efficient FE modelling approach integrated with the SILICOFCM [
26] platform for the investigation of the influence of different drugs on changes in pressure and stroke volume. As opposed to [
24], where biophysical muscle models were used, we here use the phenomenological Hunter’s muscle model and the calcium transient vs. time curves directly obtained using MUSICO simulation for different simulated drugs. Before examining the effects of the drugs, we investigated the influences of different (1) calcium concentrations, (2) inlet and outlet velocities, and (3) wall stiffnesses on the cardiac contraction, which has not been carried out before with this type of left ventricle model. In addition, the corresponding PV diagrams for different Ca
2+ concentrations, velocities, and pressure fields with analysis of the ejection fraction and wall stiffness have been presented, to show that a computational model can mimic, at a macroscopic level, the effects that different drugs can have on the cardiac cycle.
2. Materials and Methods
The computer tools used to model the heart usually involve several phenomena: blood flow, wall movement, and the transport of electrical signals. Fluid dynamics is used to model the blood flow within the heart ventricle, while solid mechanics is used to calculate the deformation of the myocardium. The movement of the fluid in the ventricles of the heart is considered an incompressible laminar fluid flow described according to [
27] using Navier–Stokes and continuity equations:
where
is the viscosity of the fluid,
is the density of the fluid,
is the velocity field within the space,
is the pressure within the fluid, and the volumetric forces per unit volume in direction
are
[N/m
3]. These equations are transformed by using the standard Galerkin method [
27,
28] in the balance equations of a finite element. The final form of this equation is solved for increments of blood velocity and pressure
and
within the iteration “
I” and the current time step “n + 1” of the simulation, with time step duration Δt, the velocity vector from the last time step
, the velocity
and pressure
from the previous iteration “i − 1”, the stiffness matrix
K (details about matrices
and
are given elsewhere [
27]), and mass matrix
, to find the vectors of velocity
and pressure
at the end of the current time step “n + 1”.
The mechanical stresses in the heart wall can be divided into passive,
, which depend on the material deformation and tissue constitutive relationships, and active,
, which are the consequence of changes in calcium concentration in the sarcomeres due to the transport of electrical signals. To determine the passive response of the heart muscle, we used a recently introduced model [
29] that is based on the biaxial and shear experimental curves obtained in the study that is published in references [
30,
31]; see
Figure 2. In this approach, experimentally measured constitutive curves [
30] are directly used in the computer model presented in [
29] to calculate the internal stresses. Based on the stretches in the fibre and sheet directions, and the amount of shear in the material point of the continuum and the normal and shear stresses are calculated directly from the curves presented in
Figure 2. Then, the tangential moduli
and
are calculated based on the stress increment with respect to the strain increment within the time step, and finally, the constitutive matrix C is calculated as
where
are the tangent shear moduli. Since, using the previous procedure, loading in one material direction would not produce deformations in the other two coordinate directions, coupling of the local stresses is then performed using the penalty method [
28] and a novel formulation for compressible material behaviour [
29].
The cardiac muscle is activated during systole, creating mechanical tension in the muscle cells. To determine the active stresses, we use the most common relationship between active stress and calcium concentration provided by Hunter and colleagues [
32]:
where details about the coefficients used in Equation (4) are given in [
32], while
is the calcium concentration which can be used directly from
Figure 1 for different drugs. The main advantage of Hunter’s model is that it is computationally efficient, which makes it more suitable for practical use in comparison to biophysical models. While it can take several hours to run a finite element simulation with a biophysical muscle model at the micro level, it only takes a few minutes to run the same simulation with Hunter’s muscle model.
Figure 2.
(
a) Experimental constitutive curves as a result of biaxial test [
30]. (
b) Experimental constitutive curves of shear stress vs. amount of shear [
30,
31]. (
c) FSI algorithm used for coupled fluid flow and solid mechanics [
33].
Figure 2.
(
a) Experimental constitutive curves as a result of biaxial test [
30]. (
b) Experimental constitutive curves of shear stress vs. amount of shear [
30,
31]. (
c) FSI algorithm used for coupled fluid flow and solid mechanics [
33].
Solid deformations are calculated using the force balance equation [
28], and the final form of the incremental–iterative equation for the force balance of the finite element within the solid domain is then written as [
27]
where, in addition to the explanation provided for Equation (3),
is a vector of the external nodal forces acting on the element at the iteration “
i”, and
and
are the nodal velocities at previous iteration “
i − 1
” and at the start of the time step
t, respectively. The vector of the internal nodal forces
is a function of the stresses calculated from the constitutive curves presented in
Figure 2, while the matrix
takes into account the tangent constitutive matrix
based on the curves from
Figure 2. The details regarding the calculation of passive stresses based on the constitutive curves and computational procedure for solving the coupled motion of the heart are given in [
29,
34,
35].
The loose-coupling FSI interaction procedure described in [
33] is used for the coupling of fluid flow and solid mechanics. Fluid and solid fields are modeled separately using two different solvers: computational fluid dynamics (CFD) and computational solid dynamics (CSD); see
Figure 2c.
In this procedure, the same velocity values at the solid–fluid interface are assumed for both components. Within one time step of the numerical simulation, we first solve the equations for the fluid field, and the resulting nodal forces, for an element
E, at the fluid–solid boundary are calculated as
where matrices
,
, and
are the same as from Equation (3). The resulting forces
are then used as the boundary conditions to solve Equation (5) for the solid deformations. As a result of the solid deformations, the corresponding velocity field at the fluid–solid boundary is used as a boundary condition in the successive fluid flow calculation of Equation (3). The iterative procedure is performed successively until the convergence criteria are achieved for both fluid flow and solid deformation. Because the heart is considered to undergo large deformations, a so-called arbitrary Lagrangian–Eulerian (ALE) formulation for fluid is used [
36]. This method is convenient for avoiding the re-meshing procedure and modeling the movement of the fluid. The fluid is therefore treated as a deformable domain in that phase. The fluid domain is solved for displacements, a linear elastic material model is used, and the zones that are constrained are within the left ventricle. Other parts of the model that do not have a solid domain boundary are also constrained to displacements. As a result, the displaced FE mesh of the fluid domain is used for the next step of the FE simulation.
3. Results
The computational procedure presented in the Materials and Methods section is implemented in our FE solver PAK [
37], supported by the pre- and post-processing user interface software CAD Solid and Field [
38] (
https://github.com/miljanmilos/CAD-Solid-Field, accessed on 23 October 2023). The two virtual patients used in this study are generated based on the geometric data obtained from two patients with developed HCM and DCM. A simple parametric model of the left ventricle consists of a base part, aortic and mitral valves, and a connecting part (the junction between the base and the valves; see
Figure 3a). Each geometric component of the model has a length, radius, and number of layers (division parameter). Two different left ventricle (LV) models are generated as presented in
Figure 3a,b: (1) a model with a shorter base length component mimicking the HCM case (
Figure 3a), and (2) a model with a longer base length component and thinner lateral wall, mimicking the DCM case (
Figure 3b). A fluid domain (coloured blue in
Figure 3a,b) is bordered by a solid wall (coloured black in
Figure 3a,b) in the FE model. The solid wall is constrained at its top (“Solid top” in
Figure 3a,b), and the inlet velocity is prescribed at the inlet mitral valve cross-section, while the outlet velocity is prescribed at the aortic valve cross-section. The functions for the prescribed inlet and outlet velocities are shown in
Figure 3c. In the LV parametric model, the base radius is 25.31 mm, the base part length is 79.47 mm, the connection part length is 10.11 mm, the mitral valve cross-section radius is 12.1 mm, the mitral branch length is 18.1 mm, the aortic valve cross-section radius is 14.9 mm, the aortic branch length is 18.1 mm, and the solid wall thickness is 10 mm. The mitral and aortic branches have lengths that are larger in dimension in comparison to the thickness of the aortic and mitral valves to prevent possible velocity fluctuations in these zones. The time step used in the FE simulation is 20 × 0.05 s.
Figure 3d shows a one-layered solid representation of the fibres and their orientations. An algorithm is used to calculate the fibre direction automatically, according to [
39]. The fibres are helical and their angles vary from 60° in the endocardium (yellow arrows in
Figure 3d) to −60° in the epicardium (red arrows in
Figure 3d). A linear distribution of the angle along the thickness of the LV wall is assumed. In the first step of our fibre generation algorithm, the inner (endocardium) and outer (epicardium) surfaces of the LV wall are extracted. At each node of the model, we calculate the distances to the extracted surfaces. Based on the ratio of the distance to the epicardium and the total thickness of the wall, we vary the angle at which the fibre should be generated. Finally, the fibre muscle is generated by rotating the tangential vector to the wall surface by the calculated angle.
Here, we present the results of the simulations with two LV geometries and accompanying scenarios for the LV models that closely resemble the HCM and DCM scenarios. Each case addresses the following three possibilities: (1) the effect of Ca
2+ concentration, (2) the effect of the Holzapfel scale factor (wall stiffness), and (3) the effect of the inlet and outlet velocities. Finally, we present the effects on ejection fraction of different wall stiffness and inlet/outlet velocity values.
Figure 4a shows the pressure distribution inside the HCM case LV model from
Figure 3a across the 1.0 s time cycle, while
Figure 4b shows the distribution of velocity within the fluid.
Left ventricular pressure–volume (PV) loops can be significant indicators of different systolic or diastolic dysfunctions or valve diseases. The PV diagram is generated by plotting the left ventricle pressure (LVP) against the left ventricle volume (LV Vol) within the cardiac cycle. The change in pressure and volume is measured in the base zone of the parametric LV model. Additional indicators that are commonly used are (a) stroke volume, represented as the amount of blood pumped out of the left ventricle in one cardiac cycle, and (b) the ejection fraction (EF), the proportion of the blood ejected by the heart. The EF is usually calculated using the equation (EDV-ESV)/EDV, where EDV is the end-diastolic volume (EDV), while ESV is the minimum left point as the end-systolic volume [
33].
To show the applicability of the model, hypothetic scenarios are assumed using triangular, parabolic, and steep Ca
2+ concentration functions as shown in
Figure 5a. Additionally, shifted and wider parabolic Ca
2+ concentration profiles are shown in
Figure 5b.
The effects of hypothetic triangular, parabolic, and steep Ca
2+ concentration functions on the PV diagram for the HCM model are shown in
Figure 6a, while the effect of shifted and wider parabolic Ca
2+ concentration profiles on the PV diagrams are shown in
Figure 6b.
Since digoxin can increase myocardial contractility, while Entresto can affect the elasticity and stiffness of the walls of the blood vessels and heart chambers, we also examine the influence of wall stiffness on the cardiac cycle. The nominal wall stiffness of the heart myocardium is represented by the average constitutive curves in
Figure 2a,b. In the case of the HCM model, the PV diagrams for 50%, 80%, 120%, and 130% of the nominal wall stiffness are shown in
Figure 6c. Disopyramide can affect the LV ejection flow, while digoxin can affect the blood pressure. These conditions can be simulated by changing the values of the inlet and outlet velocities at the mitral and aortic valves. The nominal inlet and outlet velocity functions that are prescribed at the mitral and aortic cross-section are already shown in
Figure 3a. We investigated the effects on the PV diagram of 120% and 75% of the nominal inlet velocities while keeping the outlet velocity unchanged (
Figure 3a—outlet velocity), and the effects of 120% and 75% of the nominal outlet velocity with unchanged nominal inlet velocity values (
Figure 3a—inlet velocity). The influence of the velocity variations on the PV diagrams, in the case of the HCM model, is shown in
Figure 6d.
The same analysis is performed for the DCM model from
Figure 3b. The effects of triangular, parabolic, and steep Ca
2+ inlet concentration functions on the PV diagrams are shown in
Figure 7a. In the case of a shifted and wider parabolic Ca
2+ concentration (
Figure 6c), the PV diagrams are shown in
Figure 7b. The PV diagrams for 50%, 80%, 120%, and 130% of nominal wall stiffness are shown in
Figure 7c (nominal value shown in
Figure 4). In
Figure 7d, we present the influence of changes in the inlet and outlet velocities on the PV diagrams.
The dependence of the ejection fraction in the DCM and HCM models on the inlet and outlet velocity is shown in
Figure 8a,b. The effects are similar for both HCM and DCM. The ejection fraction increases for larger inlet and outlet velocity values. The effect of heart wall stiffness on the ejection fraction is shown in
Figure 8c. Here, we can see that the ejection fraction increases with stiffness for both models. In
Figure 8d, we show calcium concentration functions corresponding to four drugs: digoxin, disopyramide, mavacamten, and dATP. The corresponding PV diagrams for the DCM model are shown in
Figure 8e.
4. Discussion
A coupled FSI model is used to simulate the cardiac cycle of virtual patients with hypertrophic and dilated cardiomyopathy. The simulations are performed using the PAK-Bio FE solver while the parametric LV models are generated using the in-house CAD Solid and Field interface software. A simple parametric “virtual patient” model can be easily adapted to patient-specific parameters and run for a range of clinical metrics detected using MRI and catheterization. The presented approach using variations in LV geometry and simulations, including the effects of various parameters on the PV diagrams, is directly linked to the drug effects on cardiac function obtained using the MUSICO platform. The PV diagrams, velocity, and pressure fields are calculated for different Ca2+ concentrations, wall stiffnesses, and inlet and outlet velocities. A quantitative evaluation of the effects of various medicines (digoxin, dATP, disopyramide, and mavacamten) on the cardiac output, encompassing both systolic and diastolic pressures, as well as the ejection fraction, is also provided by the FE simulations.
As can be seen from
Figure 4a, the mitral valve pressure reaches its greatest value at t = 0.4 s, during the first 0.5 s of the cycle, as fluid is pumped into the ventricle and its volume rises. When the first part of the cardiac cycle finishes and the mitral valve closes, the ventricle contracts (contraction is shown towards the end of the systole at 0.9 s in
Figure 4a), and fluid flows out of the aortic valve. Regarding the velocity field, in
Figure 4b, during diastole, there is a noticeable peak inside the input branch (mitral valve). During systole, the peak is noticeable at the output branch (aortic valve). When the wall contracts and fluid starts to flow out, the bottom part of the wall deforms the most. The velocities diminish over the remaining time as the solid wall progressively reverts to its initial state.
As can be seen from
Figure 6a and
Figure 7a, the triangular calcium concentration has the slowest decrease rate. Then, the LV muscle is activated for a prolonged period and, as a result, the surface bonded by the PV curve is large and therefore the amount of blood ejected from the LV is high. The parabolic calcium concentration function has the earliest rise of calcium and, since the muscles are activated prematurely, the isovolumetric contraction occurs earlier with respect to the other two cases. With the steep concentration function, less blood is ejected than with the triangular function, and the muscle is activated later than with the parabolic function. In the case of a shifted and wider parabolic Ca
2+ concentration (
Figure 6b and
Figure 7b), the calcium concentration rises with the shifted parabolic function, and the muscles are activated later, leading to a delayed isovolumetric contraction. With a wider parabolic Ca
2+ concentration, the decrease rate is slower and more blood is ejected during systole.
By analysing the influence of the wall stiffness on the PV diagrams,
Figure 6c and
Figure 7c, when the stiffness is lower, we can see that the pressure during isovolumetric contraction and systole is lower, while the total volume during diastole is increased. By contrast, with higher wall stiffness, larger pressure is generated during isovolumetric contraction, as well as a smaller total volume during diastole. Regarding the influence of the inlet velocity value, as expected, when the outlet velocity is lower, less blood is ejected during systole. With 75% of the nominal inlet velocity, the total volume during diastole is also lower in comparison to the case with the nominal inlet velocity. A similar linear trend occurs when the inlet and outlet velocities are increased.
By comparing the models with DCM and HCM, we may observe from
Figure 6 and
Figure 7 that the application of different models affected visible changes in volume but that there were negligibly small differences in pressure change (max and min pressure values). The analogous effects can be seen by comparing the results in
Figure 6a,b and
Figure 7a,b for different concentration profiles, and
Figure 6c,d and
Figure 7c,d regarding the influence of the wall stiffness and inlet/outlet velocities.
In the introductory section, we described the mechanism for basic groups of drugs like ACE inhibitors, ARBs, nitric-oxide-induced vasodilators, etc. We have shown that these drugs influence cardiac PV diagrams and the ejection fraction. Additionally, we have investigated the influence of Ca
2+ concentration profiles, heart wall stiffness, and the inlet/outlet velocities on heart performance. It was shown that drugs affect one or more heart parameters and properties. As can be seen from
Figure 6a and
Figure 7a, for triangular, parabolic, and steep time Ca
2+ time functions, with calcium concentrations that have the slowest decrease rate (i.e., triangular), muscles are activated for a prolonged period and, as a result, more blood is ejected from the left ventricle. When calcium starts to rise prematurely, which is the case for parabolic functions, the isovolumetric contraction occurs earlier than compared to other Ca
2+ concentrations. The results from
Figure 6c and
Figure 7c show lower pressure during isovolumetric contraction and systole with lower stiffness of the left ventricle wall. In
Figure 8c, we show that a similar trend occurs with the two model geometries—the ejection fraction increases with wall stiffness. For the lower outlet velocity, less blood is ejected during systole, and vice versa. Also, the stroke volume during diastole is increased with an increase in the inlet velocity.
We also showed the influence of drugs on the cardiac cycle, in
Figure 8d,e. The systolic pressure and ejection fraction rise as a result of the rise in intracellular calcium concentration, which also causes an increase in heart wall tension. It can be seen from
Figure 8d that the calcium concentration is highest with digoxin, resulting in the largest force generated by the muscles in comparison to with disopyramide, mavacamten, and dATP. In analysing the PV diagrams for cases using these four drugs, we find the stroke volume is also the largest with digoxin. On the other hand, pressure rises slower with digoxin during systole in comparison with the other drugs. With disopyramide, the calcium decrease rate is the slowest during systole compared to the other drugs. Mavacamten produces a similar calcium concentration and similar effects to disopyramide. With dATP, less calcium is produced compared to with disopyramide, which results in a smaller ejection fraction. The decrease rate of the calcium during systole is larger with dATP than with mavacamten and disopyramide; therefore, the pressure is greater with dATP than with mavacamten and disopyramide.
Our computational model provides a valuable tool for studying the effects of drugs on the properties of cardiac tissue, specifically in the context of cardio-myopathy-afflicted heart cycles. However, it is essential to acknowledge the inherent complexities and limitations associated with any in silico model. While our model attempts to capture the key characteristics of cardiac myopathies, it is vital to recognize that it simplifies the intricate biological and physiological processes occurring in real patients. The representation of specific heart diseases in our model is based on well-established parameters and clinical data, but it does not account for the full spectrum of individual variation seen in real patients. Conducting in silico trials to explore how drugs impact the properties of cardiomyopathy-afflicted heart cycles may provide valuable insights into assessing the dynamic fluctuations within the parameters and conditions accounted for by our model. Yet, it remains challenging to predict numerous scenarios, such as the uncharted metabolic pathways influenced by drugs, leading to consequences for the mechanics and electrical characteristics of the simulated cardiac tissue. Furthermore, there is an inherent trade-off between model complexity and computational efficiency. The more detailed and patient-specific the model, the more time-consuming and resource-intensive the simulations become. It should also be emphasized that our model is not geometrically precise, and the results may differ from the real state of the patients, but these simplified geometries can be useful in offering some insight into the left ventricle mechanical response. While our model may not perfectly predict medical outcomes, it can be considered a complementary tool for medical practitioners; it is an alternative to detailed and patient-specific models, which are very time-consuming. By applying simple models like this, which can take into account the dimensions of the characteristic parts of the LV, it is possible to perform a quick analysis on a huge number of patients. Our models cannot perfectly predict medical outcomes but they can be used by medical practitioners to secure a better understanding of how drugs and conditions can affect the cardiac cycle of the left ventricle. Even though we used a less precise, regarding the details about fully physical and biological properties, but computationally efficient phenomenological muscle model, it can be seen that the presented computational model can mimic, on a macroscopic level, the effects that different drugs can have on the cardiac cycle. Heart preparations offer insights into the heart’s altered geometry and structure. Isolated hearts and tissue samples reflect the anatomical changes seen in these diseases, which can help create accurate finite element models that mimic the structural abnormalities observed in diseased hearts. Moreover, heart preparations allow for the measurement of disease-specific material properties, such as variations in contractility, stiffness, and elasticity within the cardiac tissues [
40,
41,
42,
43,
44,
45,
46,
47]. These properties can be used for fine-tuning finite element models to faithfully represent the mechanical characteristics unique to HCM and DCM. It is also important to highlight that our simulated outcomes do not take into account the potential negative impact of the medications on other bodily organs.
Our future work might go in the direction of developing more anatomically precise models, and detailed examination of electrophysiological effects on calcium concentration and consequently muscle contraction. When analysing the various possibilities, it is necessary to carry out several numerical experiments, which can require a significant amount of computing power. Even though our LV models do not have a particularly large number of finite elements, running a single numerical experiment can still take a few minutes. As a result of the fact that multiscale simulations can be further accelerated using surrogate modelling, our future study might involve the use of neural networks to create data-driven and physics-informed surrogates of simulations or their parts. A data-driven surrogate modelling approach requires the collection of input and output data from finite element simulations. Based on the collected data, ML models can be trained to replace numerical simulations or their components. In their basic formulation, physics-informed neural networks (PINNs) do not require labelled data. This approach requires minimizing the residual of partial differential equations, and their initial and boundary conditions, based on the progress made in the field of automatic differentiation. After successful training, ML models can produce results faster than numerical methods. Combining machine learning methods with numerical simulations could enable efficient and precise predictions of drug influence on cardiac behaviour.


 ,
, 


