Featured Application
In the future, this method can help clinicians to diagnose the approximate location of intracranial hemorrhage.
Abstract
Intracranial hemorrhage (ICH) is a hemorrhagic disease occurring in the ventricle or brain, but we found that the U-Net network has poor segmentation performance for small lesion areas. In order to improve the segmentation accuracy, a new convolutional neural network called MSRL-Net is proposed in this paper to accurately segment the lesion regions in the CT images of intracranial hemorrhage. Specifically, to avoid the problem of missing information in the downsampling process, we propose a strategy combining MaxPool and SoftPool. In addition, the mixed loss function is used to optimize the unbalance of medical images. Finally, at the bottleneck layer, an MRHDC module is designed to represent the rich spatial information in the underlying features, in order to obtain multi-scale features with different receptive fields. Our model achieves 0.712 average Dice on a dataset. The experimental results show that this model has a good segmentation effect and potential clinical prospects.
1. Introduction
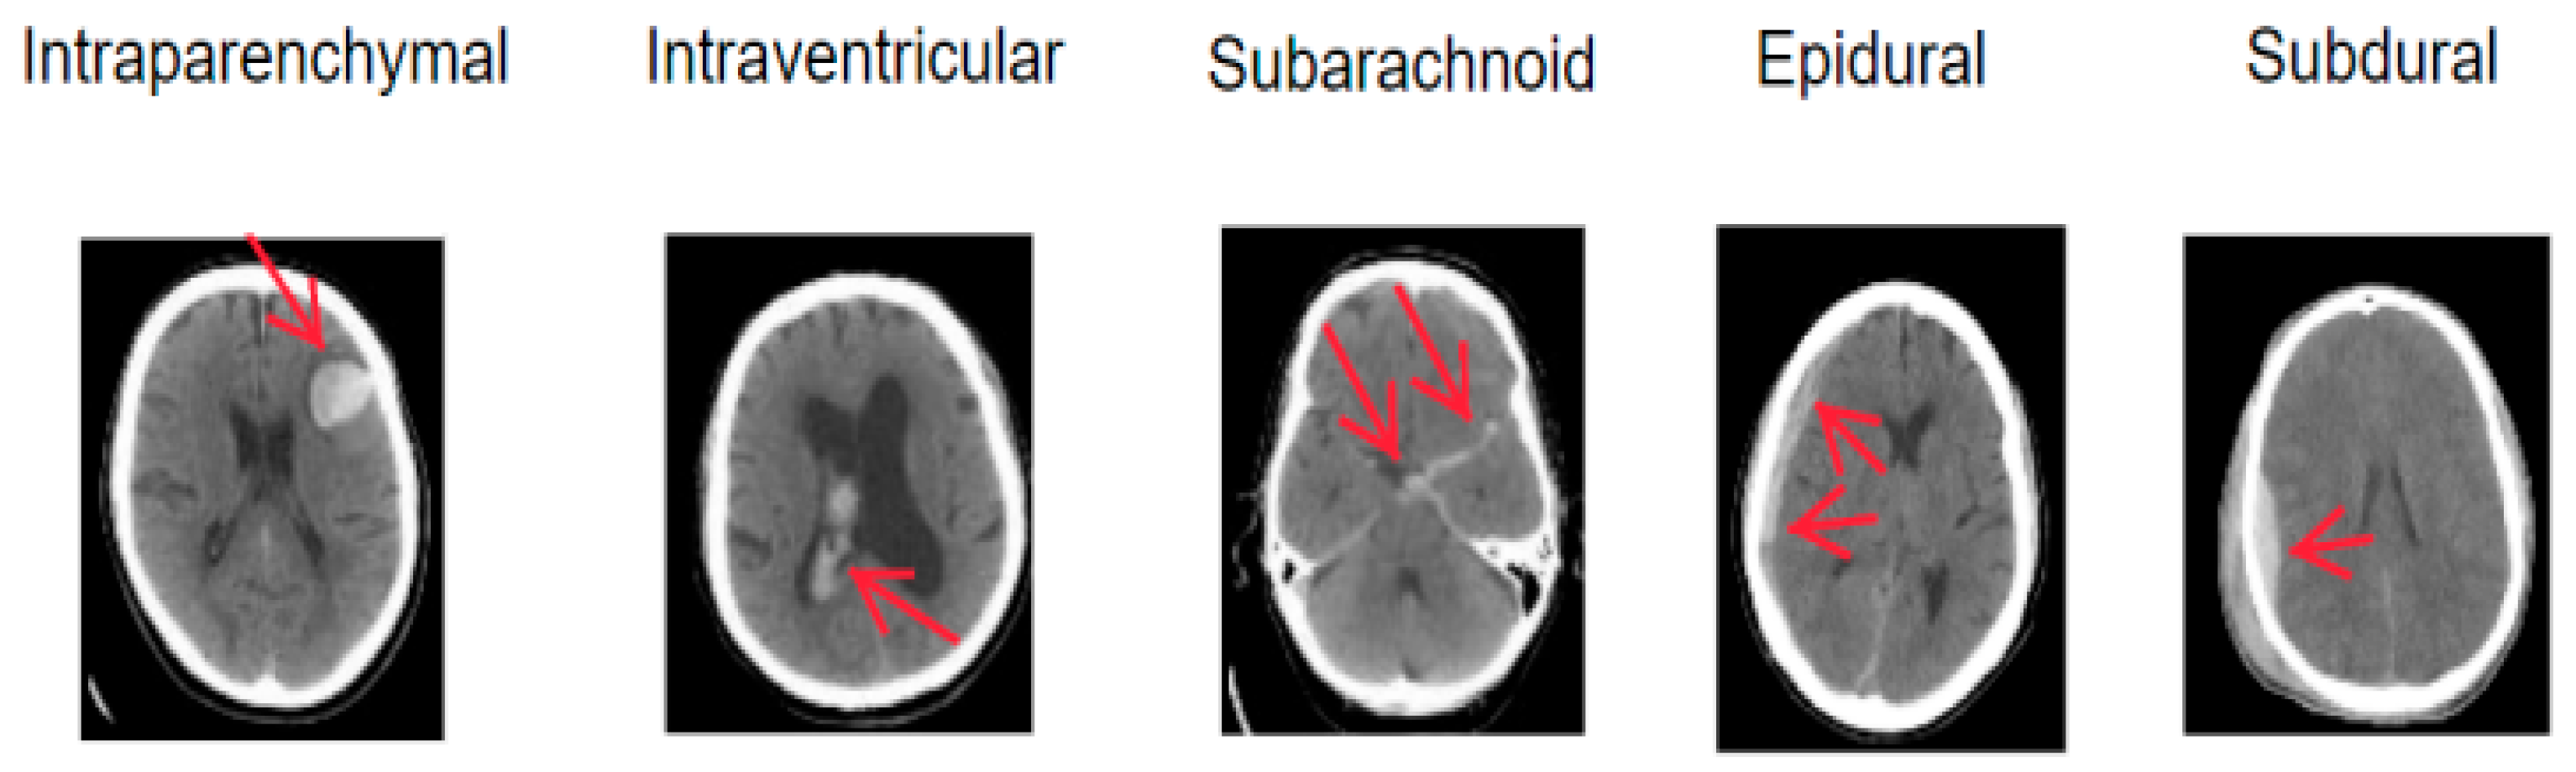
Intracranial hemorrhage (ICH), also referred to as hemorrhagic cerebrovascular disease or hemorrhagic stroke, arises from blood leakage into the cranial cavity due to a ruptured cerebral vessel [1]. It exhibits a high fatality rate and recurrence rate and imposes severe health complications [2,3]. ICH typically results from a blood vessel rupture in the brain, leading to damage to brain cells and application of pressure on surrounding neural tissue. Hyperthermia often co-occurs with ICH [4], increasing brain oxygen consumption and reducing oxygen supply. ICH can be categorized into five subtypes based on the hemorrhage location: Parenchymal Hemorrhage (IPH), Intraventricular Hemorrhage (IVH), Subarachnoid Hemorrhage (SAH), Epidural Hemorrhage (EDH), and Subdural Hematoma (SDH). The five ICH subtypes are illustrated in Figure 1. The treatment options and severity of different ICH subtypes vary, but early diagnosis and intervention significantly enhance survival prospects. Thus, it is crucial for physicians to accurately assess the hemorrhagic region and devise appropriate treatment plans.
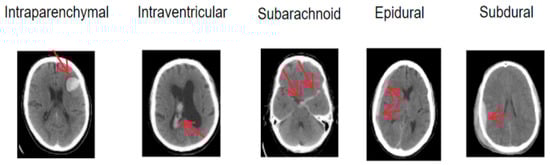
Figure 1.
Schematic diagrams of intracranial hemorrhage types.
Computed tomography (CT) [5] is a non-invasive medical imaging modality favored for its affordability, high sensitivity to blood, and rapid result acquisition. As such, CT scans are the preferred method for initial ICH diagnosis [6]. Although ICH can be classified into various stages based on bleeding duration, the Hounsfield Unit (HU) value of blood markedly differs from that of other brain tissues. Consequently, ICH diagnosis primarily relies on intracranial CT images. Physicians typically examine and analyze patients’ CT scans to ascertain the general affected area and formulate corresponding treatment plans. However, this process is labor-intensive and the accuracy of the analysis depends on the clinician’s expertise. Discrepancies often arise between different doctors’ conclusions. In remote regions, where medical resources are scarce, few doctors possess the skills to interpret CT images, and specialized radiologists may be absent. Misdiagnoses can severely impact patients’ subsequent treatments. The situation will improve to some extent in hospitals with relatively rich resources; however, due to the number of doctors or the current workload, the misdiagnosis rate is still high [7]. To correct this, it is necessary to develop an algorithm that is capable of automatically segmenting the focal area.
As artificial intelligence continues to advance, computer-aided diagnosis has garnered significant attention, becoming a focal point in current research. Computer-aided algorithms enable automated analysis of medical influences, generating detection reports for physicians to review CT scans, thereby enhancing their work efficiency, reducing pressure, and decreasing misdiagnosis rates. Consequently, developing an accurate ICH diagnostic support system is essential. In the prevalent deep learning environment, numerous researchers have investigated automatic ICH segmentation, leading to the creation of various medical image segmentation networks, such as U-Net and U-Net++ [8]. However, these classical networks still face challenges in clinical trials. They primarily focus on large lesion areas, struggling to identify small lesion areas. For instance, CT images’ complexity and cerebral hemorrhage features, resembling the skull, pose considerable difficulties for automatic segmentation. Moreover, the ICH lesion area’s small, intricate shapes and unfixed locations reduce segmentation accuracy. To address these issues, this study develops a pure convolution-based U-Net network for automatic ICH segmentation. Because the U-Net network has fewer parameters and combines low-resolution information (to provide object category recognition basis) and high-resolution information (to provide accurate segmentation and positioning basis), it is perfectly suitable for medical image segmentation. The specific approach is as follows:
- Preprocessing CT images to remove skull features using OpenCV, thereby highlighting lesion areas without interference from other factors.
- Designing an MSpool module to replace traditional max-pooling, reducing information loss during network downsampling and enhancing segmentation accuracy.
- Adopting a multi-objective joint loss function to address pixel classification imbalance.
- Incorporating an MRHDC module into the encoder’s bottom layer to capture more useful information and improve small-scale lesion segmentation performance through different receptive fields obtained via varying dilation rates.
The rest of this paper is organized as follows. Section 2 outlines the medical image segmentation’s classical networks and ICH segmentation development history. Section 3 presents the proposed network architecture and modules. Section 4 discusses the dataset, evaluation metrics, and experimental implementation. Furthermore, the model’s performance is evaluated and compared with other methods. Finally, Section 5 summarizes the conclusions.
2. Related Work
In this section, we initially examine the related work on computer-aided technology in ICH segmentation, followed by a primary focus on the research progress on neural networks in medical image segmentation.
Over time, various traditional segmentation algorithms utilizing diverse techniques such as region growing [9,10,11], thresholding [12], watershed [13], active contours [14], clustering [15], and more have been introduced. In recent times, deep learning-based techniques have gained increased prominence for achieving superior segmentation accuracy [16,17,18]. Prakash et al. [19] employed the Distance Regularized Level Set Evolution (DRLSE) method to fit the active contour of the hemorrhagic region. Following preconditioning, the hemorrhagic areas of IVH and IPH were processed with an enhanced DRLSE. Singh et al. [20] integrated fuzzy C-means (FCM) clustering with an improved range-regularized level set evolutionary algorithm (MDRLSE) to detect and isolate cerebral hemorrhage regions. Bhadaurial et al. [21] suggested an approach based on spatial fuzzy C-means and region-based active contour. Kumar et al. [22] proposed a CT image hemorrhage segmentation method relying on fuzzy C-means clustering, automatic cluster selection, skull removal, threshold segmentation, and an edge-based active contour technique. Gautam et al. [23] introduced the white matter fuzzy C-means clustering method and employed wavelet threshold technology to segment the hemorrhagic area.
In recent years, due to the continuous advancement of deep learning, an increasing number of neural networks have been applied to the domain of medical image segmentation. These networks can extract the features of focal areas from training images and autonomously set them, thereby avoiding manual partitioning operations. Fully convolutional networks (FCNs) [24] are utilized in image semantic segmentation, representing the first end-to-end fully convolutional network aimed at pixel-level prediction. Since the network’s introduction, it has served as the foundational framework for semantic segmentation, with subsequent algorithms primarily improving upon this network framework. Launched in 2015, U-Net has gradually become the most prominent medical image segmentation network, integrating various levels of semantic information to achieve optimal segmentation results for medical images with simple semantics. However, for more complex medical image segmentation tasks, its performance falls short of clinical practice requirements. Currently, most medical image segmentation networks are enhanced based on the U-Net [25] network, including U-Net++ [26], Attention U-Net [27], and ResU-Net [28]. With the rise of the transformer [29] structure, the TransU-Net [30] network has also emerged for medical image segmentation. Among them, Xu et al. [31] utilized a Dense U-Net framework for the automatic segmentation of intracranial hemorrhage, while Hssayeni implemented a 2D U-Net for segmenting intracranial hemorrhage, achieving a Dice coefficient of 0.31 [32].
3. Proposed Approach
The proposed MSRL-Net architecture is illustrated in Figure 2, employing the U-Net structure as its foundation. The U-Net consists of an encoder, decoder, and skip connection components. Several modifications have been made to the original U-Net to create the MSRL-Net, including the implementation of the proposed MSpooling instead of max-pooling for multi-scale feature extraction. Additionally, the MRHDC structure has been integrated into the U-Net network to mitigate the influence of image resolution reduction on segmentation tasks. The coordinate attention (CA) [33] mechanism is introduced to capture cross-channel information across CT image dimensions, thereby enhancing lesion feature learning and yielding more accurate segmentation outcomes for hemorrhagic lesion boundaries.
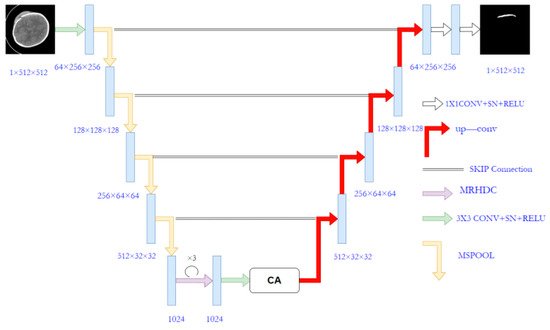
Figure 2.
The architecture of the proposed MSRL-Net.
3.1. Image Preprocessing
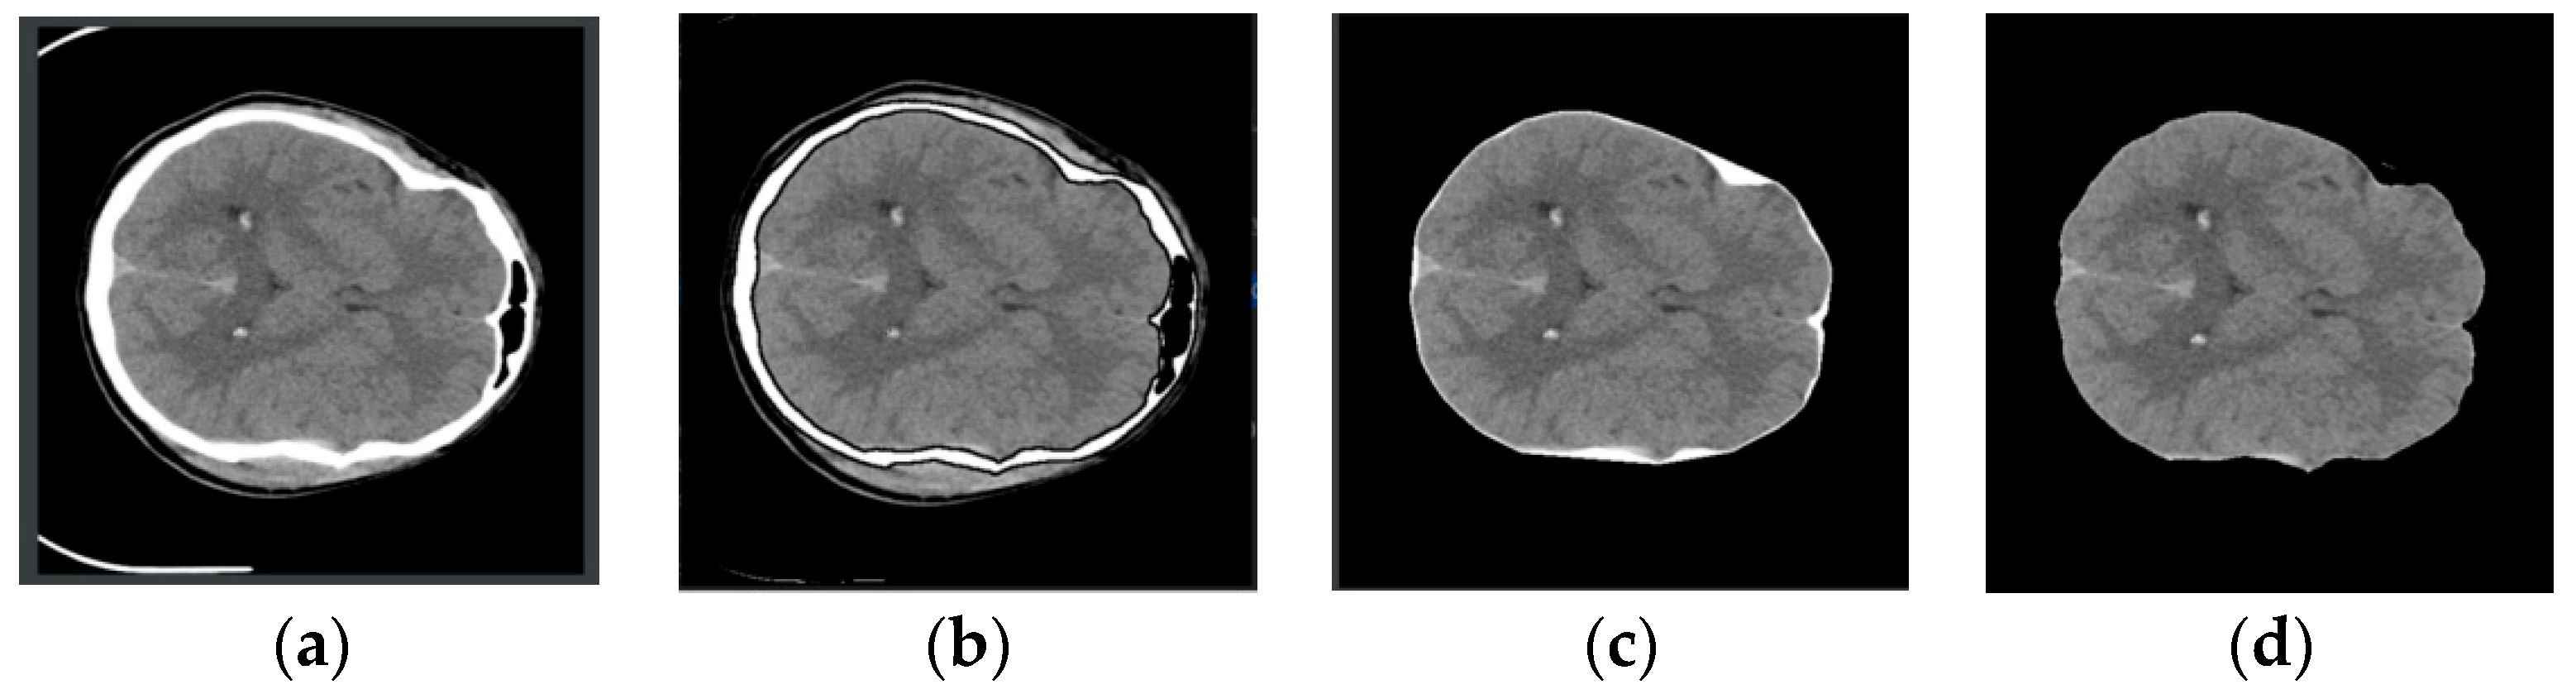
CT images exhibit variations in size and pixel intensity and may be affected by unwanted artifacts such as noise. These artifacts can lead to irregular segmentation results in certain images and compromise the overall model performance. To address these issues, standard image preprocessing techniques were employed before segmentation. To enhance the network’s feature representation capabilities and minimize the impact of redundant noise, skull removal preprocessing was performed on the CT images. This process, illustrated in Figure 3, involves selecting the rough skull outline utilizing OpenCV knowledge, followed by the elimination of extraneous features outside the outline. Finally, the remaining white pixels are converted to black pixels, completing the skull removal operation. This preprocessing approach effectively eliminates the most irrelevant features and improves segmentation accuracy.
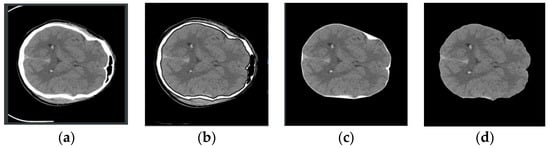
Figure 3.
Image preprocessing process. From left to right, they are (a–d). (a): Original image, (b): Contour extraction, (c): Contour removal, (d): Pixel conversion.
3.2. MSpool
The pooling layer, commonly used for feature map downsampling, is formed by combining various convolution and pooling operations to obtain rich contextual information. However, in the U-Net network, information loss becomes increasingly severe with additional downsampling, particularly impacting the detection precision of intracranial hemorrhage by losing micro-object or detail feature information.
The MSpool module is proposed as the most commonly used pooling method to mitigate information loss caused by maximum pooling. An MSpool module is proposed to extract a broader range of contextual information. The specific MSpool block network structure is depicted in Figure 4.
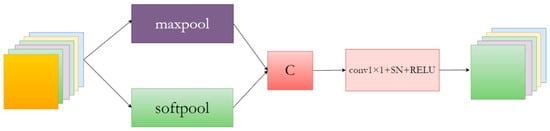
Figure 4.
The network structure of the proposed MSpool network block.
The MSpool module utilizes SoftPool [34] and MaxPool for feature downsampling, fusing the resulting feature maps to extract more valuable contextual information. Additionally, the fused features are input into a 1 × 1 convolutional layer to adjust the feature map channel count.
A variant of the pooling layer is SoftPool, which can maintain the functionality of the pooling layer while minimizing the loss of information during pooling. From Figure 5, it can be seen that SoftPool can retain finer details of the original image, but it is less effective for large areas. For the uncertain lesion areas in this paper, however, MaxPool has better information extraction properties. Therefore, both methods were combined as a new downsampling module.
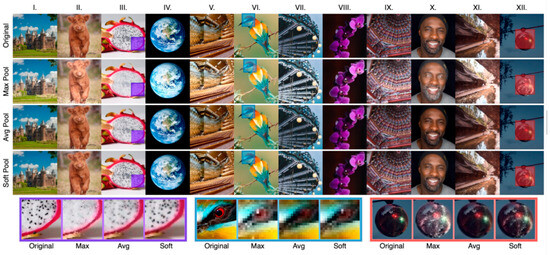
Figure 5.
SoftPool subjective effect display [34].Examples of maximum, average and soft pooling. Image selection was based on overall contrast (I,III,V,VIII,XII), color (II,IV,VI,IX),detail (III,V,X,XI,XII) and texture (II,VII).
3.3. CA Attention
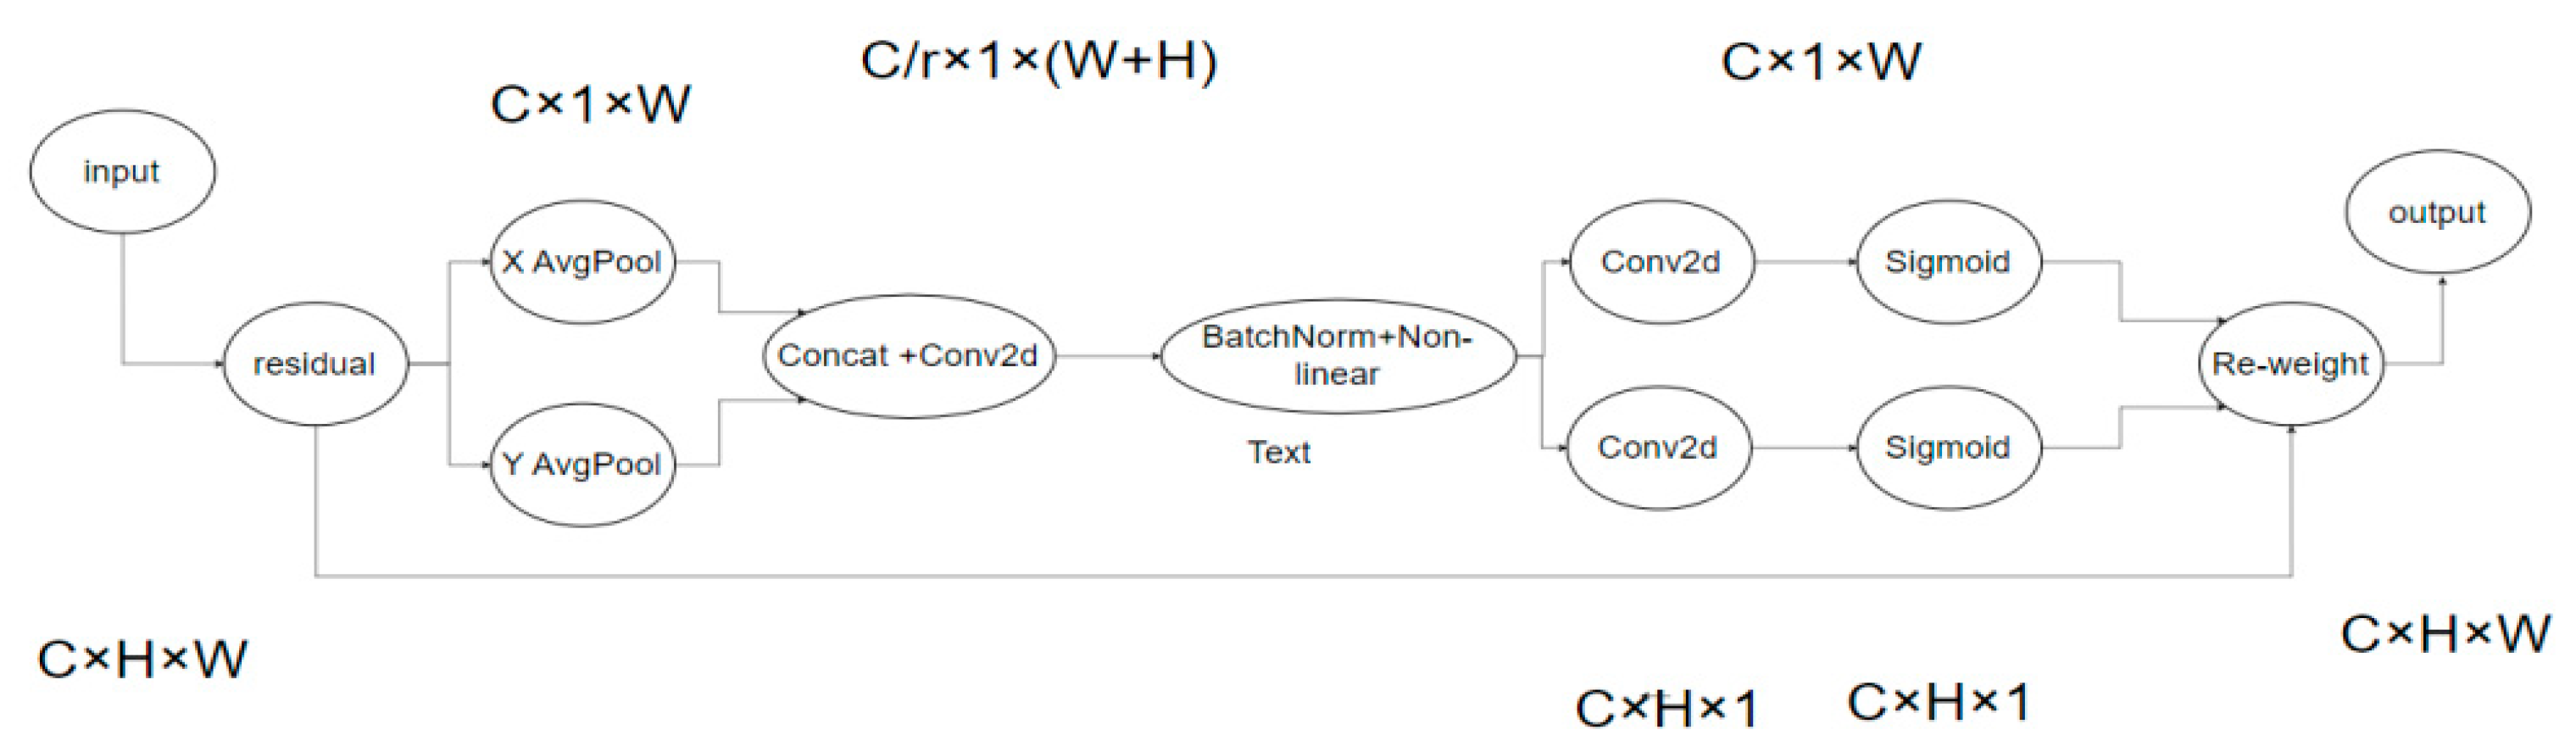
Attention mechanisms have been proven to be efficient in various computer vision tasks, such as image classification and segmentation. However, in neural networks, spatial detail often vanishes in high-level output feature maps due to cascading convolution and nonlinear changes, resulting in lower accuracy for small target segmentation tasks. Thus, the coordinate attention mechanism (CA) was introduced to replace traditional modules like SE [35] and CBAM [36]. Compared to previous modules, CA considers the interaction of internal channel information and enhances the global location learning ability for hemorrhagic regions, facilitating more accurate bleeding area localization in CT images and reducing model false segmentation.
The principle of the CA attention mechanism is shown in Figure 6. To garner attention to image dimensions and accurately encode positional information, channel attention (SE) initially divides the input feature map by width and height for global average pooling, procuring respective feature maps in width and height directions.
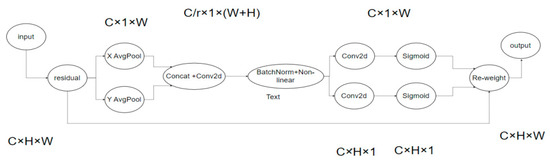
Figure 6.
CA network.
Subsequently, feature maps derived from the global receptive field’s width and height are concatenated and forwarded to a shared convolution module with a 1 × 1 kernel, reducing the dimensions to the original C/r. Post batch normalization, the feature map F1 is processed through a Sigmoid activation function, obtaining feature map f of shape 1 × (W + H) × C/r.
Feature map f undergoes convolution with the original height and width, using a 1 × 1 kernel, yielding feature maps Fh and Fw with channel counts identical to the original. The Sigmoid activation function subsequently produces attention weights gh and gw in the feature map’s width direction.
Upon calculation completion, attention weights for input feature map height and width directions are acquired. Ultimately, the original feature map undergoes multiplication weighting calculations, yielding a feature map with attention weights in width and height directions.
The approximate process is shown in the formula above, where X is the given input, and represent the output obtained by using the pooling kernel with the size of (H, 1) or (1, W) to code each channel along the horizontal and vertical coordinates, respectively. f is the intermediate feature containing horizontal and vertical spatial information, and are the output obtained after the operation of convolution and linear activation function. is the final output result.
3.4. MRHDC Module
Segmenting numerous small, irregularly shaped bleeding lesion areas in the data presents the current task’s most significant challenge. To address this, we devised a Multi-Rate Hybrid Dilated Convolution (MRHDC) structure to further capture the multi-scale background features of intracranial hemorrhage across various sizes. Inspired by Atrous Spatial Pyramid Pooling (ASPP) [37] and ResNet [38] structures, we combined dilated convolutions with varying dilation rates to augment the neural network’s receptive field and obtain multi-scale information. The MRHDC module comprises several hybrid dilated convolution layers, max-pooling layers, and residual connections. The proposed module’s framework consists of three parallel branches, each containing a dilated convolution with differing dilation rates to extract multi-scale feature information. Each branch includes a 1 × 1 convolution and a linear activation layer ReLU. Lastly, employing ResNet’s residual concept, the three branches are fused via residual connections to optimize the network, and 1 × 1 convolution-based dimensionality reduction is employed to transfer multi-scale information to the subsequent network layer. The structure of the module is shown in Figure 7.
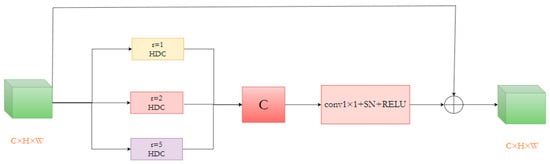
Figure 7.
The structure of the MRHDC module.
As the network deepens, feature map resolution diminishes, and information loss increases. Thus, convolutions with larger receptive fields are necessary. Dilated convolutions can appropriately expand the receptive field without altering the feature map’s size, significantly mitigating information loss. Nevertheless, utilizing dilated convolutions alone may not consistently yield favorable results due to large and small bleeding areas. Following the ideas in [24], we selected the dilation rate combination [1,2,4] for the MRHDC module’s dilated convolutions and incorporated the structure thrice simultaneously. By integrating small and large receptive fields in shallow and deep layers, optimal segmentation results are attained, and small target information loss is minimized to the greatest extent possible.
The addition of the MRHDC (Multi-Resolution and High-Dimensional Context) module has proven to be beneficial in preserving more valuable information while achieving a larger receptive field compared to other convolutional operations. Furthermore, it maintains the resolution of feature maps, effectively reducing spatial information loss, which contributes to improved accuracy in image segmentation. In the results section, a comparison is made between segmentation outcomes obtained with different groupings and varying dilation rates within the MRHDC module.
3.5. Multi-Objective Loss Function
For medical image segmentation tasks, dichotomous classification (0–1) is typically employed, with training methods targeting pixel categories. This approach is suitable for medical images with extensive lesion areas, akin to skin disease segmentation where the majority of images contain positive samples. In contrast, ICH segmentation entails smaller lesion areas, leading to a significant imbalance between positive and negative sample proportions. Utilizing a binary cross-entropy loss function in this scenario would result in negative samples dominating training, culminating in suboptimal network performance.
We encountered a serious imbalance between the proportion of positive and negative samples in our intracranial hemorrhage segmentation task due to the small size of the lesion area. The use of binary cross-loss entropy loss function, in this case, will result in a predominance of negative samples in the training position, resulting in poor network performance.
To address this issue, the focal loss function can be employed as an alternative to the traditional binary cross-entropy (BCE) loss function. In our work, focal loss may be a better choice since it is specifically designed to address class imbalance, whereas BCE loss is a standard loss function suitable for binary classification but lacking inherent mechanisms for handling imbalanced datasets. Furthermore, to effectively mitigate class imbalance, we adopted a multi-loss function training approach, primarily comprising Dice loss [39] and focal loss [40]. Focal loss, a cross-entropy function variant, remains constant for misclassified samples but decreases for accurately classified samples. Overall, this equates to an increased weight for misclassified samples within the loss function. By adjusting the proportion of the two loss functions, an optimal segmentation effect can be achieved.
Here, the total function is defined as follows:
where X represents the pixel label of the real segmented image, Y represents the pixel category of the image predicted by the model. |X∩Y| for prediction of image pixel and real label image pixels, the dot product between the dot and the result was added, |X| and |Y| are approximately added to each pixel in their respective images. α weights help to deal with category imbalances. is the regulating factor, γ ≥ 0 is the adjustable focusing parameter. When γ = 0, this expression degrades into cross entropy.
4. Experiment
In this section, we will introduce the dataset employed in our study, describe the experimental configuration in detail, present the experimental results, and discuss the paper’s analysis comprehensively. To assess the proposed network’s performance for ICH segmentation, our approach was trained and validated on a publicly available medical research dataset published by [32].
4.1. Dataset
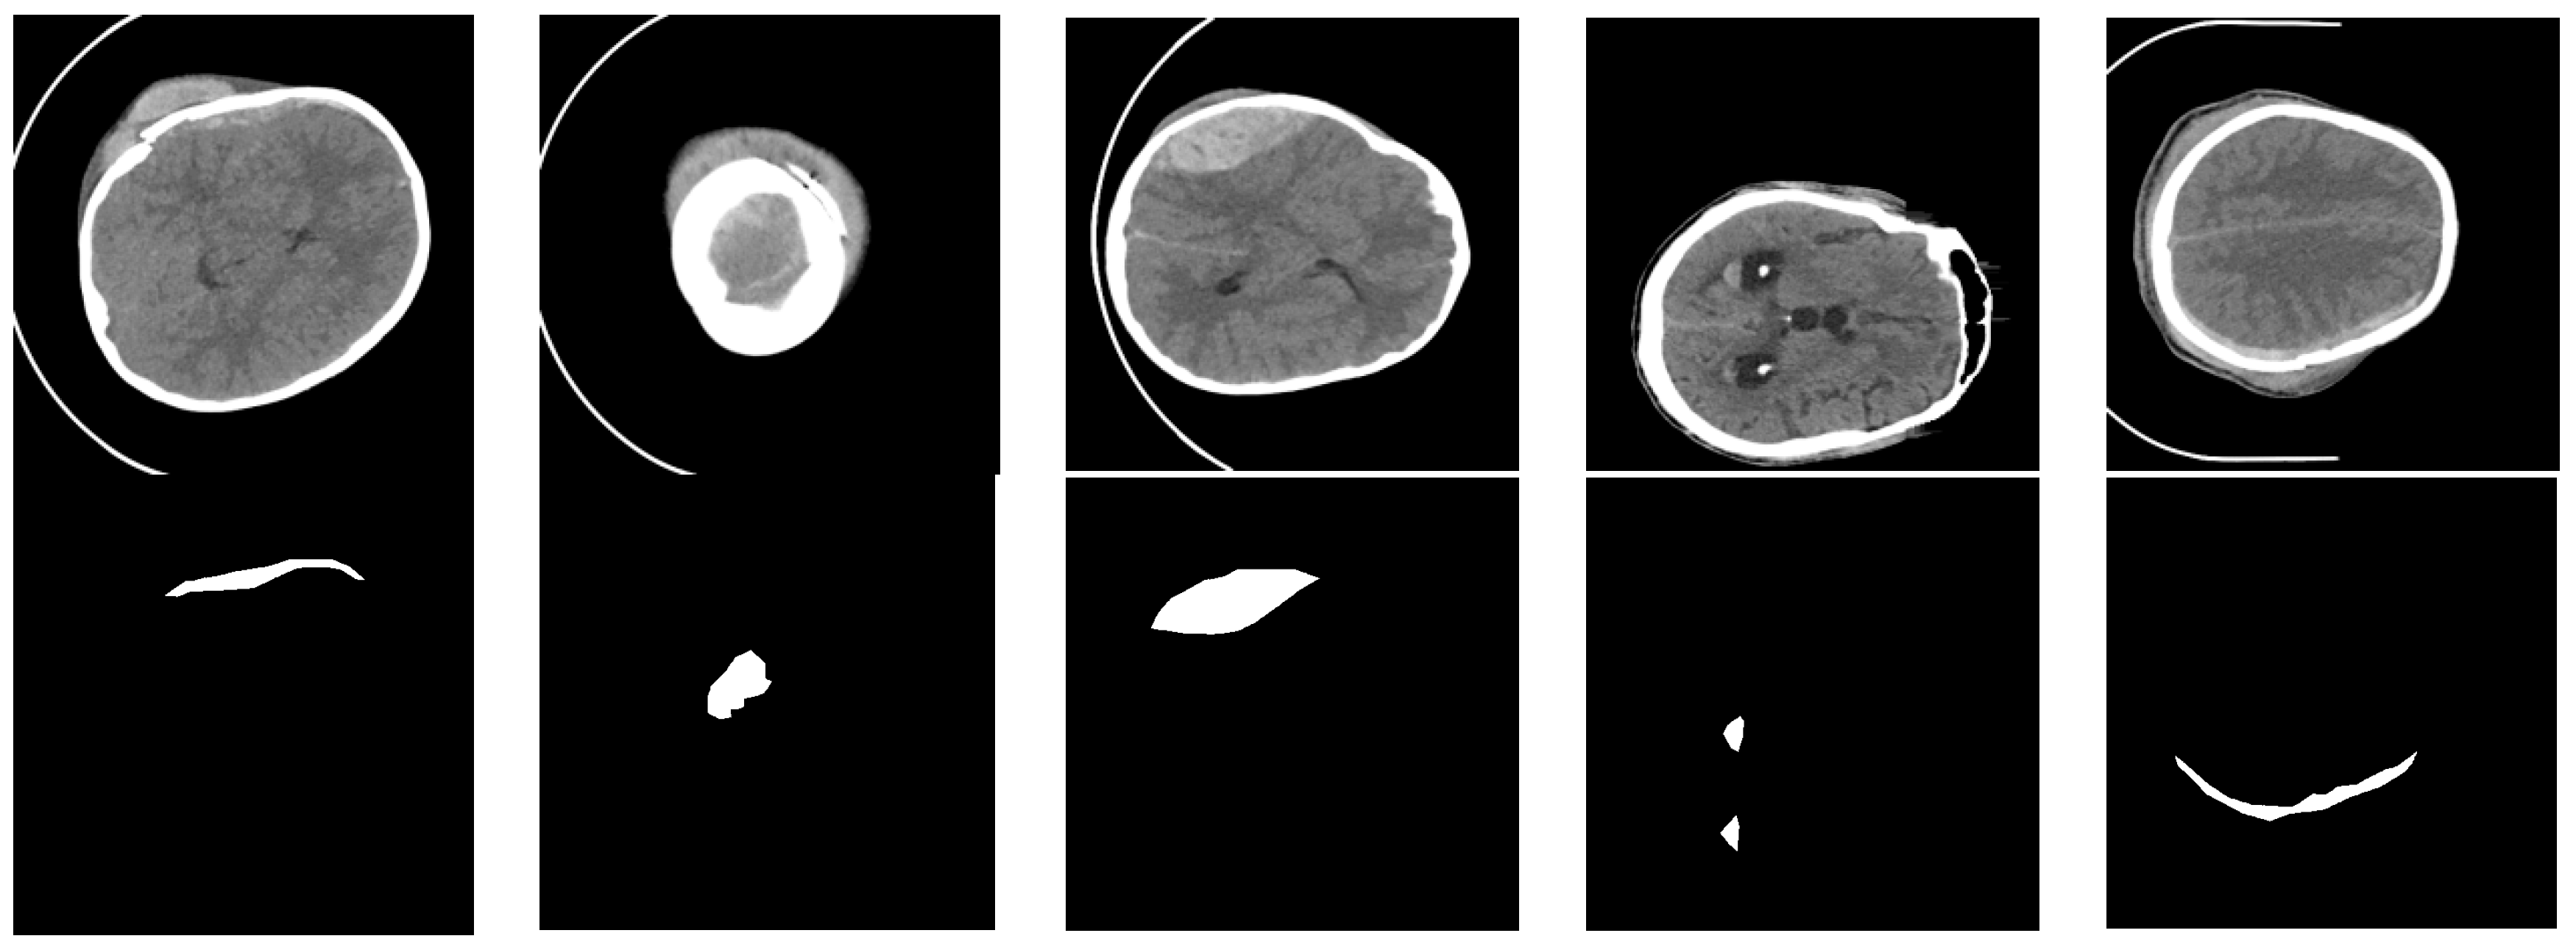
Datasets consisting of 82 CT scans were gathered, including 36 scans from patients diagnosed with intracranial hemorrhage, categorized into intraventricular, intraparenchymal, subarachnoid, epidural, and subdural types. Each patient’s CT scan comprised approximately 30 sections, each 5 mm thick. The patients’ mean age and standard deviation were 27.8 and 19.5, respectively. Out of the total patients, 46 were male and 36 were female. For every non-enhanced CT scan section, two radiologists documented the bleeding type and whether bleeding or fractures were present. Additionally, the radiologists outlined the ICH region in each section. During data collection, Siemens Medical Solutions’ syngo software was utilized to read the CT DICOM file, and two videos (AVI format) were saved using brain (level = 40, width = 120) and bone (level = 700, width = 3200) windows. A custom MATLAB tool was implemented to read the AVI files and execute annotations. Concurrently, the generated masks were mapped and saved as NIfTI files for 75 subjects. Figure 8 displays a sample from our dataset, with the top row representing the grayscale CT image of intracranial hemorrhage and the bottom row depicting the corresponding ground truth image, where black areas indicate the background and white areas signify the bleeding lesion.

Figure 8.
Examples of our dataset. The black area indicates the background, and the white area indicates hemorrhage.
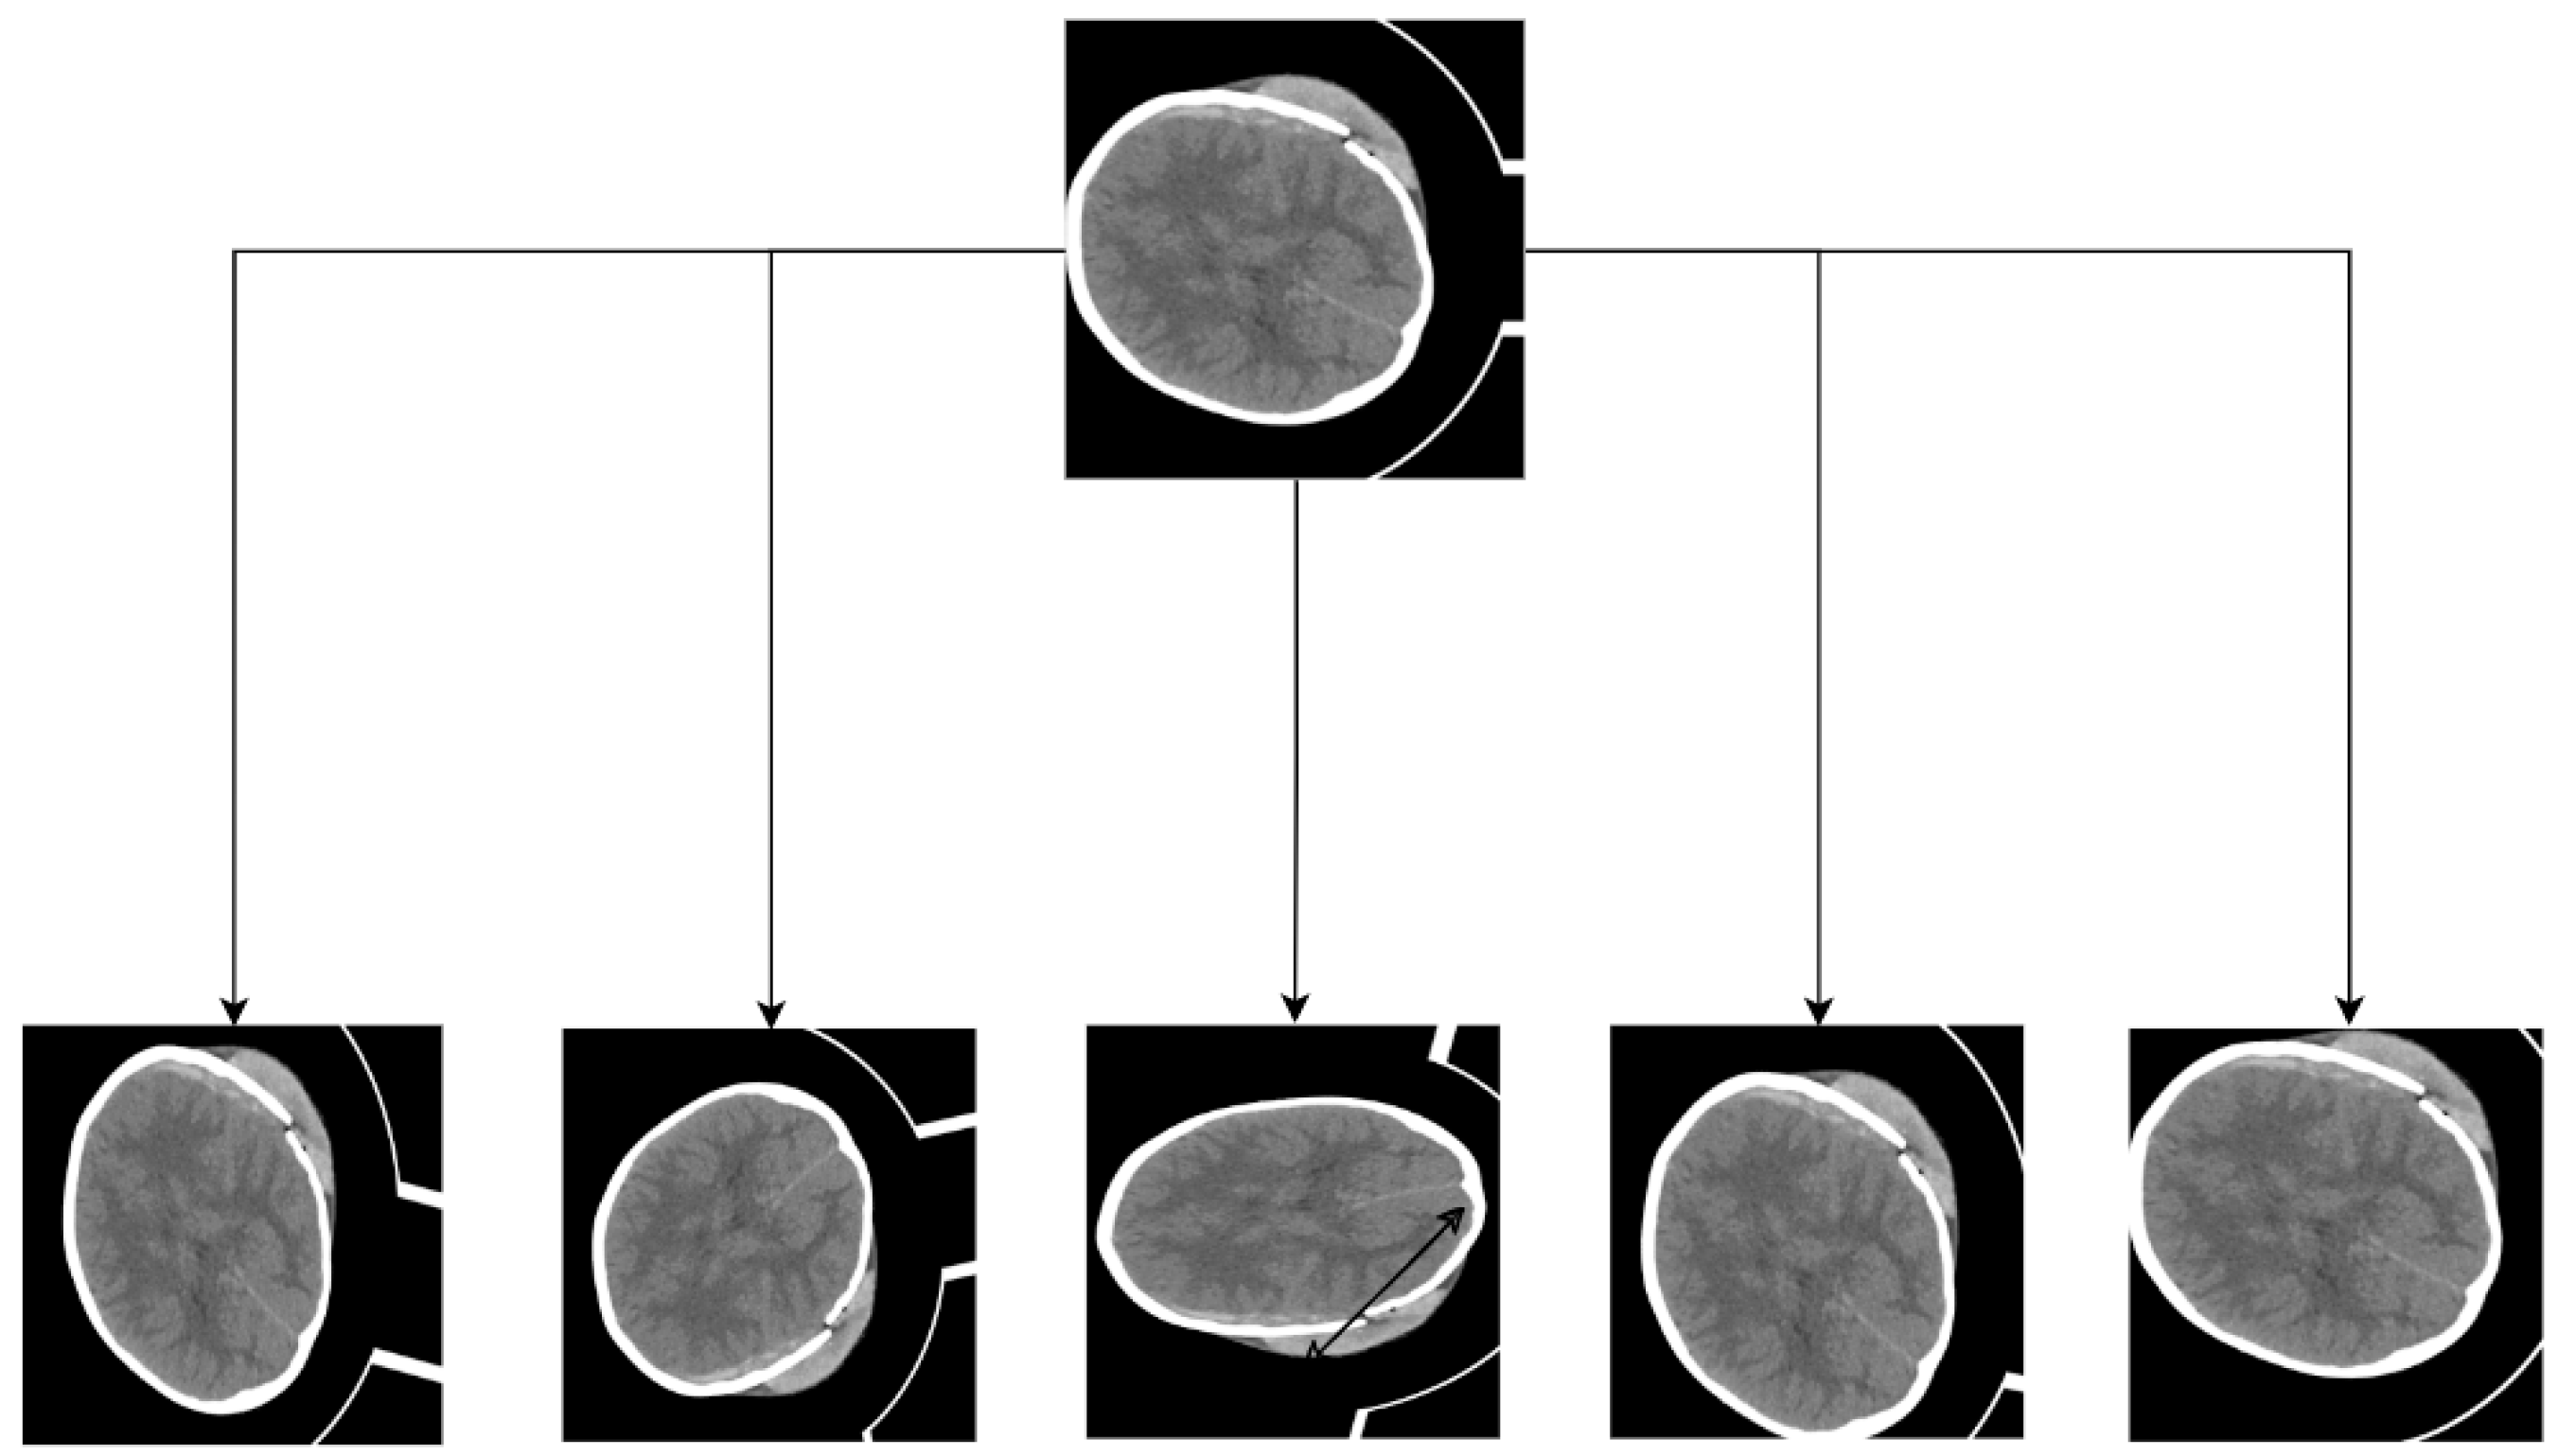
Since the data contained a significant number of non-ICH images, an additional data cleaning step was performed to select only regions containing bleeding. Following data cleaning, a total of 318 images (512 × 512) were available for use, all containing labeled images. For the dataset, not only were data cleaning, image preprocessing, and other tasks conducted, but data augmentation was also implemented. Due to the original dataset’s limited size of 318 training images, deep learning was insufficient, resulting in overfitting. Random rotation, flip, scale, contrast transformations, and noise disturbance were applied simultaneously to images and labels for data enhancement. Figure 9 illustrates the general data augmentation process. Post data augmentation, the dataset expanded approximately 10-fold, generating a total of 3880 images, which were divided into training, test, and validation sets at an 8:1:1 ratio.

Figure 9.
The schematic of the data augmentation.
4.2. Implementation Details
Experiments were conducted in an Ubuntu 18.04 software environment, utilizing the PyTorch deep learning framework. Four GPUs were employed for parallel training, and an NVIDIA RTX 2080Ti GPU with an 11 GB on-chip memory graphics processor was used for testing. During training, the adaptive moment estimation (ADAM) optimizer was utilized for gradient optimization with an initial learning rate of 0.0002, setting the first- and second-moment estimations to 0.9 and 0.999, respectively. Using the ADAM optimizer can lead to faster training convergence and improved model performance. The total epoch was set to 100, and the batch size was fixed at 32. Figure 10 demonstrates that, during the training and testing process, the loss value decreased and stabilized as the number of epochs increased, indicating our model’s convergence. In the process of preserving the best model parameters, the test set was employed to validate the model’s performance every five epochs during training. If the Dice loss on the test set exceeded the best previously recorded Dice score, we updated the best Dice score, saved the associated model parameters at that point, and later loaded these parameters when testing the model on the clinical dataset.
4.3. Metrics
To evaluate our proposed network’s ICH segmentation capabilities, we employed commonly utilized metrics, including the Dice similarity coefficient, Jaccard index, precision, and sensitivity. Due to the dominance of background categories, TN values may be excessive in the forecast. Consequently, accuracy and specificity metrics are unsuitable for handling unbalanced data. The small lesion area renders these metrics inapplicable as evaluation indicators, yielding near 0.99 values with no practical reference value. The Dice coefficient, prevalently used in medical segmentation, is sensitive to both false negatives (FNs) and false positives (FPs). Both Dice and Jaccard similarity coefficients range from 0 to 1, with values closer to 1 indicating superior segmentation outcomes.

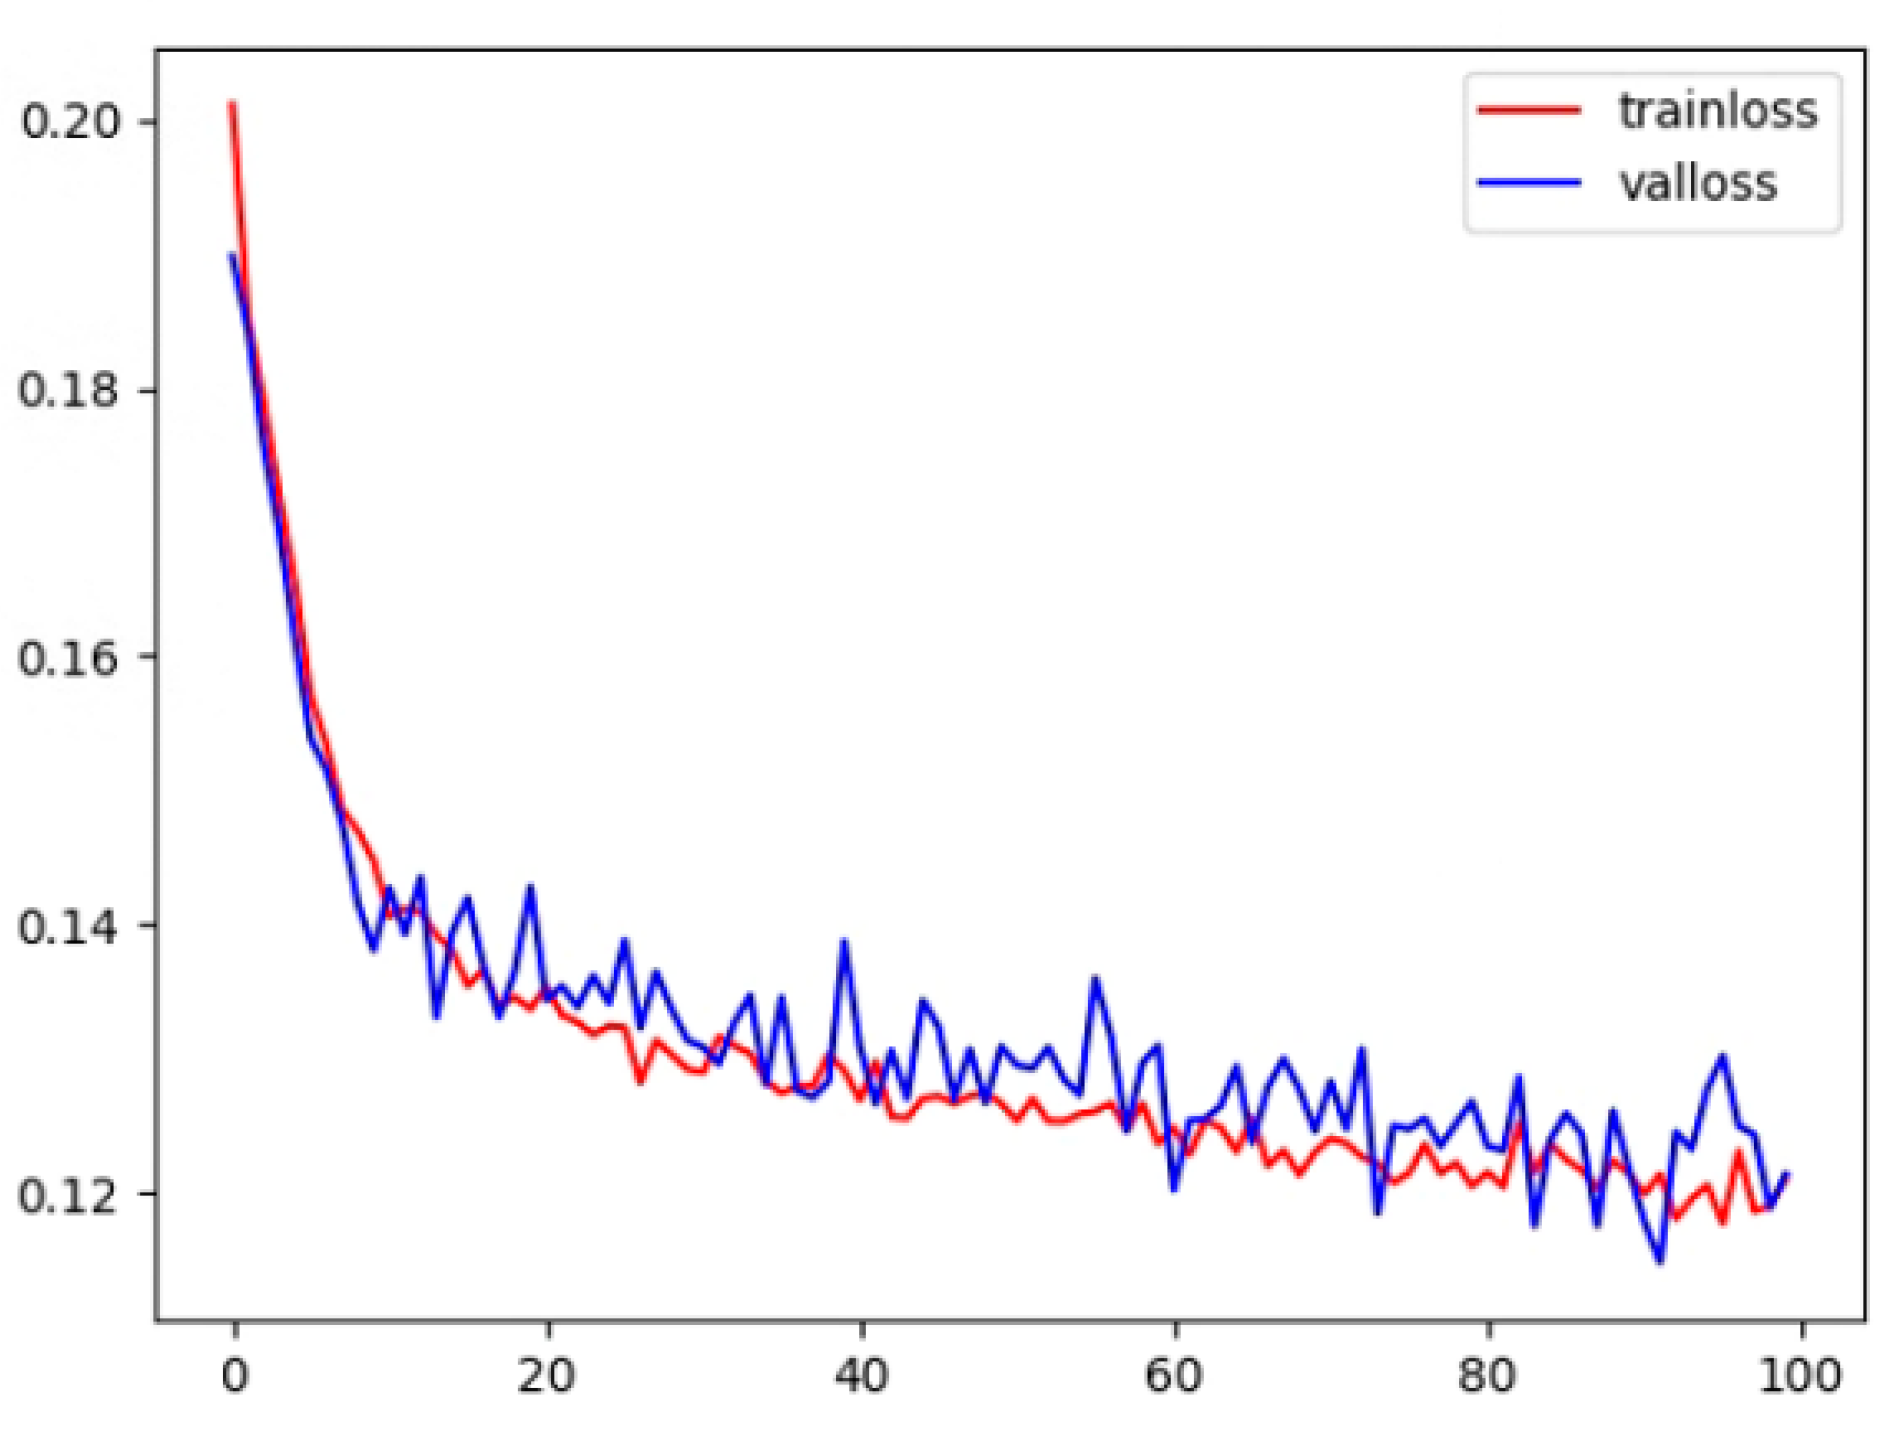
Figure 10.
The training and test loss for the proposed method.
Figure 10.
The training and test loss for the proposed method.
Among them, TP, TN, FP, and FN represent the true positive rate, true negative rate, false positive rate, and false negative rate of classified pixels, respectively.
4.4. Ablation Study
To ascertain the efficacy of image preprocessing, using multi-scale pooling (MSpool), coordinate attention (CA), multi-resolution hierarchical dense convolution (MRHDC), and multi-objective loss (Mloss) techniques, we conducted relevant ablation experiments. Utilizing a publicly available intracranial hemorrhage dataset, we ensured the reliability of the ablation study by employing the top-performing network parameters from the validation set for the final test. The highest values among the test results were used as the definitive experimental outcomes. Table 1 displays the experimental results, highlighting the best outcomes in bold. The integration of MSpool, CA, MRHDC, and Mloss individually enhanced the network’s segmentation capabilities, with MRHDC exhibiting the most significant improvement (0.044), followed by Mloss and MSpool. However, the inclusion of MSpool did not yield the same enhancement as MRHDC, suggesting that the network’s encoding ability may be inadequate for capturing more useful information. By enlarging the receptive field, the network can learn more valuable information, yielding superior results compared to retaining more data. Specifically, data preprocessing removes redundant features. The multi-objective joint loss function is modified to prioritize focal area characteristics. The coordinate attention mechanism is incorporated to heighten the network’s sensitivity to the focal area’s location. A novel pooling method is introduced to preserve more effective information during the downsampling process. Finally, the MRHDC module is added to enhance multi-scale information extraction, resulting in progressively improved segmentation accuracy.

Table 1.
Performance comparison of different segmentation module.
Upon determining the loss function, the impact of pertinent parameters in the MRHDC module was assessed in the experiment. To extract more information, the MRHDC module was positioned at the lowest layer of the U-Net network instead of all layers, mitigating the increase in training difficulty due to network complexity. Table 2 and Table 3 demonstrate the effect of the MRHDC module on model performance. Three grouping methods (Group 1, Group 2, and Group 3) were tested, with Group 3 exhibiting the most effective segmentation. However, as the module is added to the bottom layer with the highest number of channels, continuing to expand the number of groups would result in an explosion of network parameters without any specific economic effect. Consequently, three groups were deemed optimal. For the dilation rate of the dilated convolution module, three different dilation rates and three groups were set. As seen in Table 3, the combination of dilation rates 1, 2, and 5 achieved the best segmentation. This combination provided a larger receptive field, smaller shallow feature dilation rate, and a larger deep feature dilation rate, better fulfilling the purpose of multi-scale feature extraction.
Table 2.
Segmentation results comparison of different groups of HDC structures.
Table 3.
Segmentation results comparison of MRHDC modules with different expansion rates.
To determine the optimal ratio of two loss functions in the multi-objective joint loss function, we performed ablation experiments by assigning different weights to train the network. Table 4 reveals that when the ratio is 2:8, the Dice segmentation accuracy is maximized. This outcome also serves as the basis for subsequent related experiments.
4.5. Comparison with Other Methods
The performance of the proposed MSR-Net was evaluated on an intracranial hemorrhage dataset and compared to other methods, including U-Net [25], Attention U-Net [28], and CMUNet [41]. Except for U-Net, the other three networks contain different attention mechanisms. By adding the same attention mechanism, the effectiveness of the designed network module can be discerned through the Dice index and Jaccard index. All networks share identical training strategies, including learning rate, epoch, optimal model storage method, and optimizer. While training U-Net, the traditional cross-entropy loss function was used as the baseline. To emphasize the effectiveness of the proposed module on small focus segmentation, a multi-objective joint loss function was chosen as the training loss function for other networks. Figure 11 provides a visual representation of the segmented hemorrhage lesions, with black areas signifying the background and white areas indicating the lesions. The effectiveness of the MSRL-Net can be observed intuitively in Figure 11. Although other networks can predict approximate bleeding locations when the bleeding area is large and distinct, they may produce inaccurate predictions. However, the proposed network delivers more precise positioning and shape. Moreover, in areas with severe disease, including small lesion areas and images with less discernible features, our network can still predict bleeding areas, while other networks may fail to recognize relevant features, leading to all-black prediction maps or false negative errors in spatial isolation.
In the experiment, the developed model outperformed prior techniques, yielding satisfactory segmentation outcomes. Under identical conditions and datasets, the performance of the proposed model was compared to architectures such as U-Net. Table 5 presents the comparative analysis, clearly indicating the superiority of the proposed method over U-Net and Attention U-Net. As evidenced by Table 5, the Dice coefficient, Jaccard index, sensitivity, and precision of our network reached 0.717, 0.596, 0.779, and 0.712, respectively. In comparison to the U-Net network, the proposed model’s Dice coefficient and Jaccard index increased by 0.107 and 0.105, respectively. Based on prior literature, our segmentation performance is unsurpassed.
From the results of the experiment, our work has the potential to be applied to automatically segment bleeding regions from CT scans, aiding doctors in faster and more accurate diagnoses and ultimately enhancing workflow efficiency. However, our work does have certain limitations, including the large parameter count of the network and the imprecise prediction of bleeding region shapes and positions. Further efforts are needed to improve precision and undertake additional network optimizations in the future.
In addition, during the experimental process, we employed transfer learning methods in the network; however, the real-world segmentation results were unsatisfactory.
This aspect requires further refinement in subsequent work, with consideration given to incorporating fuzzy integration techniques to enhance segmentation accuracy [42]. Compared to current segmentation methods, our work places a greater emphasis on capturing features in small lesion areas and preserving location information in multi-lesion regions. This approach retains more valuable information and enhances segmentation accuracy.
Table 4.
The impact of the multi-object optimization function on model performance.
Table 4.
The impact of the multi-object optimization function on model performance.
| Multi-Object Function | Dice | Jaccard | Sensitivity | Precision |
|---|---|---|---|---|
| 0.1, 0.9 | 0.715 | 0.595 | 0.768 | 0.679 |
| 0.2, 0.8 | 0.717 | 0.596 | 0.779 | 0.712 |
| 0.3, 0.7 | 0.708 | 0.586 | 0.773 | 0.684 |
| 0.4, 0.6 | 0.688 | 0.565 | 0.713 | 0.634 |
| 0.5, 0.5 | 0.695 | 0.573 | 0.764 | 0.672 |
| 0.6, 0.4 | 0.668 | 0.546 | 0.766 | 0.613 |
| 0.7, 0.3 | 0.672 | 0.547 | 0.714 | 0.612 |
| 0.8, 0.2 | 0.686 | 0.568 | 0.726 | 0.692 |
| 0.9, 0.1 | 0.680 | 0.559 | 0.735 | 0.682 |
Table 5.
Performance comparison of different segmentation methods.
Table 5.
Performance comparison of different segmentation methods.
| Name | Dice | Jaccard | Sensitivity | Precision |
|---|---|---|---|---|
| Hssayeni et al. [32] | 0.315 | 0.218 | ||
| U-Net [25] | 0.610 | 0.491 | 0.644 | 0.632 |
| Attention U-Net [27] | 0.645 | 0.529 | 0.667 | 0.676 |
| CMUNet [40] | 0.666 | 0.547 | 0.656 | 0.707 |
| Ours | 0.717 | 0.596 | 0.779 | 0.712 |
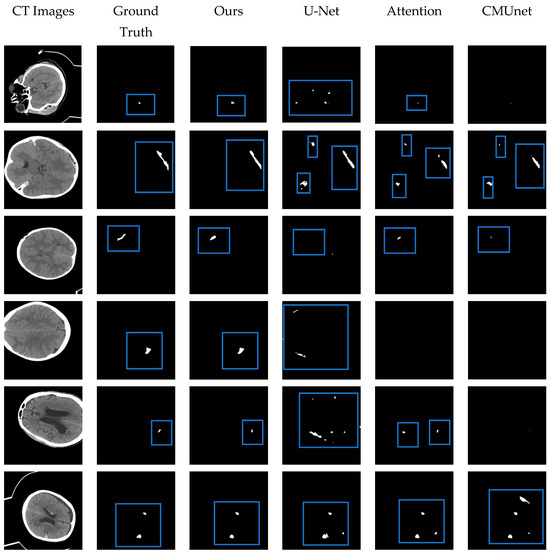
Figure 11.
The visual segmentation results comparison chart. From left to right: the original CT images of input, their corresponding ground truth masks, and the results obtained by our proposed MRSL-net, U-Net, Attention U-Net, and CMUnet. It can be seen that the method we proposed is closest to the ground truth in terms of position and shape and has a good segmentation effect. The blue boxes indicate the segmented focal areas.

5. Conclusions
In this study, we proposed a new U-Net network structure called MRSL-Net, which was used to segment intracranial hemorrhage. The implementation showed that the MRSL-Net method was superior to other methods. The segmentation results can directly assist doctors. Although our approach demonstrates good segmentation results, it still has several limitations, including a high parameter count, a relatively complex network architecture, and challenges in training. For example: for the dataset, we need more data to complement the methods used to replace existing data enhancement. Specifically, more data can be used to better train the network. At the same time, through a large number of data, more features of focal areas can be extracted, preserving more information about bleeding areas deep within the network. This approach can enhance the network’s sensitivity to location information, ultimately improving its performance in identifying bleeding regions.
Author Contributions
All authors contributed to the study’s conception and design. Material preparation, data collection, and analysis were performed by H.W. and X.W. The first draft of the manuscript was written by X.W. and all authors commented on previous versions of the manuscript. All authors have read and agreed to the published version of the manuscript.
Funding
This work is supported by the National Natural Science Foundation of China under (51875331) and the National Key Research and Development Project (2016YFD0701401).
Institutional Review Board Statement
Not applicable.
Informed Consent Statement
Informed consent was obtained from all subjects involved in the study.
Data Availability Statement
The data used in this article are contained in https://physionet.org/content/ct-ich/1.3.1/ (accessed on 1 January 2020).
Acknowledgments
We would like to express our gratitude to our colleagues at Bewatec Medical Devices Co., Ltd., Jiaxing—Xiu-Tao Cui, Long Li. Thanks are due to Xiu-Tao Cui for assistance with the experiments and to Long Li for valuable discussion.
Conflicts of Interest
The authors declare no conflict of interest.
References
- Qureshi, A.I.; Mendelow, A.D.; Hanley, D.F. Intracerebral Haemorrhage. Lancet 2009, 373, 1632–1644. [Google Scholar] [CrossRef] [PubMed]
- Caceres, J.A.; Goldstein, J.N. Intracranial Hemorrhage. Emerg. Med. Clin. N. Am. 2012, 30, 771–794. [Google Scholar] [CrossRef] [PubMed]
- Mahmood, Q.; Li, S.; Fhager, A.; Candefjord, S.; Chodorowski, A.; Mehnert, A.; Persson, M. A comparative study of automated segmentation methods for use in a microwave tomography system for imaging intracerebral hemorrhage in stroke patients. J. Electromagn. Anal. Appl. 2015, 7, 152. [Google Scholar] [CrossRef]
- Magid-Bernstein, J.; Girard, R.; Polster, S.; Srinath, A.; Romanos, S.; Awad, I.A.; Sansing, L.H. Cerebral Hemorrhage: Pathophysiology, Treatment, and Future Directions. Circ. Res. 2022, 130, 1204–1229. [Google Scholar] [CrossRef]
- Lee, B.; Newberg, A. Neuroimaging in Traumatic Brain Imaging. NeuroRx 2005, 2, 372–383. [Google Scholar] [CrossRef] [PubMed]
- Heit, J.J.; Iv, M.; Wintermark, M. Imaging of Intracranial Hemorrhage. J. Stroke 2017, 19, 11–27. [Google Scholar] [CrossRef]
- Strub, W.M.; Leach, J.L.; Tomsick, T.; Vagal, A. Overnight Preliminary Head CT Interpretations Provided by Residents: Locations of Misidentified Intracranial Hemorrhage. Am. J. Neuroradiol. 2007, 28, 1679–1682. [Google Scholar] [CrossRef]
- Chilamkurthy, S.; Ghosh, R.; Tanamala, S.; Biviji, M.; Campeau, N.G.; Venugopal, V.K.; Mahajan, V.; Rao, P.; Warier, P. Development and Validation of Deep Learning Algorithms for Detection of Critical Findings in Head CT Scans. arXiv 2018, arXiv:1803.05854. [Google Scholar]
- Thakur, P.; Madaan, N. A survey of image segmentation techniques. Int. J. Res. Comput. Appl. Robot. 2014, 2, 158–165. [Google Scholar]
- Adams, R.; Bischof, L. Seeded region growing. IEEE Trans. Pattern Anal. Mach. Intell. 1994, 16, 641–647. [Google Scholar] [CrossRef]
- Dakua, S.P. Towards Left Ventricle Segmentation from Magnetic Resonance Images. IEEE Sens. J. 2017, 17, 5971–5981. [Google Scholar] [CrossRef]
- AI-amari, S.; Kalyakar, N.; Khamitkar, S. Image segmentation by using thershod techniques. J. Comput. 2010, 2, 83–86. [Google Scholar]
- Mahmood, N.H.; Zulkarnain, N.; Zulkifli, N.S.A. Ultrasound liver image enhance-ment using watershed segmentation method. Int. J. Eng. Res. Appl. 2012, 2, 691–694. [Google Scholar]
- Cvancarova, M.; Albregtsen, F.; Brabrand, K.; Samset, E. Segmentation of Ultrasound Images of Liver Tumors Applying Snake Algorithms and GVF. Int. Congr. Ser. 2005, 1281, 218–223. [Google Scholar] [CrossRef]
- Bhowmik, S.; Datta, V. A survey on clustering based image segmentation. Int. J. Adv. Res. Comput. Eng. Technol. 2012, 1, 1323–2278. [Google Scholar]
- Ding, Y.; Yang, Q.; Wang, Y.; Chen, D.; Qin, Z.; Zhang, J. MallesNet: A Multi-Object Assistance Based Network for Brachial Plexus Segmentation in Ultrasound Images. Med. Image Anal. 2022, 80, 102511. [Google Scholar] [CrossRef]
- Xue, C.; Zhu, L.; Fu, H.; Hu, X.; Li, X.; Zhang, H.; Heng, P.-A. Global guidance network for breast lesion segmentation in ultrasound images. Med. Image Anal. 2021, 70, 101989. [Google Scholar] [CrossRef]
- Ansari, M.Y.; Abdalla, A.; Ansari, M.Y.; Ansari, M.I.; Malluhi, B.; Mohanty, S.; Mishra, S.; Singh, S.S.; Abinahed, J.; Al-Ansari, A.; et al. Practical Utility of Liver Segmentation Methods in Clinical Surgeries and Interventions. BMC Med. Imaging 2022, 22, 97. [Google Scholar]
- Prakash, K.B.; Zhou, S.; Morgan, T.C.; Hanley, D.F.; Nowinski, W.L. Segmentation and quantification of intra-ventricular/cerebral hemorrhage in CT scans by modified distance regularized level set evolution technique. Int. J. Comput. Assist. Radiol. Surg. 2012, 7, 785–798. [Google Scholar] [CrossRef]
- Singh, P.; Khanna, V.; Kamal, M. Hemorrhage segmentation by fuzzy c-mean with Modified Level Set on CT imaging. In Proceedings of the 2018 5th International Conference on Signal Processing and Integrated Networks (SPIN), Noida, India, 22–23 February 2018; pp. 550–555. [Google Scholar]
- Bhadaurial, H.; Dewal, M.J. Intracranial hemorrhage detecti on using spatial fuzzy c-mean and region-based active contour on brain CT imaging. Signal Image Video Process. 2014, 8, 357–364. [Google Scholar] [CrossRef]
- Kumar, I.; Bhatt, C.; Singh, K.U. Entropy based automatic unsupervised brain intracranial hemorrhage segmentation using CT images. J. King Saud Univ.-Comput. Informat. Sci. 2020, 34, 2589–2600. [Google Scholar] [CrossRef]
- Gautam, A.; Raman, B. Automatic segmentation of intracerebral hemorrhage from brain CT images. In Machine Intelligence and Signal Analysis; Springer: Berlin/Heidelberg, Germany, 2019; pp. 753–764. [Google Scholar]
- Shelhamer, E.; Long, J.; Darrell, T. Fully Convolutional Networks for Semantic Segmentation. IEEE Trans. Pattern Anal. Mach. Intell. 2017, 39, 640–651. [Google Scholar] [CrossRef] [PubMed]
- Frangi, A.F.; Hornegger, J.; Navab, N.; Wells, W.M. U-Net: Convolutional Networks for Biomedical Image Segmentation. In Medical Image Computing and Computer-Assisted Intervention—MICCAI 2015, Proceedings of the 18th International Conference, Munich, Germany, 5–9 October 2015; Lecture Notes in Computer Science Series; Springer International: Cham, Switzerland, 2015; Volume 9351, pp. 234–241. [Google Scholar]
- Zhou, Z.; Siddiquee, M.M.R.; Tajbakhsh, N.; Liang, J. UNet: A Nested U-Net Architecture for Medical Image Segmentation. In Deep Learning in Medical Image Analysis and Multimodal Learning for Clinical Decision Support; Lecture Notes in Computer Science Series; Springer International: Cham, Switzerland, 2018; Volume 11045, pp. 3–11. [Google Scholar]
- Oktay, O.; Schlemper, J.; Le Folgoc, L.; Lee, M.; Heinrich, M.; Misawa, K.; Mori, K.; McDonagh, S.; Hammerla, N.Y.; Kainz, B.; et al. Attention U-Net: Learning Where to Look for the Pancreas. arXiv 2018, arXiv:1804.03999. [Google Scholar]
- Jha, D.; Smedsrud, P.H.; Riegler, M.A.; Johansen, D.; De Lange, T.; Halvorsen, P.; Johansen, H.D. ResUNet: An Advanced Architecture for Medical Image Segmentation. In Proceedings of the 2019 IEEE International Symposium on Multimedia (ISM), San Diego, CA, USA, 9–11 December 2019; pp. 225–255. [Google Scholar]
- Vaswani, A.; Shazeer, N.; Parmar, N.; Uszkoreit, J.; Jones, L.; Gomez, A.N.; Kaiser, L.; Polosukhin, I. Attention Is All You Need. Adv. Neural Inf. Process. Syst. 2017, 30. [Google Scholar] [CrossRef]
- Chen, J.; Lu, Y.; Yu, Q.; Luo, X.; Adeli, E.; Wang, Y.; Lu, L.; Yuille, A.L.; Zhou, Y. TransUNet: Transformers Make Strong Encoders for Medical Image Segmentation. arXiv 2021, arXiv:2102.04306. [Google Scholar]
- Xu, J.; Zhang, R.; Zhou, Z.; Wu, C.; Gong, Q.; Zhang, H.; Wu, S.; Wu, G.; Deng, Y.; Xia, C.; et al. Deep network for the automatic segmentation and quantification of intracranial hemorrhage on CT. Front. Neurosci. 2020, 14, 541817. [Google Scholar] [CrossRef]
- Hssayeni, M.D.; Croock, M.S.; Salman, A.D.; Al-khafaji, H.F.; Yahya, Z.A.; Ghoraani, B. Intracranial hemorrhage segmentation using a deep convolutional model. Data 2020, 5, 14. [Google Scholar] [CrossRef]
- Hou, Q.; Zhou, D.; Feng, J. Coordinate attention for efficient mobile network design. In Proceedings of the IEEE/CVF Conference on Computer Vision and Pattern Recognition, Online, 19–25 June 2021; pp. 13713–13722. [Google Scholar]
- Stergiou, A.; Poppe, R.; Kalliatakis, G. Refining Activation Downsampling with SoftPool. In Proceedings of the 2021 IEEE/CVF International Conference on Computer Vision (ICCV), Online, 11–17 October 2021; pp. 10337–10346. [Google Scholar]
- Hu, J.; Shen, L.; Sun, G. Squeeze-and-Excitation Networks. In Proceedings of the 2018 IEEE/CVF Conference on Computer Vision and Pattern Recognition, Salt Lake City, UT, USA, 18–22 June 2018; pp. 7132–7141. [Google Scholar]
- Ferrari, V.; Hebert, M.; Sminchisescu, C.; Weiss, Y. CBAM: Convolutional Block Attention Module. In Proceedings of the Computer Vision—ECCV, Munich, Germany, 8–14 September 2018; Springer International: Cham, Switzerland, 2018; Volume 11211, pp. 3–19. [Google Scholar]
- He, K.; Zhang, X.; Ren, S.; Sun, J. Spatial Pyramid Pooling in Deep Convolutional Networks for Visual Recognition. IEEE Trans. Pattern Anal. Mach. Intell. 2015, 37, 1904–1916. [Google Scholar] [CrossRef]
- He, K.; Zhang, X.; Ren, S.; Sun, J. Deep Residual Learning for Image Recognition. In Proceedings of the 2016 IEEE Conference on Computer Vision and Pattern Recognition (CVPR), Las Vegas, NV, USA, 26 June–1 July 2016; pp. 770–778. [Google Scholar]
- Sudre, C.H.; Li, W.; Vercauteren, T.; Ourselin, S.; Cardoso, M.J. Generalised Dice Overlap as a Deep Learning Loss Function for Highly Unbalanced Segmentations. In Deep Learning in Medical Image Analysis and Multimodal Learning for Clinical Decision Support; Springer: Cham, Switzerland, 2017; pp. 240–248. [Google Scholar]
- Lin, T.-Y.; Goyal, P.; Girshick, R.; He, K.; Dollar, P. Focal Loss for Dense Object Detection. IEEE Trans. Pattern Anal. Mach. Intell. 2020, 42, 318–327. [Google Scholar] [CrossRef]
- Tang, F.; Wang, L.; Ning, C.; Min, X.; Ding, J. CMU-Net: A Strong ConvMixer-based Medical Ultrasound Image Segmentation Network. arXiv 2022, arXiv:2210.13012. [Google Scholar]
- Altameem, A.; Mahanty, C.; Poonia, R.C.; Saudagar, A.K.J.; Kumar, R. Breast Cancer Detection in Mammography Images Using Deep Convolutional Neural Networks and Fuzzy Ensemble Modeling Techniques. Diagnostics 2022, 12, 1812. [Google Scholar] [CrossRef]


Disclaimer/Publisher’s Note: The statements, opinions and data contained in all publications are solely those of the individual author(s) and contributor(s) and not of MDPI and/or the editor(s). MDPI and/or the editor(s) disclaim responsibility for any injury to people or property resulting from any ideas, methods, instructions or products referred to in the content. |
© 2023 by the authors. Licensee MDPI, Basel, Switzerland. This article is an open access article distributed under the terms and conditions of the Creative Commons Attribution (CC BY) license (https://creativecommons.org/licenses/by/4.0/).