Abstract
As underground engineering extends into the western and deeper regions of China, more and more Luohe Formation sandstone layers will be encountered, which have weak cementation and high water content. It is a significant challenge to apply the open TBM, and the support system is crucial in determining whether TBM can excavate quickly and safely. Therefore, in order to optimize the support scheme, this paper analyzes the pore structure and porosity through CT scanning, the results indicate that the volume percentage of pores ≥34 μm is 2.3% and 1.5%, respectively, the large pore apertures are predominant, the surrounding rock has strong permeability, and there is a high risk of rock burst and roof collapse accidents, hence requiring reinforced support measures. On this basis, numerical simulations were conducted to evaluate the support effectiveness. The results show that replacing the “bolt + mesh” with a “bolt + cable + mesh + steel belt”, and replacing the top three bolts with 7.3 m anchor cables, can better control the deformation and provide sufficient thrust force for the TBM, ensuring excavation speed. After the implementation of this scheme at the Kekegai coal mine in Shaanxi, China, the TBM excavation speed increased by 70%, from the previous 10 m/day to 17 m/d, significantly reducing the project duration and construction costs.
1. Introduction
The Luohe Formation sandstone is a widely distributed sedimentary rock in the northwest region of China, with a burial depth of approximately 200 m and a thickness ranging from 48.6 to 221.4 m. Due to its late diagenesis, low cementation degree, and high water content, it exhibits relatively poor physical and mechanical properties, characterized by low strength, susceptibility to disintegration, and a tendency to undergo cementation upon contact with water. During excavation processes, issues such as roof collapse and sidewall collapse frequently occur, impacting construction safety and progress [1].
The open TBM (Tunnel Boring Machine) is a full-section rock boring machine that uses booting boots to tighten the tunnel wall, which is suitable for rock tunnels where the rock should not collapse and the formation is relatively stable. The open TBM is widely used in underground construction projects such as water diversion projects, and transportation tunnels due to its fast excavation speed, low labor intensity, and high safety factor. However, these projects often primarily involve hard rock formations, and open TBM applications in soft rock formations are less common.
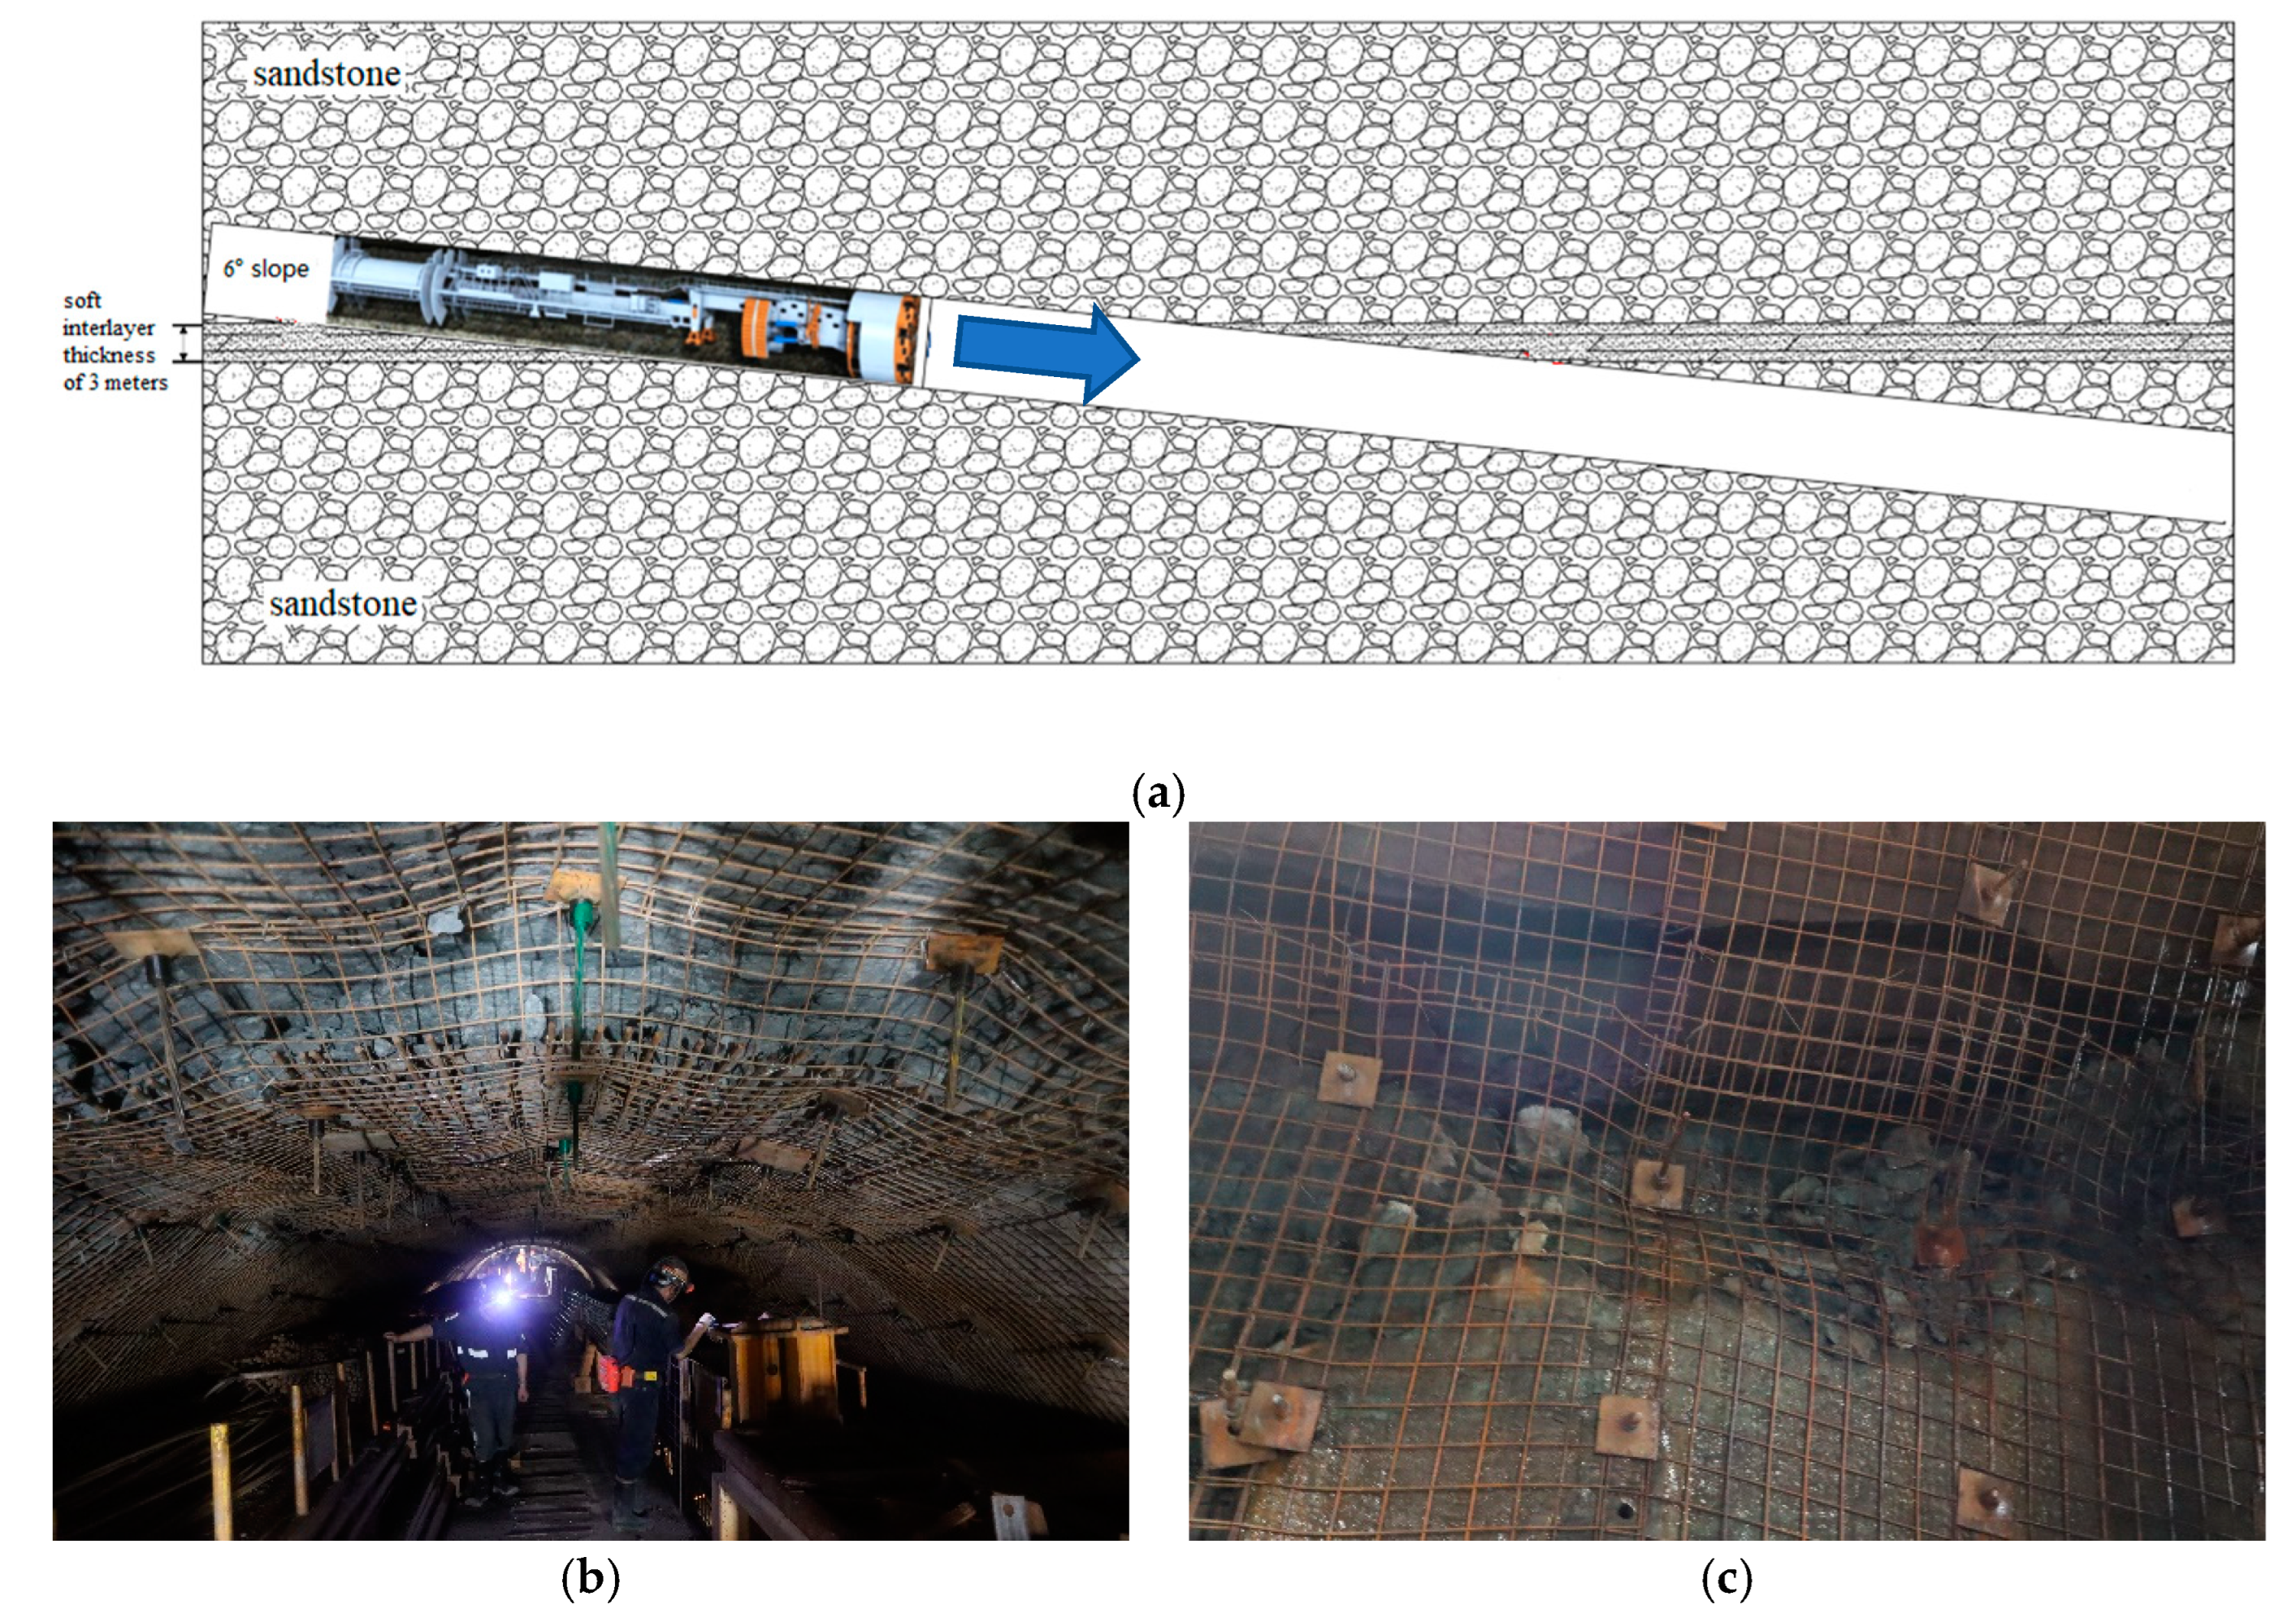
With the increase in infrastructure construction and energy development in western China, underground engineering construction will inevitably face weakly consolidated sandstone formation, Conventional anchor mesh support is unable to adapt to the geological conditions of this stratum, making it ineffective in maintaining the stability of the surrounding rock. Meanwhile, traditional construction methods such as freezing and drilling and blasting are not suitable for achieving rapid construction. To expedite the early production of Kekegei coal mine in Yulin, China, an open TBM will be used for inclined shaft construction, marking the first global application of this technology. However, during the excavation process, the TBM will encounter the Luohe Formation, characterized by weak rock cementation and a high water content. Water inflow will start to increase as the construction progresses, reaching a peak of 308 m3/h at a distance of 2030 m from the tunnel entrance. The formation contains numerous soft interlayers and experiences severe interbedding of mudstone, leading to significant roof collapses and sidewall instability, as illustrated in Figure 1. To ensure smooth construction, it is essential to conduct a study of the microstructural characteristics of the rock and propose targeted optimization measures [2].
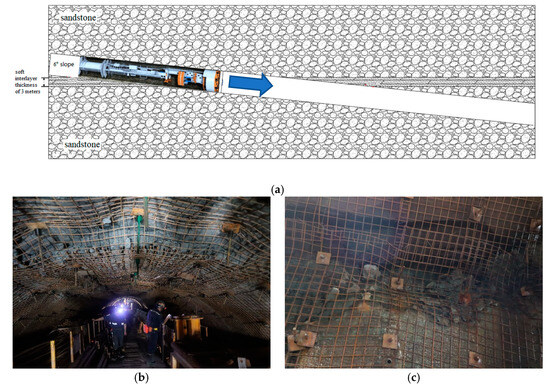
Figure 1.
The open TBM traverses the Luohe Formation. (a) Schematic diagram of the open TBM crossing the Luohe Formation. (b) Roof collapse. (c) Sidewall instability.
Some scholars have conducted research on the failure characteristics of the Luohe Formation sandstone, primarily focusing on rock mechanics properties such as uniaxial compression, triaxial compression, and water-induced softening [3,4]. This research has provided some insights into the analysis of the surrounding rock failure mechanisms. However, there has been limited investigation into its microscopic properties, especially pore structure. Further research is needed, particularly in the context of support optimization.
X-ray diffraction, polarizing microscopy and scanning electron microscopy are important means for detailed analysis of the diagenetic process and microstructure of rocks [5,6]. On this basis, some scholars [7,8] have carried out analysis from the perspectives of water absorption characteristics, water softening characteristics and mechanical properties.
Zheng Da et al. [9] conducted thin slice sampling of two different phyllite fracture samples, analyzed the microscopic morphology characteristics of thin slices, and proved the relationship between the microscopic fracture mode, fracture mechanism and mineral composition of rocks.
The results show that the physical and mechanical properties, mineral composition and microstructure of rock have important effects on the deformation and failure characteristics of surrounding rock after tunnel excavation [10,11,12].
Liang Bing et al. [13] studied the disintegration characteristics of argillaceous rocks in solutions with different pH values. Tan Luorong [14] conducted a large number of indoor disintegration tests to analyze and discuss the relationship between the argillation, water absorption disintegration of common clay rocks and mudstones in underground engineering and the physical and mechanical parameters of rock mass.
Computed tomography (CT) is the most widely used non-destructive 3D imaging technology, and its biggest advantage is that it can reflect the internal spatial structure of the sample in situ without introducing human defects [15].
Louis et al. [16] used X-ray CT to study the failure mode of sandstone with layered structure. Kwang Yeom Kim et al. [17] established a discrete element model conforming to the anisotropy characteristics of the Berea sandstone in northern Ohio through CT scanning. Jasmin Ambrose [18] conducted CT scanning of the damaged Bossier shale and obtained the distribution rules of failure surfaces of rock samples under different confining pressures and different angles under triaxial compression. Liu Hui et al. [19] conducted in situ CT real-time scanning tests on the damage process of sandstone under the combined action of freeze–thaw and load.
Research shows that petro-mechanical properties of sandstones varies as function of the mineralogy and diagenesis; therefore, the new microscopic characteristic analysis method is of great significance to guide the engineering construction [20,21].
To sum up, although some scholars have studied the microscopic characteristics of Luohe Formation sandstone, there are few studies on the use of CT to analyze its pore structure, and there is also a lack of studies on the application of open TBM support optimization measures in this formation. Therefore, in order to realize the rapid excavation of the open TBM, this paper analyzes the pore structure of Luohe Formation sandstone through CT scanning, and study the support optimization scheme by means of numerical simulation.
2. CT Scan
2.1. Sample Preparation
At a depth of 250 m in the inclined shaft of the Kekegai coal mine, hand-held drilling equipment was used to obtain samples from the Luohe Formation stratum at the construction site; drill sleeve diameter 80 mm and length 30 cm. In this core-taking, a total of 2 holes were drilled, one on each side of the left and right side, the deep samples were selected and processed into 3 standard rock samples of 5 cm × 10 cm, marked and wrapped for CT scanning, and 2 scan results were selected for analysis, as shown in Figure 2.
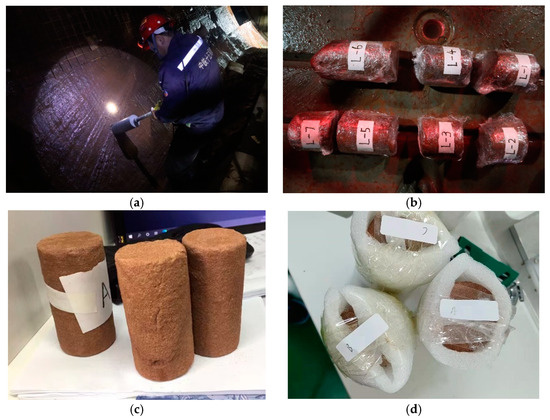
Figure 2.
Sample preparation. (a) Coring. (b) Rock sample. (c) Standard sample. (d) sample to be scanned.
2.2. Scanning Principle
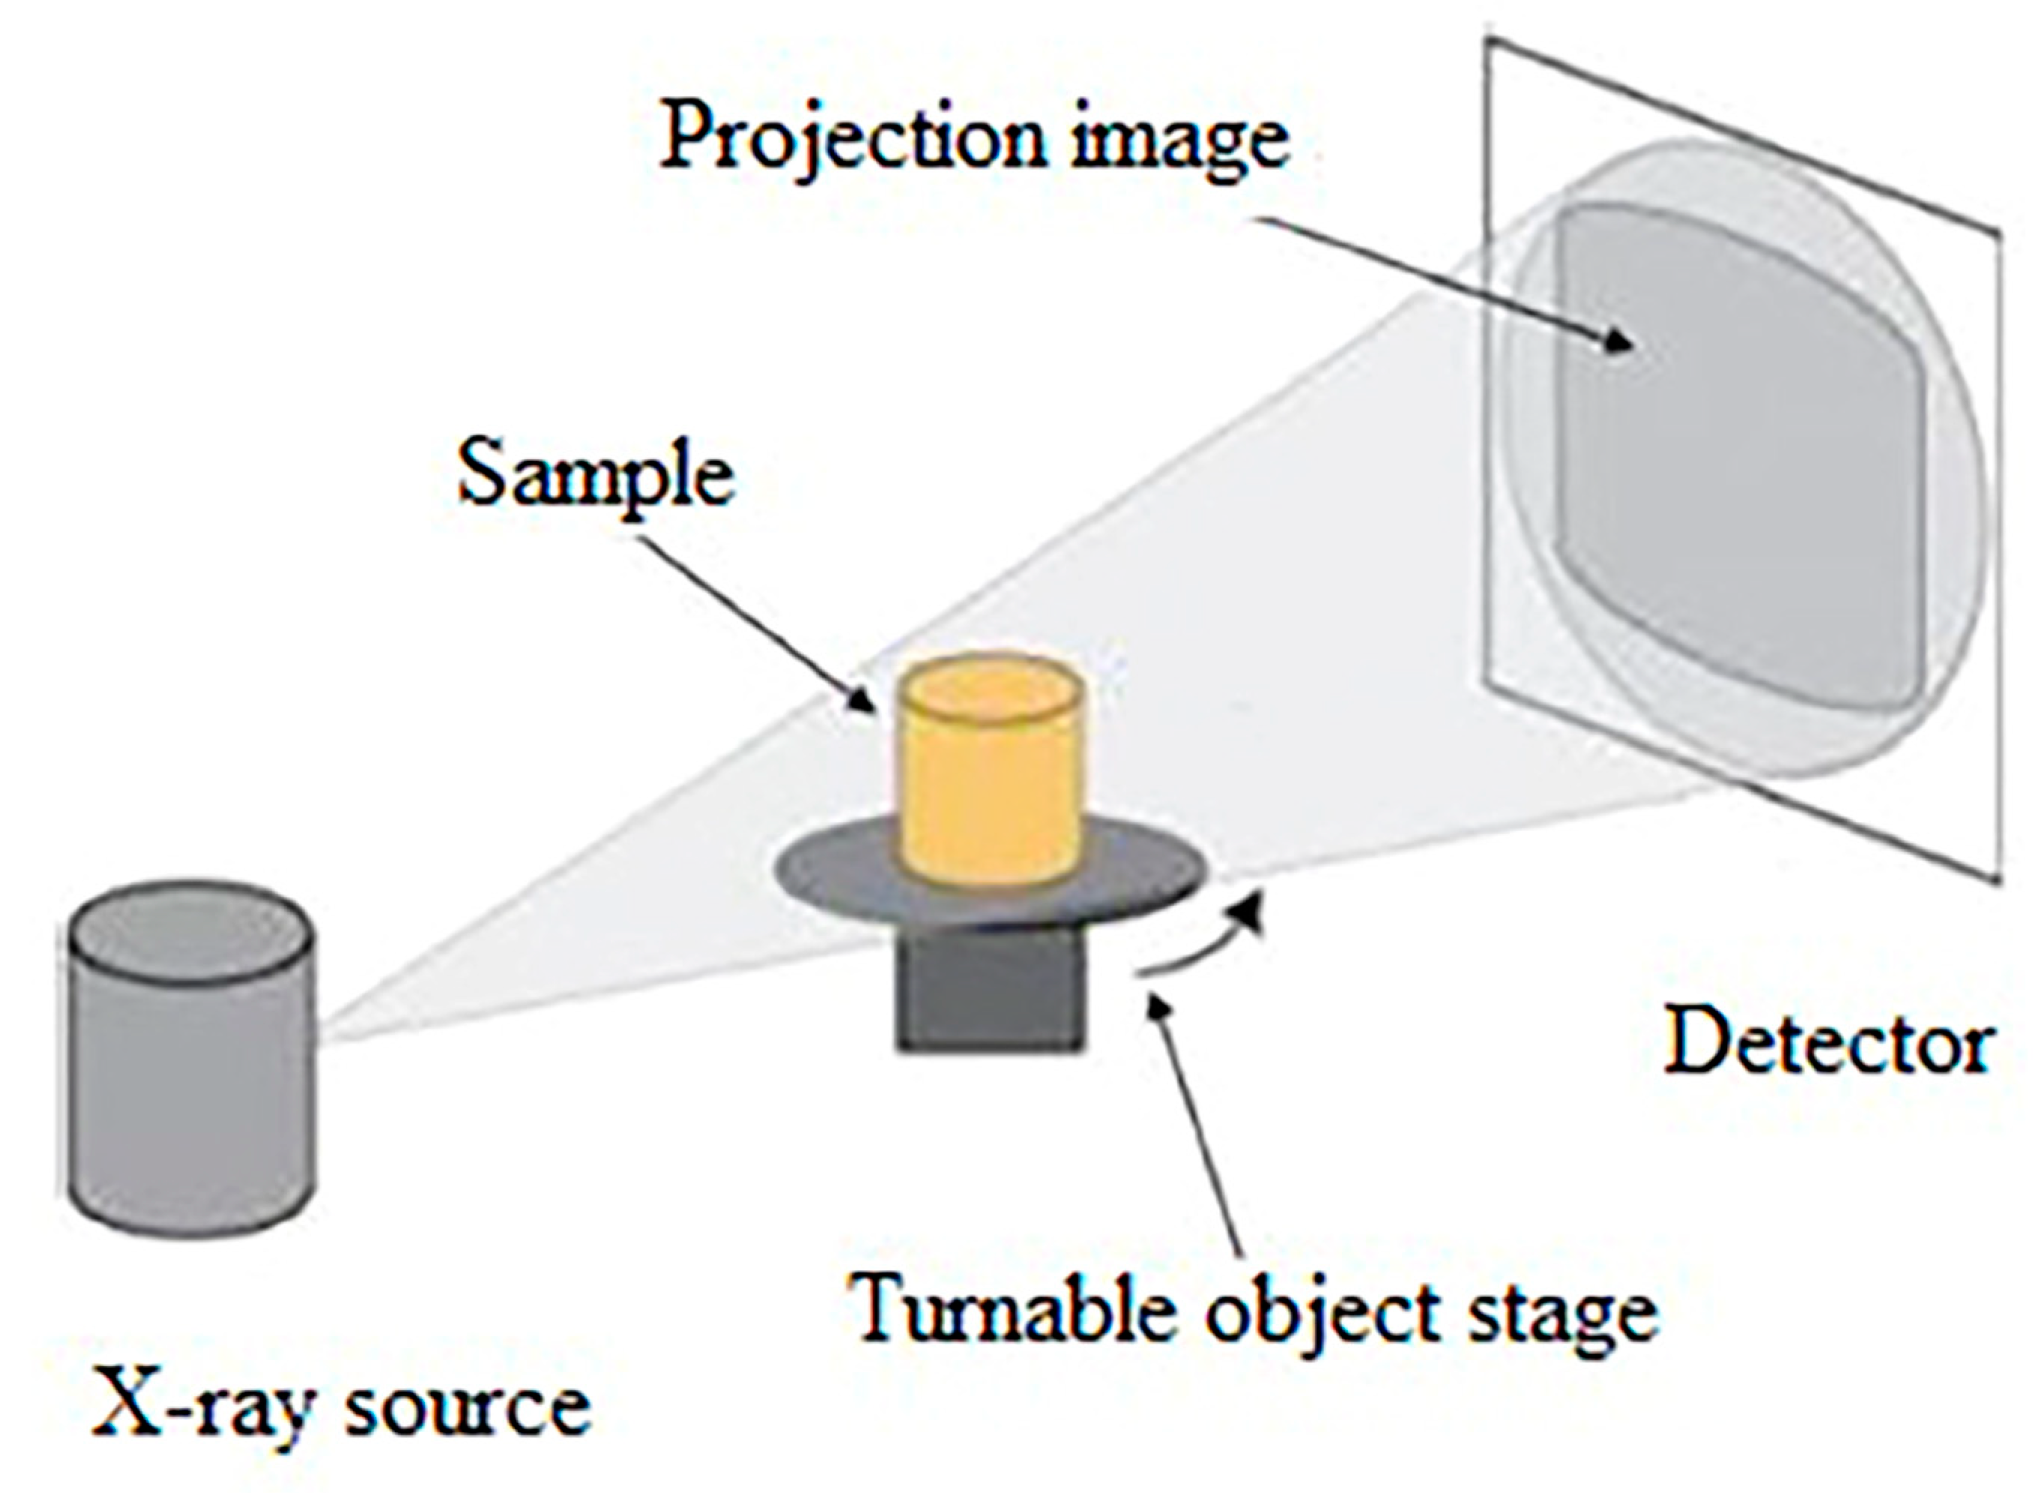
High-resolution CT uses the cone-beam X-ray emitted by the micro-focus ray source to penetrate the sample and project it onto the detector. At the same time, the sample, the ray source and the detector are rotated 360° relative to each other, and thousands of frame Angle data are collected, and then 3D reconstruction is carried out by the computed tomography imaging reconstruction method to obtain high-resolution 3D data and images of the internal and external structures of the sample.
The features of high-resolution CT are as follows:
- Non-destructive, fluoroscopic, high-resolution, three-dimensional imaging, which can display and analyze small features through a large amount of image data without loss.
- CT images reflect the degree of energy attenuation in the process of X-ray penetrating the object, and its attenuation process conforms to the attenuation Formula (1). The macro research scale, the relative density of the internal structure of the sample is positively correlated with the gray level of CT images.
At present, the imaging principle of CT technology is to calculate the ray absorption coefficient of each element in the sample (mainly affected by density), and then use this as the basis for distinguishing different components. The schematic diagram is shown in Figure 3.
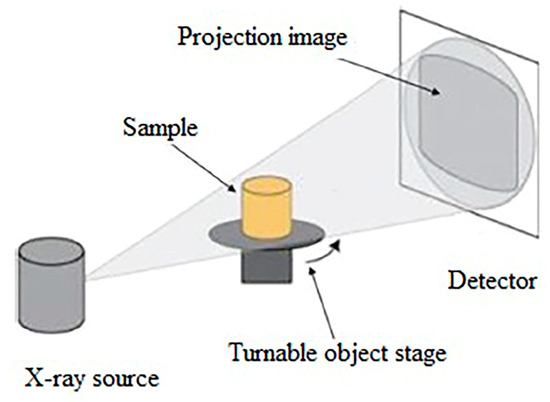
Figure 3.
Scanning principle.
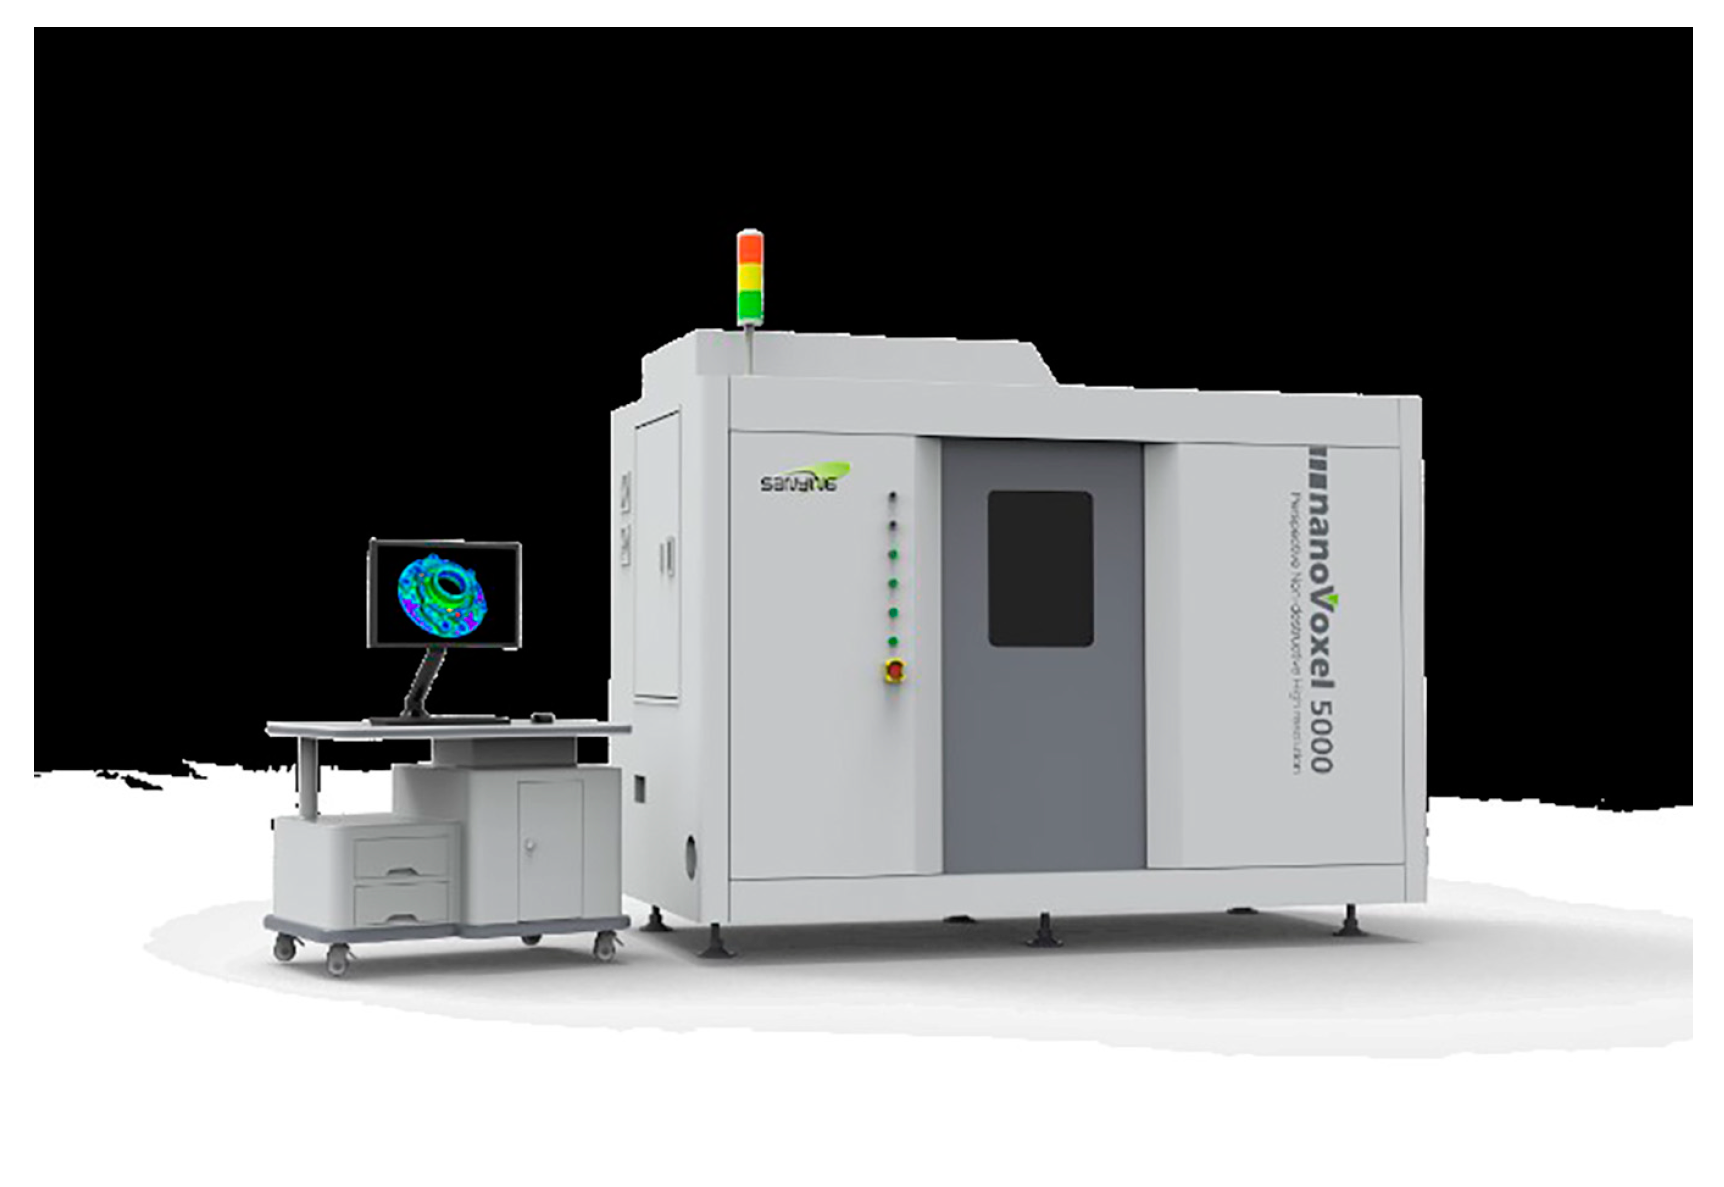
A nanoVoxel4000 micro-nano high-resolution CT scanner produced by Tianjin Sanying Precision Instrument Co., Ltd. (Tianjin, China) was used in this test. The photo is shown in Figure 4 and the instrument parameters are shown in Table 1. The resolution selected for this scan is 34 μm.
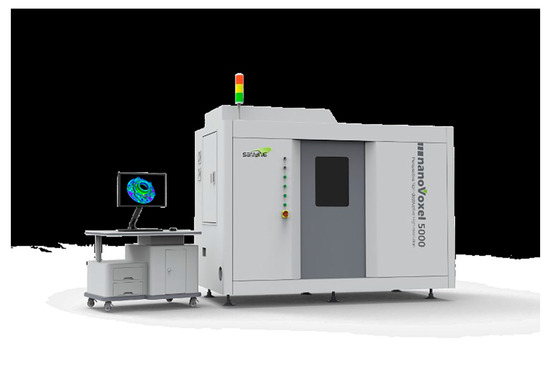
Figure 4.
nanoVoxel4000.

Table 1.
Basic performance parameters of the instrument.
3. Result Analysis
Based on computer high-resolution tomography (micro-CT), the samples were scanned and 3D reconstructed digitally, and the structural characteristics of the samples were analyzed.
According to the scanning results, two groups were selected for analysis.
3.1. Two-Dimensional Slice Display
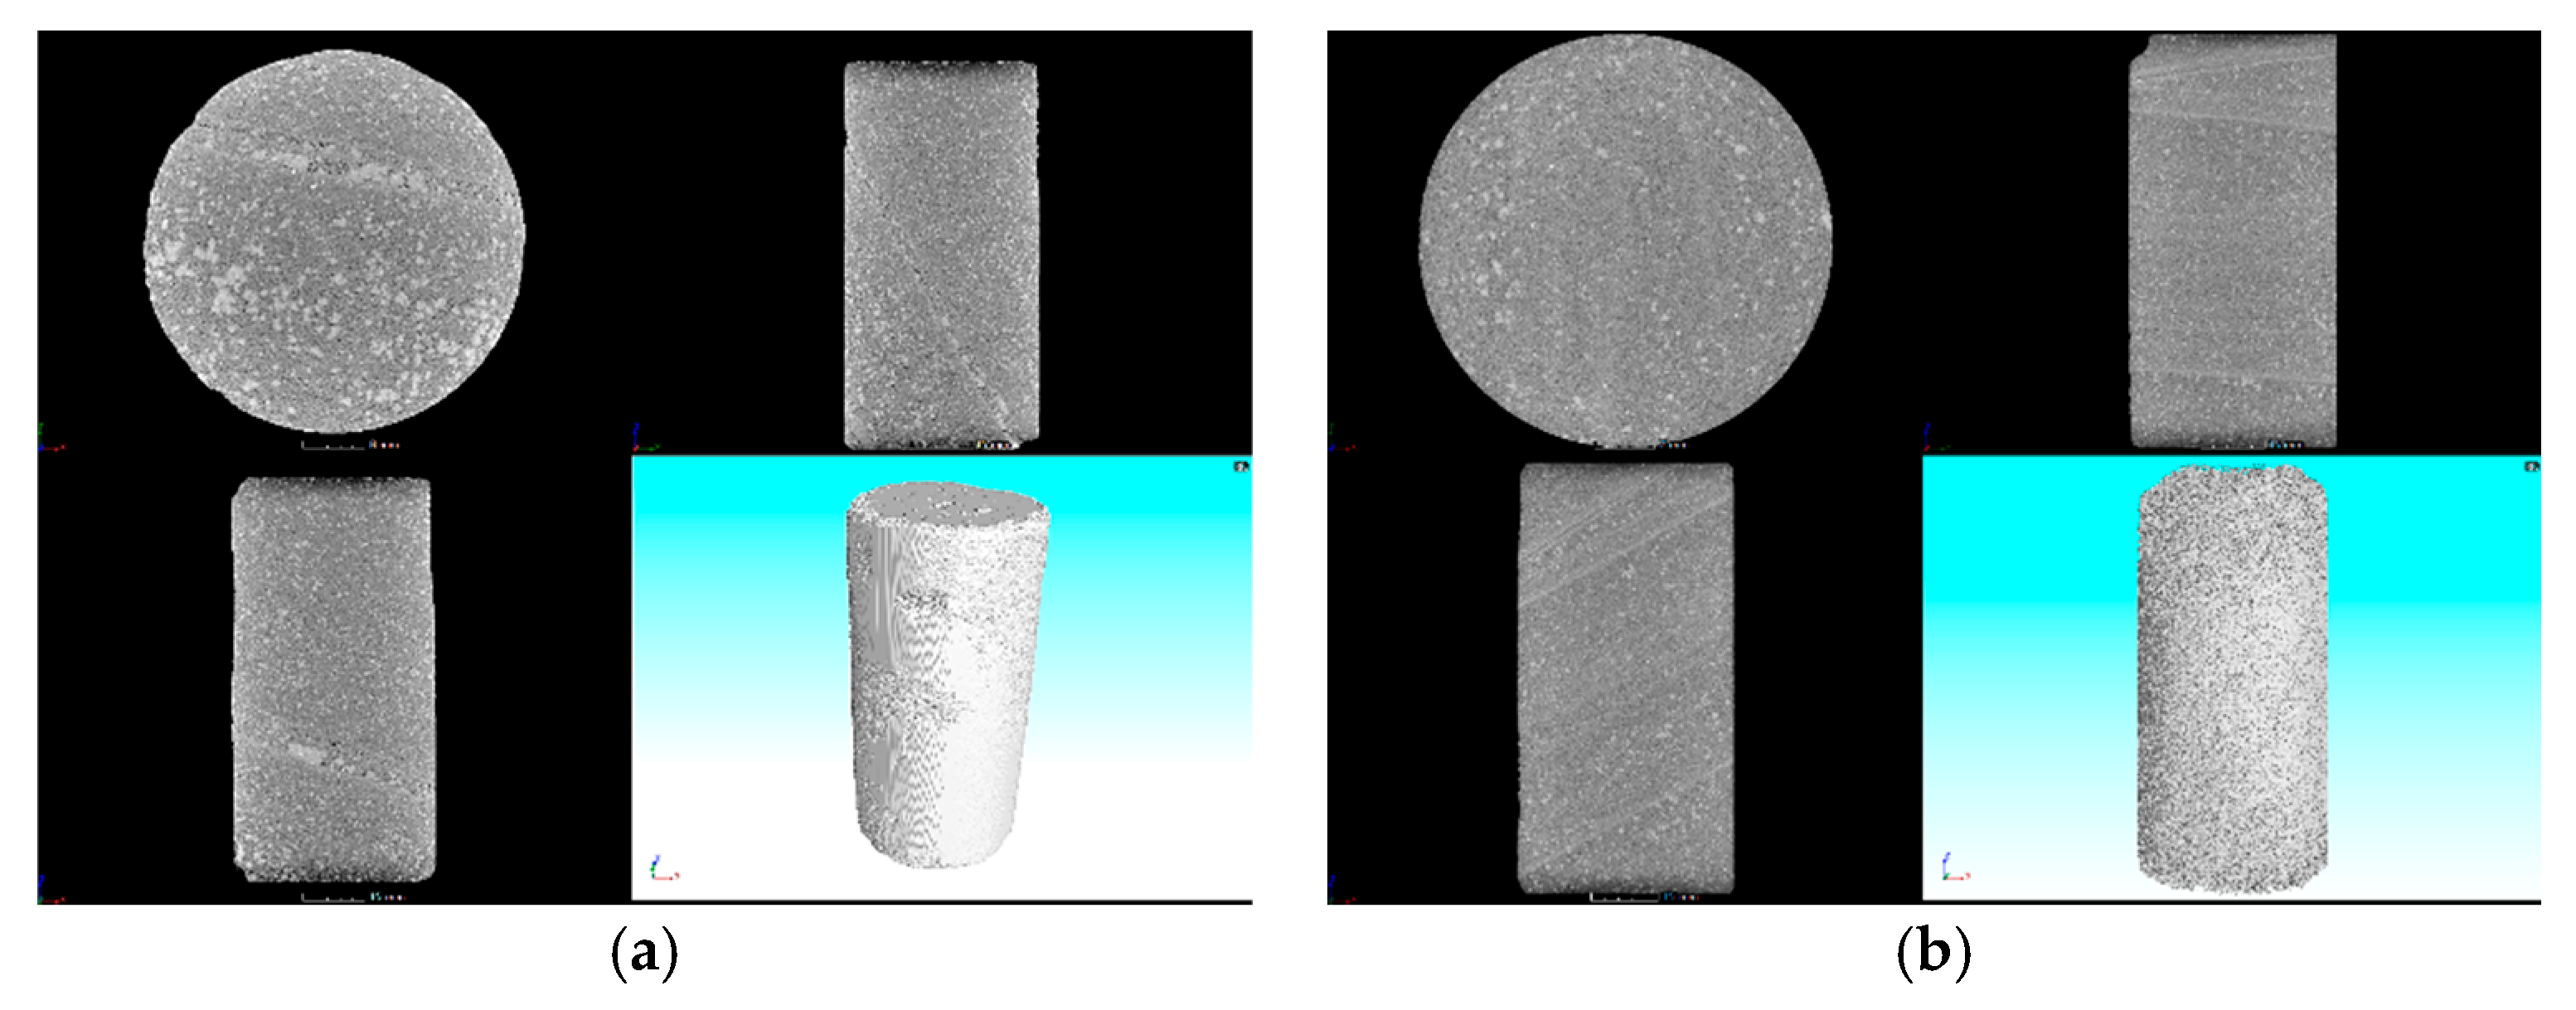
The two-dimensional section diagram in the XY, XZ and YZ directions can be used to better observe the internal structure of the sample and identify the low-density pores and high-density mineral particles, and the distribution characteristics of the pores can be well understood, as shown in Figure 5.
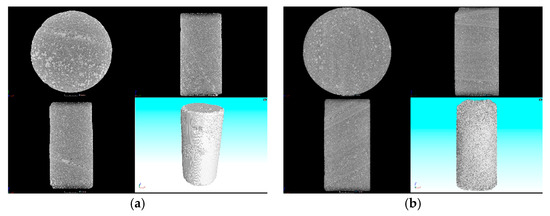
Figure 5.
Two-dimensional slice display. (a) Sample 1. (b) Sample 2.
3.2. Three-Dimensional Display
As shown in Figure 6 and Figure 7, the three-dimensional effects of cracks and samples fully demonstrate the distribution characteristics of cracks and minerals in three-dimensional space.
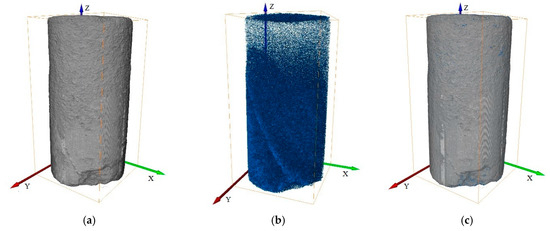
Figure 6.
Sample 1 3D display. (a) Sample 3D display. (b) Pore 3d display. (c) Sample + Pore 3d display.
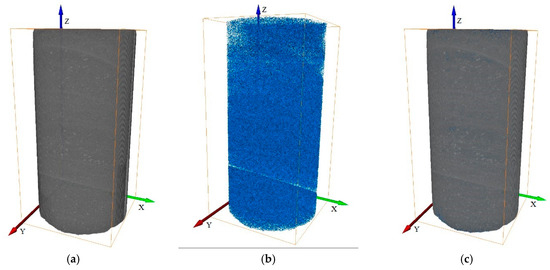
Figure 7.
Sample 2 3D display. (a) Sample 3D display. (b) Pore 3d display. (c) Sample + Pore 3d display.
Through 3D image display, it is found that the distribution of pore groups is relatively uniform, and the connectivity of strata can be effectively increased if reasonable engineering transformation is carried out in the future.
3.3. Pore Analysis
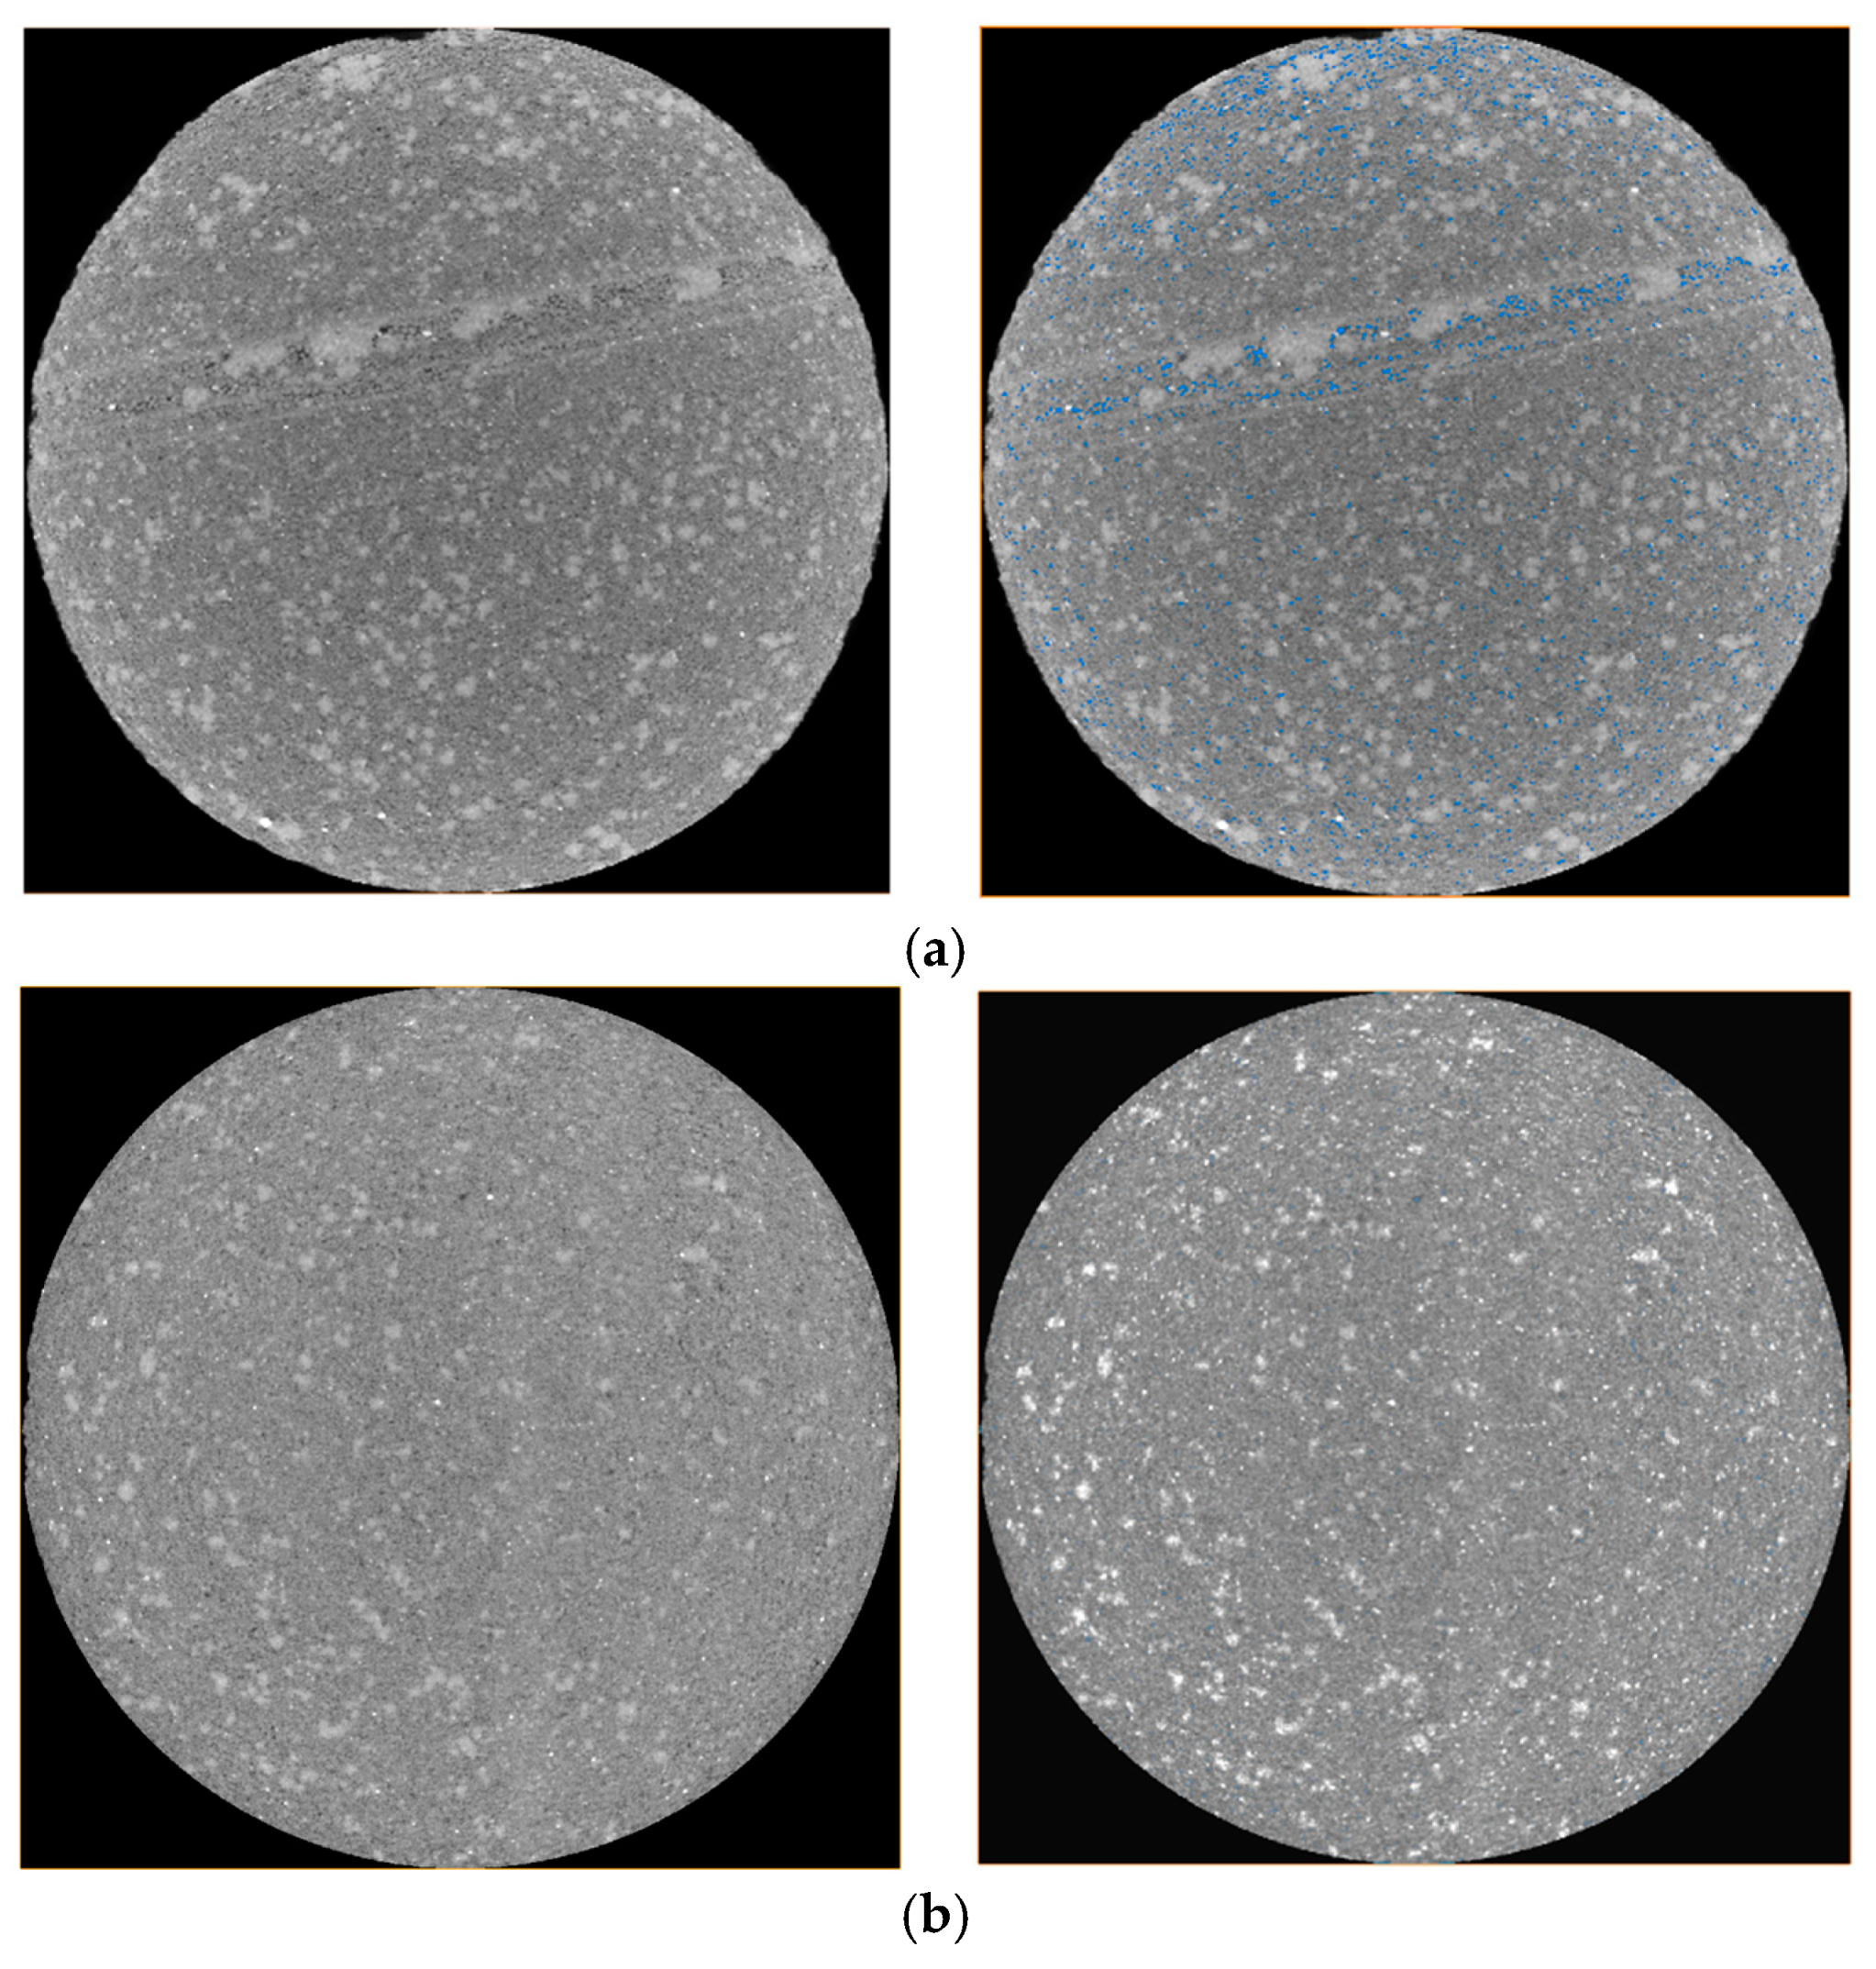
In order to understand the pore content and size of rocks, pores need to be extracted for analysis, as shown in Figure 8.
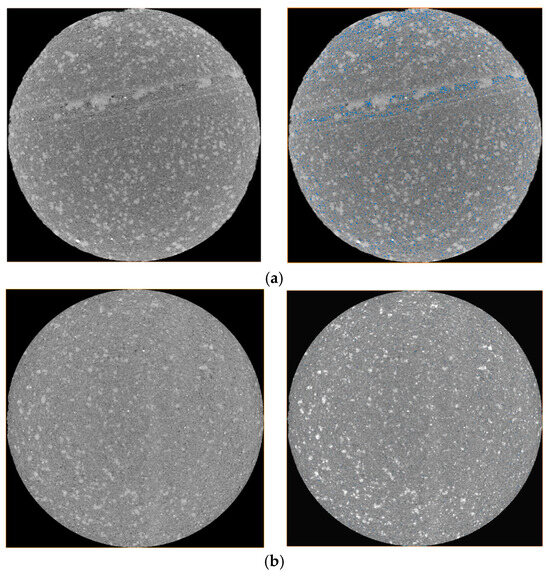
Figure 8.
Crack extraction by threshold segmentation. (a) Sample 1. (b) Sample 2.
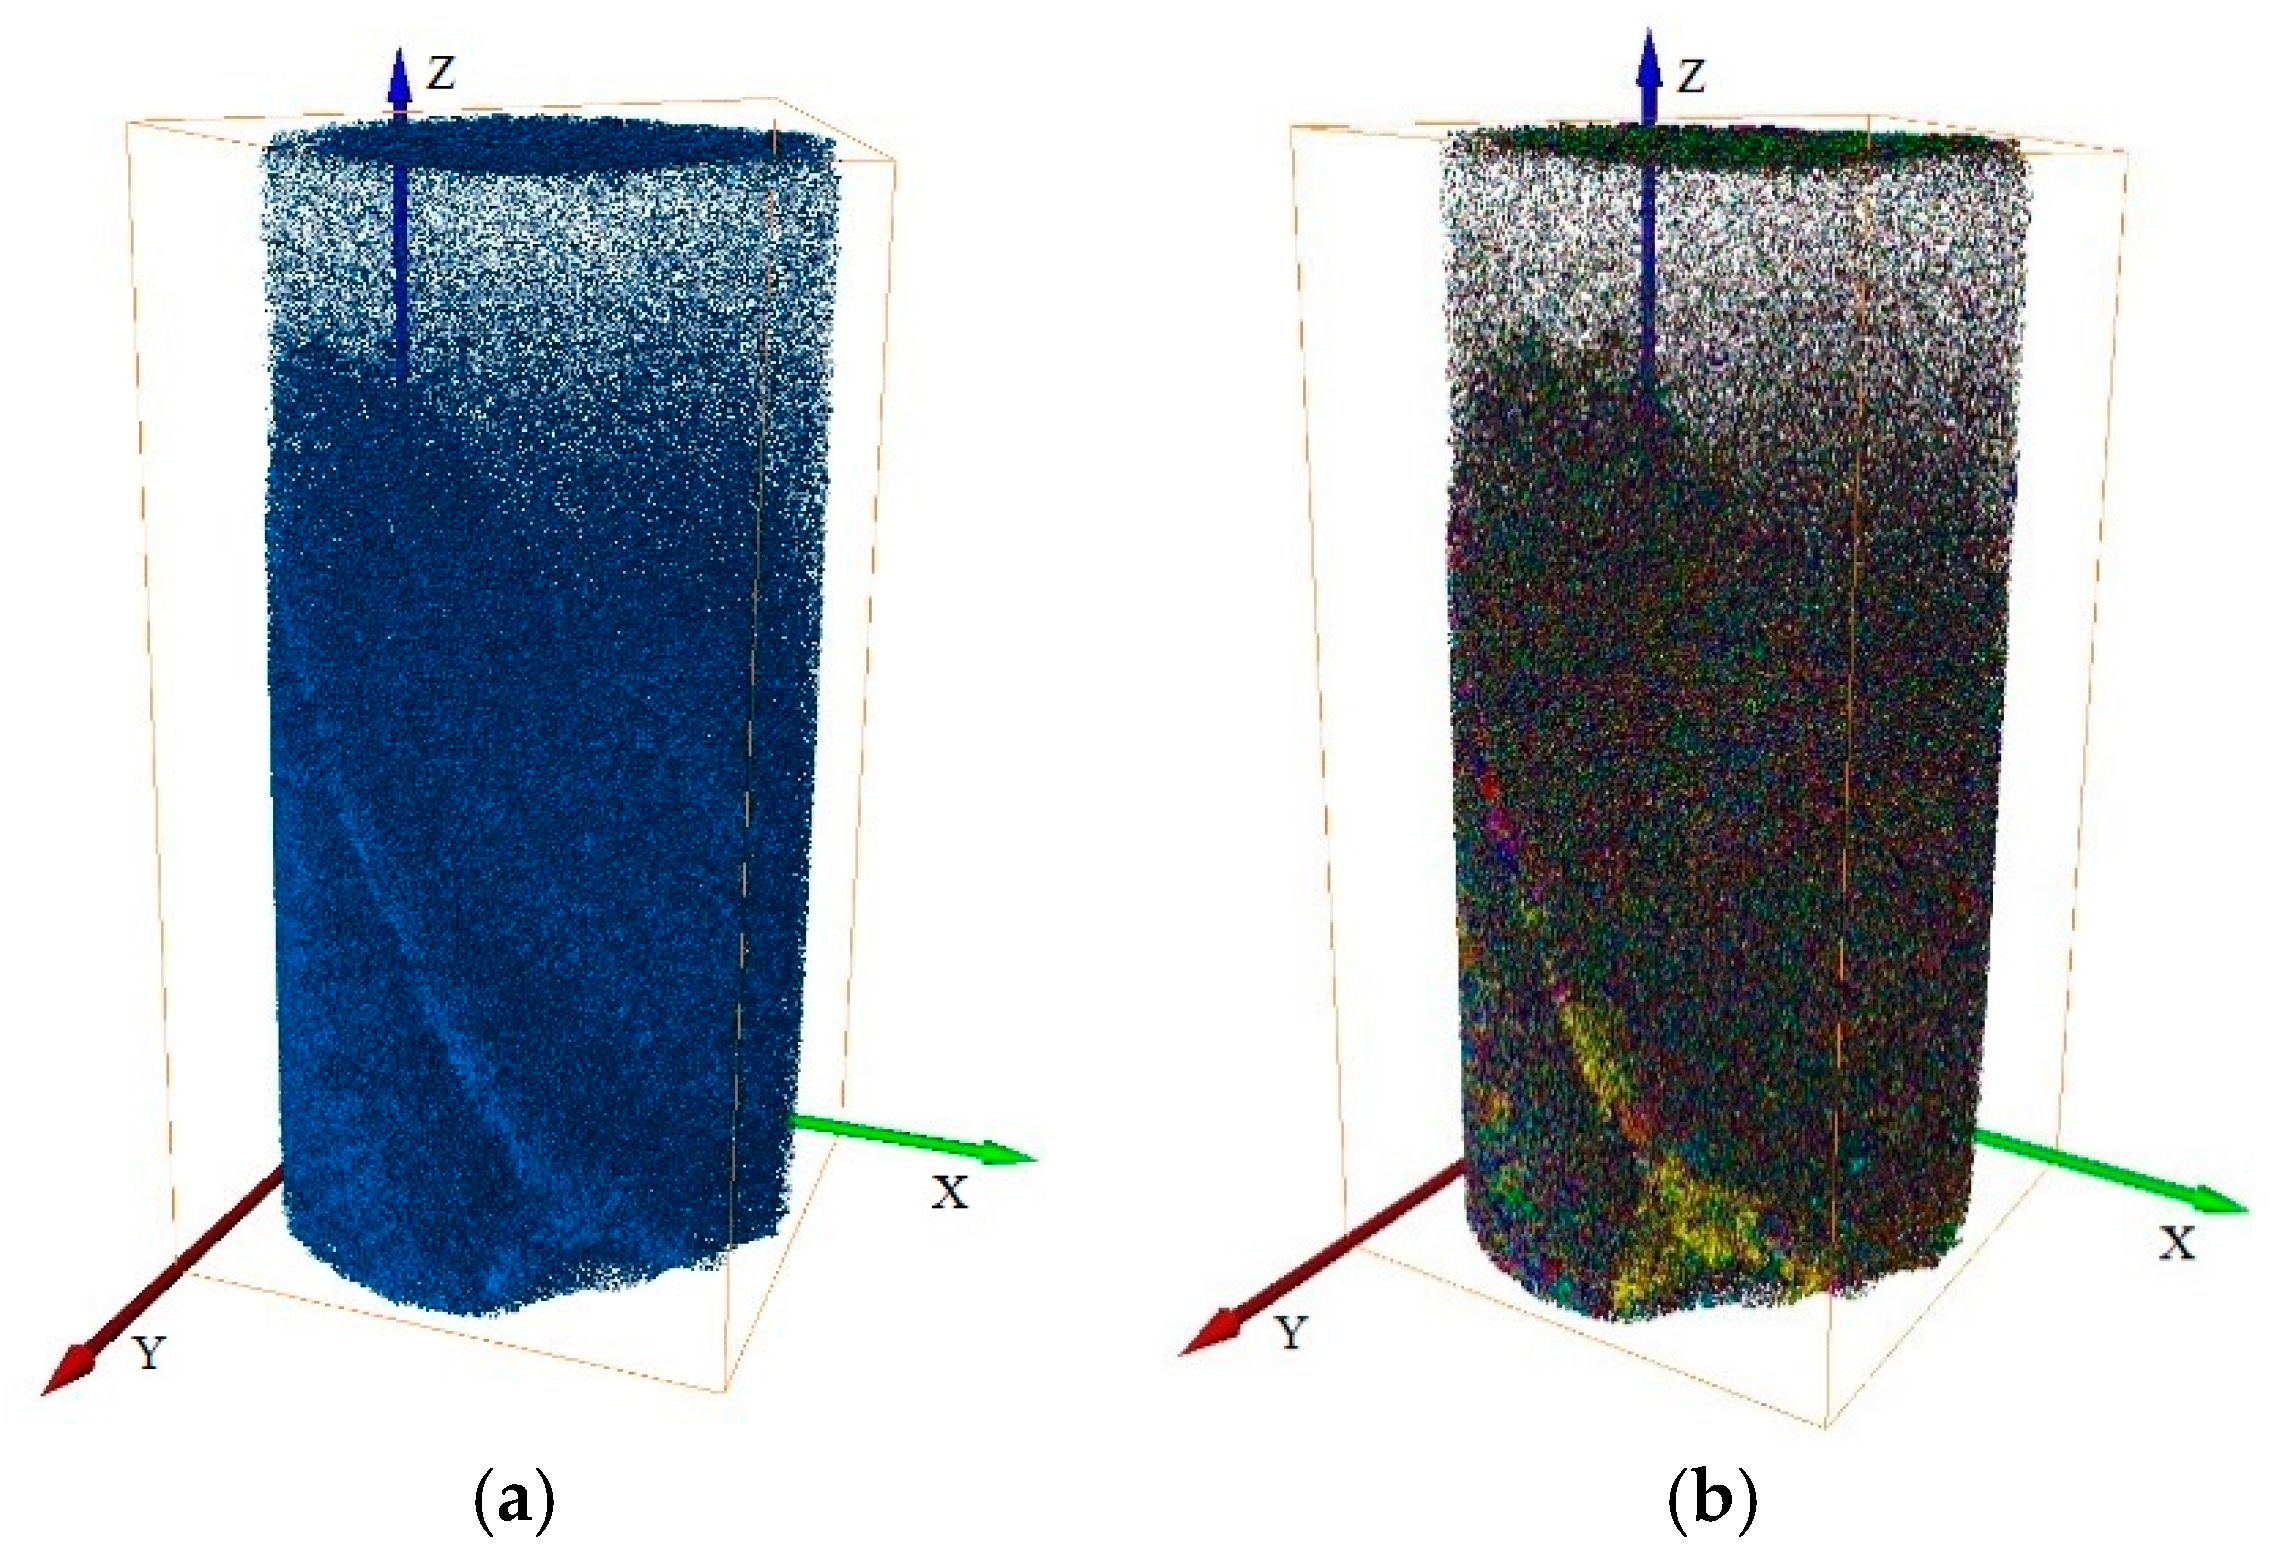
For the sample scanning data, the pores were extracted through threshold segmentation (as shown in Figure 9 and Figure 10), and the volume percentage of pores ≥34 μm in the total volume of the scanned samples was calculated under the current resolution (34 μm), that is, the porosity was 2.3% and 1.5%, respectively.

Figure 9.
Sample 1—crack extraction and display. (a) A 3D map of pore structure. (b) Pore labeling.
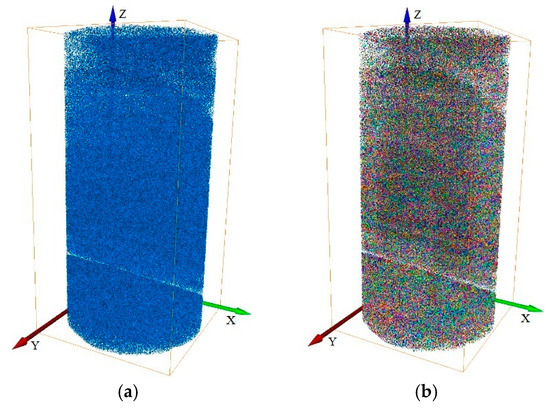
Figure 10.
Sample 2—crack extraction and display. (a) A 3D map of pore structure. (b) Pore labeling.
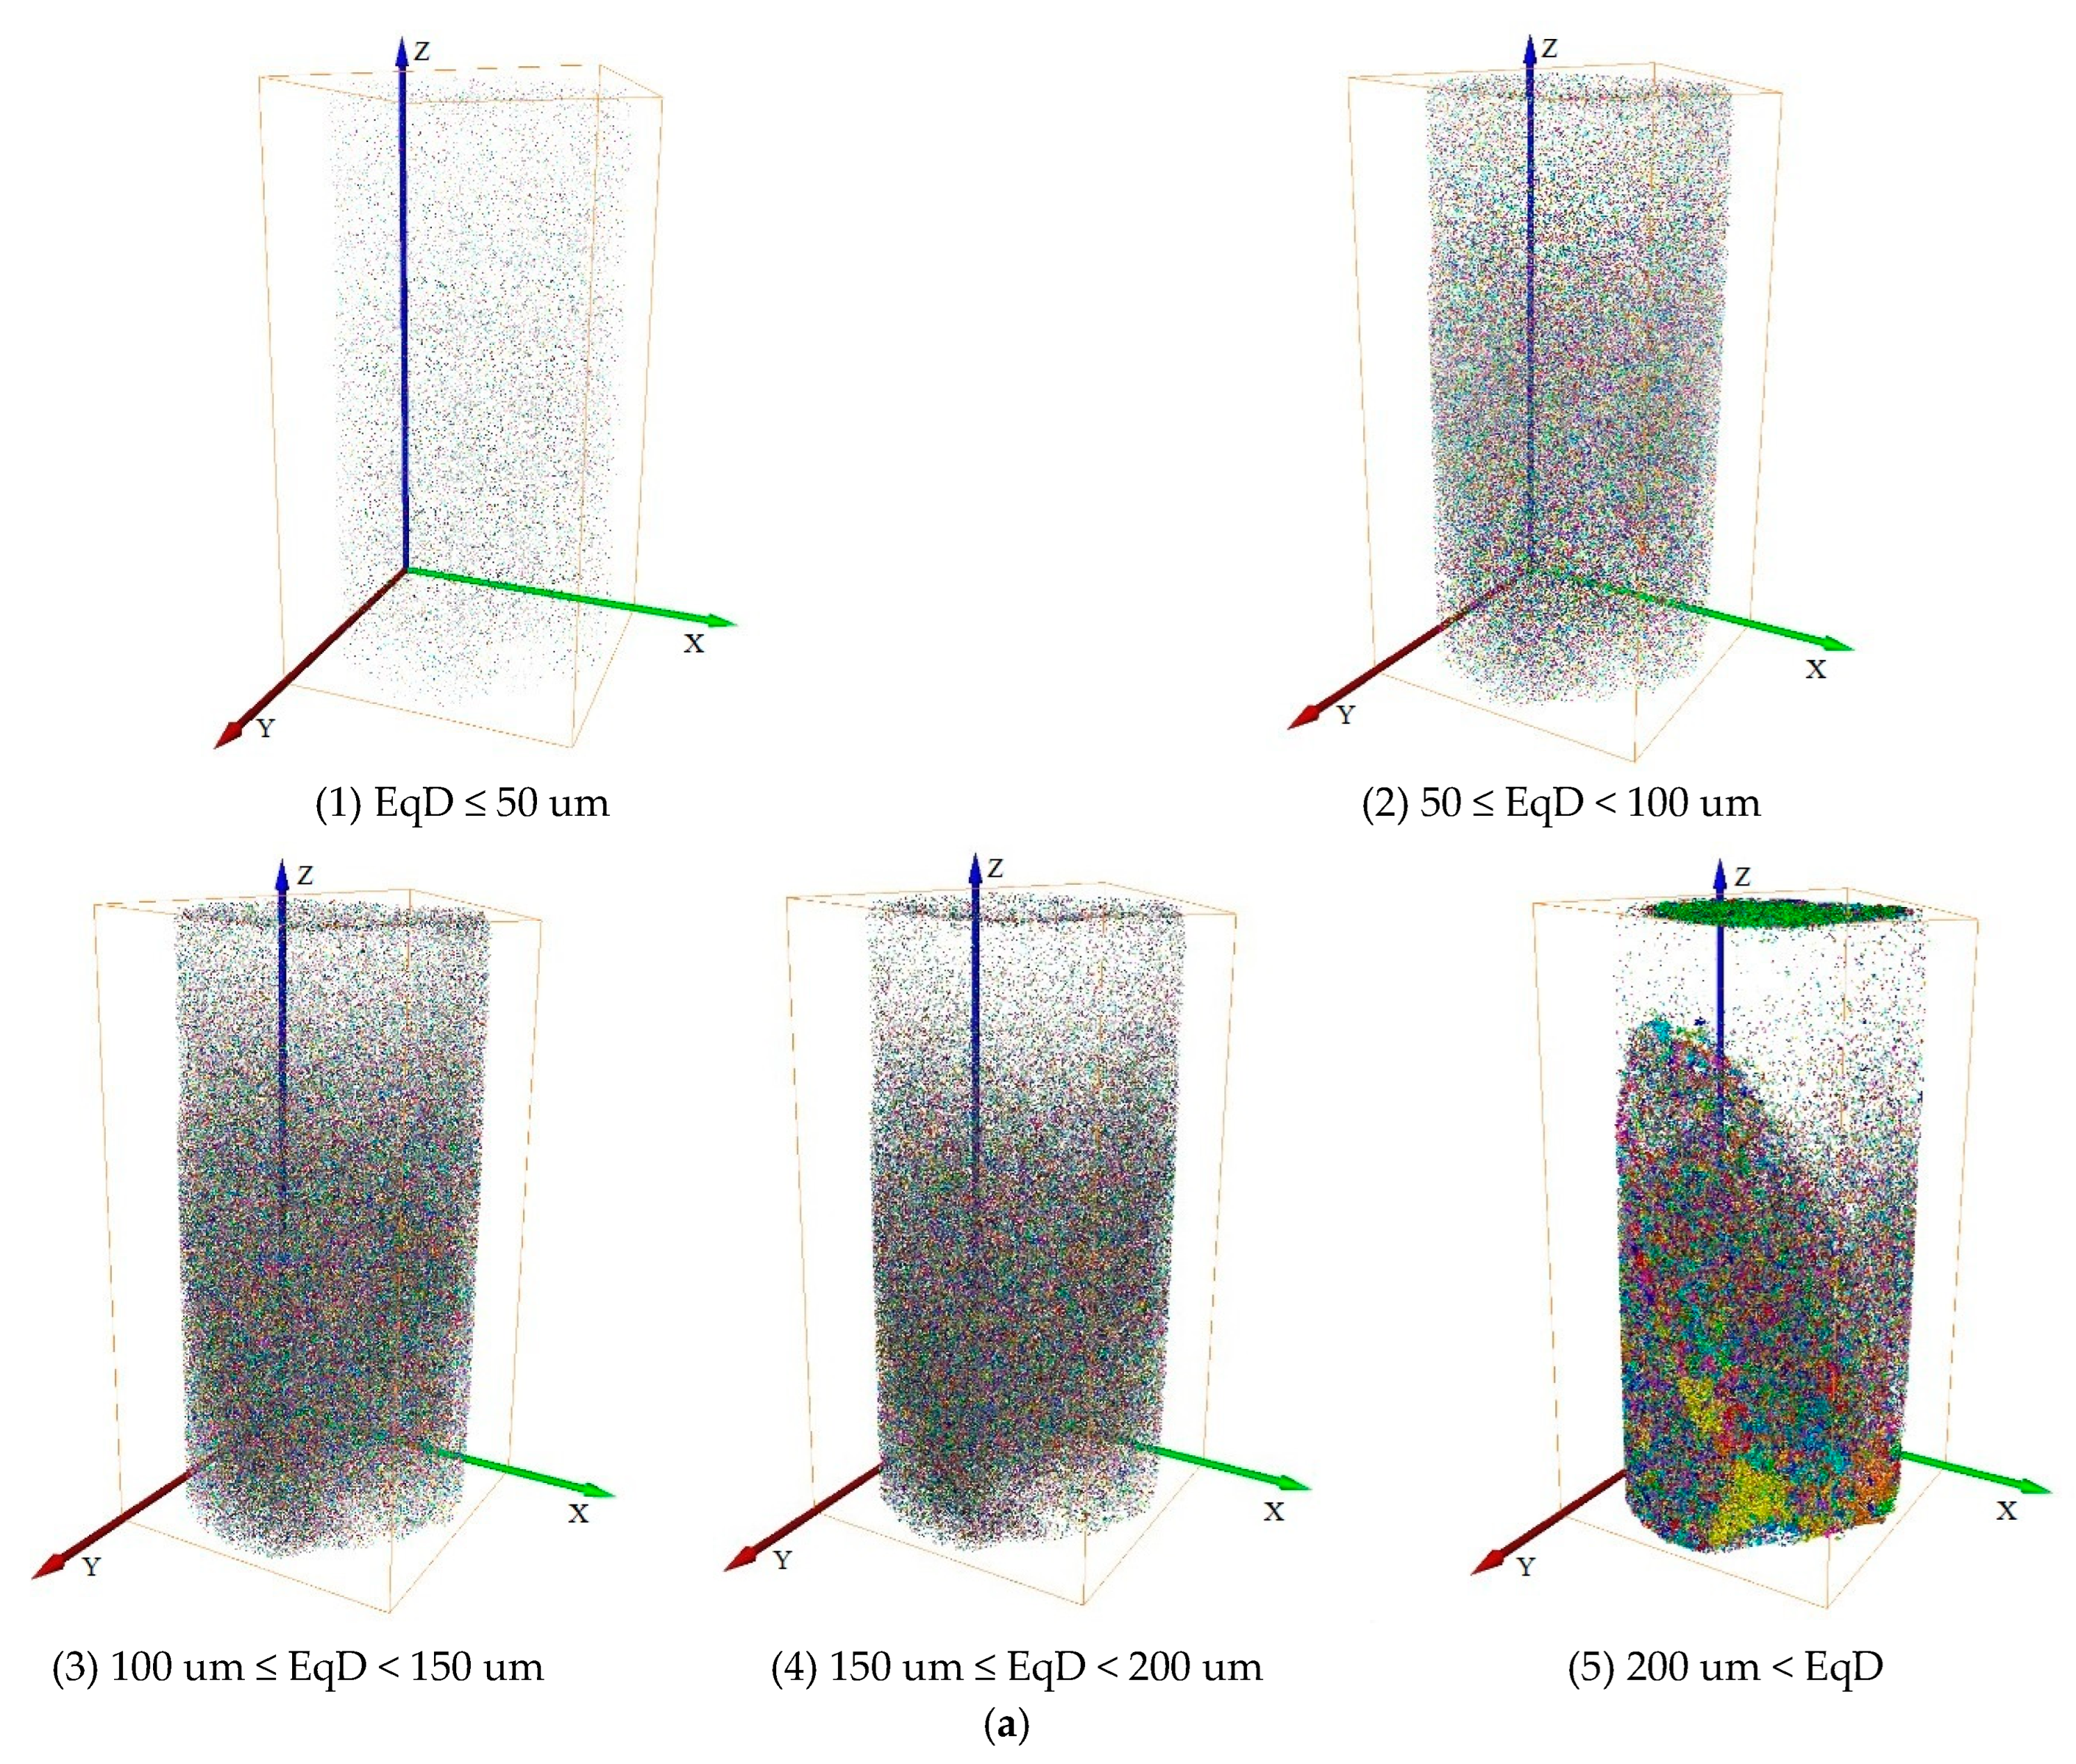
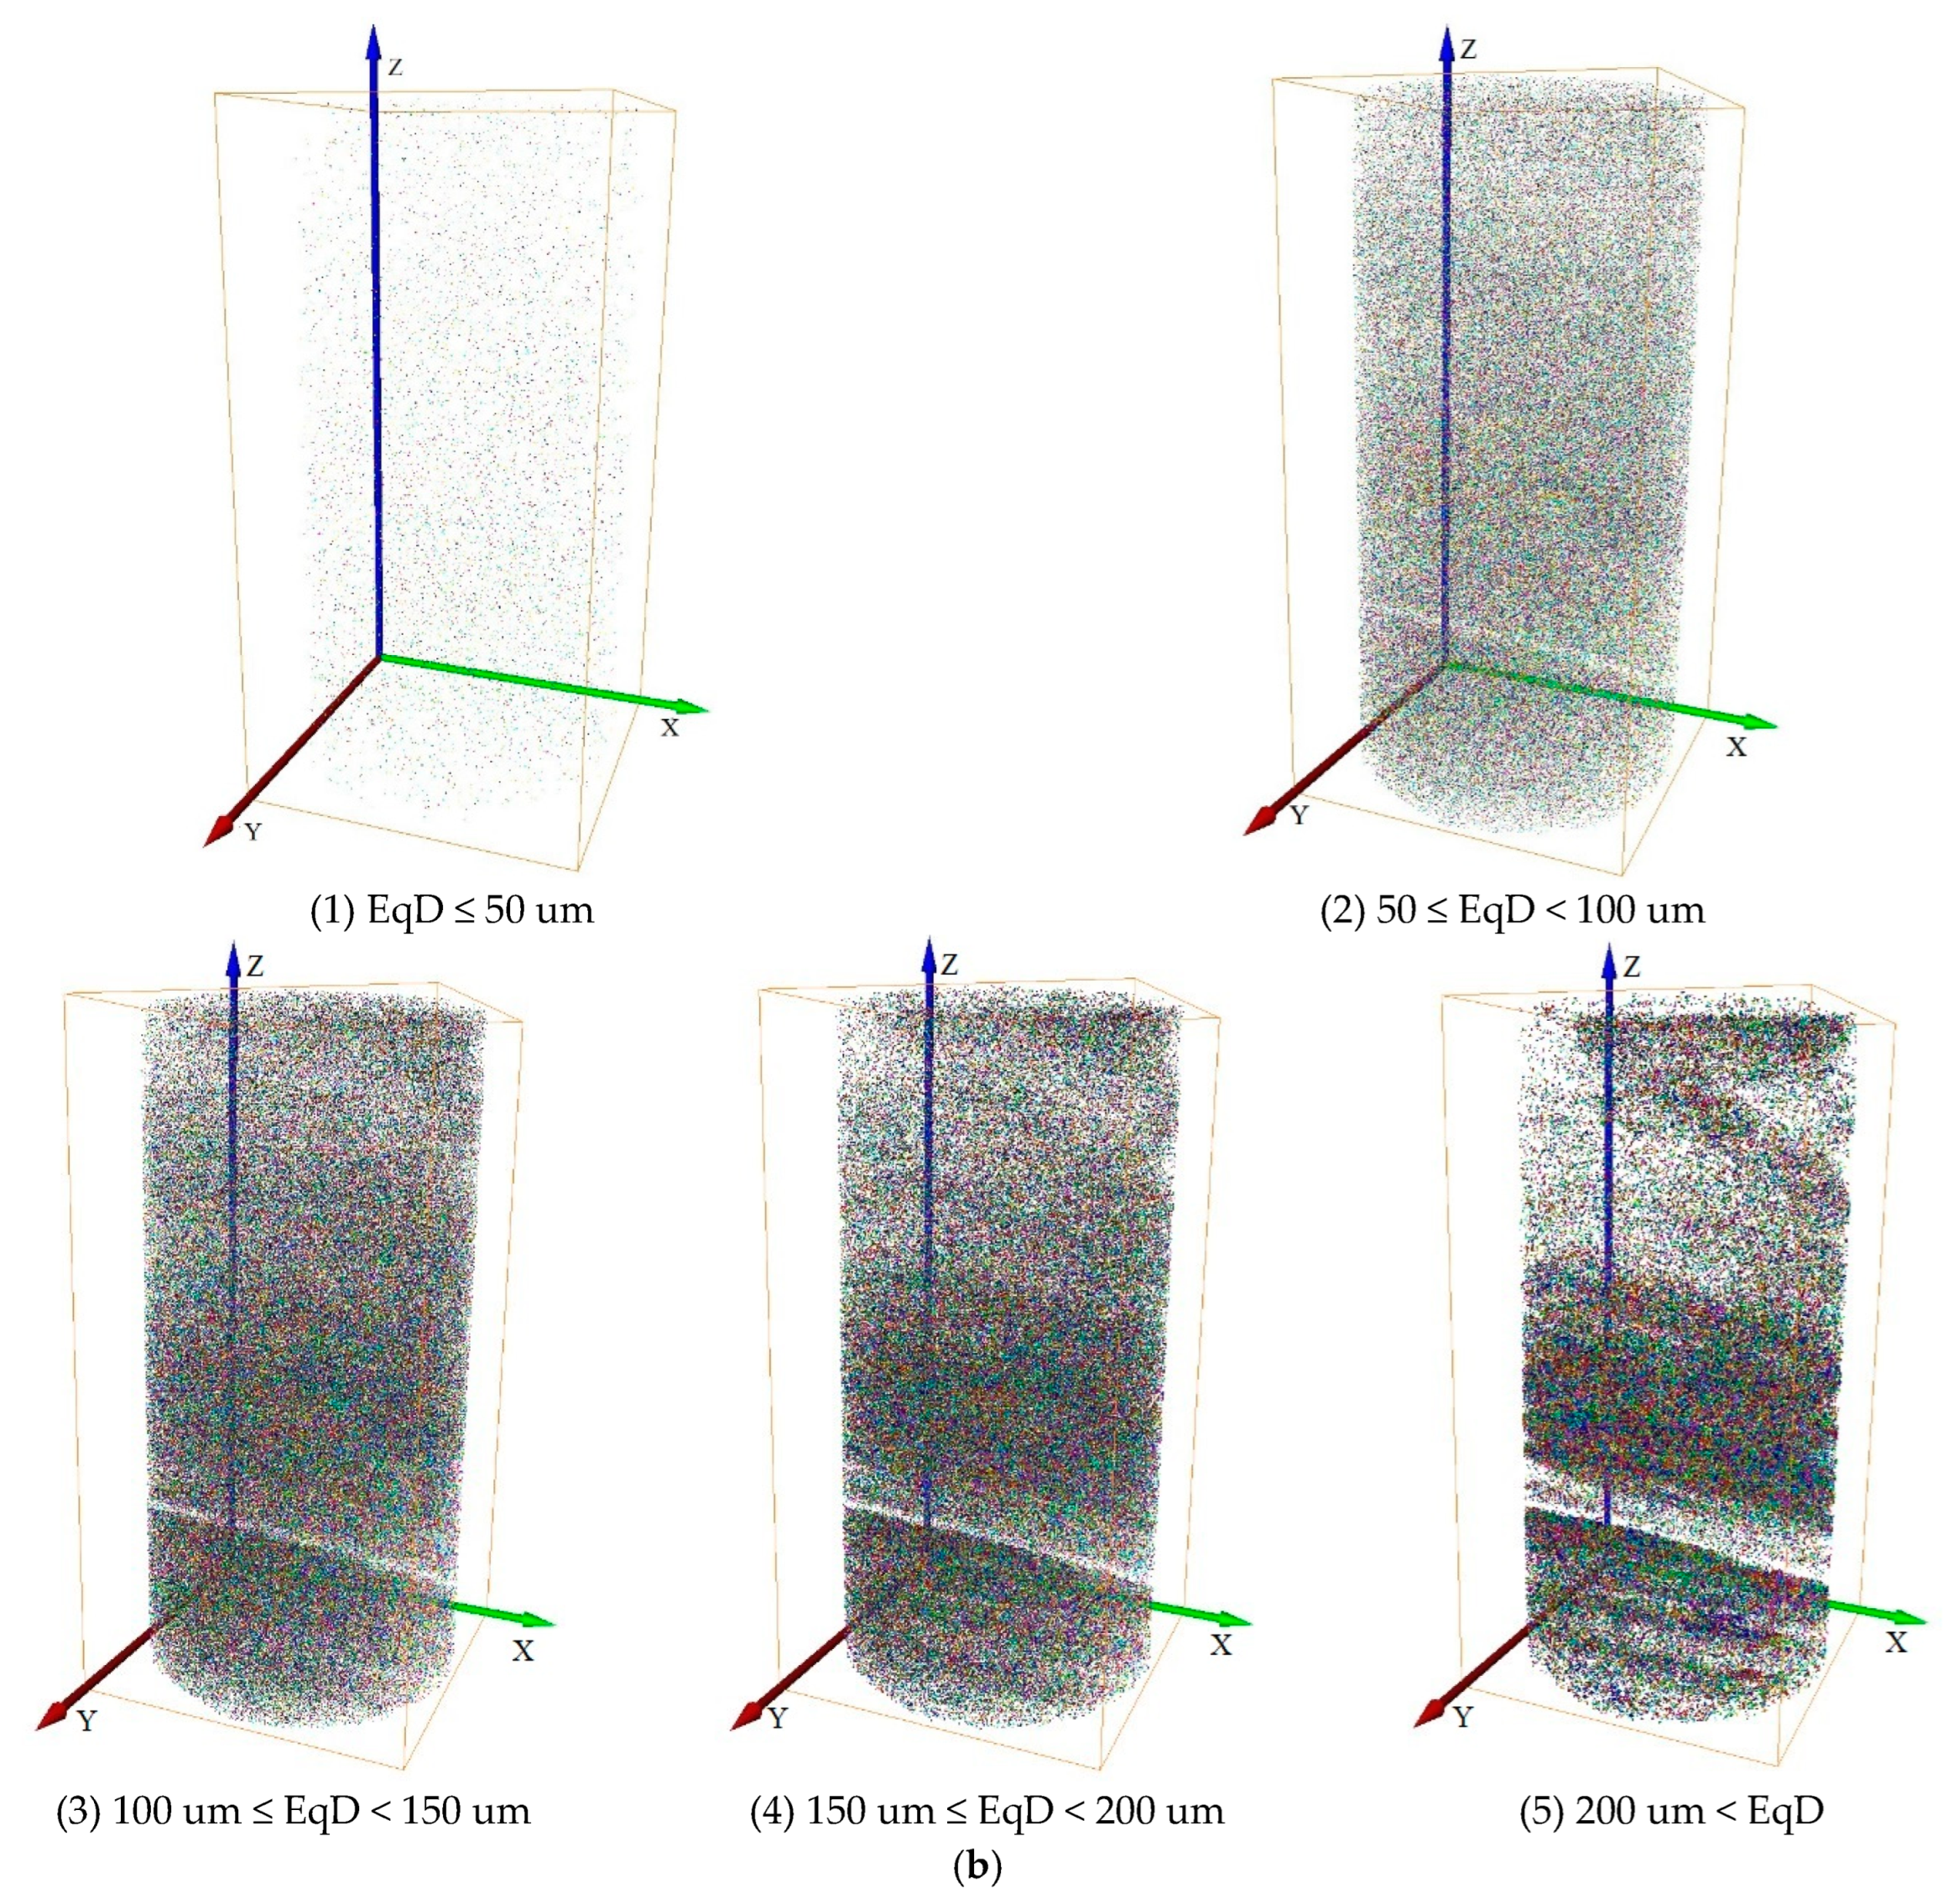
The pores of different equivalent diameters were screened, as shown in Figure 11.

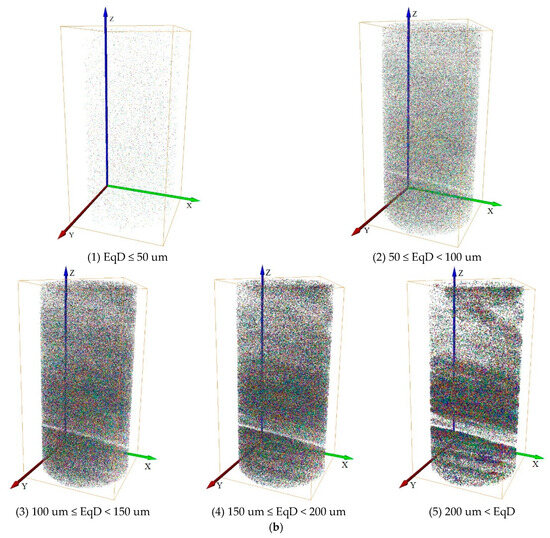
Figure 11.
Pore equivalent diameter screening. (a) Sample 1. (b) Sample 2.
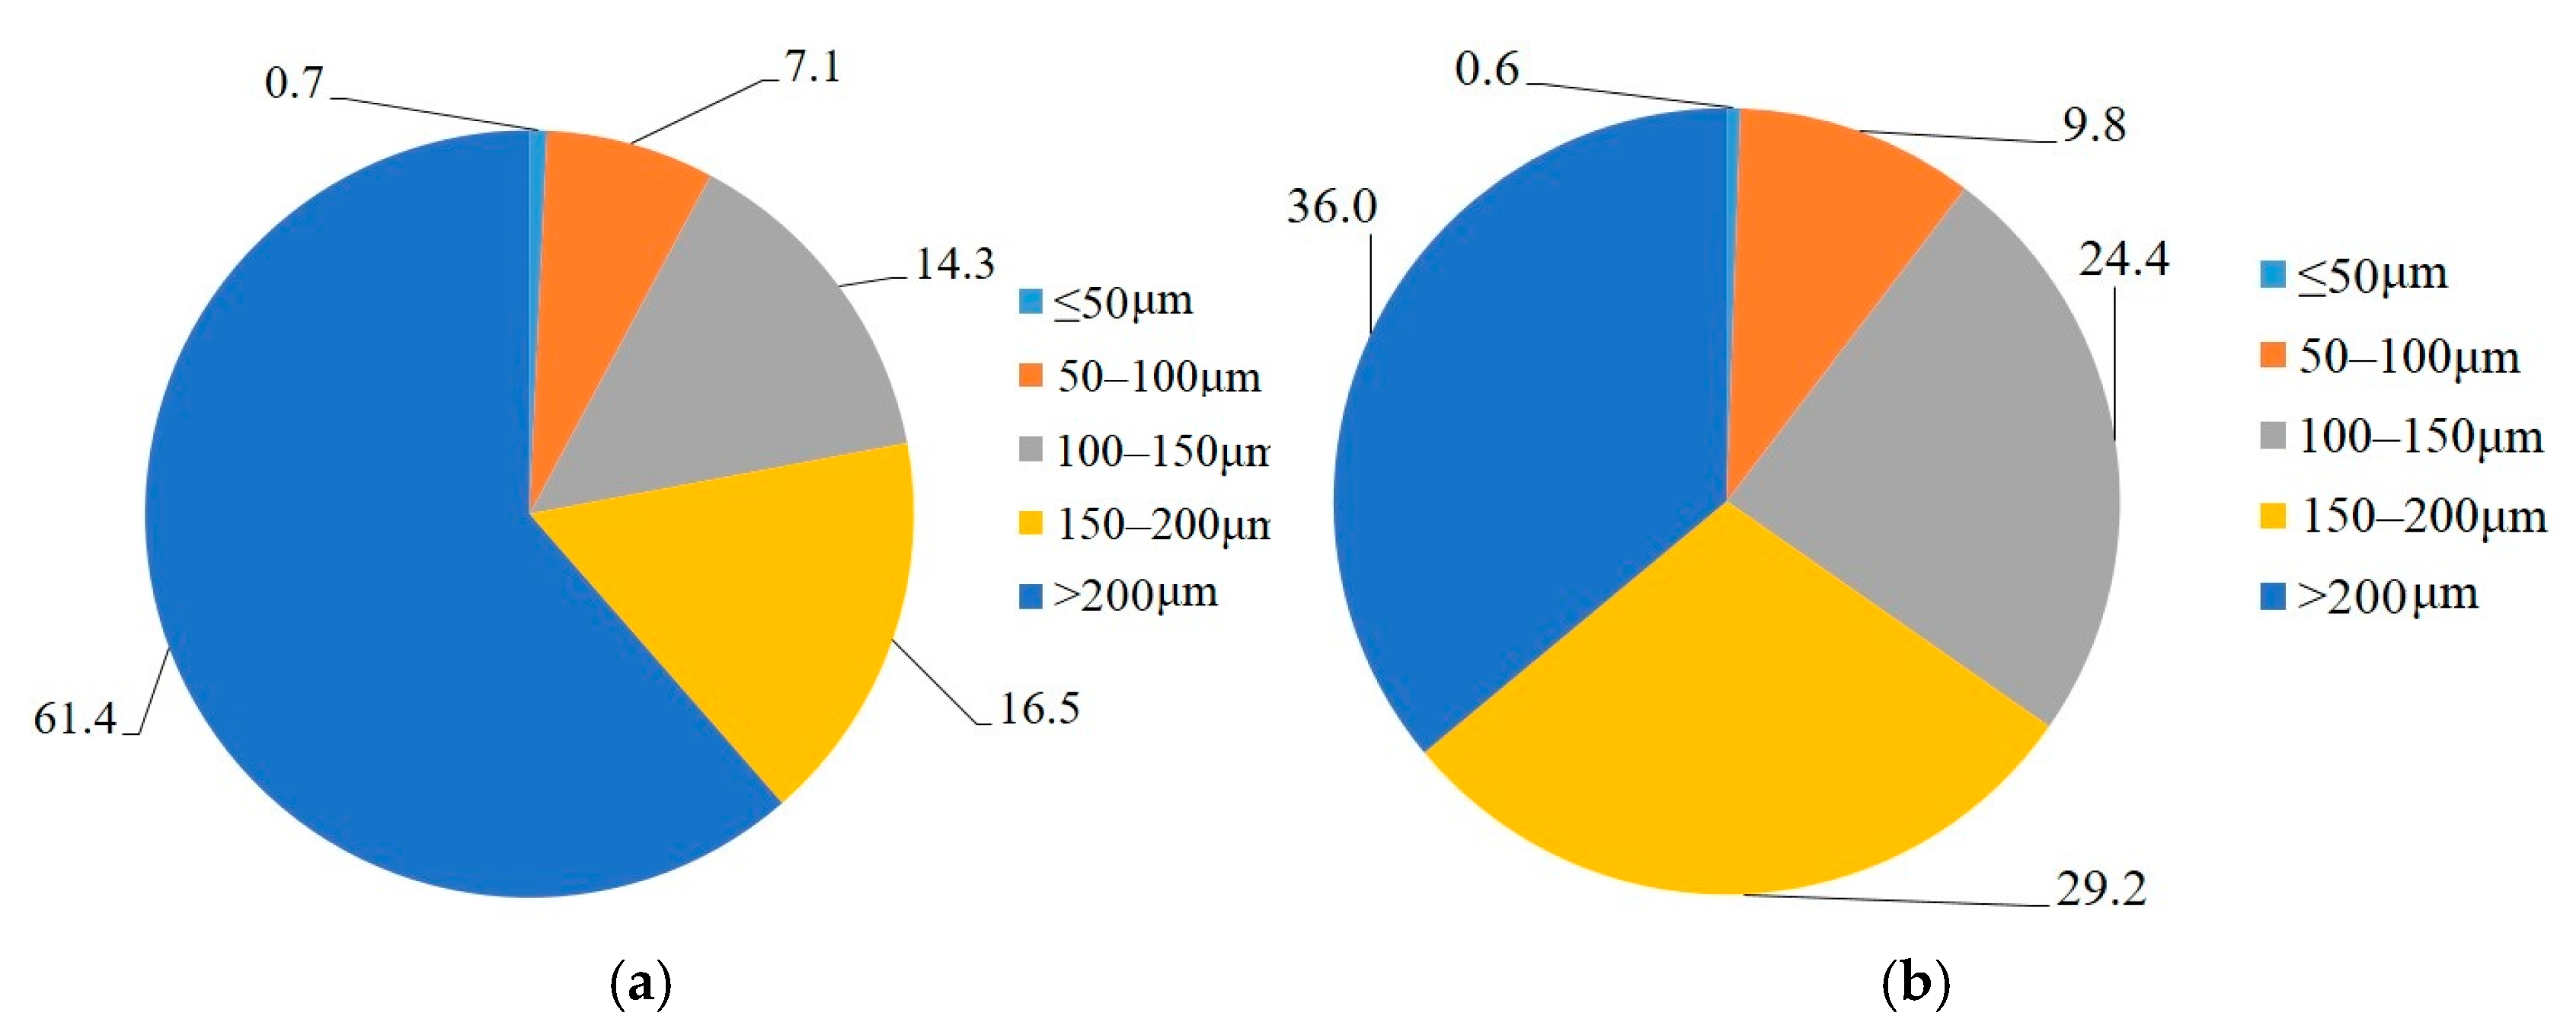
Count the number of pores in different equivalent diameter ranges, before and after “/” are sample 1 and sample 2, respectively, as shown in Table 2, and pie charts are drawn for a more intuitive comparison of the proportion of each diameter range, as shown in Figure 12.
Table 2.
Pore equivalent diameter statistics.

Figure 12.
Pore equivalent diameter pie chart (%). (a) Sample 1. (b) Sample 2.
With the increase in the equivalent diameter of the pore, the pore number showed a rapid decline, and the equivalent diameter of 50–100 μm was the greatest. From the pie chart of pore volume fraction, it can be seen that pores with equivalent diameter >200 μm occupy the largest volume ratio (61.4% and 36.0%).
In response to the high porosity and high volume of large-aperture pores in the Luohe Formation sandstone, which leads to on-site issues such as easy rock fragmentation, excessive water inflow, significant deformation, and challenging support, improvement measures have been proposed. It is recommended to replace the top anchor rod with anchor cables by extending the anchoring section into the deep surrounding rock to control roof collapses. Additionally, reinforcing the mesh panels with steel straps can enhance the synergy between anchor.
4. Support Scheme Optimization
4.1. Scheme Comparison
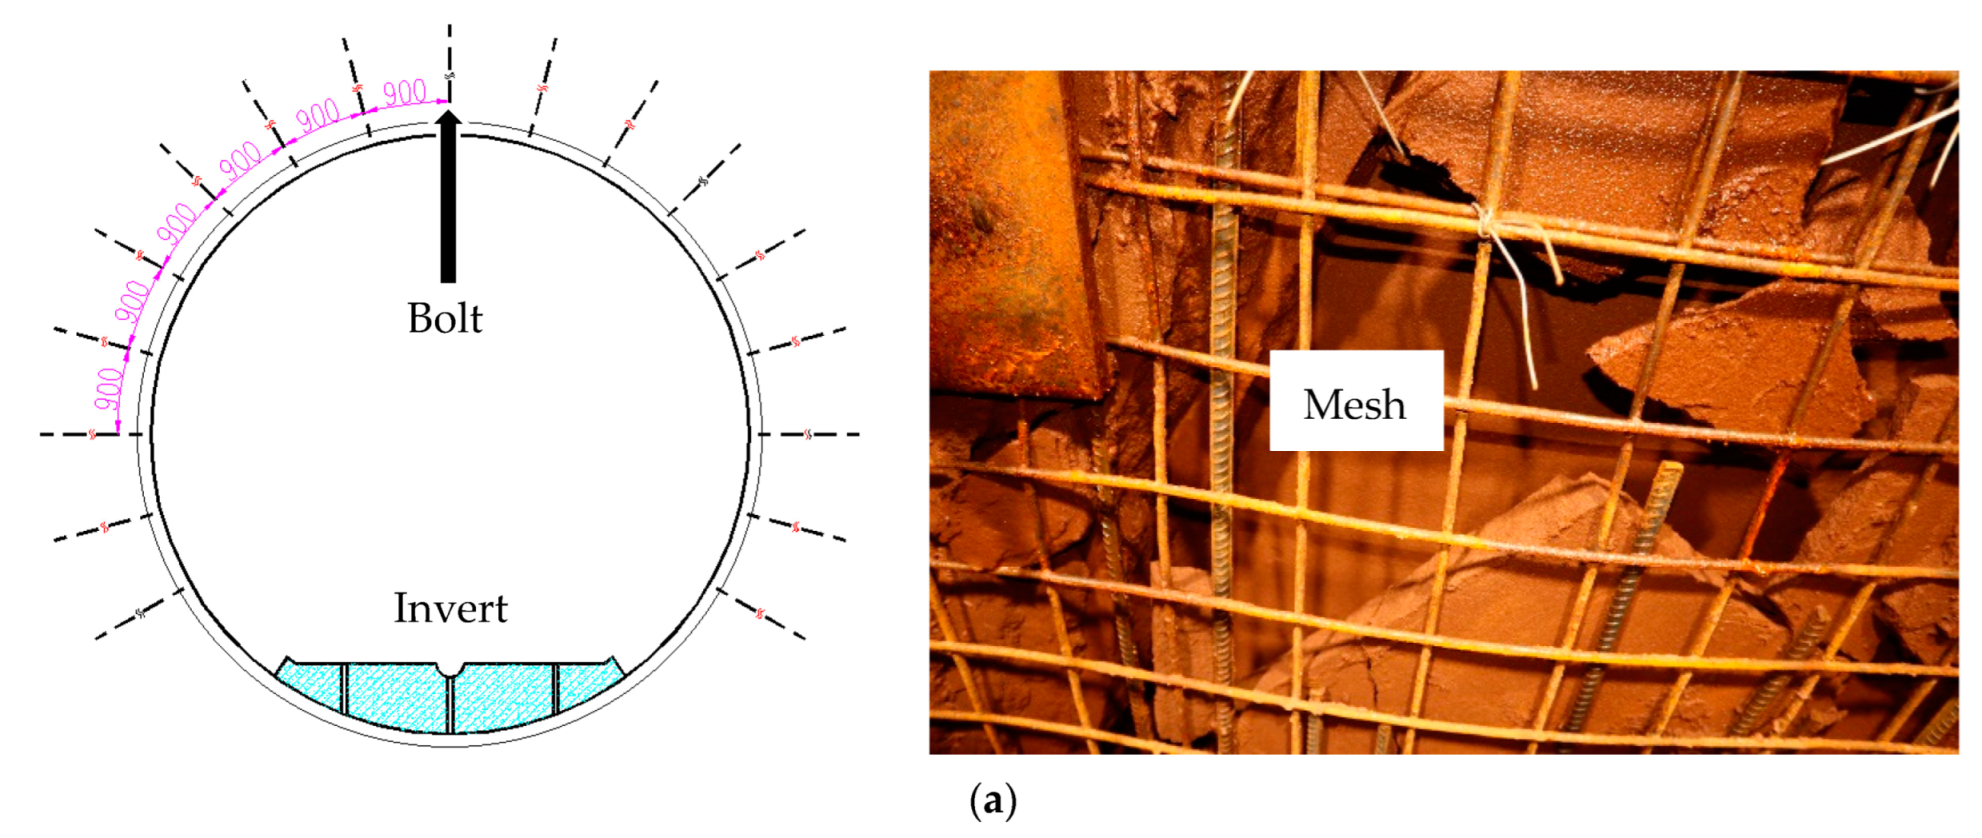
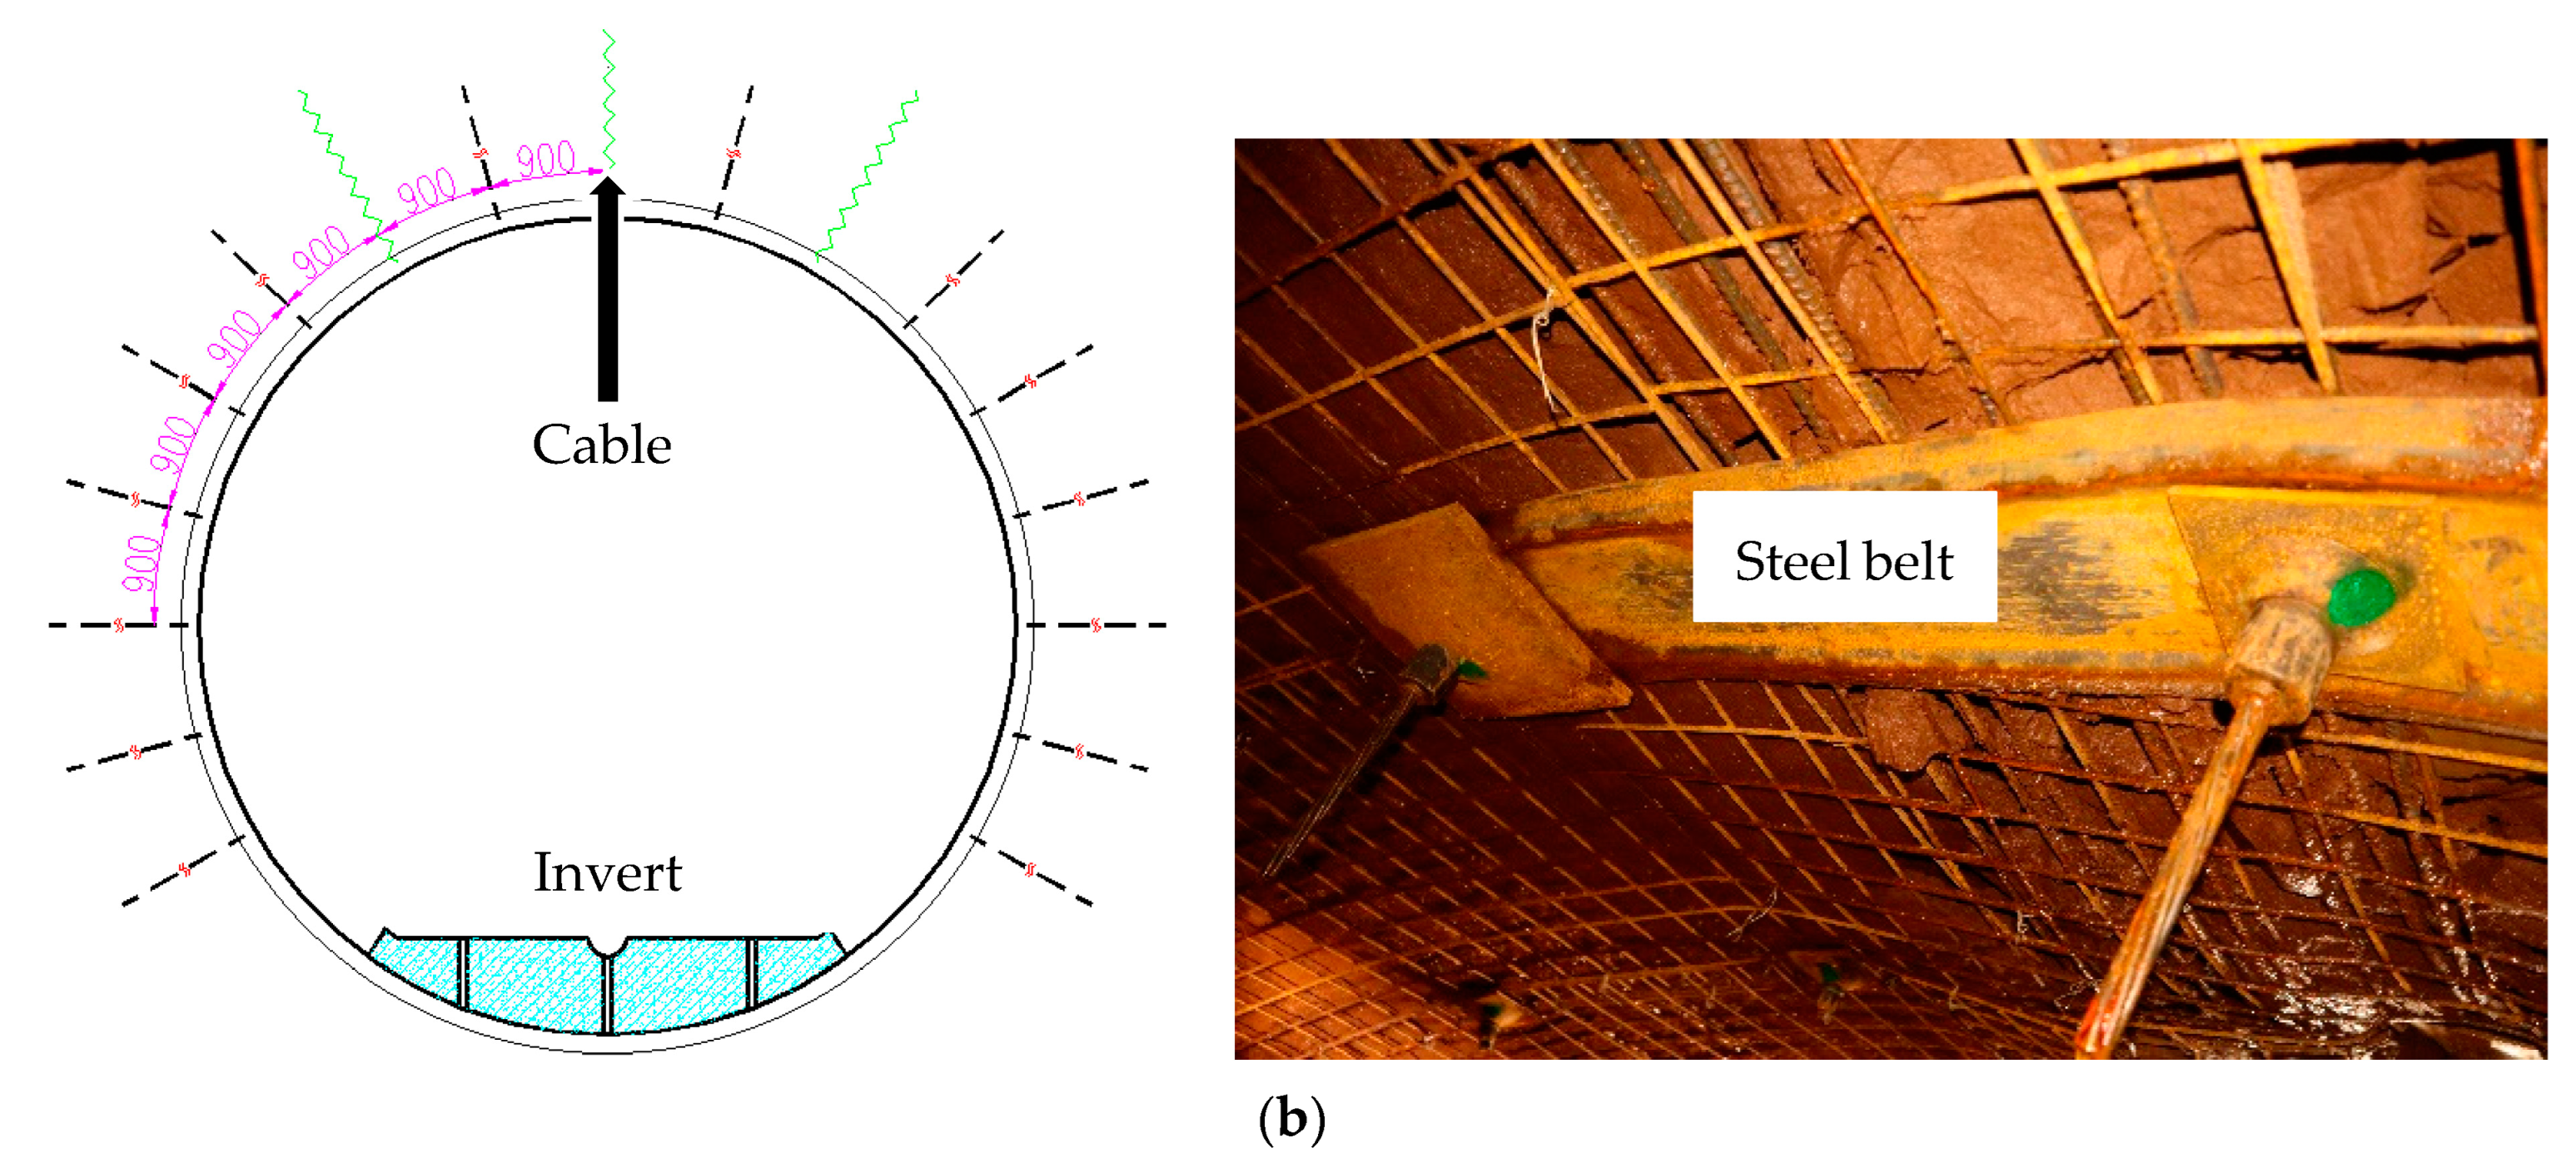
The arrangement of components and on-site installation for each support scheme is shown in Figure 13. The original support scheme is shown in Figure 13a, which is “bolt + mesh” support. The improved scheme is shown in Figure 13b, which is “bolt + cable + mesh + steel belt” support scheme. The top three bolts of the anchor cable section are replaced with 7.3 m anchor cables, and the spacing between them is 1.8 × 2.7 m, a comparison of the components required for each section in the two schemes is presented in Table 3.
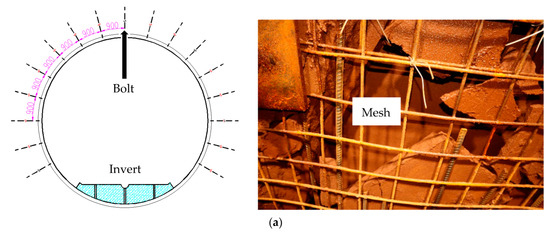

Figure 13.
Scheme comparison. (a) Bolt + mesh. (b) Bolt + cable + mesh + steel belt.
Table 3.
Comparison of materials required by two support schemes.
4.2. Numerical Simulation
To validate the rationality of the support scheme, we conducted a simulation analysis of the support effectiveness of the two schemes using the UDEC (Universal Distinct Element Code) numerical simulation software. UDEC has a distinct advantage in simulating rock fragmentation and large deformations. Table 4 shows the Rrock physical and mechanical parameters.
Table 4.
Rrock physical and mechanical parameters.
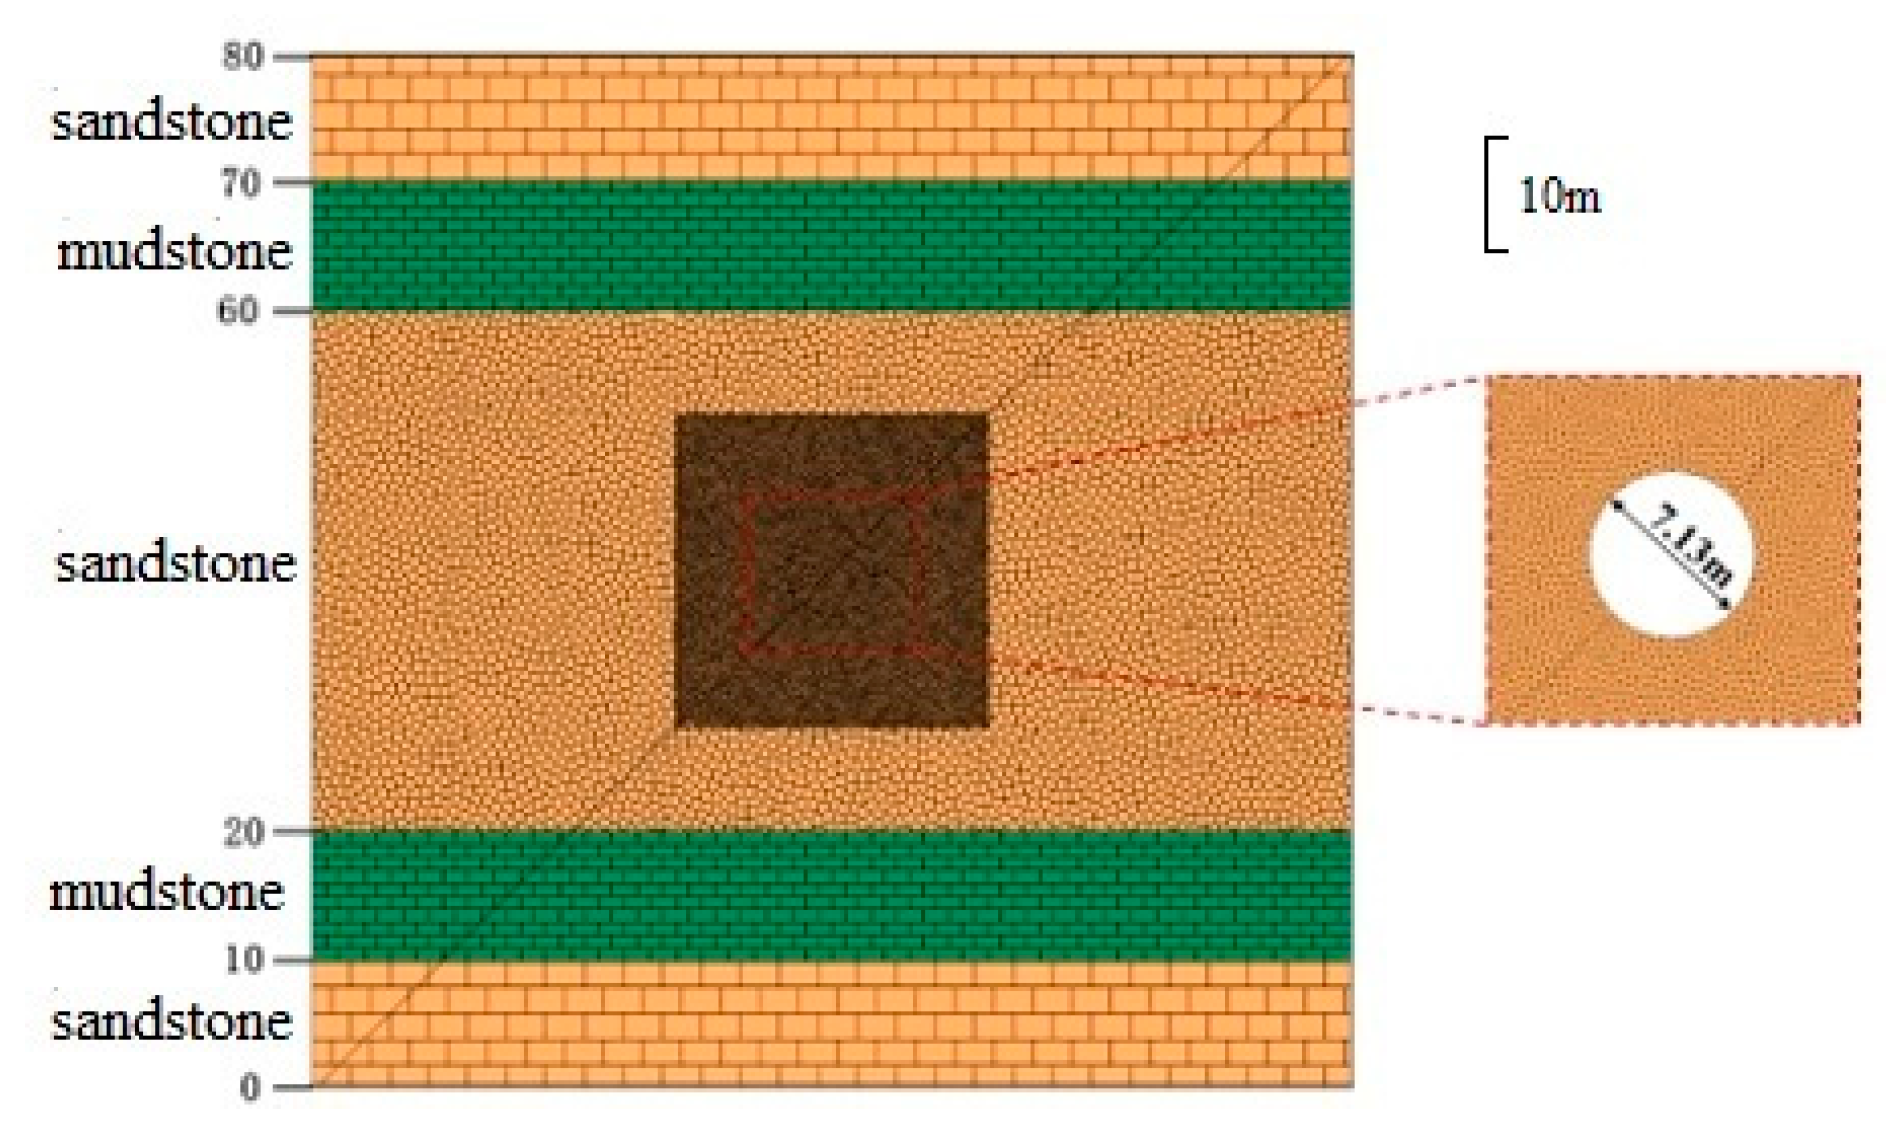
Based on the excavation and support plan for TBM excavation in soft sandstone at the Kekegai coal mine, a typical section at a depth of 200 m was selected. The UDEC 7.0 discrete element software was used to create a numerical model to simulate the disturbance of the surrounding rock and the stress on the support structures under different support schemes [22]. According to Saint-Venant’s principle, if a force acting on a small surface of an elastomer is replaced by a statically equivalent system of forces acting on the same surface, this substitution produces a significant change in stress on only the local surface, and the effect is negligible further than the linear dimensions of the stress-changing surface, it was determined that the disturbance outside the area 3 to 5 fold the tunnel diameter from the excavation zone is negligible and can be disregarded. Therefore, the model dimensions were set at 80 m by 80 m, containing a total of 14,294 blocks. The circular TBM excavation tunnel was located at the center of the model with a diameter of 7.13 m, as shown in Figure 14.
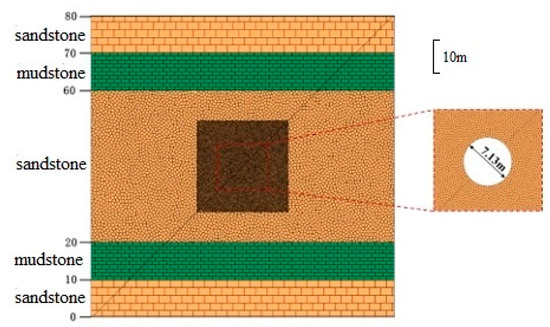
Figure 14.
Computational model and joint configuration.
In the model, normal displacement constraints were applied to the left and right sides as well as the bottom surface. Additionally, maximum horizontal stresses were imposed on the computational elements, with a magnitude of 14.12 MPa (x-direction), a minimum horizontal stress of 9.95 MPa (out-of-plane direction), and a vertical stress of 7.68 MPa (y-direction).
4.3. Simulation Results Analysis
From the aspects of deformation and stress, a comparative analysis of the simulation results of the two support schemes is conducted.
4.3.1. Deformation Analysis
Figure 15 shows the contour maps of horizontal displacement, vertical displacement, and total displacement of the surrounding rock after the construction of the two support schemes. It can be observed that the horizontal deformation on the left and right sides is symmetrically distributed. The vertical displacement of the roof is slightly greater than the uplift displacement of the floor. From the total displacement contour map, it is evident that the maximum displacement deformation occurs at the tunnel roof position.
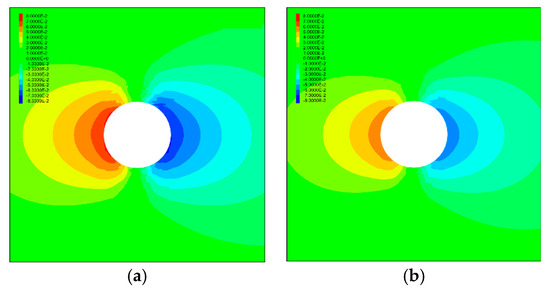
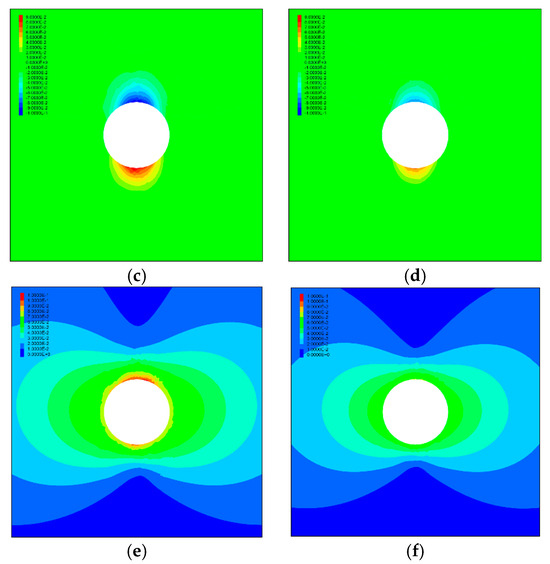
Figure 15.
Displacement contour map: (a) horizontal displacement contour map of the original support scheme; (b) horizontal displacement contour map of the new support scheme; (c) vertical displacement contour map of the original support scheme; (d) vertical displacement contour map of the new support scheme; (e) total displacement contour map of the original support scheme; (f) total displacement contour map of the new support scheme.
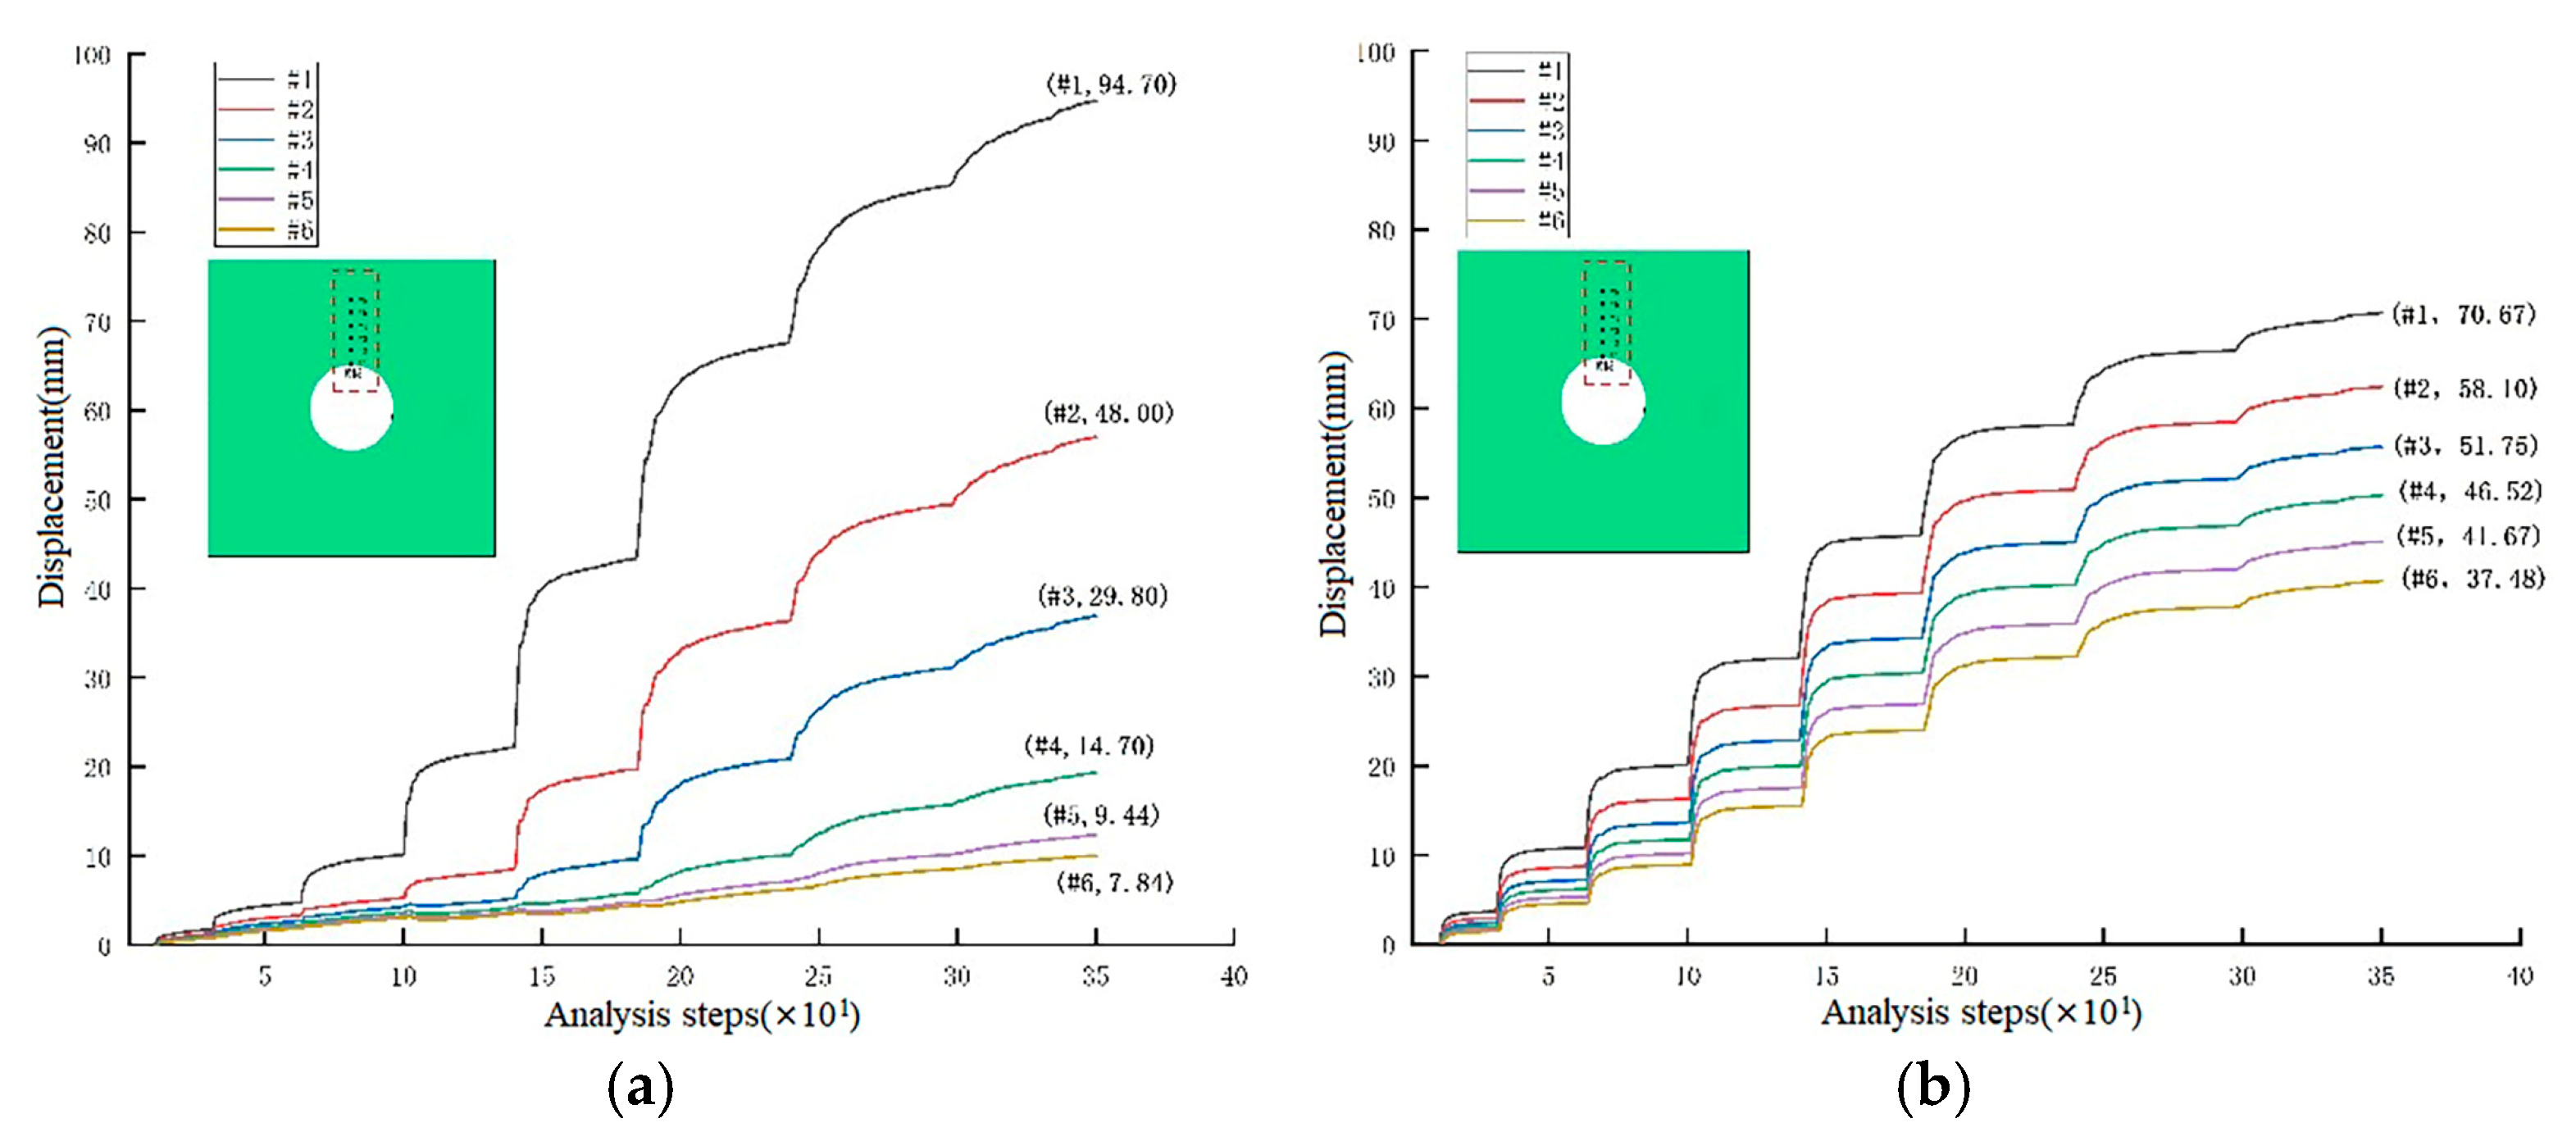
In the roof, monitoring points were set every 1 m in the radial direction to record the displacement changes in the surrounding rock at different depths throughout the excavation process. Figure 16 shows the deep surrounding rock displacement curves for six monitoring points on the roof for the two support schemes.
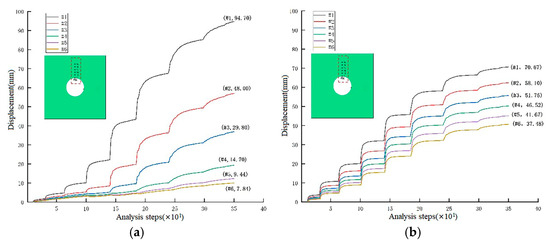
Figure 16.
Roof displacement curve. (a) The original support scheme. (b) The new support scheme.
For the original support scheme, the deformation curves at different positions exhibit varying patterns. The deformation of the surrounding rock significantly decreases at depths greater than 3 m, with a risk of block fall near the tunnel surface.
In contrast, the new support scheme shows consistent deformation patterns at different positions. The deformation gradually increases with stress release in the surrounding rock. The difference in deformation between the tunnel surface and a depth of 5 m is 32 mm. The maximum displacement values for the original support scheme and the new support scheme are 94.70 mm and 70 mm, respectively. This indicates that changing the support scheme has significantly improved the control of the surrounding rock.
4.3.2. Stress Analysis
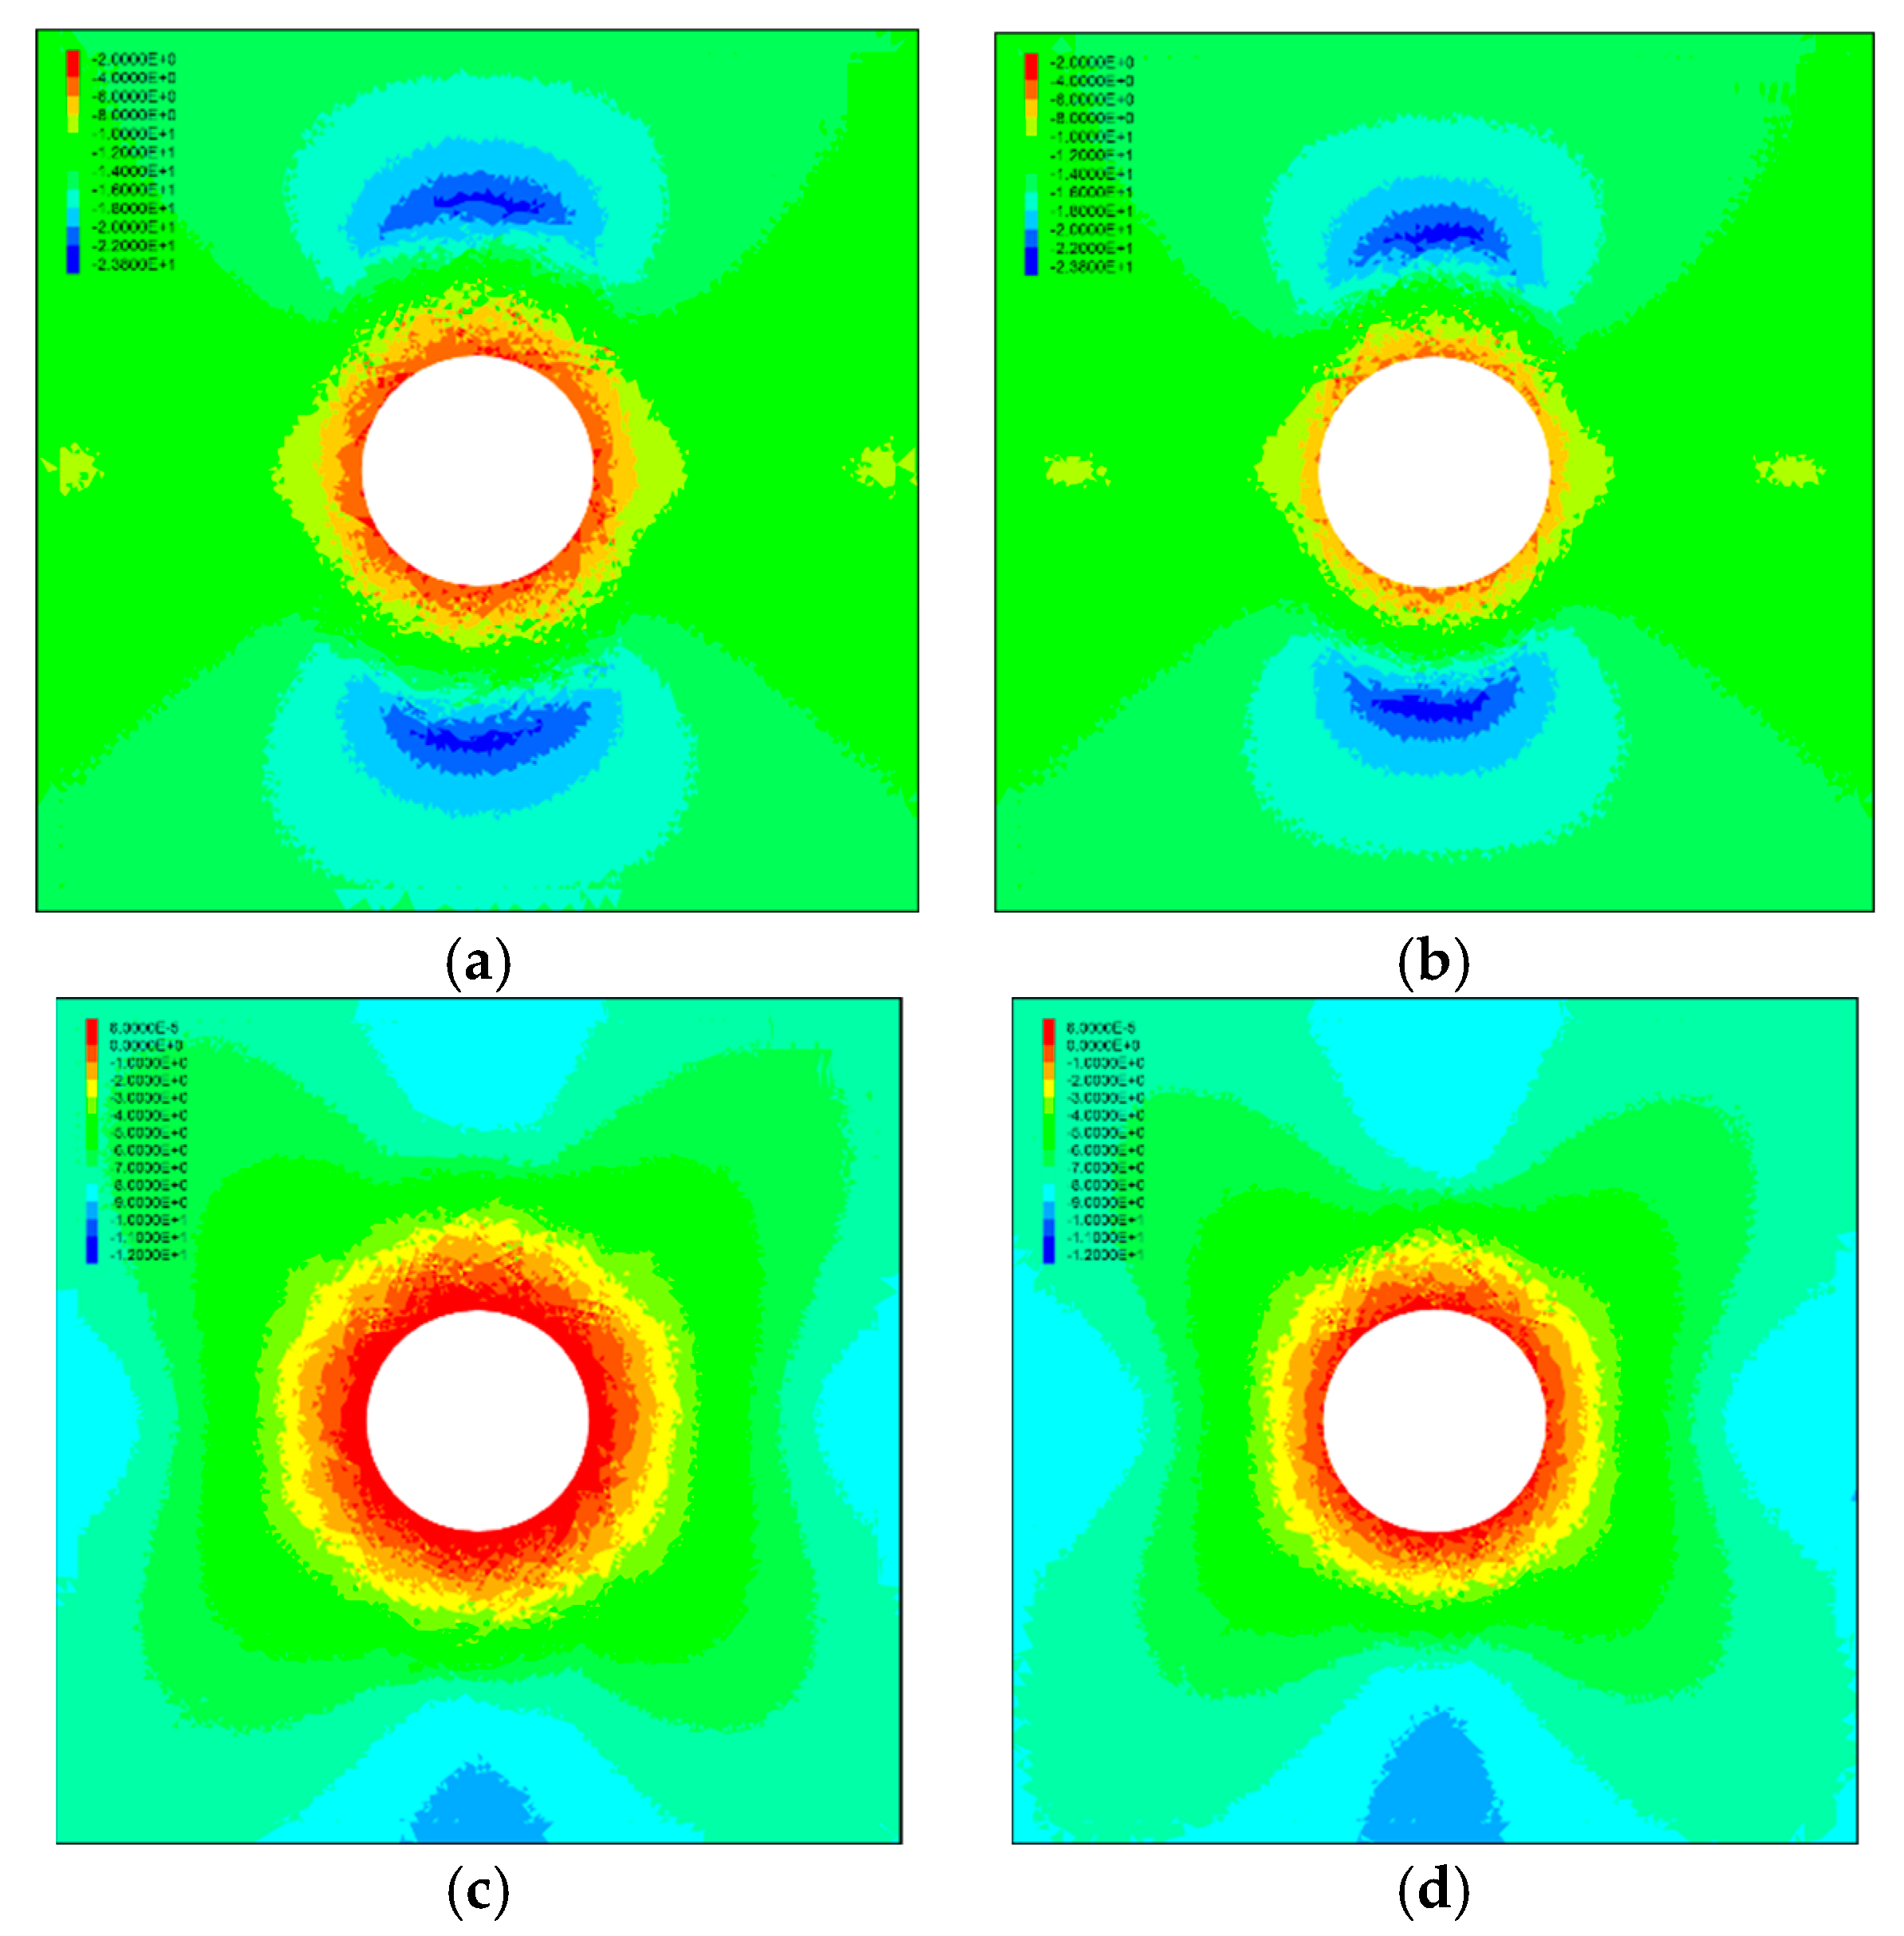
The surrounding rock stress contour maps are shown in Figure 17.
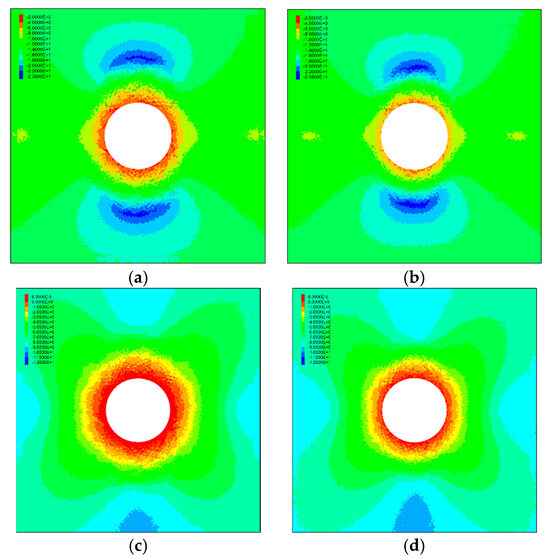
Figure 17.
Stress contour map: (a) the maximum principal stress contour maps of the original support scheme; (b) the maximum principal stress contour maps of the new support scheme; (c) the minimum principal stress contour map of the original support scheme; (d) the minimum principal stress contour map of the new support scheme.
Figure 17a,c represent the maximum and minimum principal stress contour maps of the original support scheme, respectively, and Figure 17b,d represent the maximum and minimum principal stress contour map of the new support scheme, respectively.
It can be observed that after adopting the new support scheme, stress concentration occurs on the surfaces of the roof and floor. In contrast, the stress concentration region for the original support scheme is deeper within the surrounding rock, and the surrounding rock closer to the excavation face exhibits tensile stress, indicating tensile fracturing and failure in the surrounding rock.
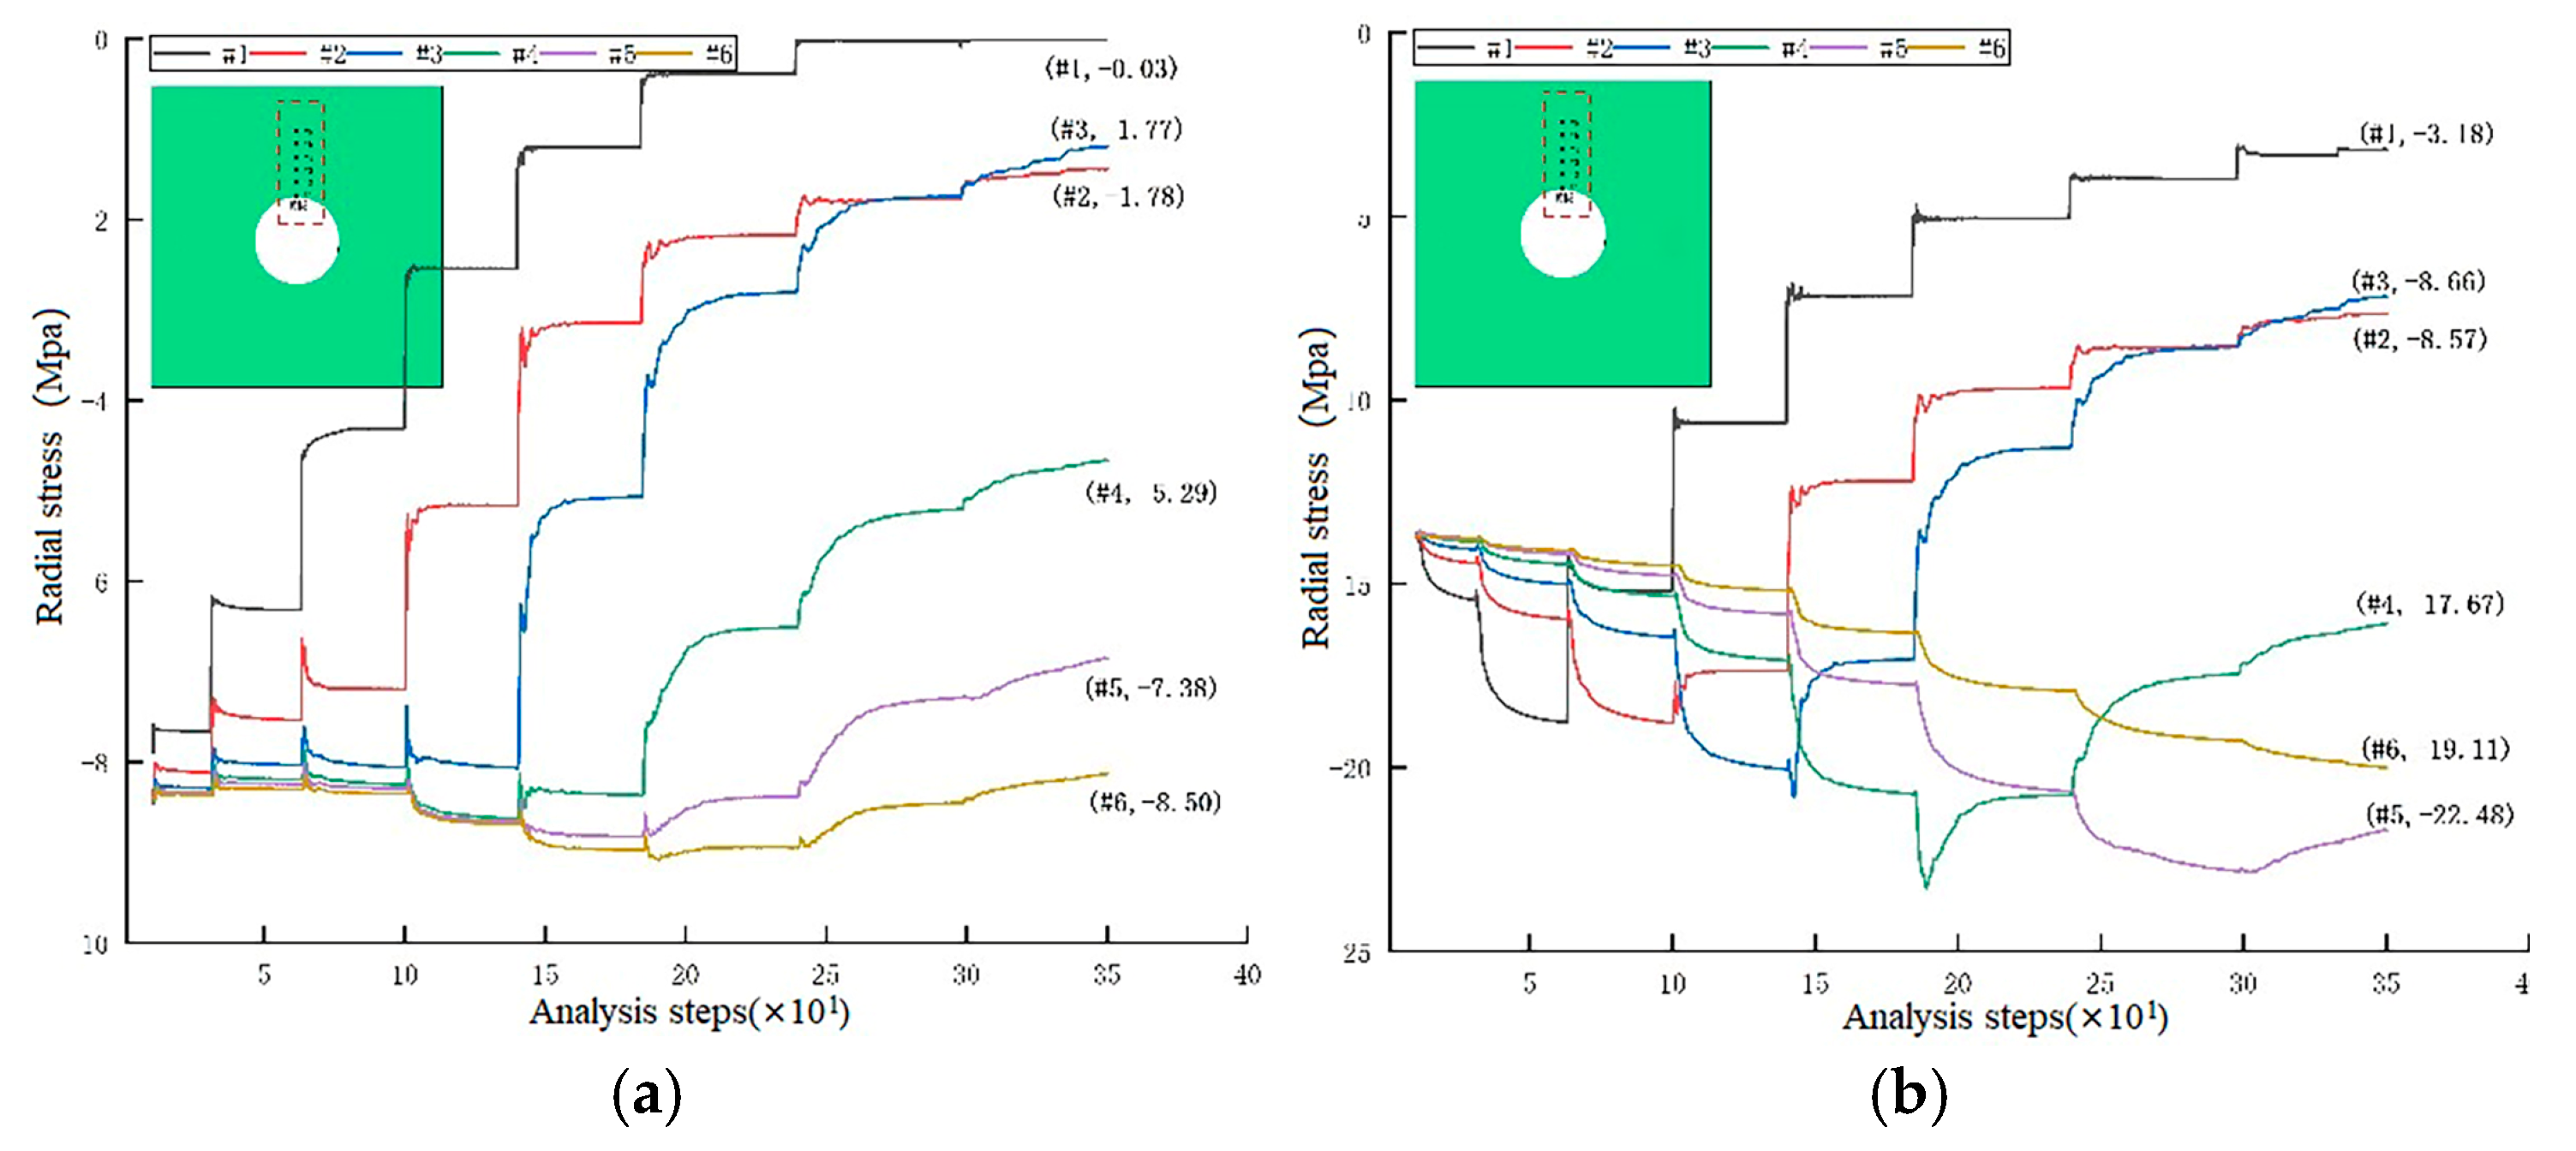
The evolution of deep surrounding rock stress under the two support conditions is shown in Figure 18. Figure 18a,b represent the radial stresses at six monitoring points on the roof for both the original support scheme and the new support scheme.
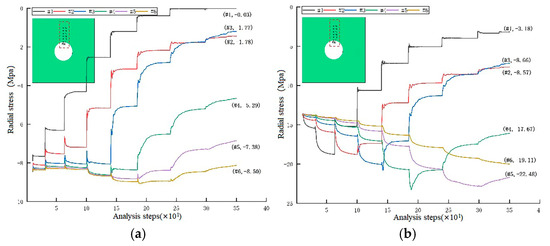
Figure 18.
Deep surrounding rock stress variation curve: (a) radial stress in the roof for the original support scheme; (b) radial stress in the roof for the new support scheme.
As the tunnel excavation progresses, the radial stress values gradually decrease in a step-like manner for both support schemes. Additionally, the closer the monitoring points are to the surface of the tunnel surrounding rock, the greater the magnitude of stress change. In Figure 18a, at the tunnel wall, the final radial stress value tends to zero, indicating tensile stress at the tunnel wall for the original support scheme, leading to the phenomena of roof collapse and wall spalling.
5. Field Applications
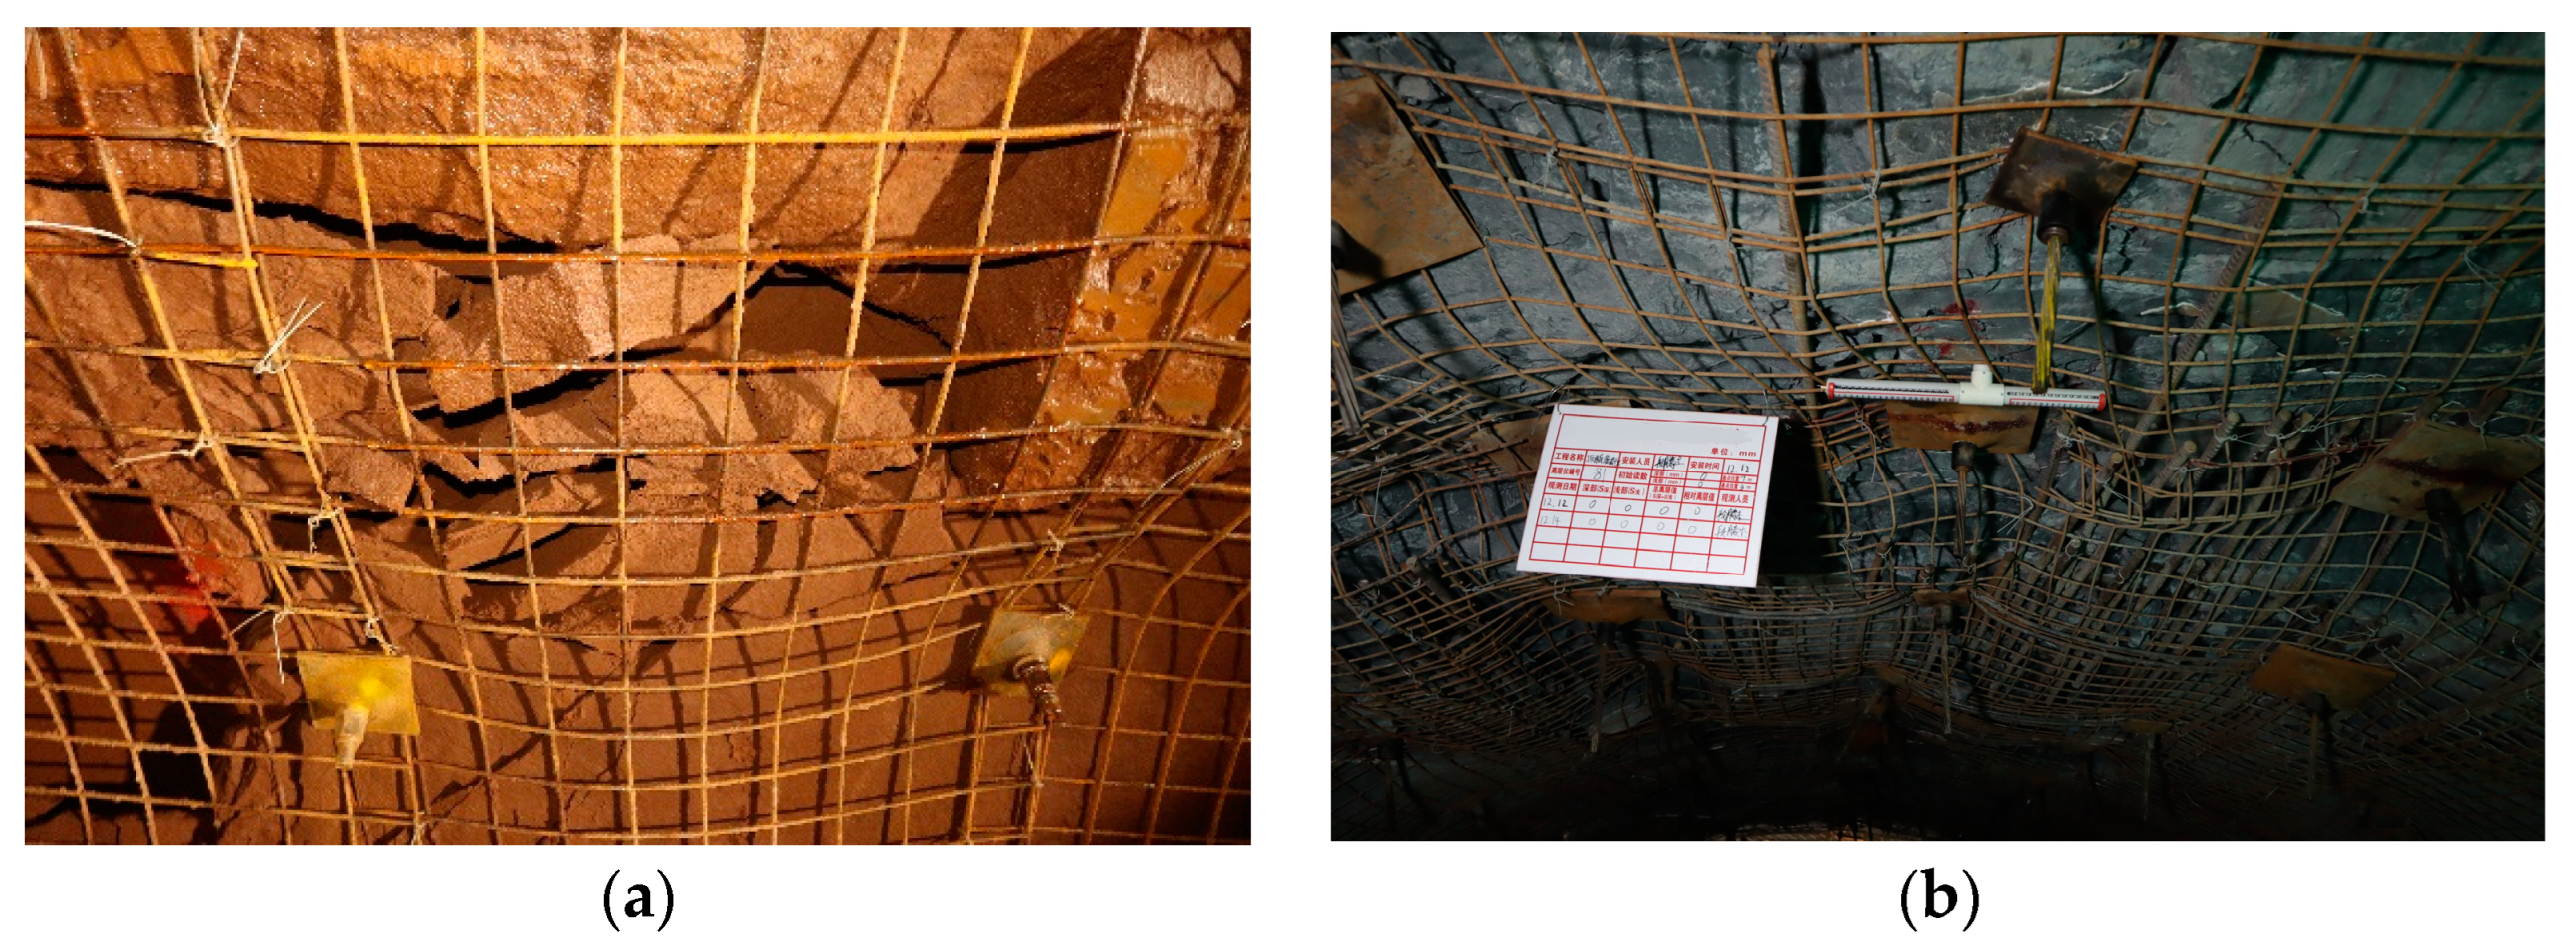
To validate the superiority of the support optimization scheme, a field application was conducted at the Kekegai coal mine subsidiary inclined shaft in Yulin, China. The testing location was 2600 m from the entrance, with a depth of 258 m and a testing length of 20 m. The displacement within two months after support was monitored with a roof separation gauge, as shown in Figure 19.
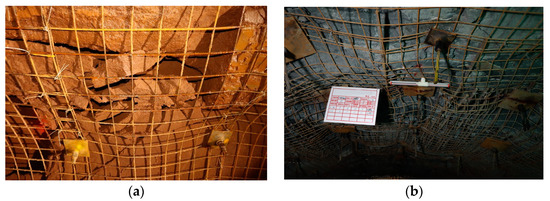
Figure 19.
Comparison of support effect of two support schemes. (a) Bolt + mesh. (b) Anchor + cable + mesh + steel belt.
It can be observed that the optimization measures have effectively controlled the fragmentation and collapse of the surrounding rock in the stope. Extending the length of the anchor cable has anchored it to stable bedrock and also helped in controlling the development of internal fractures. The reinforcement measures for the fractured tunnel walls have rapidly and effectively stabilized the surrounding rock. The maximum deformation has been reduced from 50.3 cm to 28.5 cm, achieving a 43.3% improvement. The water inflow has decreased from 308 m3/d to 98 m3/d, with a reduction of 68.2%. The excavation speed has increased from 10 m/d to 17 m/d, representing a 70% improvement. These improvements provide sufficient support for the TBM’s cutting shoes and resistance for excavation, facilitating rapid progress.
6. Conclusions
In order to ensure that open-type TBM can achieve rapid excavation in the water-rich and poorly cemented sandstone strata, this paper utilized CT scanning to analyze the micro characteristics of the sandstone in the Luohe Formation. Based on these analysis results, this paper conducted numerical simulations to compare the effectiveness of different support schemes in controlling the surrounding rock, and the following conclusions are reached:
- (1)
- The CT scan results indicate that in the two sets of samples from the Luohe Formation sandstone, the volume percentages of pores with a diameter of ≥34 μm are 2.3% and 1.5%, respectively, and the volume percentages of pores with an equivalent diameter greater than 200 μm are the largest, at 61.4% and 36.0%, respectively. This means that there is a relatively high porosity, and the pores are predominantly larger in size. This is macroscopically manifested as strong permeability in the surrounding rock, making it susceptible to softening and fragmentation.
- (2)
- The numerical simulation results show that replacing the original “bolt + mesh” support scheme with a “bolt + cable + mesh + steel belt” support scheme can effective control surrounding rock deformation, and the top maximum displacement from 94.7 mm reduced to 70 mm, and the radial stress at the boundary of the surrounding rock increased from 0 to 3 MPa, providing significant restraint to the surrounding rock.
- (3)
- Field applications have shown that after adopting the new support scheme, the maximum deformation of the surrounding rock has decreased from 50.3 cm to 28.5 cm, a reduction of 43.3%. The water inflow rate has decreased from 308 m3/d to 98 m3/d, a reduction of 68.2%. The TBM excavation speed has increased from 10 m/d to 17 m/d, an improvement of 70%. This significantly enhances construction efficiency and provides assurance for early production commencement.
Author Contributions
Theoretical analysis and CT scanning, X.K.; numerical simulation, K.Z.; on-site sampling, A.L. and Y.K.; review the full paper, X.X. and B.Z. All authors have read and agreed to the published version of the manuscript.
Funding
This work was supported by the National Nature Science Funds of China under grant 52038008, and 52378408; and the Science and Technology Project of China Railway 15th Bureau Group Co., Ltd. (2021A1, 2021C61). The authors gratefully acknowledge their financial support.
Institutional Review Board Statement
Not applicable.
Informed Consent Statement
Not applicable.
Conflicts of Interest
The authors declare no conflict of interest. The founding sponsors had no role in the design of the study; in the collection, analyses, or interpretation of data; in the writing of the manuscript, and in the decision to publish the results.
References
- Feng, L.F.; Wang, S.M.; Wang, H.L.; Chao, F.; Zhang, Y.H. Micro pore characteristics of Luohe aquifer sandstone in Binchang mining area typical roof water hazard mines. Coal Sci. Technol. 2023, 51, 208–218. [Google Scholar]
- Tian, L.; Liu, W.; Zhang, J.; Gao, H. Cataclastic Characteristics and Formation Mechanism of Dolomite Rock Mass in Yunnan, China. Appl. Sci. 2023, 13, 6970. [Google Scholar] [CrossRef]
- Ren, J.X.; Wang, X.L.; Chen, X. Physical and mechanical properties and failure mode of Luohe Formation sandstone after thawing. Coal Eng. 2021, 53, 153–158. [Google Scholar]
- Li, C.F.; Hu, W.Y.; Liu, Y.F. Vertical hydrogeological characteristics of Luohe aquifer and its significance of water-preserved coal mining. J. China Coal Soc. 2019, 44, 848–857. [Google Scholar]
- Deng, H.; Tian, G.; Yu, S.; Jiang, Z.; Zhong, Z.; Zhang, Y. Research on Strength Prediction Model of Sand-like Material Based on Nuclear Magnetic Resonance and Fractal Theory. Appl. Sci. 2020, 10, 6601. [Google Scholar] [CrossRef]
- Ke, Q.R.; Li, C.D.; Yao, W.M.; Fan, Y.B.; Zhan, H.B.; Li, B.C.; Zhang, X. Comparative characterization of sandstone microstructure affected by cyclic wetting-drying process. Int. J. Rock Mech. Min. Sci. 2023, 170, 105486. [Google Scholar] [CrossRef]
- Abdallah, Y.; Vandamme, M.; Chateau, C.; Garnier, D.; Jolivet, I.; Onaisi, A.; Richard, D.; Zandi, S. Mechanical characterization of thermally treated calcite-cemented sandstone using nanoindentation, scanning electron microscopy and automated mineralogy. Int. J. Rock Mech. Min. Sci. 2020, 125, 104158. [Google Scholar]
- Langford, J.; Holmøy, K.H.; Hansen, T.F.; Holter, K.G.; Stein, E. Analysis of water ingress, grouting effort, and pore pressure reduction caused by hard rock tunnels in the Oslo region. Tunn. Undergr. Space Technol. 2022, 130, 104762. [Google Scholar] [CrossRef]
- Zheng, D.; Ju, N.P. Scanning electronic microscope tests for rock micro-rupture mechanism and rdacture characteristic of phyllite. J. Eng. Geol. 2011, 19, 317–322. [Google Scholar]
- He, M.C.; Peng, T.; Wang, Y. Sedimentary characteristics and mechanical effects of soft rock. Hydrogeol. Eng. Geol. 1996, 2, 37–39. [Google Scholar]
- Ma, Q.; Zhu, Y. Experimental research on the microstructure and compressive and tensile properties of nano-SiO2 concrete containing basalt fibers. Undergr. Space 2017, 2, 175–181. [Google Scholar] [CrossRef]
- Xu, J.F.; Xie, X.Y.; Tang, G.J.; Zhou, B.; Xu, D.L.; Huang, Y. A new adaptive compressible element for tunnel lining support in squeezing rock masses. Tunn. Undergr. Space Technol. 2023, 137, 105–124. [Google Scholar] [CrossRef]
- Liang, B.; Tan, X.Y.; Jiang, L.G.; Jiao, B.B. Experimental analysis of slaking characteristics of mudstone in different pH solutions. J. Civ. Environ. Eng. 2015, 37, 23–27+59. [Google Scholar]
- Tan, L.R. Discussion on mechanism of disintegration and argillitization of clay—Rock. Rock Soil Mech. 2001, 22, 1–5. [Google Scholar]
- Chen, B.; Xiang, J.; Latham, J.P.; Bakker, R.R. Grain-scale failure mechanism of porous sandstone: An experimental and numerical FDEM study of the Brazilian Tensile Strength test using CT-Scan microstructure. Int. J. Rock Mech. Min. Sci. 2020, 132, 104348. [Google Scholar] [CrossRef]
- Louis, L.; Baud, P.; Wong, T.F. Microstructural inhomogeneity and mechanical anisotropy associated with bedding in rothbach sandstone. Pure Appl. Geophys. 2009, 166, 1063–1087. [Google Scholar] [CrossRef]
- Kim, K.Y.; Zhuang, L.; Yang, H.; Kim, H.; Min, K. Strength anisotropy of berea sandstone: Results of X-Ray computed tomography, compression tests, and discrete modeling. Rock Mech. Rock Eng. 2016, 49, 1201–1210. [Google Scholar] [CrossRef]
- Ambrose, J. Failure of Anisotropic Shales under Triaxial Stress Conditions. Ph.D. Thesis, Imperial College London, London, UK, 2014. [Google Scholar]
- Liu, H.; Yang, G.S.; Shen, Y.J.; Ye, W.J.; Xi, J.M.; Jin, L.; Wei, Y.; Li, B.R.; Liu, S. CT visual quantitative characterization of meso-damage evolution of sandstone under freeze-thaw-loading synergistic effect. Chin. J. Rock Mech. Eng. 2023, 42, 1136–1149. [Google Scholar]
- Medici, G.; West, L.J. Reply to discussion on ‘Review of groundwater flow and contaminant transport modelling approaches for the Sherwood Sandstone aquifer, UK; insights from analogous successions worldwide’ by Medici and West (QJEGH, 55, qjegh2021-176). Q. J. Eng. Geol. Hydrogeol. 2023, 56, qjegh2022-097. [Google Scholar] [CrossRef]
- Yates, P.G.J. The material strength of sandstones of the Sherwood Sandstone Group of north Staffordshire with reference to microfabric. Q. J. Eng. Geol. Hydrogeol. 1992, 25, 107–113. [Google Scholar] [CrossRef]
- He, S.D.; Li, Y.R.; Aydin, A. A comparative study of UDEC simulations of an unsupported rock tunnel. Tunn. Undergr. Space Technol. 2018, 72, 242–249. [Google Scholar] [CrossRef]


Disclaimer/Publisher’s Note: The statements, opinions and data contained in all publications are solely those of the individual author(s) and contributor(s) and not of MDPI and/or the editor(s). MDPI and/or the editor(s) disclaim responsibility for any injury to people or property resulting from any ideas, methods, instructions or products referred to in the content. |
© 2023 by the authors. Licensee MDPI, Basel, Switzerland. This article is an open access article distributed under the terms and conditions of the Creative Commons Attribution (CC BY) license (https://creativecommons.org/licenses/by/4.0/).