Article

On-Line Partial Discharge Monitoring System for Switchgears Based on the Detection of UHF Signals

School of Electronic Engineering, Xi’an University of Post and Telecommunications, Xi’an 710121, China
*
Author to whom correspondence should be addressed.
Appl. Sci. 2023, 13(21), 11850; https://doi.org/10.3390/app132111850
Submission received: 6 September 2023 / Revised: 6 October 2023 / Accepted: 26 October 2023 / Published: 30 October 2023

Abstract

:
Aiming at the phenomenon of partial discharge caused by the insulation fault of switchgears, an ultra-high frequency (UHF) partial discharge online monitoring system based on the Internet of Thing (IoT) is designed. The hardware of the system mainly consists of UHF sensors, signal conditioning circuits, and data acquisition circuits to realize the monitoring of the discharge signal. The monitoring data is uploaded to the cloud platform through the 4G DTU module, and the host computer software based on B/S architecture is designed on the server side, which can monitor the operation status of the switchgear anytime and anywhere. The experimental results show that the detection system is stable and reliable and can meet practical needs.

1. Introduction

High voltage switchgears are very important electrical equipment in power systems. Long-term operation of switchgears will increase the risk of insulation deterioration [1,2,3]. According to statistics, nearly 50% of switchgear accidents are caused by insulation deterioration [4,5]. Therefore, online partial discharge (PD) diagnosis and early warning of insulation failures in high-voltage switchgears are key to maintaining electrical safety [6,7].
When the insulation of the switchgear is aging, a partial discharge phenomenon will occur. At present, the main detection methods for PD phenomena are the pulse current method, radio frequency method, ultrasonic method, ultra-high frequency (UHF) method and so on [8,9,10]. The UHF method is mainly aimed at the electromagnetic radiation signals with a frequency of 300 MHz–3 GHz [11,12], which are generated by the partial discharge pulse. The UHF method can effectively avoid invalid electromagnetic waves such as GSM signals and corona signals in the switchgears. The UHF PD detection method has advantages in interference immunity, detection sensitivity and bandwidth of response frequency [13]. However, high requirements are needed for data measurement, and the sampling frequency should be higher than GHz, which is difficult and costly.
In this paper, an on-line monitoring system was designed based on the UHF method and Internet of Thing (IoT) technology. To detect the UHF signal, the corresponding conditioning circuit and data collector are designed. The main component of the signal conditioning circuit is a logarithmic detector circuit, which is used to detect the envelope information of the UHF signal. This envelope signal reduces the sampling frequency requirement of the data collector while retaining the main characteristics of the UHF discharge signal (amplitude, phase and number). Test results show that the designed data collector can easily detect the conditioned discharge signal with a sampling rate of only MHz level, which greatly reduces the cost. This monitoring system adopts browser/server architecture and IoT technology. When the monitoring system is working, the communication module uploads the collected data to the cloud, and the real-time data and historical data of the switchgear can be viewed on the PC webpage. At the same time, it is of great significance to improve the management efficiency and human resources.

2. System Design and Detection Principle

2.1. System Design Scheme

The general schematic diagram of the high-voltage switchgear online partial discharge monitoring system is shown in Figure 1, which mainly consists of an external UHF sensor, a wave detection circuit, a data collector, a 4G module and so on. When there is insulation degradation inside the switchgear cabinet, the UHF sensor can be coupled to the UHF signal with a frequency of 300 MHz~1.5 GHz, which is amplified and detected to meet the sampling requirements of the data collector. The data collector is responsible for analog-to-digital conversion and data processing and sends the processed data to the server through the 4G module.
In order to realize intelligent and standardized monitoring of high-voltage switchgear, the software design adopts B/S architecture. The various monitoring nodes of the high-voltage switchgear mainly realize the data collection of the insulation condition and use the 4G network to send the data to the server side at irregular intervals. On the server side, information such as switchgear number and geographic location can be judged based on the received data, and the monitored data can be stored in the database. The monitored data can be viewed intuitively on the PC website, so that the operation status of the high-voltage switchgear can be monitored anytime and anywhere.

2.2. Theory of Detection Technology

When an insulation fault occurs inside the switchgear, the high frequency electromagnetic wave signal will be diffracted to the outside, and the signal from 300 MHz to 1500 MHz can be coupled with the UHF sensor. If the original signal is directly sampled for the obtained UHF signal, the sampling rate of the data collector needs to reach at least GHz [14], which undoubtedly adds a huge installation cost, and the amount of data received is huge. On the other hand, considering the actual situation, it is difficult to completely collect the full-band signal and it is not suitable for online monitoring systems. To collect a useful signal without distortion for ultra-high frequency detection, a signal conditioning and collection system needs to be designed.
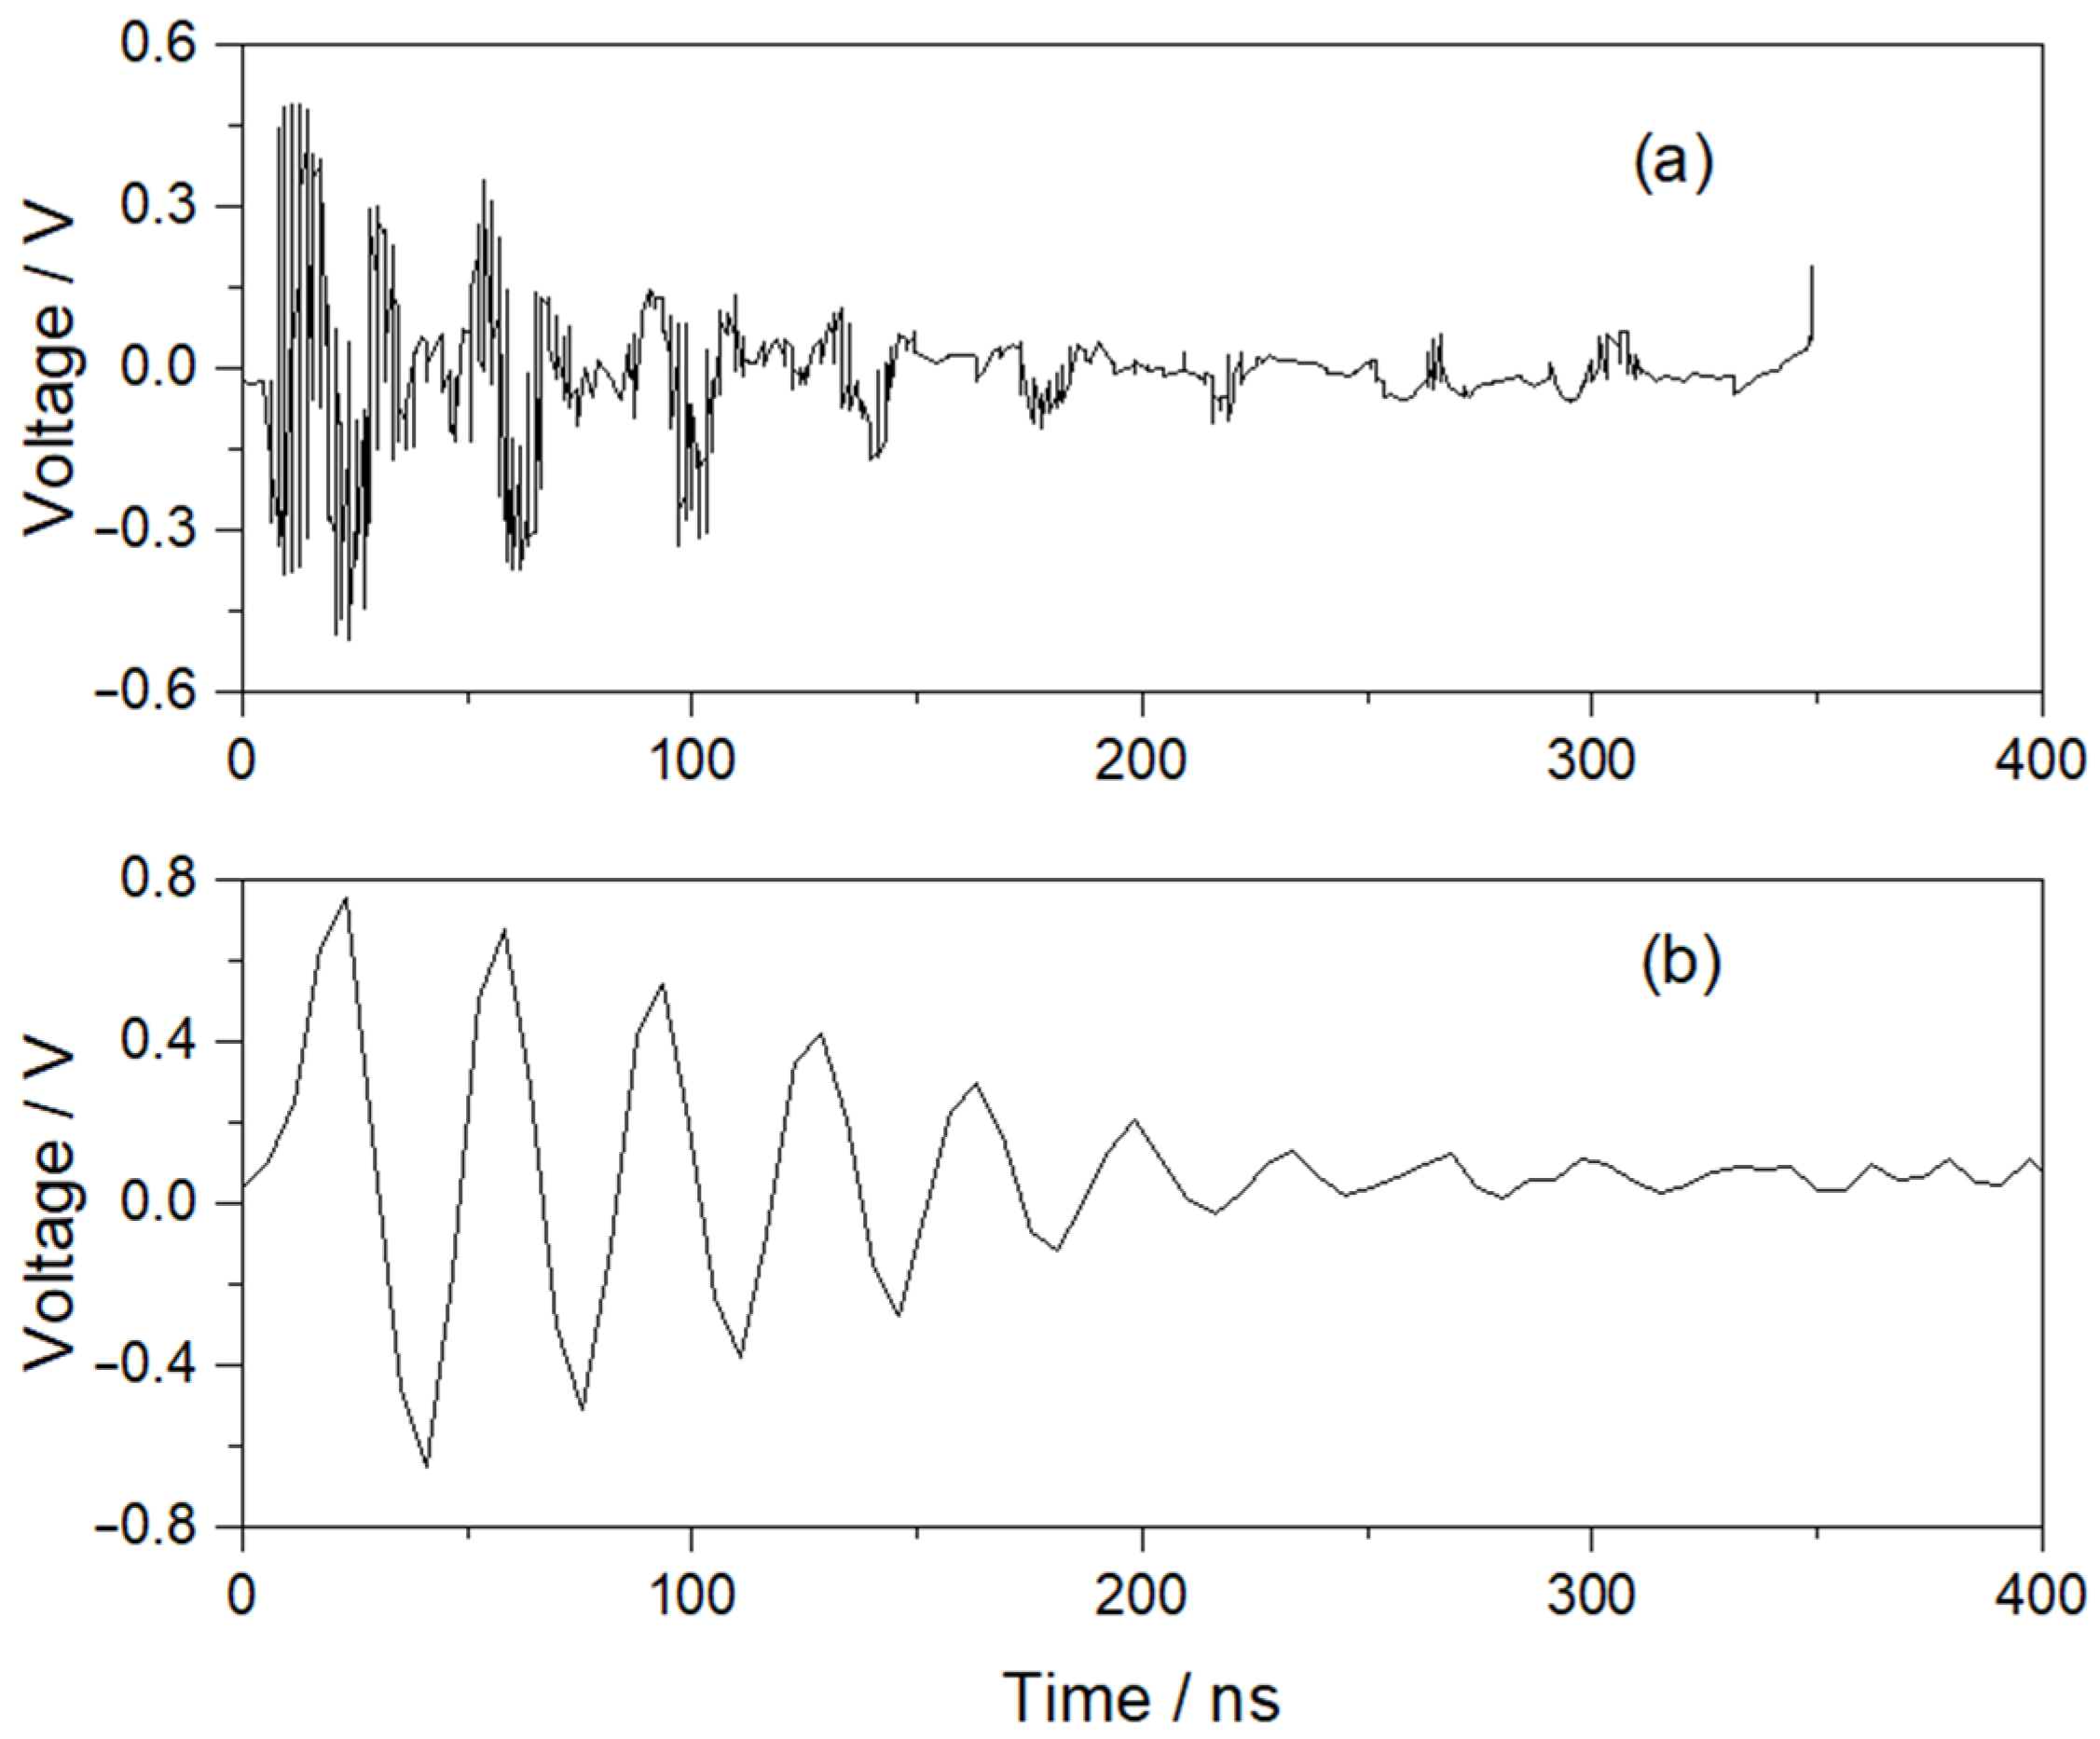
The UHF signal generated by partial discharge in the switchgear will be refracted and reflected many times inside the switchgear, so the UHF signal is usually an exponentially attenuated oscillating signal [15], which can generally be expressed by the double-exponential attenuation oscillation model in Equation (1): where A denotes the signal amplitude, τ denotes the attenuation coefficient of the signal, and fc is the oscillation frequency. Figure 2a is the measured UHF signal of partial discharge, and Figure 2b is the simulated signal of double-exponential attenuation oscillation.
f ( t ) = A ( e 1.3 t / τ e 2.2 t / τ ) sin ( 2 π f c t )
As can be seen in Figure 2, the UHF signal generated when partial discharge occurs inside the switchgear cabinet is relatively similar to the AM signal, so the signal conditioning method of the UHF signal is used more often in the envelope detection method [15,16]. The envelope detection method is used to extract the envelope information of the UHF signal, remove the carrier wave, and then extract the discharge information related to partial discharge from the envelope signal. This way the frequency of the signal can be greatly reduced while retaining the original signal characteristic parameters so that it is easy to realize analog-to-digital conversion by the data collector. The detector waveform signal retains the approximate amplitude, phase, and number of partial discharge signals, which can be used to map the PRPD discharge spectrum so as to carry out partial discharge type identification and exclude interfering signals. Therefore, the design of signal conditioning circuits to realize effective wave detection is a research focus of this paper.

3. Hardware Circuit Design Scheme

3.1. UHF Sensor

UHF signal coupling is the first step of partial discharge monitoring in the switchgear cabinet, and the selection of the type of UHF sensor is especially critical. For high-voltage switchgear, due to the complexity of the field environment, signal noise, and the requirements of the UHF sensor, electromagnetic detection ability is excellent, but it also needs to have a certain degree of filtering ability. At the same time, the size of the sensor needs to match the installation layout of the switchgear cabinet.
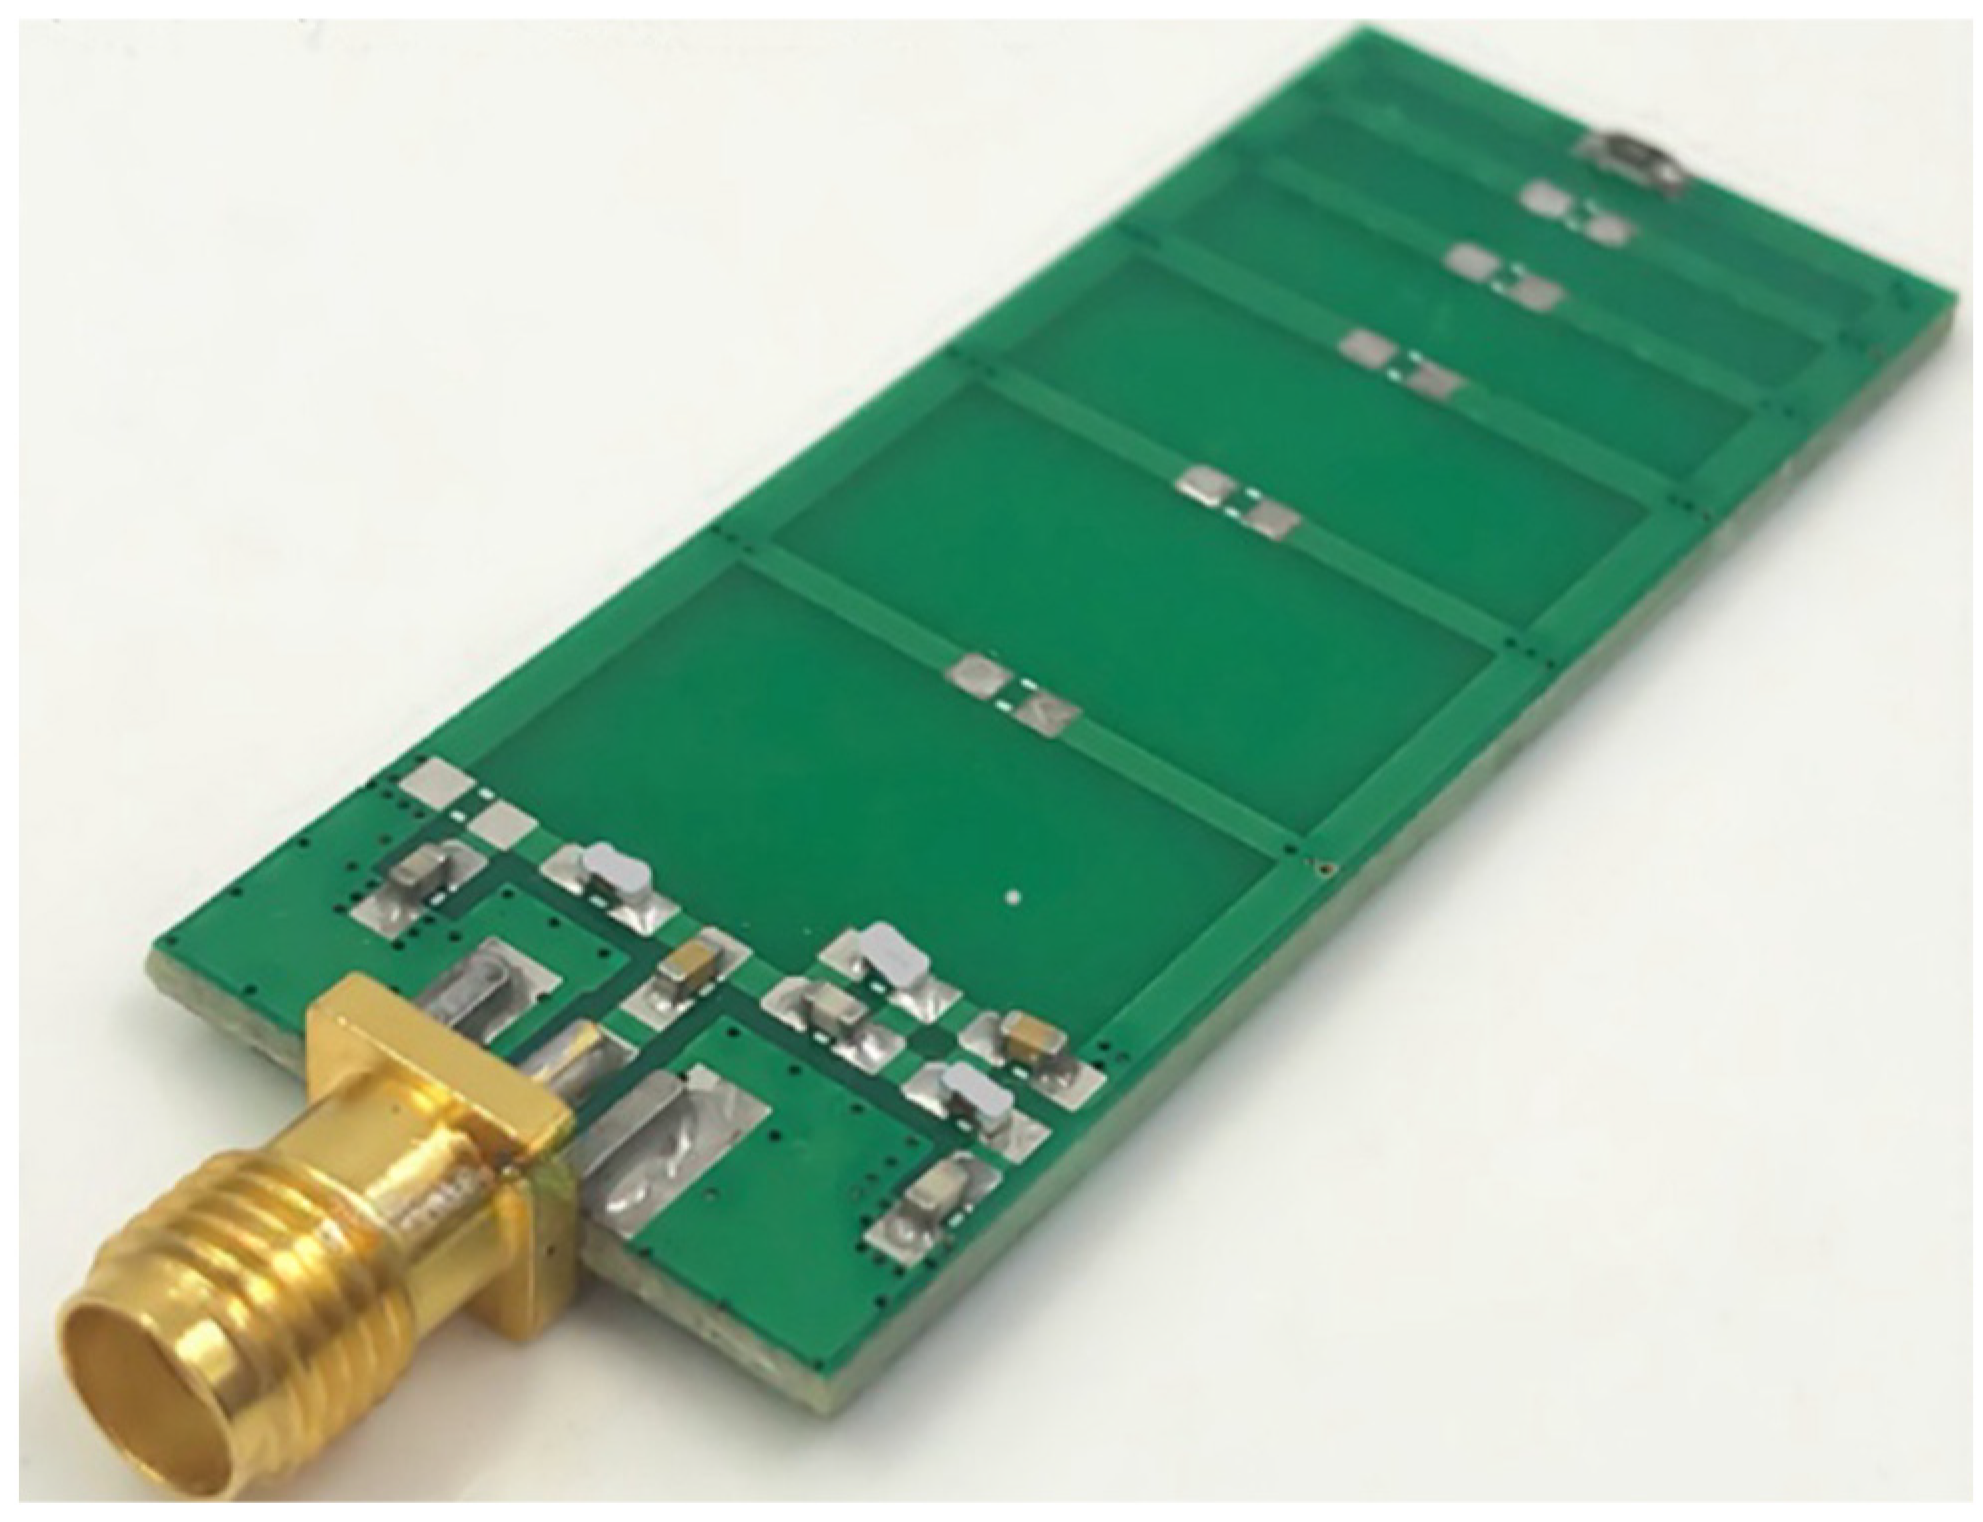
The UHF sensor selected for this system is the antenna sensor (the physical object is shown in Figure 3), which is a composite antenna consisting of a loop antenna and a line antenna, and its minimum operating frequency is 300 MHz~1500 MHz, which can effectively filter out background noise at the substation site and corona interference in the space. Moreover, the energy of the partial discharge signal is proportional to the bandwidth, so the sensor using a wide bandwidth can have a higher sensitivity. At the same time, with the antenna sensor in the 800 MHz~960 MHz band there is 20 dB resistance suppression, this is due to the cell phone GSM signal working frequency generally being 900 MHz. This design can filter out the scene due to the interference brought about by the cell phone signal, which can effectively reduce the false alarm rate of partial discharge monitoring and improve the accuracy of the test. At the same time, the antenna sensor size is small, only 20 × 50 mm, since the operation of the high-voltage switchgear has been used and will not have an influence. The following are the specific parameters of the antenna sensor.
Figure 3 shows the physical diagram of the antenna sensor with the following parameters:
  • Operational frequency: 300–800 MHz and 960–1650 MHz;
  • Bandstop rejection: 20 dB (800–960 MHz);
  • Antenna size: 20 × 50 mm (without connector);
  • Antenna connector: SMA-K (standard female connector, external screw, and internal hole).

3.2. Detection Circuit Design

As shown in Figure 4, the detection module is mainly composed of an ultra-high frequency sensor, a preamplifier circuit, a logarithmic detection circuit, and a signal follower circuit. The core of the detection circuit is the logarithmic detection circuit. The logarithmic detector is cascaded by several demodulating logarithmic amplifiers. The amplitude of the input signal and the output signal is logarithmic, which can help us compress the dynamic range and make the RF signal into a baseband signal [17,18].
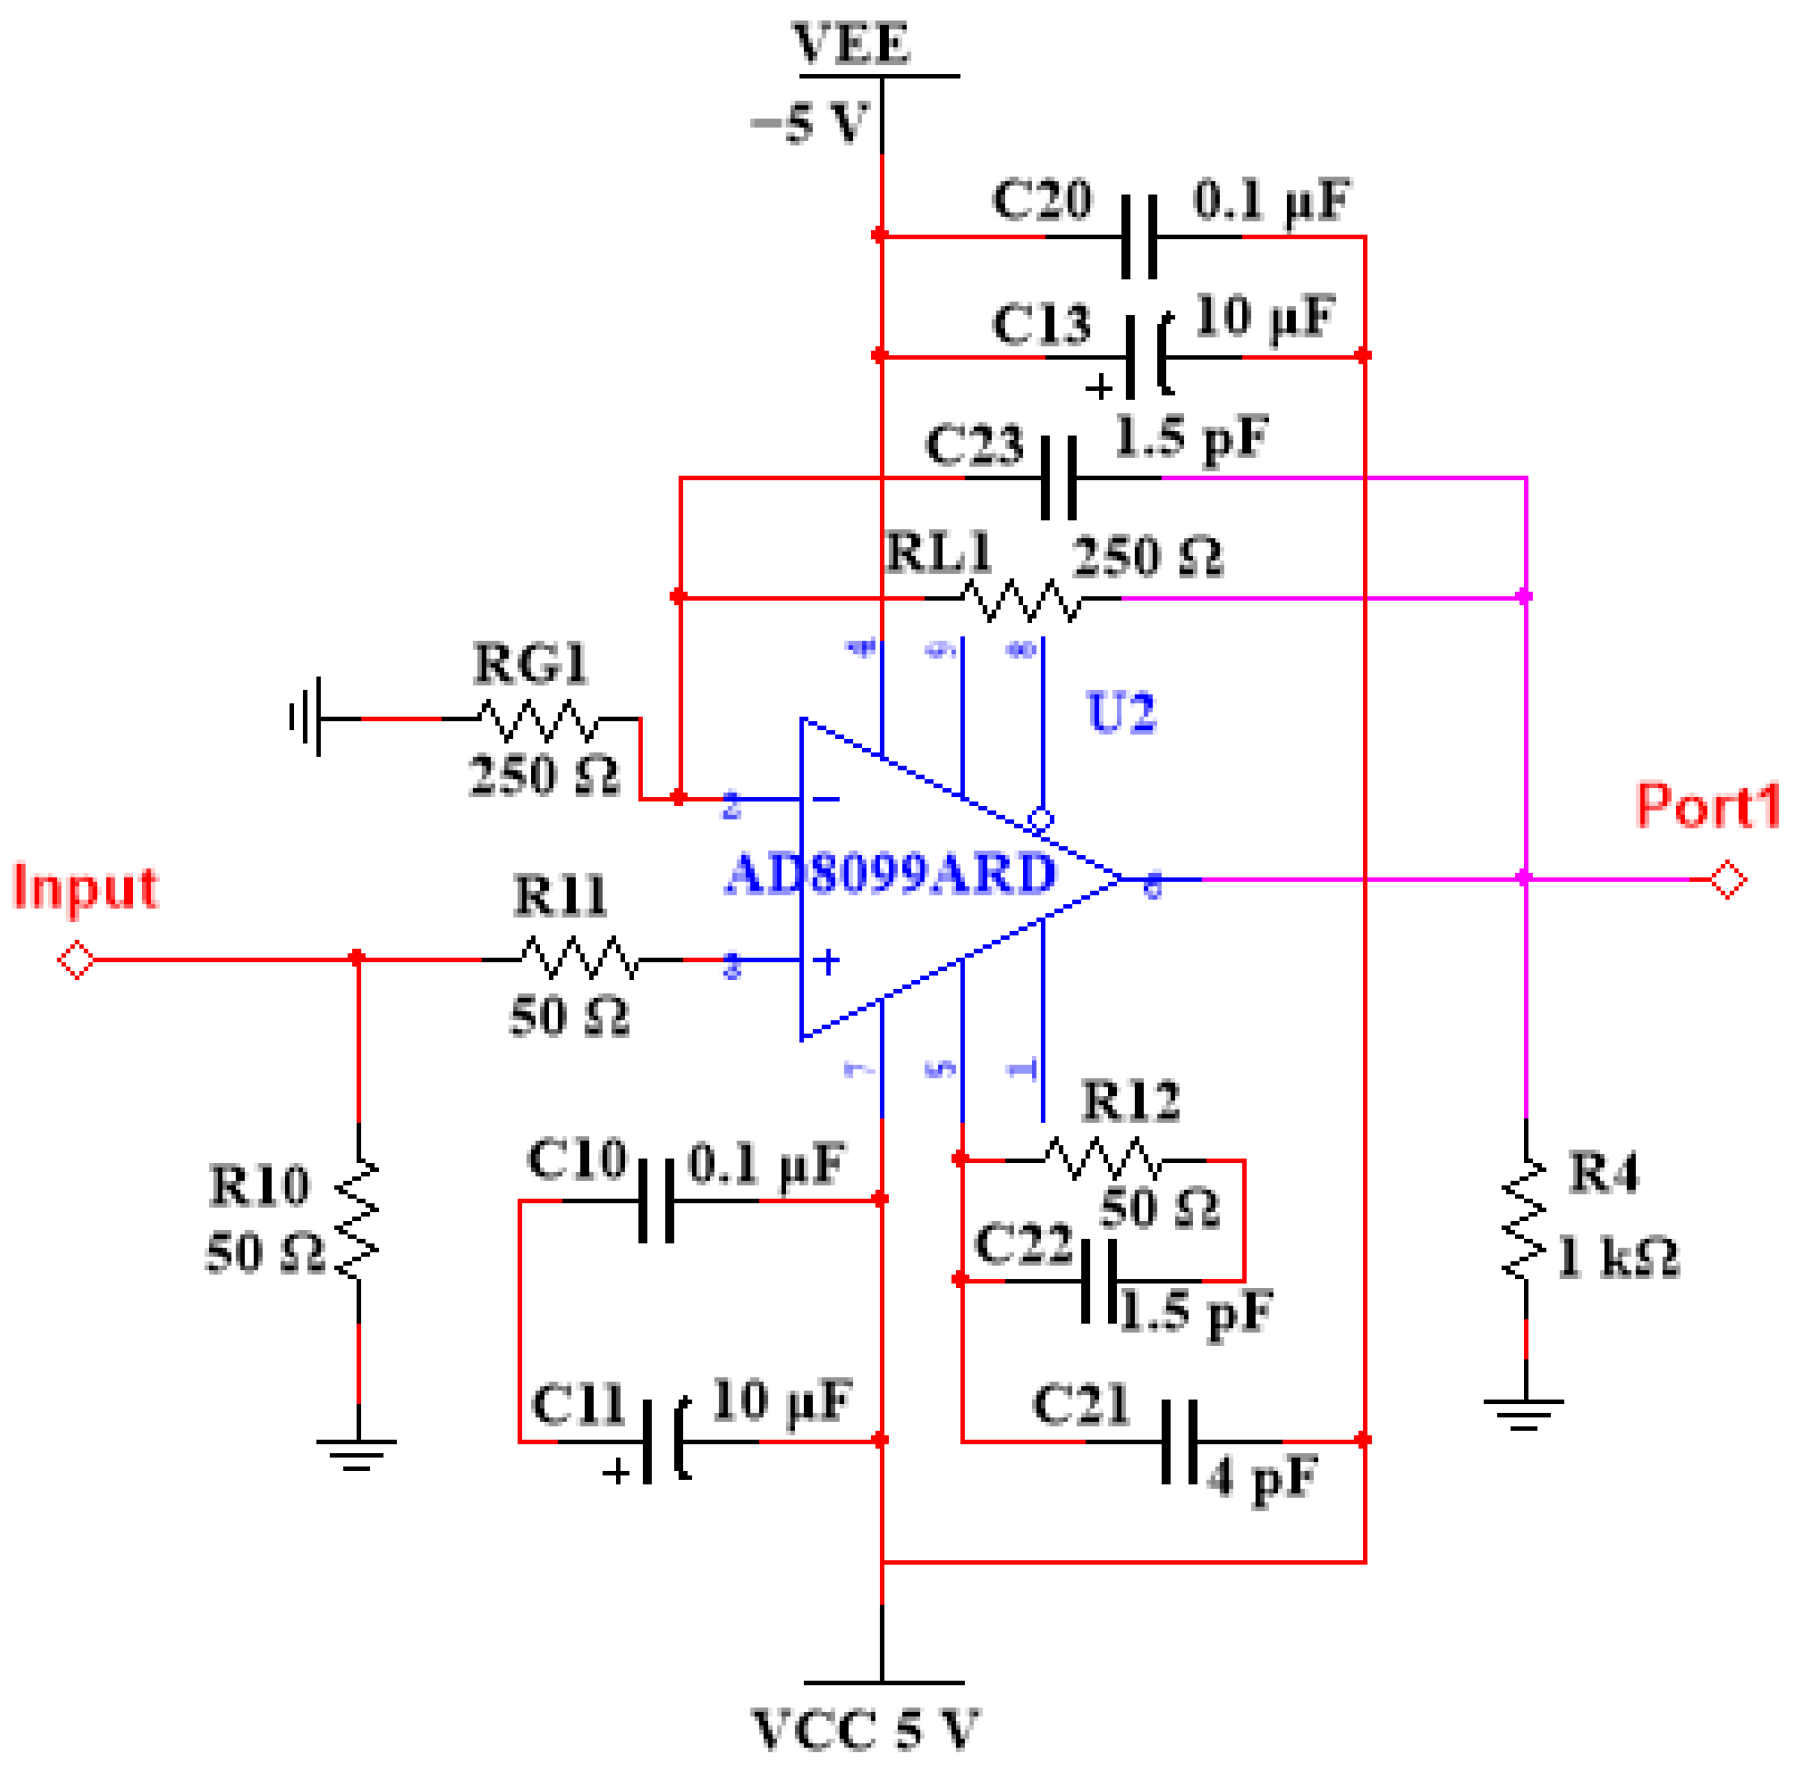
Due to the low amplitude of the UHF signals, it is difficult to obtain them by direct measurement. Therefore, it is necessary to design a preamplifier prior to the logarithmic detector circuit. The preamplifier is designed using the AD8099 ultra-low distortion high-speed operational amplifier from Analog Devices. Figure 5 shows the simulation of the amplifier circuit using NI Multisim 14.0 software. In Figure 5, the UHF signal is fed into the preamplification circuit from the ‘Input’ node. This circuit is a typical gain circuit with gain G = 1 + RL1/RG1. A set of capacitors is connected to the positive and negative poles of the power supply at the same time; the large capacitor is 10 μF, and the small capacitor is 0.1 μF, which can filter out the noise caused by the power supply.
The logarithmic detection circuit is a logarithmic processor, which is designed around the Analog Devices AD8313 log amplifier demodulation chip. The function of the logarithmic detection circuit is to extract the envelope waveform of the UHF signal, which will greatly reduce the sampling rate of the system. The working frequency of AD8313 is 0.1 to 3.5 GHz. It can maintain its high-precision consistency for signals in the frequency range of 0.1 to 2.5 GHz, and it can convert the radio frequency signal into the corresponding amplitude DC output. Figure 6 is a Multisim simulation diagram based on the AD8313 logarithmic amplifier circuit.
As the frequency of the UHF signal generated by PD is between 300 MHz and 1500 MHz, we need to filter out the invalid signal below 300 MHz. The relationship between cut-off frequency and capacitance resistance is shown in Equation (2).
f 3 d B = 1 2 × π × C × R
Since the impedance value adopted by the system is 50 Ω, where R = 50 Ω, the value of capacitance C is determined by C1 and C2. The relationship between C, C1, and C2 is given by Equation (3).
C = C 1 × C 2 C 1 + C 2
It can be seen from Equations (2) and (3) that the invalid electromagnetic wave signal below 300 MHz can be filtered out by using a 20 pF capacitor for C1 and C2.
Since the output impedance of the logarithmic amplifier circuit is large and the input impedance of the data collector is small, if the data collector is directly used to collect the input signal, the loss of the input signal will be serious and the data collector cannot collect the normal signal, so a voltage follower circuit needs to be designed. Like the preamplifier, the AD8099 is used to design the voltage follower. From the gain equation 1 + RL1/RG1, the gain G = 1 when RL1 is at 0 resistance.
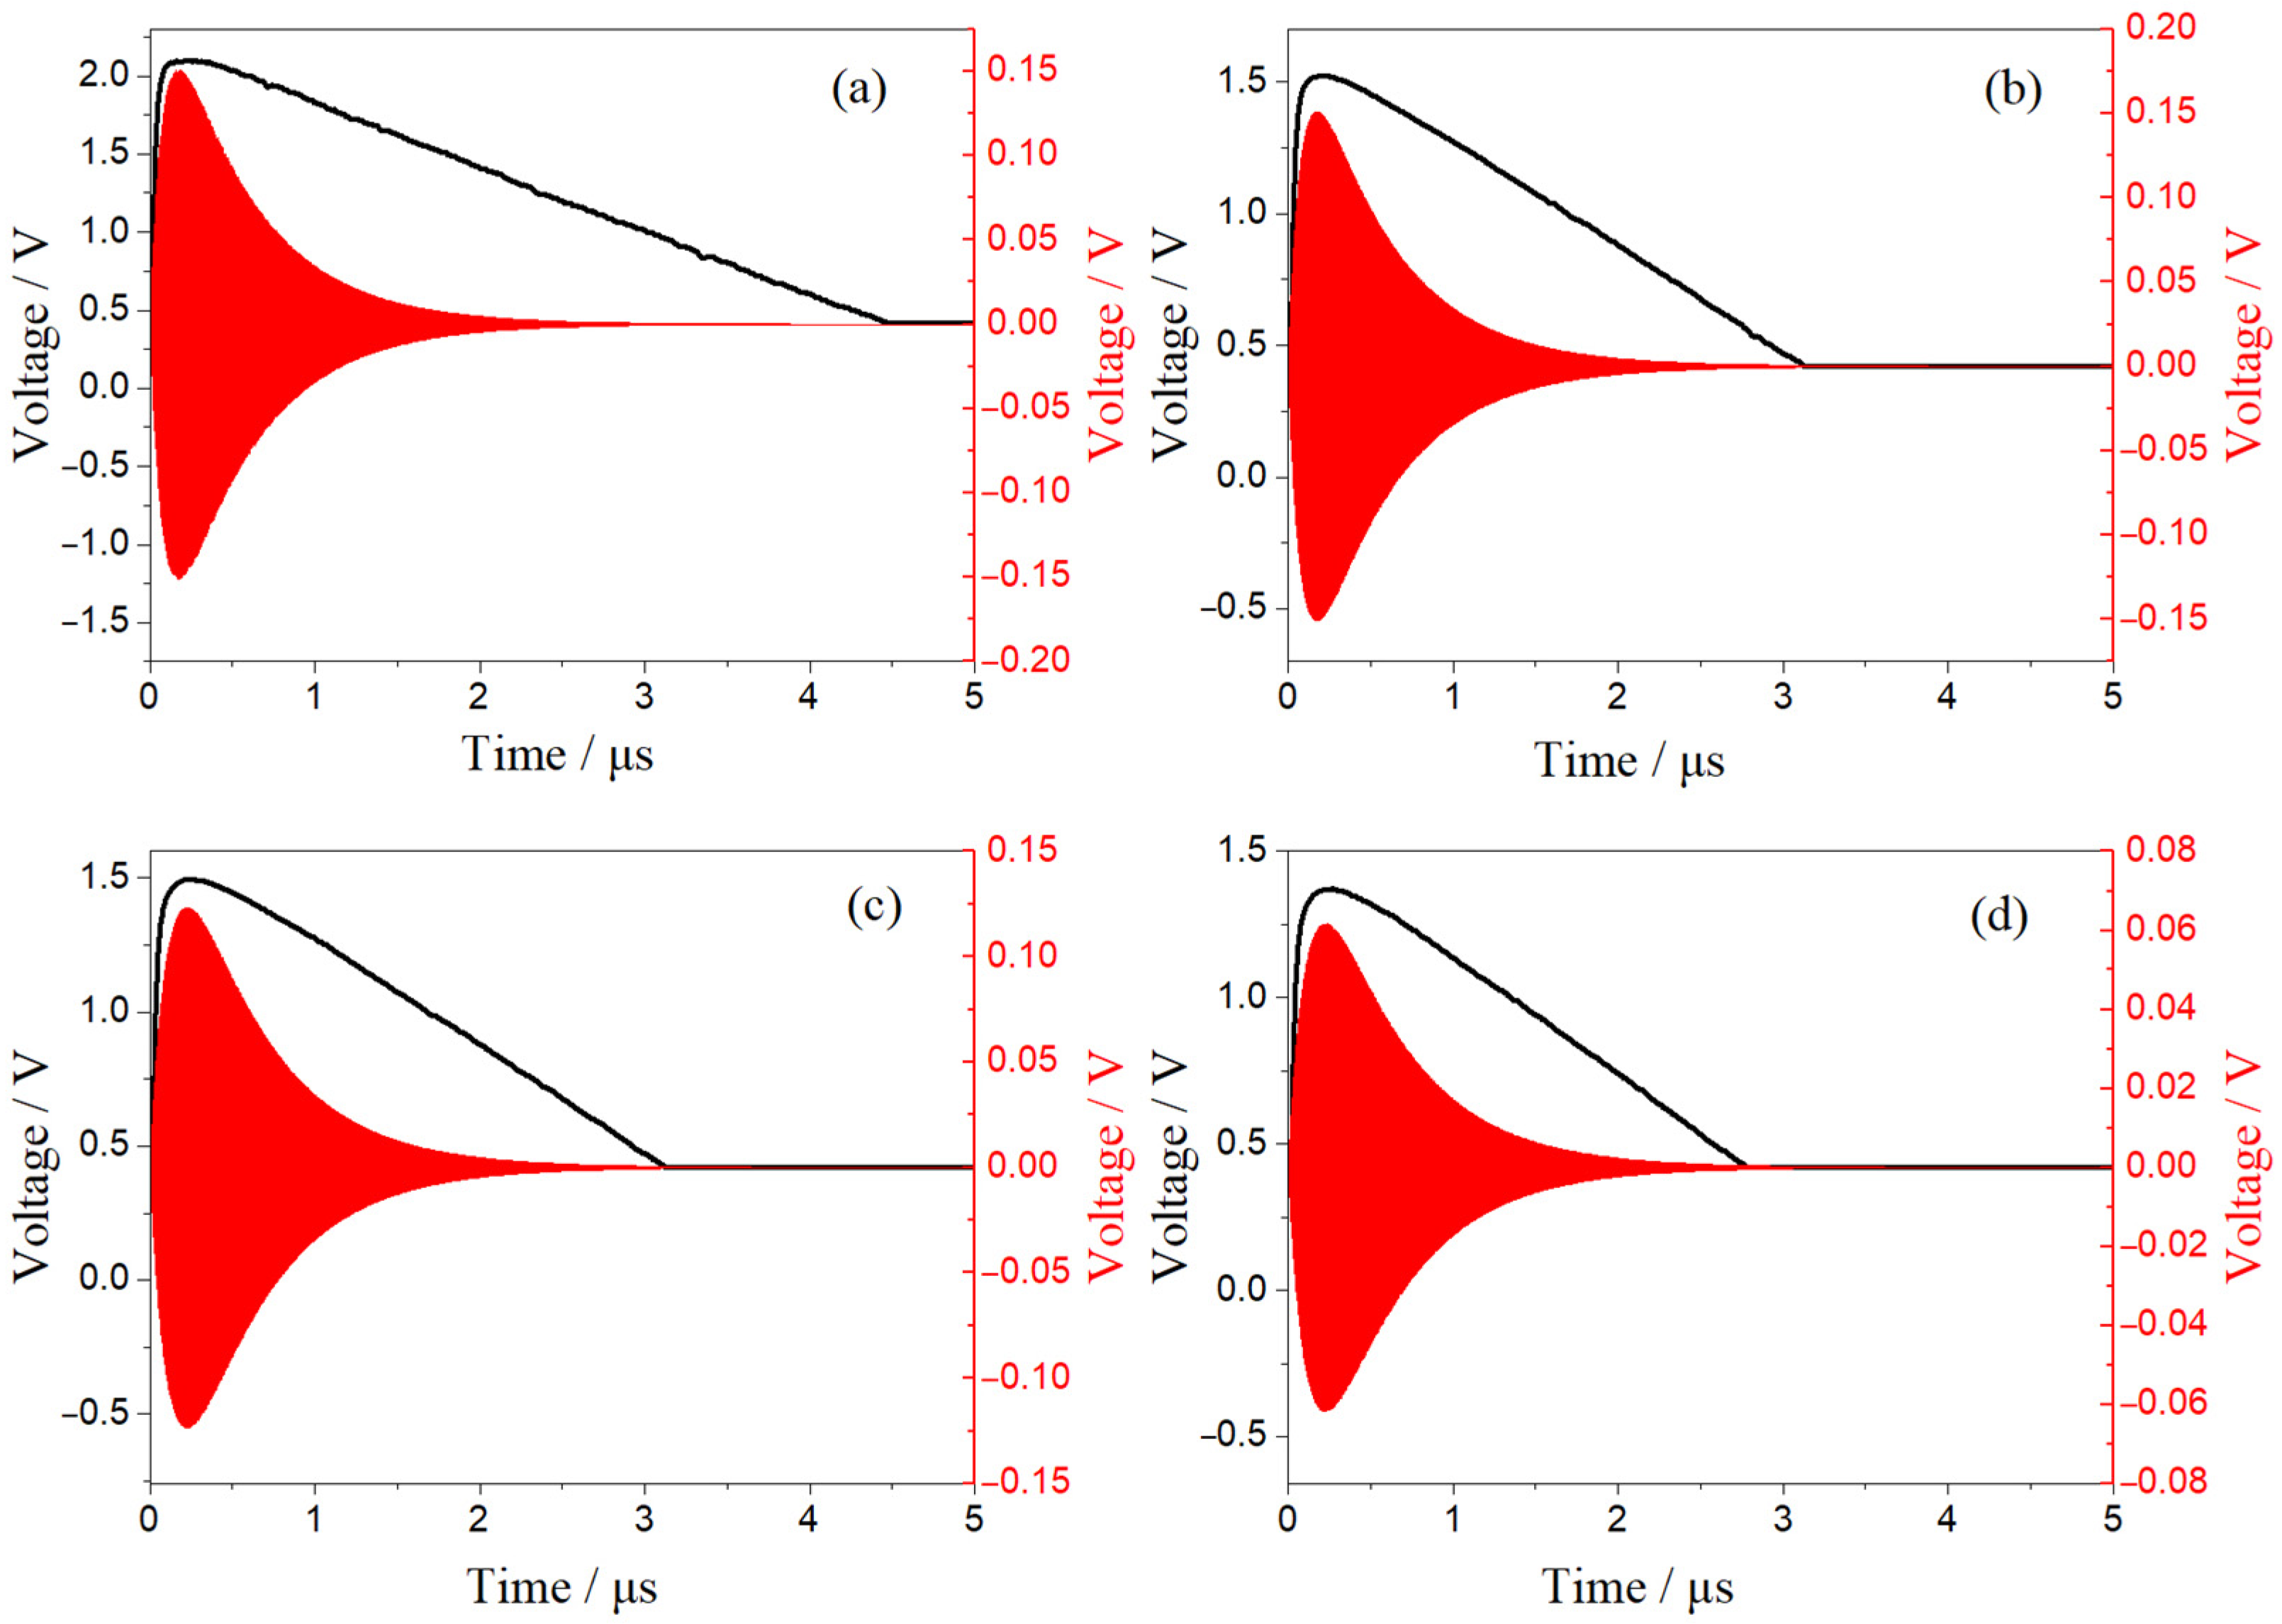
In order to validate the detection circuit, this paper uses the double exponentially decaying oscillatory signal expressed in Equation (1) to simulate the UHF signals generated by partial discharges in switchgear cabinets. In this paper, four groups of UHF signals with different parameters are simulated as partial discharge signals of the switchgear cabinet, and the outputs are shown in Figure 7 after conditioning of the detector circuits, in which the red waveforms indicate the original signals without signal conditioning, and the black waveforms indicate the conditioned signals. The specific parameters of the original signal and the waveform information obtained after signal conditioning are shown in Table 1.
The simulation results show that the rising time of the modulated signals is fast, and the attenuation time of the signals after reaching the peak value is slow. The time when the detection signals reach the peak value is basically the same as that of the original signal. The results show that the simulated detection circuit can complete the amplification of the signal and retain the envelope information of the original signal. The modulated signal can be extended to more than 3 μs, which can satisfy the requirement of data collector for its sampling rate.

3.3. Data Collector Design

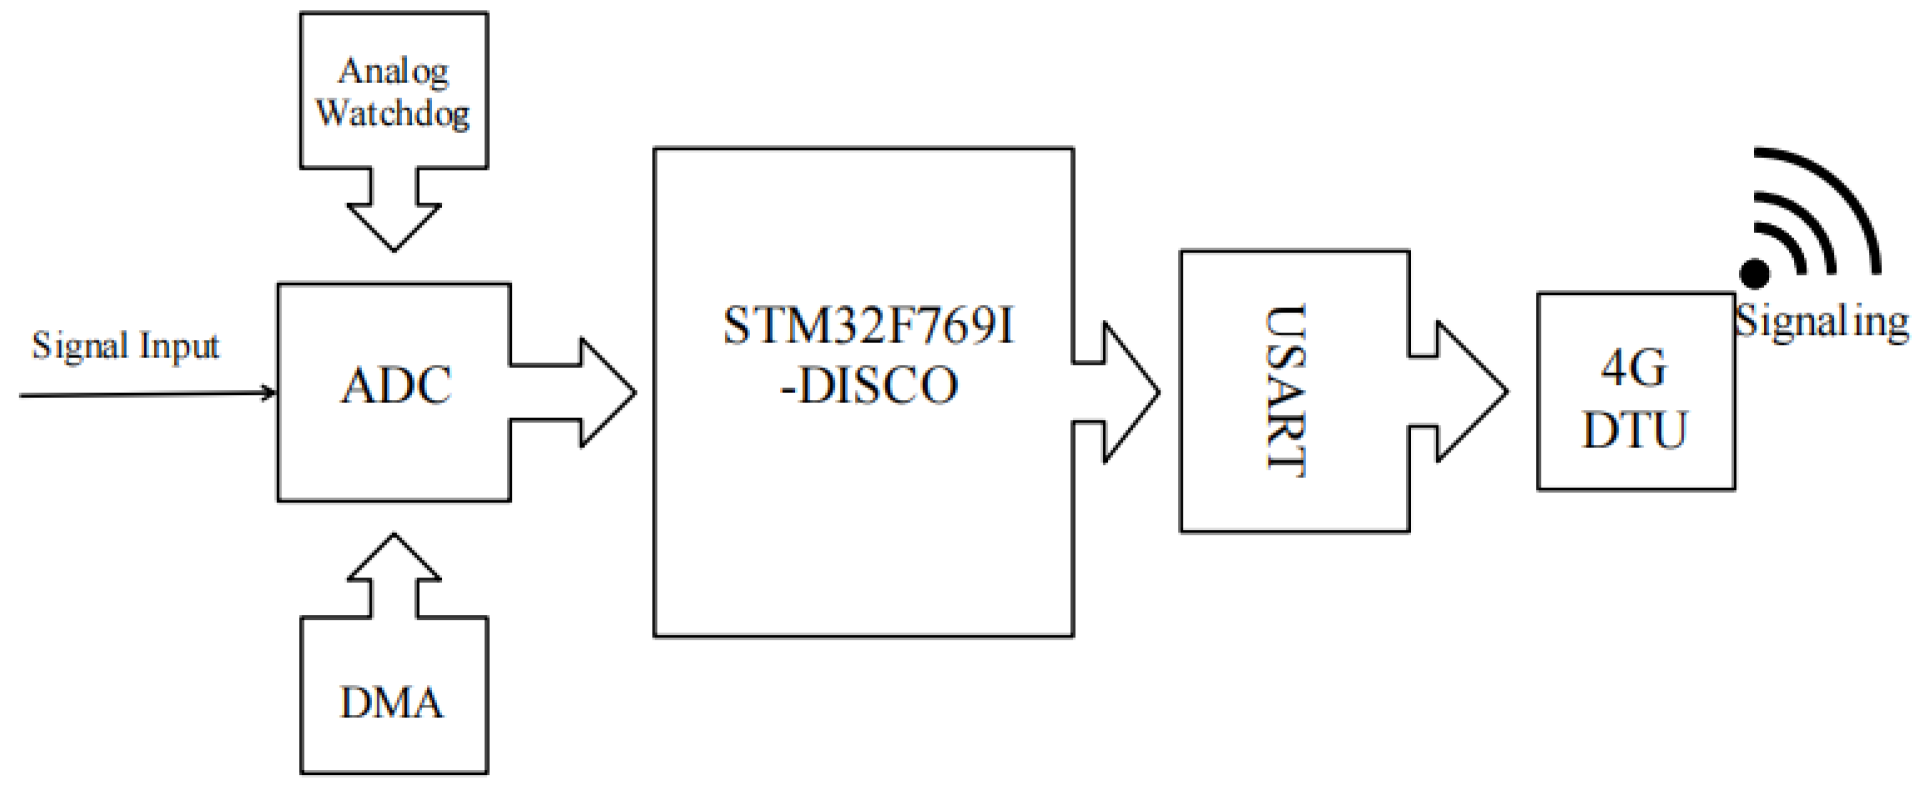
The structure of the data collector is shown in Figure 8. The MCU of the data collector is STM32F769, which is mainly used for data acquisition, A/D conversion, data transmission, and processing instructions sent by the upper computer. The highest working frequency of STM32F769 is 216 MHz [19], and the conversion range of ADC is 0–3.3 V. After the system clock frequency division, the maximum sampling rate can be 7.2 MHz/s under the condition of system stability, and the sampling rate used in the monitoring system developed in this paper is 2.4 MHz/s.
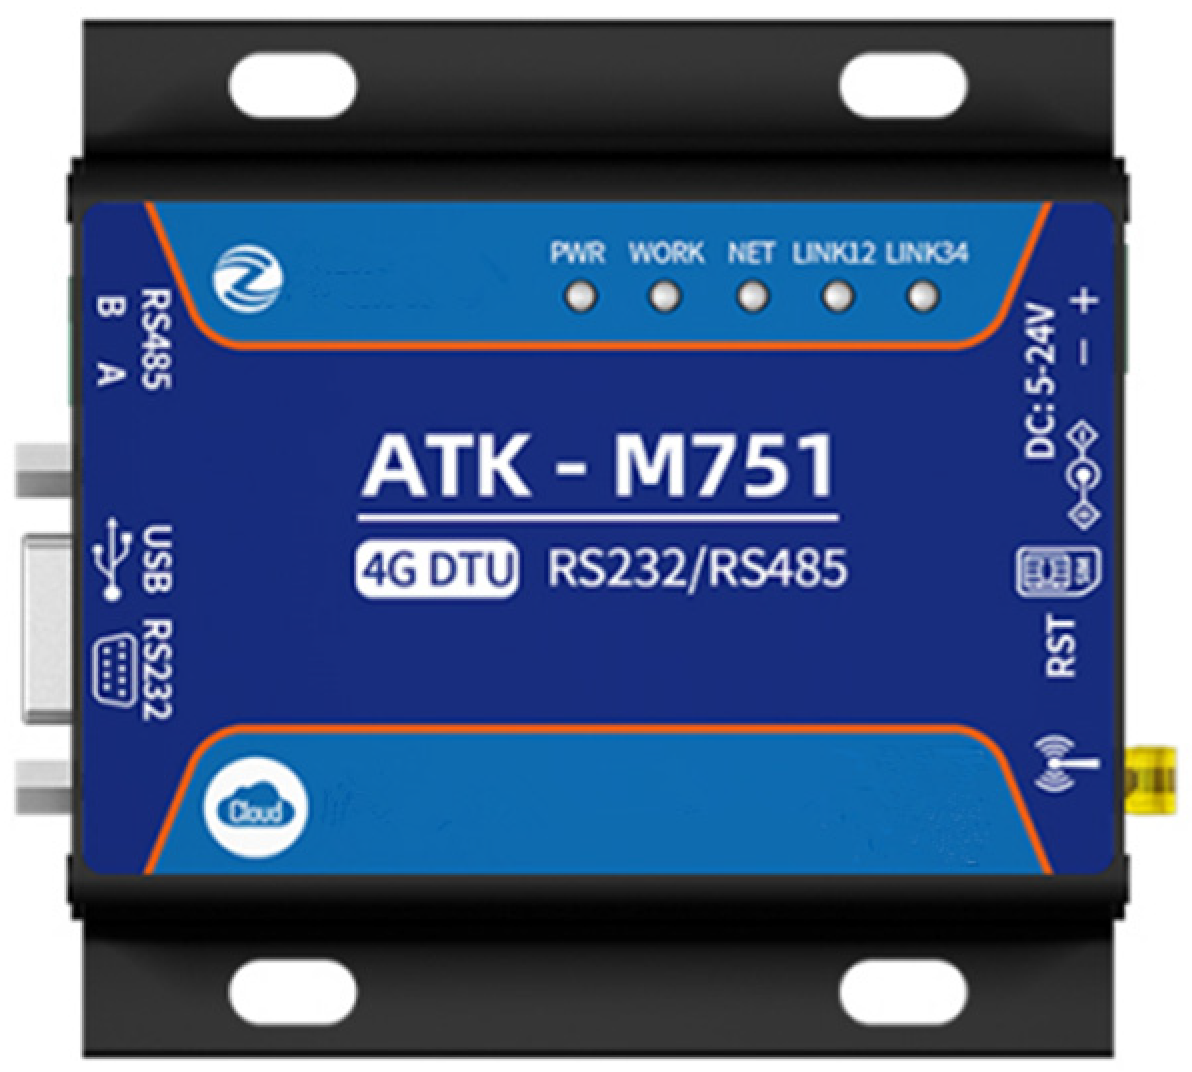
Figure 9 shows the IoT wireless development module used in this system, which is an ATK-M751 model. The ATK-M751 module is a high performance DTU module with high speed, low latency, wireless data transmission, etc. It supports 2G, 3G, 4G communication, various communication protocols (TCP/UDP/HTTP/MQTT/DNS/ RNDIS/NTP), multiple transparent transmission modes (TCP/UDP/HTTP/MQTT), and two serial interfaces, RS232 and RS485, suitable for use in multiple scenarios [20].

4. Program Design of Online Monitoring System

4.1. Communication Program Design

The communication program is designed to send the basic information of the detection equipment and the monitoring data in JSON format to the cloud platform through the GPRS/4G DTU module. The cloud platform will check the information from monitoring equipment, and if the information is correct, communication will be established. The design of the program is based on the MQTT protocol, which can upload the collected data to the cloud platform completely and safely using a small amount of code and low bandwidth. The flow chart of the data sending program is shown in Figure 10.
When the cloud platform receives the data in JSON format, it connects to the host computer database through the data stream transfer 4G DTU module and stores the collected data into the database.

4.2. Upper Computer Software Design

The upper computer software of the system is developed and designed based on Microsoft Visual Studio 2019. The system uses HTML, CSS, and JavaScript to complete the data transmission in the background and uses C# to complete the human–computer interaction in the front end. The upper computer program made by webform can save users from installation, people can check the running status of switchgears through a mobile phone or PC browser at any time, and when necessary, issue instructions to the data collector to change the functions of the working mode conversion and the alarm threshold of the equipment.
The software uses a SQL server 2019 to establish the database. The data detected by the online monitoring system are continuously stored in the database through the cloud platform, and the historical data measured by the equipment are reasonably classified and stored. The operator can directly see the history of the abnormal situation of the equipment by reading the database on the upper computer. Figure 11 shows the structure of the software.
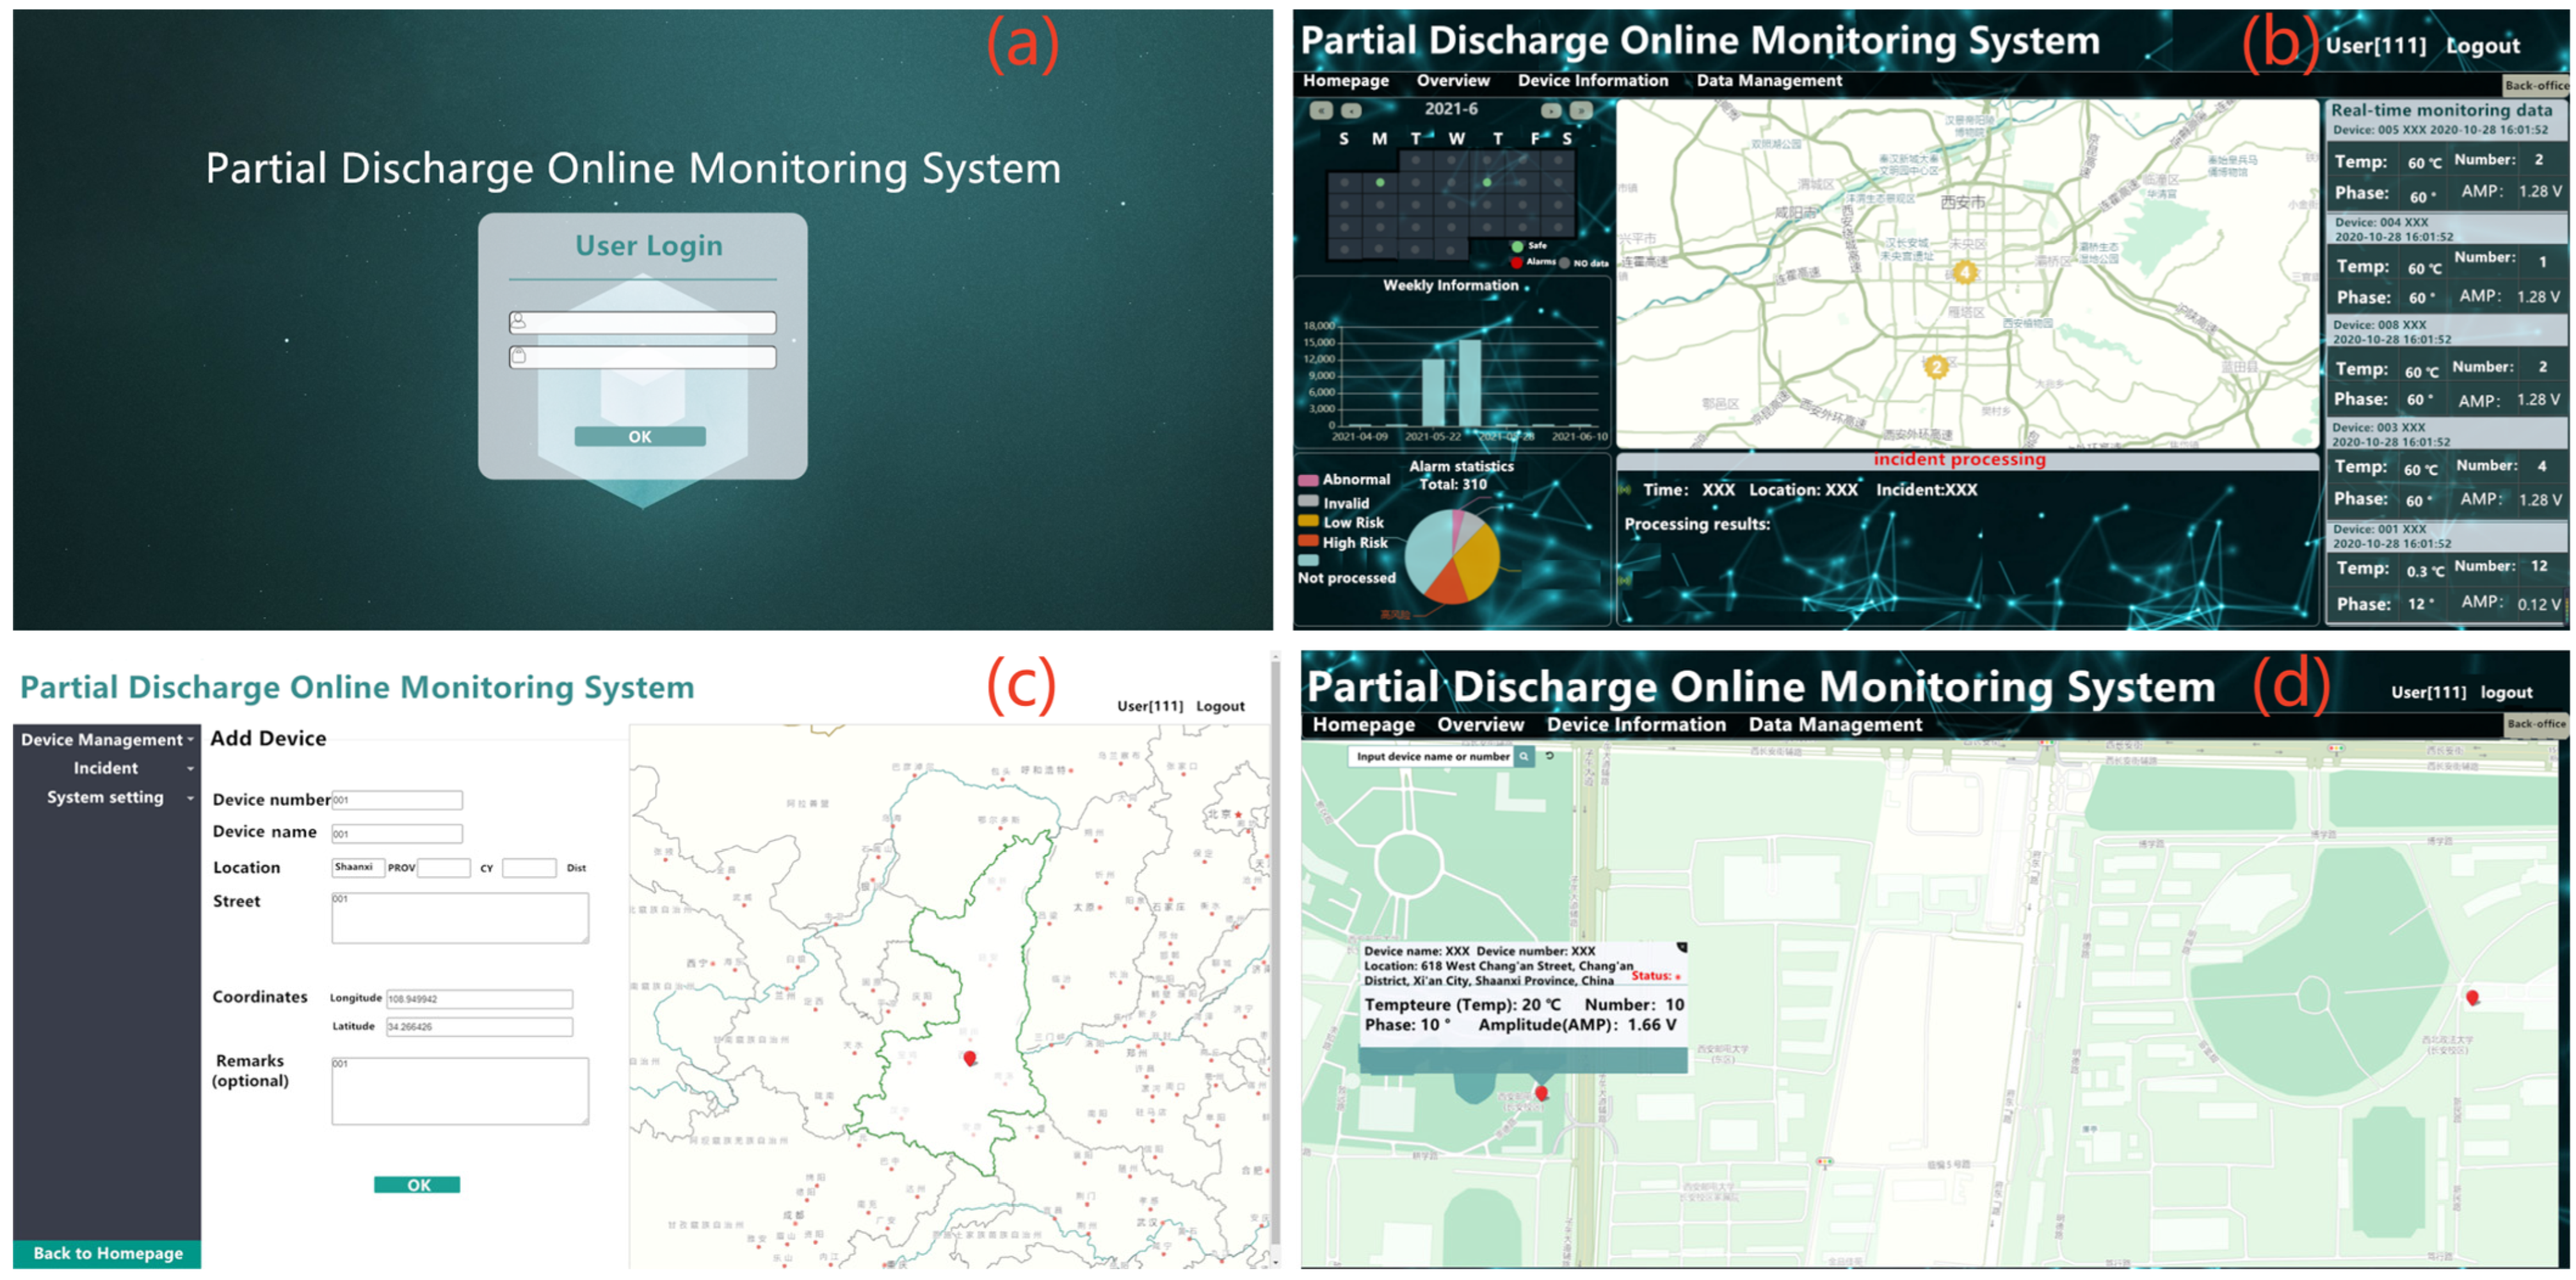
Figure 12 and Figure 13 show the selected software functionality interfaces. The login interface is shown in Figure 12a. Entering the correct account password in the login window will lead to the homepage of the monitoring system shown in Figure 12b. The database for storing account information is stored in the table named “sysUser”, and the stored data include user account number, user password, and user level. Level 0 means that the account is an ordinary user, and Level 1 means that the account is an administrator. It is possible to enter the system platform as shown in Figure 12c. The homepage of the monitoring system mainly consists of an electronic map, a calendar, bar charts, pie charts, and a scrolling information bar. The calendar, bar charts, and pie charts use the echarts control, which stores database data in an array and is called by a control function to display it on the web page. The scrolling information bar uses a function to trigger the generation of the form and the reading of data, the trigger interval is set to 3 s, and through CSS3 animation technology the text can scroll up. The system platform requires management personnel to access and adjust the monitoring system, such as adding, modifying, and deleting devices, modifying the alarm threshold of the system, and handling alarm events. Figure 12d is the equipment information interface, which can see the amount of equipment in different regions. Devices are divided by provincial and municipal levels, and by clicking on the coordinates you can view the specific parameters of the current device, including the name, number, location, coordinates, discharge amplitude, number of discharges, and other parameters of the device. The electronic map is designed based on Baidu map; by reading the latitude and longitude of all devices in the database you can print the coordinate points of the devices on the map.
The real-time data interface, shown in Figure 13a, allows you to view the real-time waveform graphs of different devices, including parameters such as discharge amplitude, number of discharges, and so on. The waveform will change in real time with the update of data. The historical data interface, as shown in Figure 13b, allows you to view the historical data of different devices, and you can select the device you need to query in the drop-down box, as well as the start time and the end time, to view all the information of the device in this time period. Both the real-time waveform graph and the historical waveform graph are designed based on echarts, the horizontal coordinate is the array of saved time, and the vertical coordinate is the array of saved data. The abnormal data interface is shown in Figure 13c, through which you can view all data that exceed the alarm thresholds set by the system in advance. The data are stored in the table in chronological order, and you can filter the data of the devices that need to be displayed according to the drop-down box. Figure 13d is the Generate Report interface. The Generate Report function can generate a report from the data according to the demand. After selecting the device number and the time period that needs to be viewed, the page will calculate the maximum, minimum, and average values of the discharge parameters of the device during the period of time and fill them into the report, generating the unique serial number and exporting them in the form of a Word file.

5. Experimental Results

To simulate the process of charge accumulation in the actual high-voltage switchgear until the breakdown of the insulating material, an experimental platform as shown in Figure 14 was built in combination with the discharge model. The experimental device consists of a transformer, a discharge model, a partial discharge data collector, a high voltage regulator and PC for monitoring. The insulating plastic is placed between the two metal balls of the discharge model as the dielectric, and the UHF sensor is placed about 0.2 m away from the ball–ball discharge model.
The test steps of the experiment are as follows:
(1)
Start each device, start data collector, and supply power to both ends of the discharge model;
(2)
Use the high voltage regulator to slowly increase the supply voltage;
(3)
Record the data monitored by the computer web page.
Table 2 shows the maximum value of the localized discharge pulse monitored by the system as the voltage applied to both sides of the discharge model increases. Figure 15 shows the results of the amplitude of the discharge pulse collected from both sides of the discharge model at a high voltage of 9000 V, and Figure 16 shows the statistical results of the number of discharges. From the experimental results, it is clear that the system can effectively monitor the UHF signals diffracted from the partial discharges by the UHF method and that the maximum voltage value of the discharge pulses and the number of discharges measured by the system increase with the increase in voltage at the two ends of the discharge model. This is because the more energy of electromagnetic radiation diffracted by the insulating material as the charge accumulates, the more discharge signals are coupled to the antenna sensor. It can also be seen from Figure 15 that in addition to the large value signals there are also some uneven smaller energy signals in the waveform graph, which are due to the electromagnetic radiation in the discharge model and the signal attenuation formed by refraction reflections in space. In addition, there is also an effect on the acquisition of the signal when changing the amplitude of the transformer power supply.
Based on the data received from the web page, the front-end software can accurately display the data collected by the data collector. The two-dimensional spectrum shows the amplitude information of the partial discharge signal collected by the data collector and the number of discharges, indicating that the designed detector circuit can meet the demand for UHF signal collection and the data transmission is normal, and there is no loss or repeated data transmission. During the continuous monitoring process, the system operates stably and effectively monitors the discharge signal before the insulation material is penetrated, which provides a reliable basis for the monitoring system designed in this paper to be applied in switchgear monitoring.

6. Conclusions

In this paper, an online PD monitoring system is developed based on the UHF method and IoT technology. The detector circuit and the data collector are designed to detect the PD signal accurately while reducing the cost. The system adopts a browser/server architecture design, which can check the insulation status of all switch cabinets without staff at the site, thus reducing labor cost. Through the circuit simulation, formula calculation, hardware design, and software development, the following conclusions are obtained:
The designed detection circuit can widen the original GHz-level ultra-high frequency signal to about MHz-level, and the data collector is designed based on the low-power STM32F769, which can use the sampling rate of 2.4 MHz to retain the main characteristics of the original signal. In this situation the signal is detected, which reduces the cost of system monitoring.
Data transmission is accurate, and the software runs stably. The insulation status of the switchgear can be viewed in the browser.

Author Contributions

Conceptualization, X.Y.; methodology, X.Y. and C.Z.; software, C.Z.; validation, C.Z. and C.C.; formal analysis, X.Y.; data curation, C.C. and L.B.; writing—original draft preparation, X.Y.; writing—review and editing, W.Z.; project administration, X.Y.; funding acquisition, X.Y. and W.Z. All authors have read and agreed to the published version of the manuscript.

Funding

This research was supported by Key Research and Development Projects of Shaanxi Province, grant numbers 2022GY-210 and 2023-YBGY-256; this research was funded by Shaanxi Education Department Special Program for Serving Localities, grant number 2022JC057; this research was funded by Xi’an University and Instiution Talent Service Enterprise Project, grant number 23GXFW0089; this research was funded by Xi’an Post and Telecommunication University Graduate Student Innovation and Entrepreneurship Fund Program, grant number CXJJDL2022008.

Institutional Review Board Statement

Not applicable.

Informed Consent Statement

Not applicable.

Data Availability Statement

Not applicable.

Conflicts of Interest

The authors declare no conflict of interest.

References

  1. Wu, Y.; Ding, D.; Wang, Y.; Zhou, C.; Lu, H.; Zhang, X. Defect recognition and condition assessment of epoxy insulators in gas insulated switchgear based on multi-information fusion. Measurement 2022, 190, 110701. [Google Scholar] [CrossRef]
  2. Khan, Q.; Refaat, S.S.; Abu-Rub, H.; Toliyat, H.A. Partial discharge detection and diagnosis in gas insulated switchgear: State of the art. IEEE Electr. Insul. Mag. 2019, 35, 16–33. [Google Scholar] [CrossRef]
  3. Paoletti, G.J.; Golubev, A. Partial discharge theory and technologies related to medium-voltage electrical equipment. IEEE Trans. Ind. Appl. 2001, 37, 90–103. [Google Scholar] [CrossRef]
  4. Shafiq, M.; Hussain, G.A.; Kütt, L.; Elkalashy, N.I.; Lehtonen, M. Partial discharge diagnostic system for smart distribution networks using directionally calibrated induction sensors. Electr. Power Syst. Res. 2015, 119, 447–461. [Google Scholar] [CrossRef]
  5. Zou, Y.; Wu, Z.; Gui, J.; Jiang, X.N. Signal Detection and Pattern Recognition of Switchgear Partial Discharge. In Proceedings of the 2017 2nd Internatioanl Seminar on Applied Pyhsics, Optoelectronics and Photonics (APOP 2017), Shanghai, China, 30–31 December 2017; pp. 301–307. [Google Scholar]
  6. Song, J.; Zhang, J.; Fan, X. Device for online monitoring of insulation faults in high-voltage switchgears. Int. J. Distrib. Sens. Netw. 2021, 17, 1550147721999284. [Google Scholar] [CrossRef]
  7. Yan, Y.; Ren, S.; Lu, Y.; Yang, S.; Zhao, K.; Li, H. Efficient and Low-Cost PD Monitoring and Locating System for MV Switchgears Using TEV Detectors. IEEE Trans. Power Deliv. 2021, 36, 3266–3269. [Google Scholar] [CrossRef]
  8. Li, X.; Liu, W.; Xu, Y.; Ding, D. Discharge characteristics and detectability of metal particles on the spacer surface in gas-insulated switchgears. IEEE Trans. Power Deliv. 2021, 37, 187–196. [Google Scholar] [CrossRef]
  9. Lu, S.; Chai, H.; Sahoo, A.; Phung, B.T. Condition monitoring based on partial discharge diagnostics using machine learning methods: A comprehensive state-of-the-art review. IEEE Trans. Dielectr. Electr. Insul. 2020, 27, 1861–1888. [Google Scholar] [CrossRef]
  10. Suo, C.; Deng, X.; Tan, X.; Wang, K.; Zhao, L.; Li, T. Linearity test method for non-contact ultrasonic and transient earth voltage PD detector. Ferroelectrics 2017, 521, 44–52. [Google Scholar] [CrossRef]
  11. Yadam, Y.R.; Ramanujam, S.; Arunachalam, K. An ultrawideband conical monopole with radome for detection of partial discharges. IEEE Sens. J. 2021, 21, 18764–18772. [Google Scholar] [CrossRef]
  12. Darwish, A.; Refaat, S.S.; Toliyat, H.A.; Abu-Rub, H. On the electromagnetic wave behavior due to partial discharge in gas insulated switchgears: State-of-art review. IEEE Access 2019, 7, 75822–75836. [Google Scholar] [CrossRef]
  13. Wang, Y.; Guan, J.; Geng, Y.; Feng, C. A miniaturised LS Peano fractal antenna for partial discharge detection in gas insulated switchgear. Sens. Transducers 2020, 240, 19–25. [Google Scholar]
  14. Dai, D.; Wang, X.; Long, J.; Tian, M.; Zhu, G.; Zhang, J. Feature extraction of GIS partial discharge signal based on S-transform and singular value decomposition. IET Sci. Meas. Technol. 2017, 11, 186–193. [Google Scholar] [CrossRef]
  15. Hu, J.; Liu, W.; Zhang, H.; Liu, H.; Xu, K.N.; Wang, M.M. Arrival Time Difference Estimation of Ultrasonic Signals from Partial Discharge in Electric Power Equipments. J. Electr. Electron. Eng. 2019, 7, 113–119. [Google Scholar] [CrossRef]
  16. Lian, W.; Zhao, T. Design of Insulation Online Monitoring and Anti-Condensation Control System for Distribution Switchgear. Acad. J. Eng. Technol. Sci. 2021, 4, 45–51. [Google Scholar]
  17. Uwiringiyimana, J.P.; Khayam, U.; Montanari, G.C. Design and Implementation of Ultra-Wide Band Antenna for Partial Discharge Detection in High Voltage Power Equipment. IEEE Access 2022, 10, 10983–10994. [Google Scholar] [CrossRef]
  18. Li, Z.; Qu, N.; Li, X.; Zuo, J.; Yin, Y. Partial discharge detection of insulated conductors based on CNN-LSTM of attention mechanisms. J. Power Electron. 2021, 21, 1030–1040. [Google Scholar] [CrossRef]
  19. Jongsataporn, T.; Chivapreecha, S. The matrix-based design and realization of digital parametric equalizer. AEU-Int. J. Electron. Commun. 2021, 134, 153651. [Google Scholar] [CrossRef]
  20. Ruirong, D.; Gan, L. Design of real-time monitoring system for electric submersible pump based on stm32. In Proceedings of the 2021 3rd International Conference on Intelligent Control, Measurement and Signal Processing and Intelligent Oil Field (ICMSP), Xi’an, China, 23–25 July 2021; pp. 326–329. [Google Scholar]
Figure 1. Schematic diagram of the monitoring system.
Applsci 13 11850 g001
Figure 2. (a) UHF signal waveform and (b) simulated signal of double-exponential attenuation oscillation.
Applsci 13 11850 g002
Figure 3. Antenna sensor physical diagram.
Applsci 13 11850 g003
Figure 4. Frameworks of the circuit.
Applsci 13 11850 g004
Figure 5. Preamplifier simulation circuit.
Applsci 13 11850 g005
Figure 6. Logarithmic amplification simulation circuit.
Applsci 13 11850 g006
Figure 7. Simulation signals 1 (a), signal 2 (b), signal 3 (c), and signal 4 (d) conditioning results.
Applsci 13 11850 g007
Figure 8. Block diagram of the data collector.
Applsci 13 11850 g008
Figure 9. Photo of the IoT wireless development module.
Applsci 13 11850 g009
Figure 10. The flow chart of the data sending program.
Applsci 13 11850 g010
Figure 11. Software structure block diagram.
Applsci 13 11850 g011
Figure 12. Part of the software interface functions. (a) Login interface, (b) system home, (c) system administration, and (d) equipment information.
Applsci 13 11850 g012
Figure 13. Part of the software interface functions. (a) Real-time measurement interface, (b) history query interface, (c) abnormal data logging interface, and (d) report generation interface.
Applsci 13 11850 g013
Figure 14. High voltage laboratory simulation of discharge circuit test site.
Applsci 13 11850 g014
Figure 15. Acquisition of discharge amplitude at 9000 V.
Applsci 13 11850 g015
Figure 16. Statistics on the number of discharges on the web page side.
Applsci 13 11850 g016
Table 1. Simulation signal conditioning results.
No.A (V)fc (MHz)τ (ns)Amplitude (V)Extend (μs)
11300802.104.47
21900801.523.14
319001201.493.13
40.59001201.372.81
Table 2. Discharge model measurement results.
Discharge Voltage (V)Maximum Amplitude of Discharge Waveform (V)
80000.175
90000.214
10,0000.363
12,0000.522
Disclaimer/Publisher’s Note: The statements, opinions and data contained in all publications are solely those of the individual author(s) and contributor(s) and not of MDPI and/or the editor(s). MDPI and/or the editor(s) disclaim responsibility for any injury to people or property resulting from any ideas, methods, instructions or products referred to in the content.