Article

Segment Thickness Design and Bearing Performance Analysis of Large Inner-Diameter Shield Tunnel under Lateral Unloading

1
College of Civil Engineering and Architecture, Zhejiang University, Hangzhou 310058, China
2
Powerchina Huadong Engineering Corporation, Hangzhou 311122, China
3
The Key Laboratory of Road and Traffic Engineering, Ministry of Education, Tongji University, Shanghai 201804, China
*
Author to whom correspondence should be addressed.
Appl. Sci. 2023, 13(21), 11871; https://doi.org/10.3390/app132111871
Submission received: 24 September 2023 / Revised: 20 October 2023 / Accepted: 23 October 2023 / Published: 30 October 2023
(This article belongs to the Topic Advances on Structural Engineering, 2nd Volume)

Abstract

:
In order to accommodate more transportation-supporting facilities, the expansion of structures’ inner diameter has become the development trend of metro shield tunnels. But for large inner-diameter shield tunnels, the segment thickness design and bearing performance characteristics of tunnels under lateral unloading are still unclear. The purpose of the research was to select the optimal segment thickness and clarify the bearing performance of large inner-diameter shield tunnels. Therefore, in this study, a 3D refined numerical model was established to analyze and determine the optimal segment thickness for a shield tunnel with an inner diameter of 5.9 m. Furthermore, a full-scale test was carried out to study the bearing performance of the shield tunnel under lateral unloading. The results showed that the maximum tunnel horizontal deformation difference between the calculation and the test did not exceed 5%, and the maximum difference in the overall structure deformation between the calculation and the test did not exceed 7%. Increasing the segment thickness can reduce the convergence deformation of the shield tunnel nonlinearly; the deformation reduction was no longer significant when the segment thickness increased to 400 mm with an inner diameter of 5.9 m. Under the lateral unloading condition, the internal force of the tunnel structure increased significantly at sections of 0°, 55°, 125°, and 190°. Compared with the normal design load stage, the maximum bending moment and axial force increased by 36% and 74.1%, respectively, in the final failure stage. There was no bolt yield during the entire unloading process, indicating that the excessive strength of the bolt could not fully play a role in the entire life cycle of the large inner-diameter tunnel structure. The failure mechanism of the shield tunnel can be described as follows: in the early stage of a load, a shield tunnel will appear with joints open and dislocated. As the load increases, cracks in different directions gradually appear near the tunnel joint. In the ultimate load stage, the shield tunnel loses load-bearing capacity, and large areas of falling blocks appear at the top and bottom of the tunnel.

1. Introduction

With the development of technology, the metro has brought convenience to people’s transportation, and a shield tunnel is one type of the main structural forms of metro tunnels [1,2]. In order to accommodate more transportation-supporting facilities, the expansion of tunnel inner diameters has become the development trend of metro shield tunnels [3,4,5]. The obvious advantage of a large inner diameter is that it not only meets the large-scale design of metro trains but also provides sufficient space for the installation of tunnel reinforcement materials.
During the operation of the metro, due to the influence of the surrounding foundation pit excavation and adjacent construction, the soil pressure around the shield tunnel will change [6,7,8], and the shield tunnel will appear with different types of structural diseases such as joint open, dislocation, leakage, cracking, excessive structural convergence deformation, and so on [9,10,11,12,13]. These structural diseases will not only reduce the service life of the tunnel but also threaten the safe operation of the metro. Currently, many researchers have studied the load-bearing performance of shield tunnels under unloading conditions by different methods. Shi et al. [14] established a shield tunnel model with multiring staggered joint assembly and studied the deformation and joint opening of the shield tunnel under lateral unloading. Based on a damage-plasticity model of concrete, Liu et al. [15] analyzed the rebar stress and tunnel segment damage characteristics under large-scale unloading; the calculation data indicated that concrete damage would significantly reduce the bearing capacity of a shield tunnel under unloading. Wu et al. [16] established a sophisticated shield tunnel numerical model that contained rebar, bolt, sealing grooves, and caulking grooves, and they analyzed the deformation and interforce of a shield tunnel under upper unloading; the result showed that the weak areas of the shield tunnel were located at 73°, 287°, 180°, 8°, and 352° during unloading.
The numerical calculation method can analyze the deformation and internal force of a multiring shield tunnel under unloading, but the deterioration law of segment joints and the crack distribution pattern cannot be accurately simulated, so many researchers have adopted the model test or full-scale test method to study it. Guo et al. [17] considered the internal auxiliary structure of a tunnel and designed a type of small-scale model shield tunnel with straight joints and staggered joints to analyze the joint dislocation under different load conditions. Wang et al. [18] used transparent resin and screws to simulate the tunnel segments and joints, respectively, and studied the tunnel joint opening under surface overload. Zhang et al. [19] used physical model tests in 1 g plane strain conditions and studied the surface crack law of segments under excavation unloading. The segment material in the model test usually does not contain internal rebar and bolt holes, so the tunnel structural internal forces obtained from the model test may differ significantly from the actual situation. Wei et al. [20] combined a full-scale test and numerical simulation method to study the internal force and overall deformation laws of a shield tunnel under unilateral lateral unloading; the results showed that the tunnel’s internal force was more sensitive to variation in the confining pressure. Liang et al. [21] took a three-ring shield tunnel as the test object and studied the shield tunnel failure mechanism and damage characteristics under ultimate load. Liu et al. [22] studied the spalling of segment concrete and the deformation law of joints under unloading conditions through three-ring full-scale tests.
All of the above studies have focused on shield tunnels with small inner diameters; for a large inner-diameter shield tunnel, the segment thickness design and bearing performance characteristics of the tunnel under lateral unloading are still unclear. Different from a shield tunnel with a small inner diameter, soil and water pressures on a large inner diameter tunnel at the top and bottom are significant differences, and the distribution scale of the tunnel interforce is wide. Under the disturbance of the surrounding load, a segment may appear as a large-scale crack, resulting in a sharp deterioration in load-bearing performance. Therefore, in this paper, both numerical simulation and full-scale test methods were used simultaneously, and the correctness of numerical simulation was verified by a full-scale test. A 3D refined numerical model was established to analyze and determine the optimal segment thickness for a shield tunnel with an inner diameter of 5.9 m; the connecting bolt, internal rebar, and joint mortise were all considered in the model. Furthermore, a full-scale test was carried out to study the bearing performance of the shield tunnel under lateral unloading. The joint deformation, structural internal force, and cracking patterns of the shield tunnel were investigated under different test loads.

2. The Numerical Model of Shield Tunnel with Stagger-Jointed Assembly

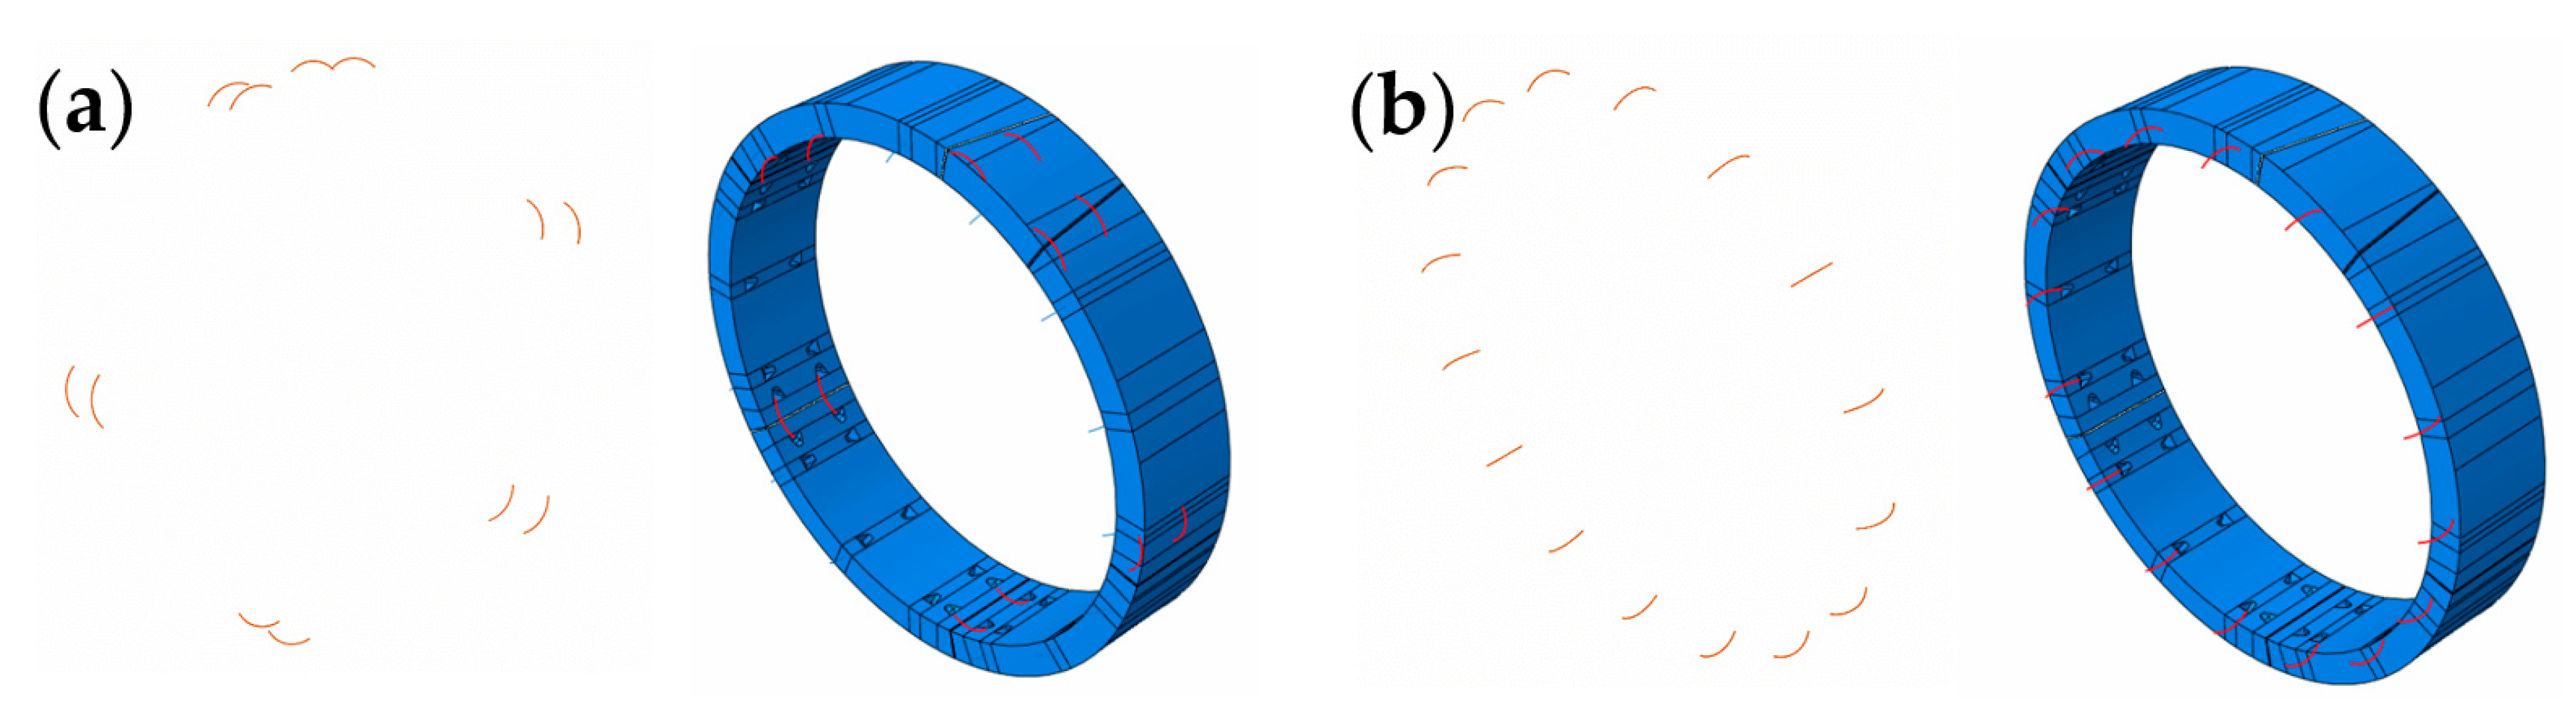
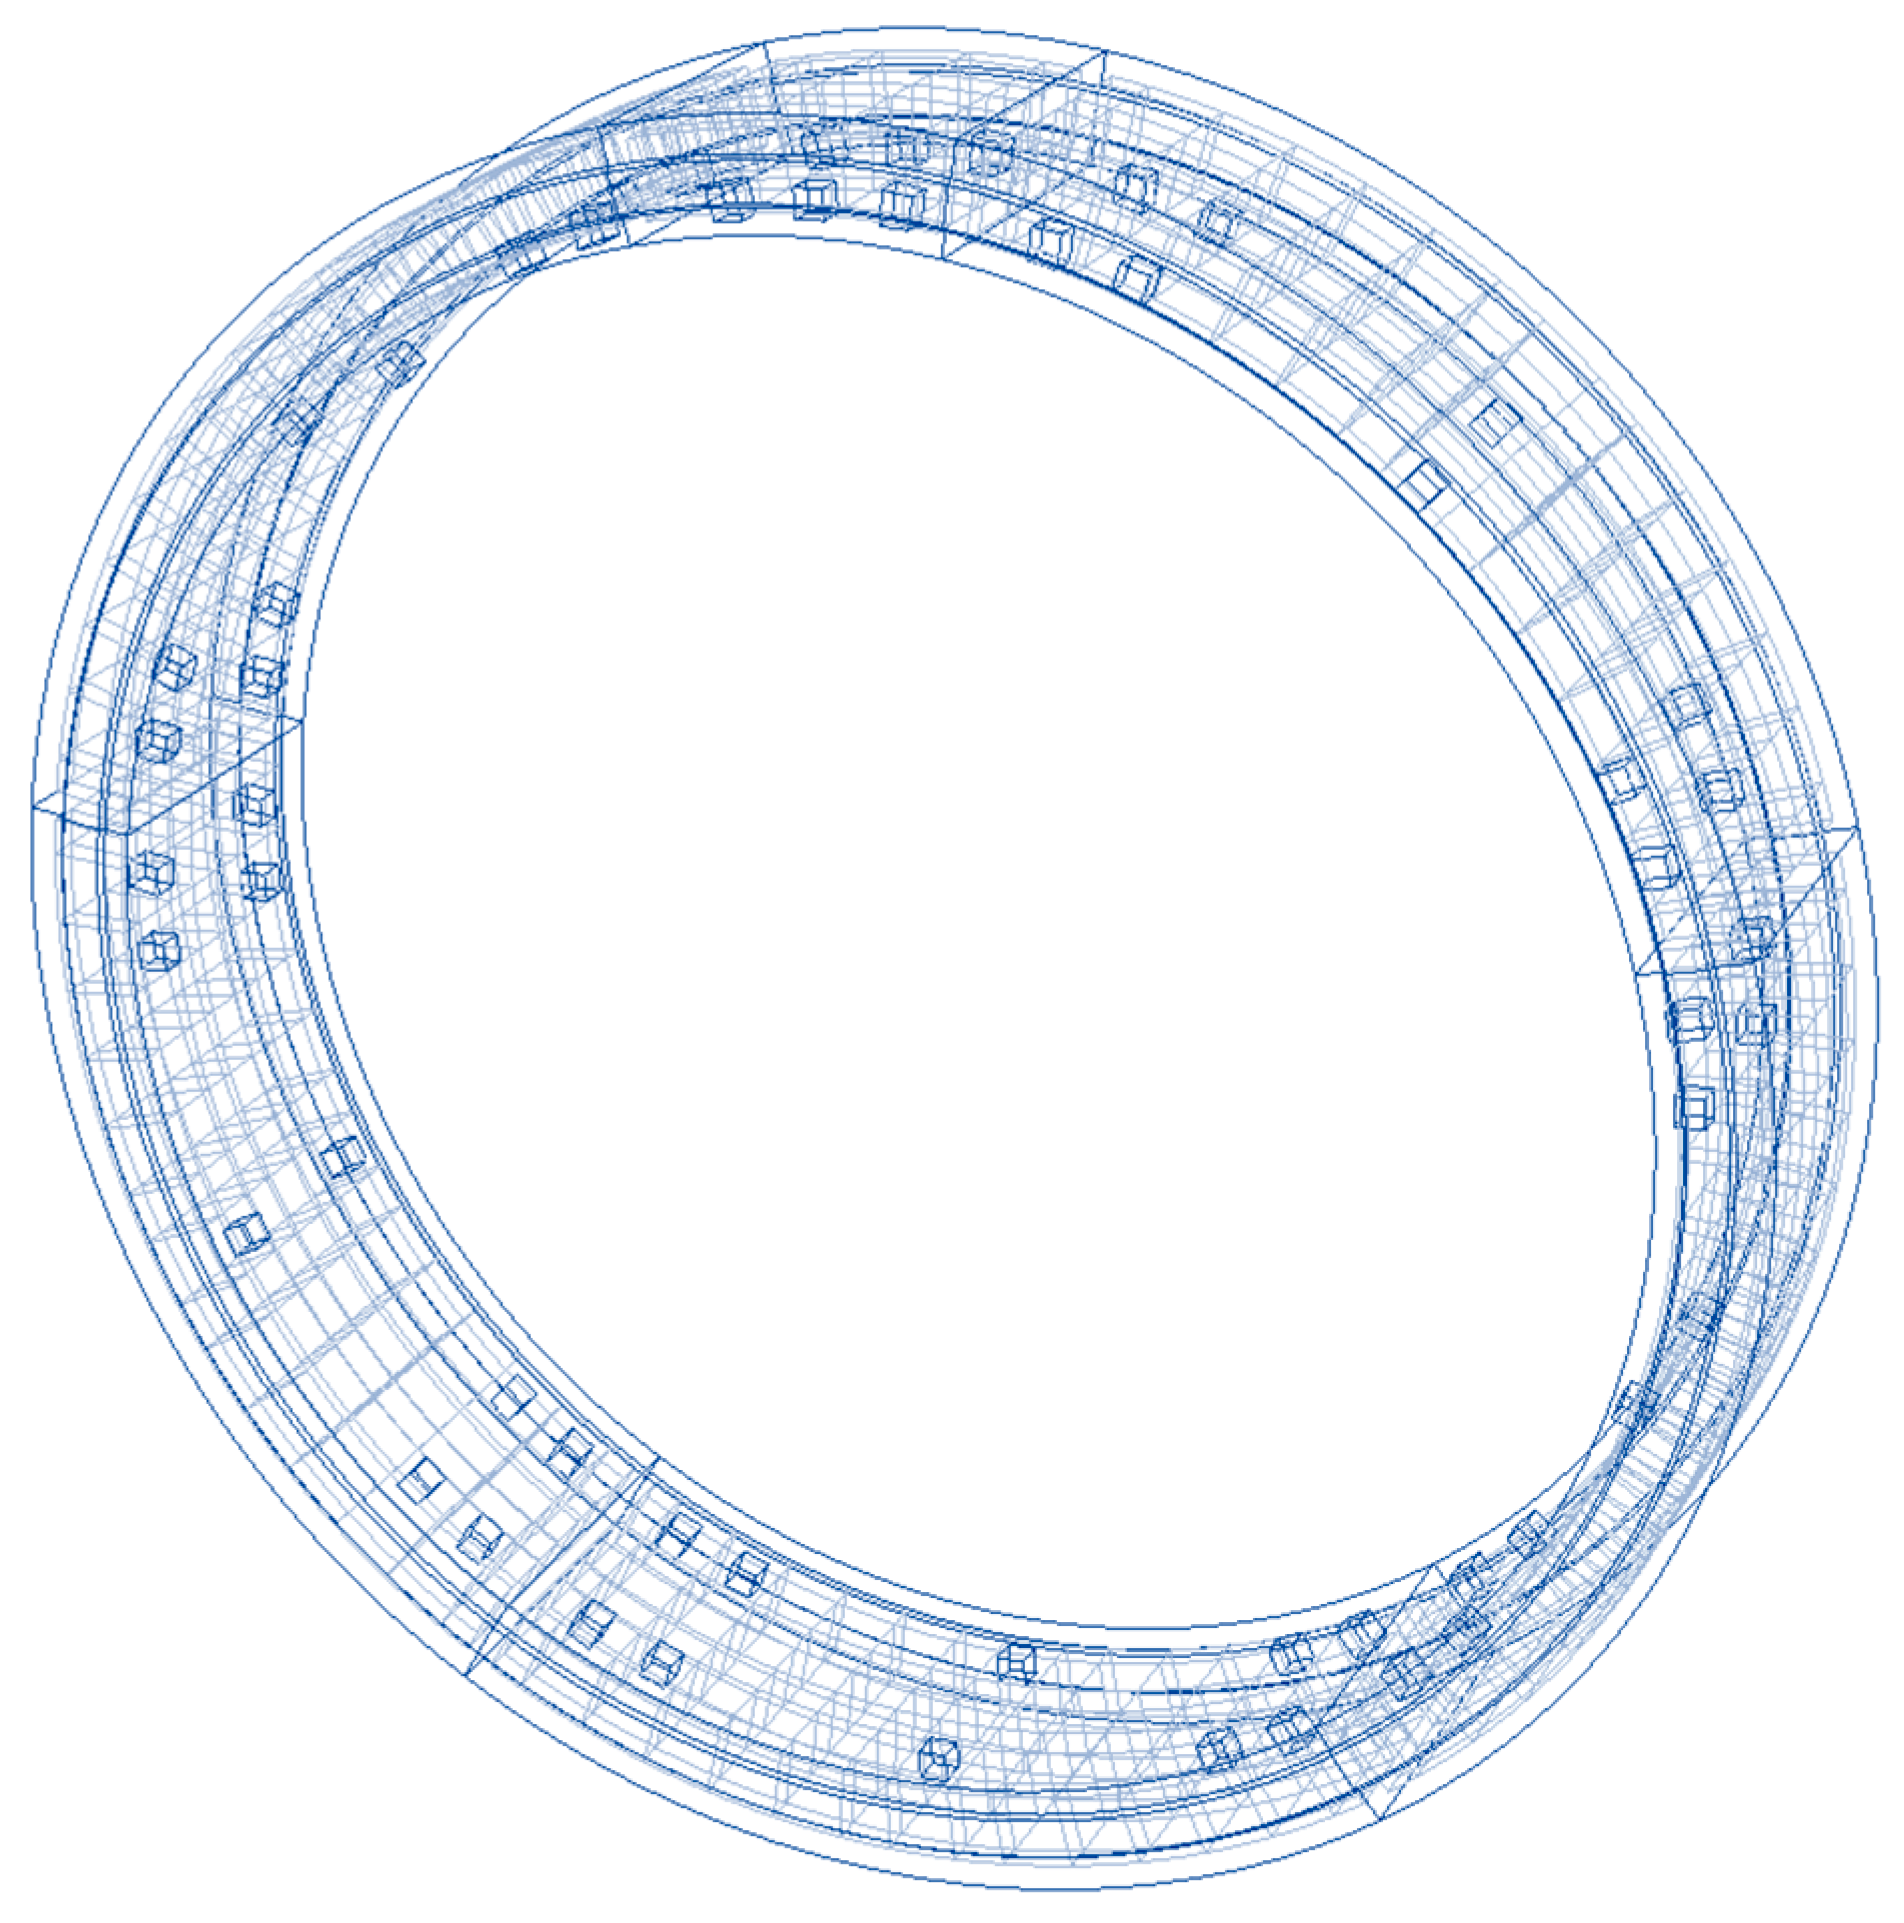
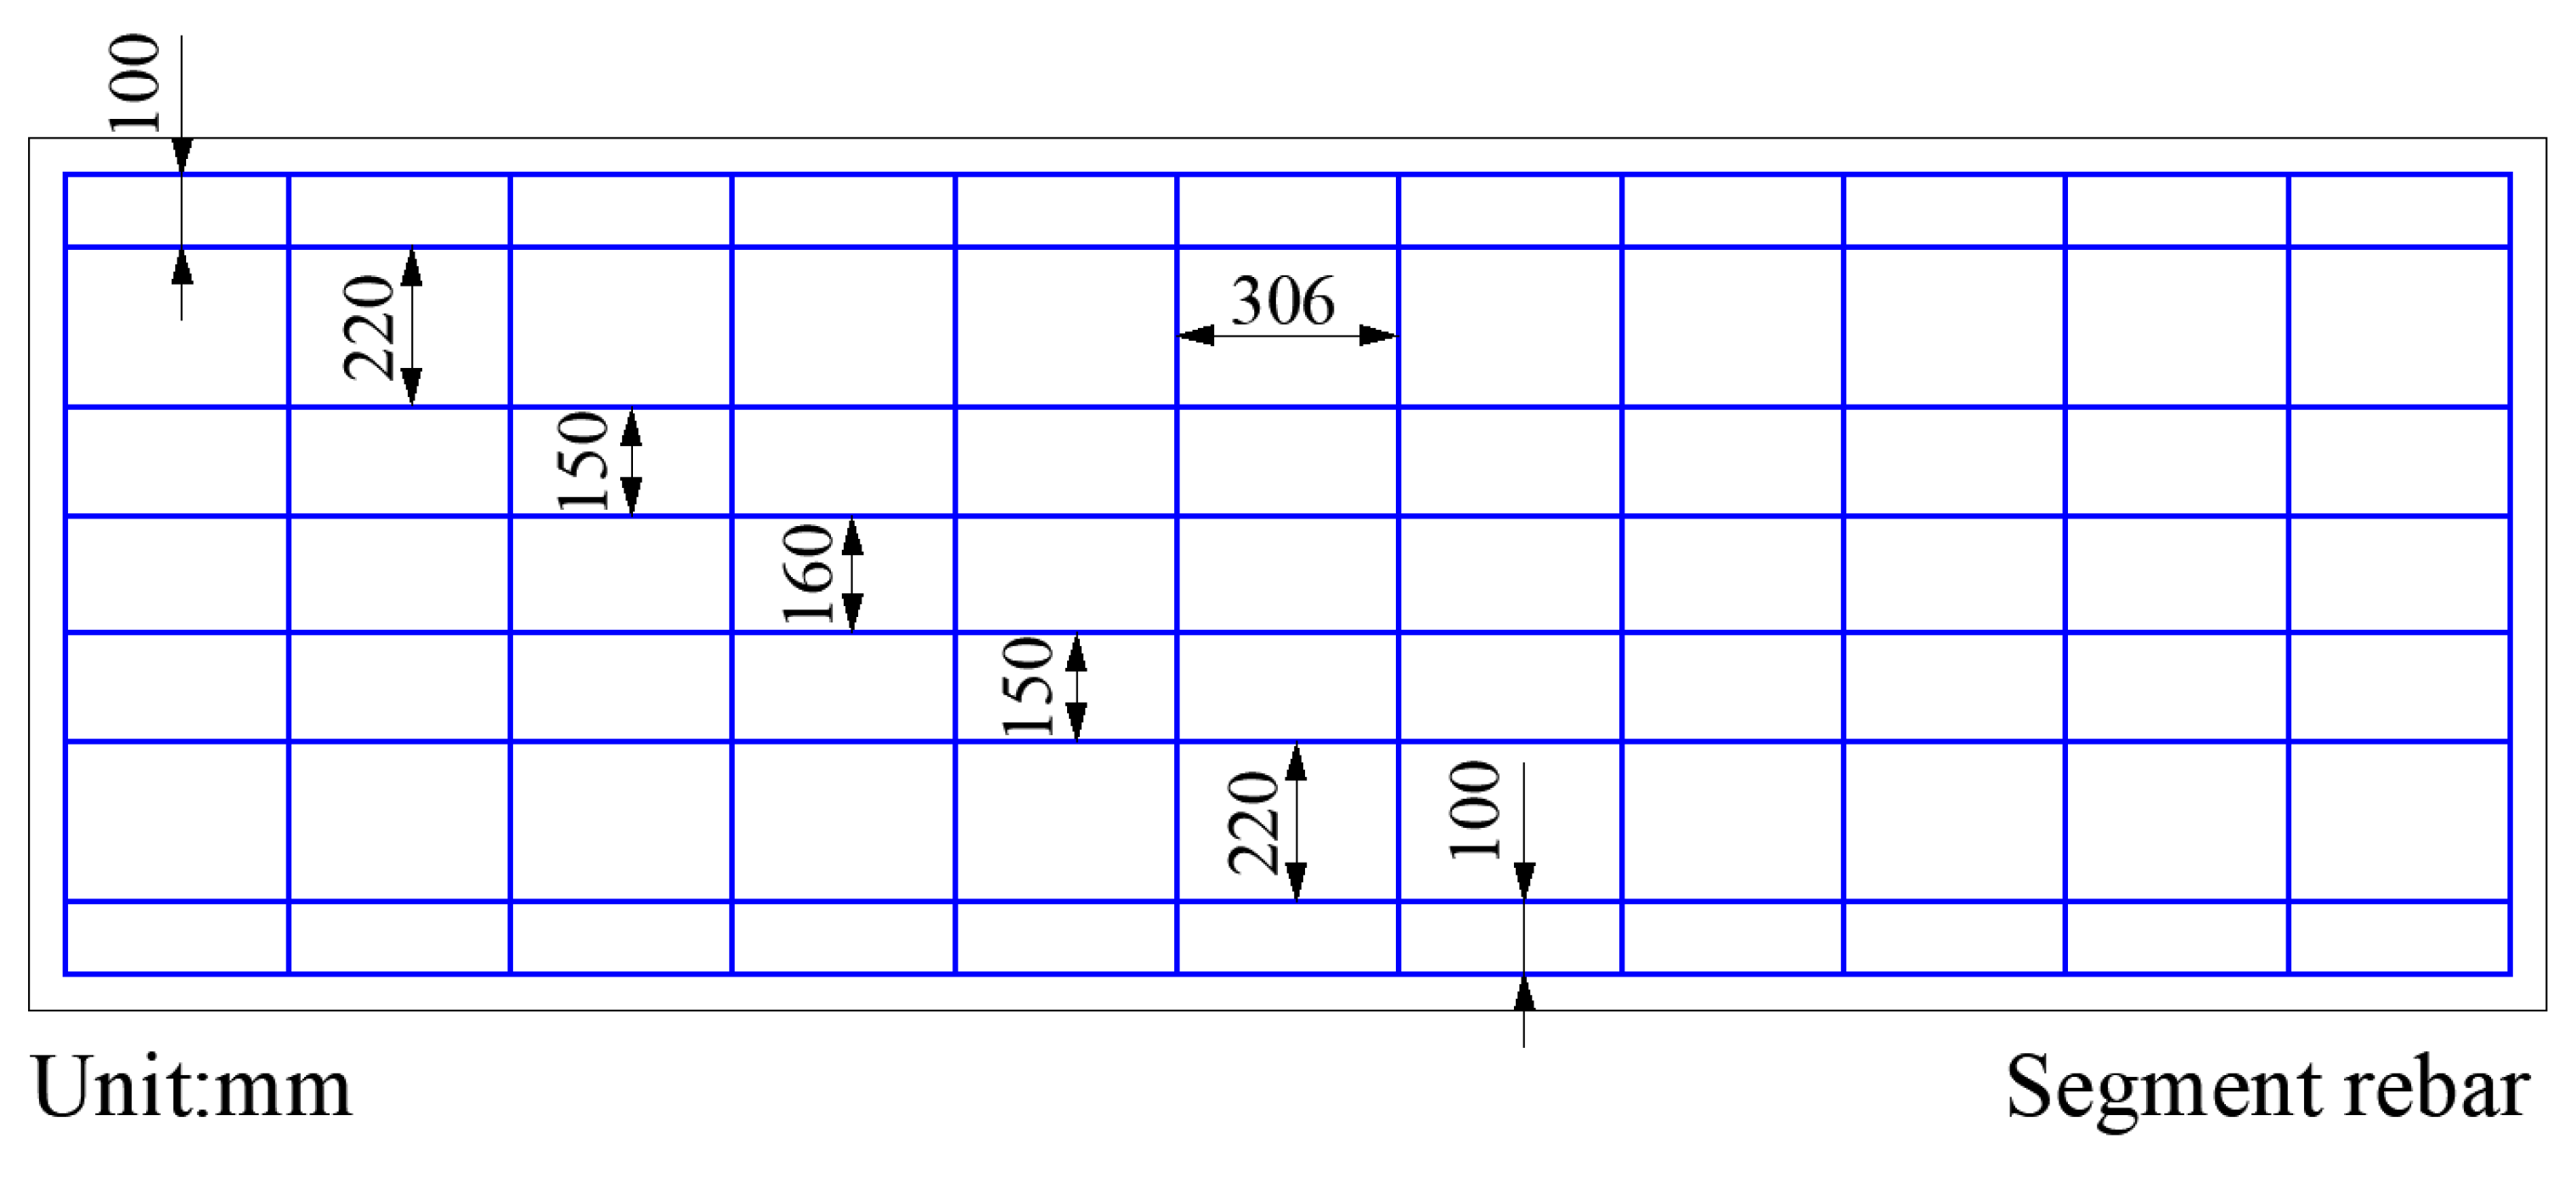
2.1. Geometry Detail of Shield Tunnel Numerical Model

The inner diameter of the shield tunnel is 5.9 m, the width of the segments is 1.2 m, and the thickness of the segment is selected as 350 mm, 375 mm, 400 mm, and 450 mm. Each ring tunnel consists of three standard blocks (B1, B2, B3), two adjacent blocks (L1 and L2), and one key block (F), as shown in Figure 1. The connector between tunnel segments is the curved bolt, and the staggered assembly method of adjacent tunnel rings is shown in Figure 2 and Figure 3. In this paper, a numerical model of three rings of the shield tunnel is established, and the details of the joint tenon groove and bolt holes are considered in the model, as shown in Figure 4. Each ring tunnel is equipped with six pairs of curved bolts in the circumferential direction, and two adjacent rings are equipped with 16 curved bolts in the longitudinal direction. In the numerical model, the curved bolts are simulated by beam elements, and the rebars inside the segments are simulated by truss elements using Abaqus 6.7–1 software, as shown in Figure 5 and Figure 6. The spacing of the rebar inside the segments is shown in Figure 7. The model adopts the embedded constraint criterion to handle the contact between the segment rebar, curved bolt and concrete segment [23]. The hexahedral element mesh generation technology is adopted in the numerical model. The Newton–Raphson method is used to solve the nonlinear calculation of the finite element model. The result shows that the convergence speed of the calculation is fast.

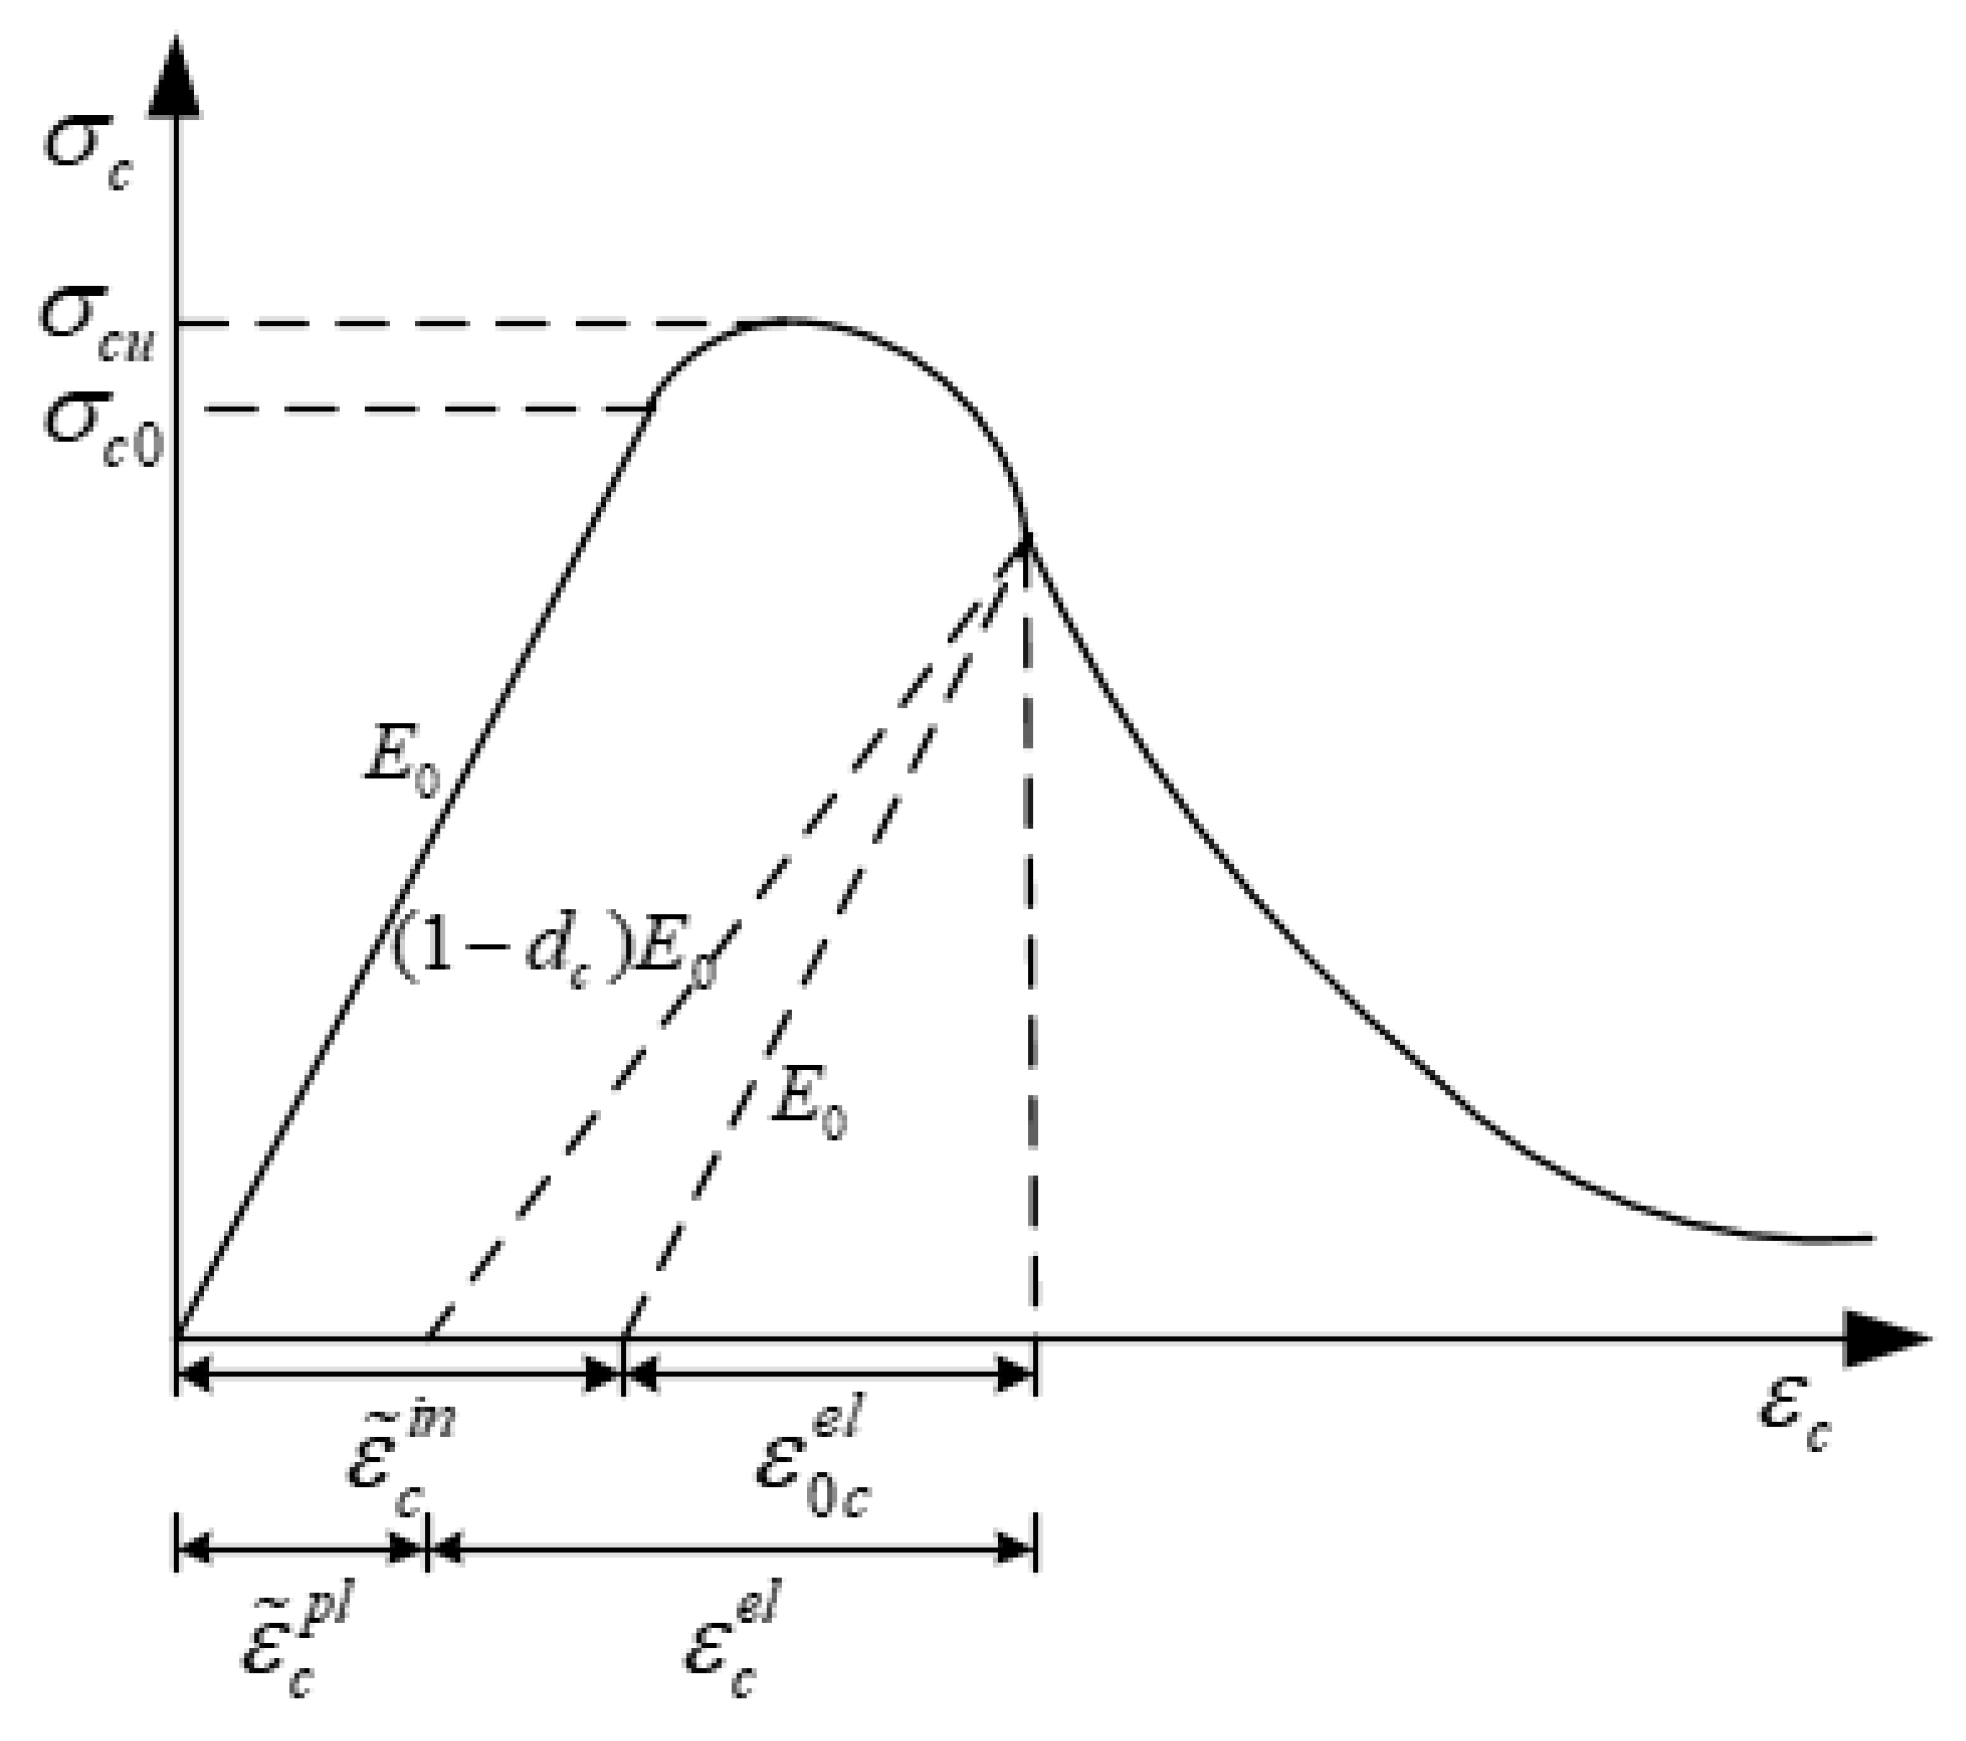
2.2. Material Properties

In the calculation model, different elastic–plastic characteristics are used to describe the mechanical behavior of segment rebar and joint bolts during loading. For the segment rebar, the elastic modulus and Poisson’s ratio are 210 GPa and 0.3, respectively. The yield strength and tensile strength of the rebar are 335 MPa and 455 MPa, respectively. For the joint bolt, the elastic modulus and Poisson’s ratio are 200 GPa and 0.3, respectively. The yield strength and tensile strength of the bolt are 400 MPa and 500 MPa, respectively.
During operation of the shield tunnel, cracks may appear on the surface of the segment due to the effect of the surrounding environment. In order to analyze the load-bearing performance of the shield tunnel under unloading conditions more accurately, the elastic–plastic damage constitutive model is used to calculate the cracking of the segment concrete [24,25]. The principle is that the material remains in the elastic stage until the ultimate compressive or tensile stress of the concrete is reached. When the stresses exceed the threshold, the material begins to yield and enter the plastic stage. To describe the damage-softening characteristic of the concrete material, compression damage factor dc and tensile damage factor dt are introduced. The greater the damage factor, the more severe the material damage, as shown in Figure 8 and Figure 9.
When the segment concrete is damaged, the stiffness of the concrete will decrease. The compressive stress σ c and tensile stress σ t can be describe as follows:
σ c = ( 1 d c ) E 0 ( ε c ε c p l )
σ t = ( 1 d t ) E 0 ( ε t ε t p l )
ε c p l = ε c i n d c ( 1 d c ) σ c E 0
ε t p l = ε t c k d t ( 1 d t ) σ t E 0
where σ c is the compressive stress; σ t is the tensile stress; ε c p l is the equivalent plastic compressive strain; ε t p l is the equivalent plastic tensile strain; ε c i n is the compressive inelastic strain; ε t c k is the tensile cracking strain; and E 0 is the initial elastic modulus.
The definition σ c ε c i n , σ t ε t c k is adopted to describe the characteristic of the strain softening after the cracking of concrete, and d c ε c i n , d t ε t c k is adopted to describe the stiffness degradation characteristics of concrete caused by damage. The calculation expressions of ε c i n , ε t c k are as follows:
ε c i n = ε c ε 0 c e l = ε c p l + d c ( 1 d c ) σ c E 0
ε t c k = ε t ε 0 t e l = ε t p l + d t ( 1 d t ) σ t E 0
ε 0 c e l = σ c / E 0
ε 0 t e l = σ t / E 0
where ε 0 c e l is the elastic recovery strain under compression, and ε 0 t e l is the elastic recovery strain under tension.
The concrete damage plasticity model assumes a non-associated potential plastic flow in order to control the inelastic volume deformation. The flow potential G used for this model is the Drucker–Prager hyperbolic function:
G = ( κ σ 0 tan ψ ) 2 + q ¯ p ¯ tan ψ
where κ is the flow potential eccentricity; σ0 is the uniaxial stress at failure; ψ is the dilation angle measured in the p ¯ q ¯ plane at a high confining pressure; p ¯ is the average hydrostatic pressure; and q ¯ is the average equivalent effective stress.
The relevant numerical calculation parameters are shown in Table 1. The uniaxial stress–strain relationship and corresponding damage parameters converted by the calculation formula above are shown in Table 2.

2.3. Load and Boundary Conditions

Taking the strata of China Shaoxing urban rail transit as the research background, the soil layer types are shown in Figure 10. In this paper, the burial depth of the shield tunnel is selected as 10 m, 15 m, and 20 m, and the external load is calculated by the water and soil balance method [26,27]. The external load mode is shown in Figure 11. Table 3 shows the external loads in the model, where P1 is the overlying pressure of the tunnel, P2 is the resistance at the bottom of the tunnel, and P3 and P4 are both the lateral pressure on the tunnel. As the tunnel is located in the muddy soil layer, the strata resistance when deformation of the tunnel occurs is ignored.
The numerical model established in this study consists of 129,174 hexahedral elements. The constraint boundary of the numerical model is shown in Figure 12 and Figure 13. As shown in Figure 14, due to the effect of surrounding excavation of the foundation pit, the lateral pressure on the shield tunnel will decrease. In the numerical model, the P1, P2, P3, and P4 loads are, respectively, applied to the outer surface of the tunnel segment by surface loads, and the unloading conditions are simulated by reducing the magnitude of the P2 load. In the calculation model, the ratio of lateral pressure to vertical pressure on the tunnel can be set as the load ratio. By reducing the load ratio, the bearing performance of the shield tunnel under excavation unloading is studied. The load value corresponding to different load ratios when the buried depth is 15 m is shown in Table 4.

3. Analysis of Bearing Capacity of Shield Tunnels with Different Segment Thickness

3.1. Structural Convergence Deformation under Normal Design Loading

Figure 15 shows the convergence deformation of the shield tunnel with different segment thicknesses. It can be observed that as the burial depth increases, the deformation of the tunnel with different segment thickness increases to varying degrees. The convergence deformation of the tunnel with 350 mm segment thickness increases nonlinearly with the burial depth, while the tunnel with other thickness segment thickness increases linearly. When the burial depth increased from 10 to 20 m, the tunnel horizontal deformations with 350 mm and 375 mm segment thickness increase by 3.8 and 2.4 times, respectively, while the tunnel horizontal deformations with 400 mm and 425 mm segment thickness both increase by 2.2 times. Figure 16 shows the normalized graph of tunnel convergent deformation under different buried depths. Under the shallow burial condition, when the segment thickness increases by 25 mm, 50 mm and 75 mm, the horizontal deformation decreases by 18.0%, 20.0%, and 4.4%, respectively. Under the deep burial conditions, the horizontal deformation decreases by 42.8%, 16.7%, and 2.5%. Therefore, increasing the thickness of the segment from 350 to 400 mm can significantly reduce the convergence deformation of the tunnel structure. However, if the thickness of the segment continues to increase, the reduction in tunnel structural deformation is not significant.

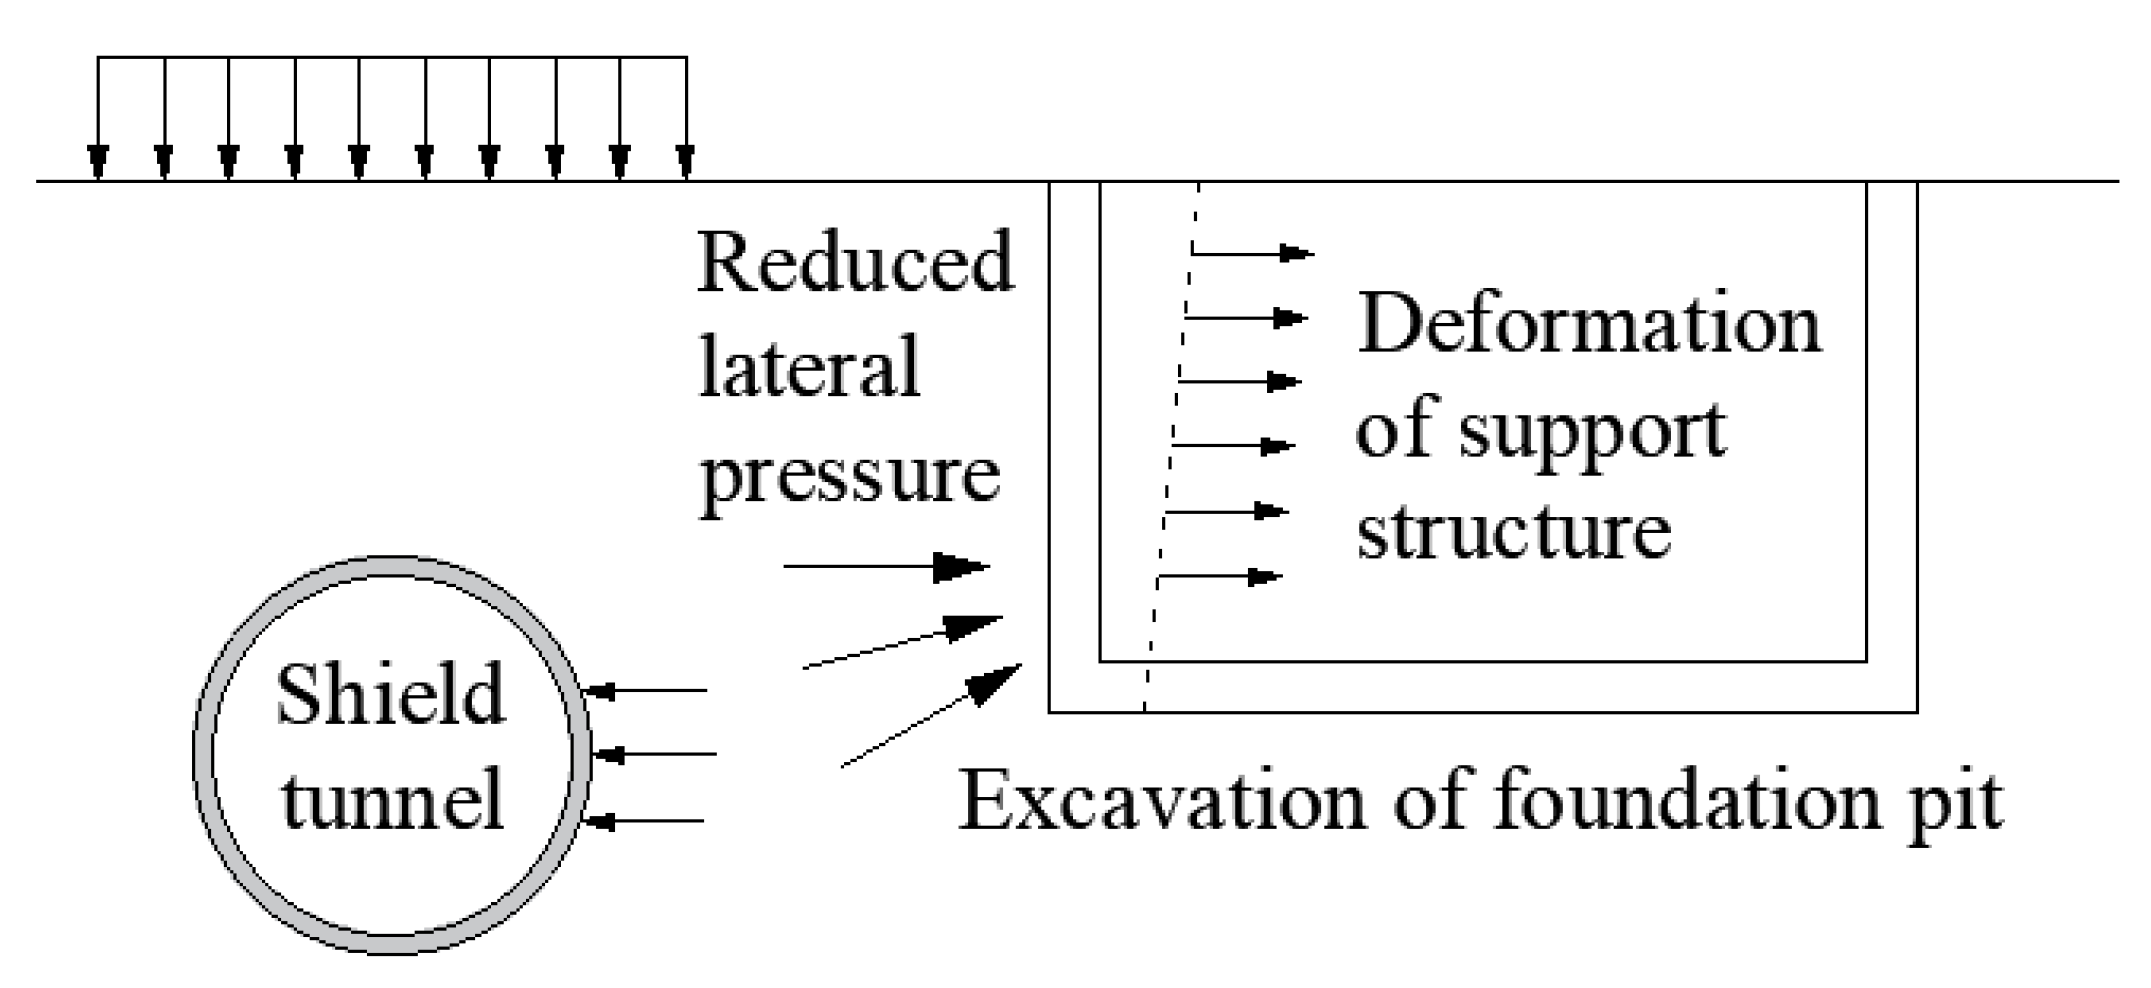
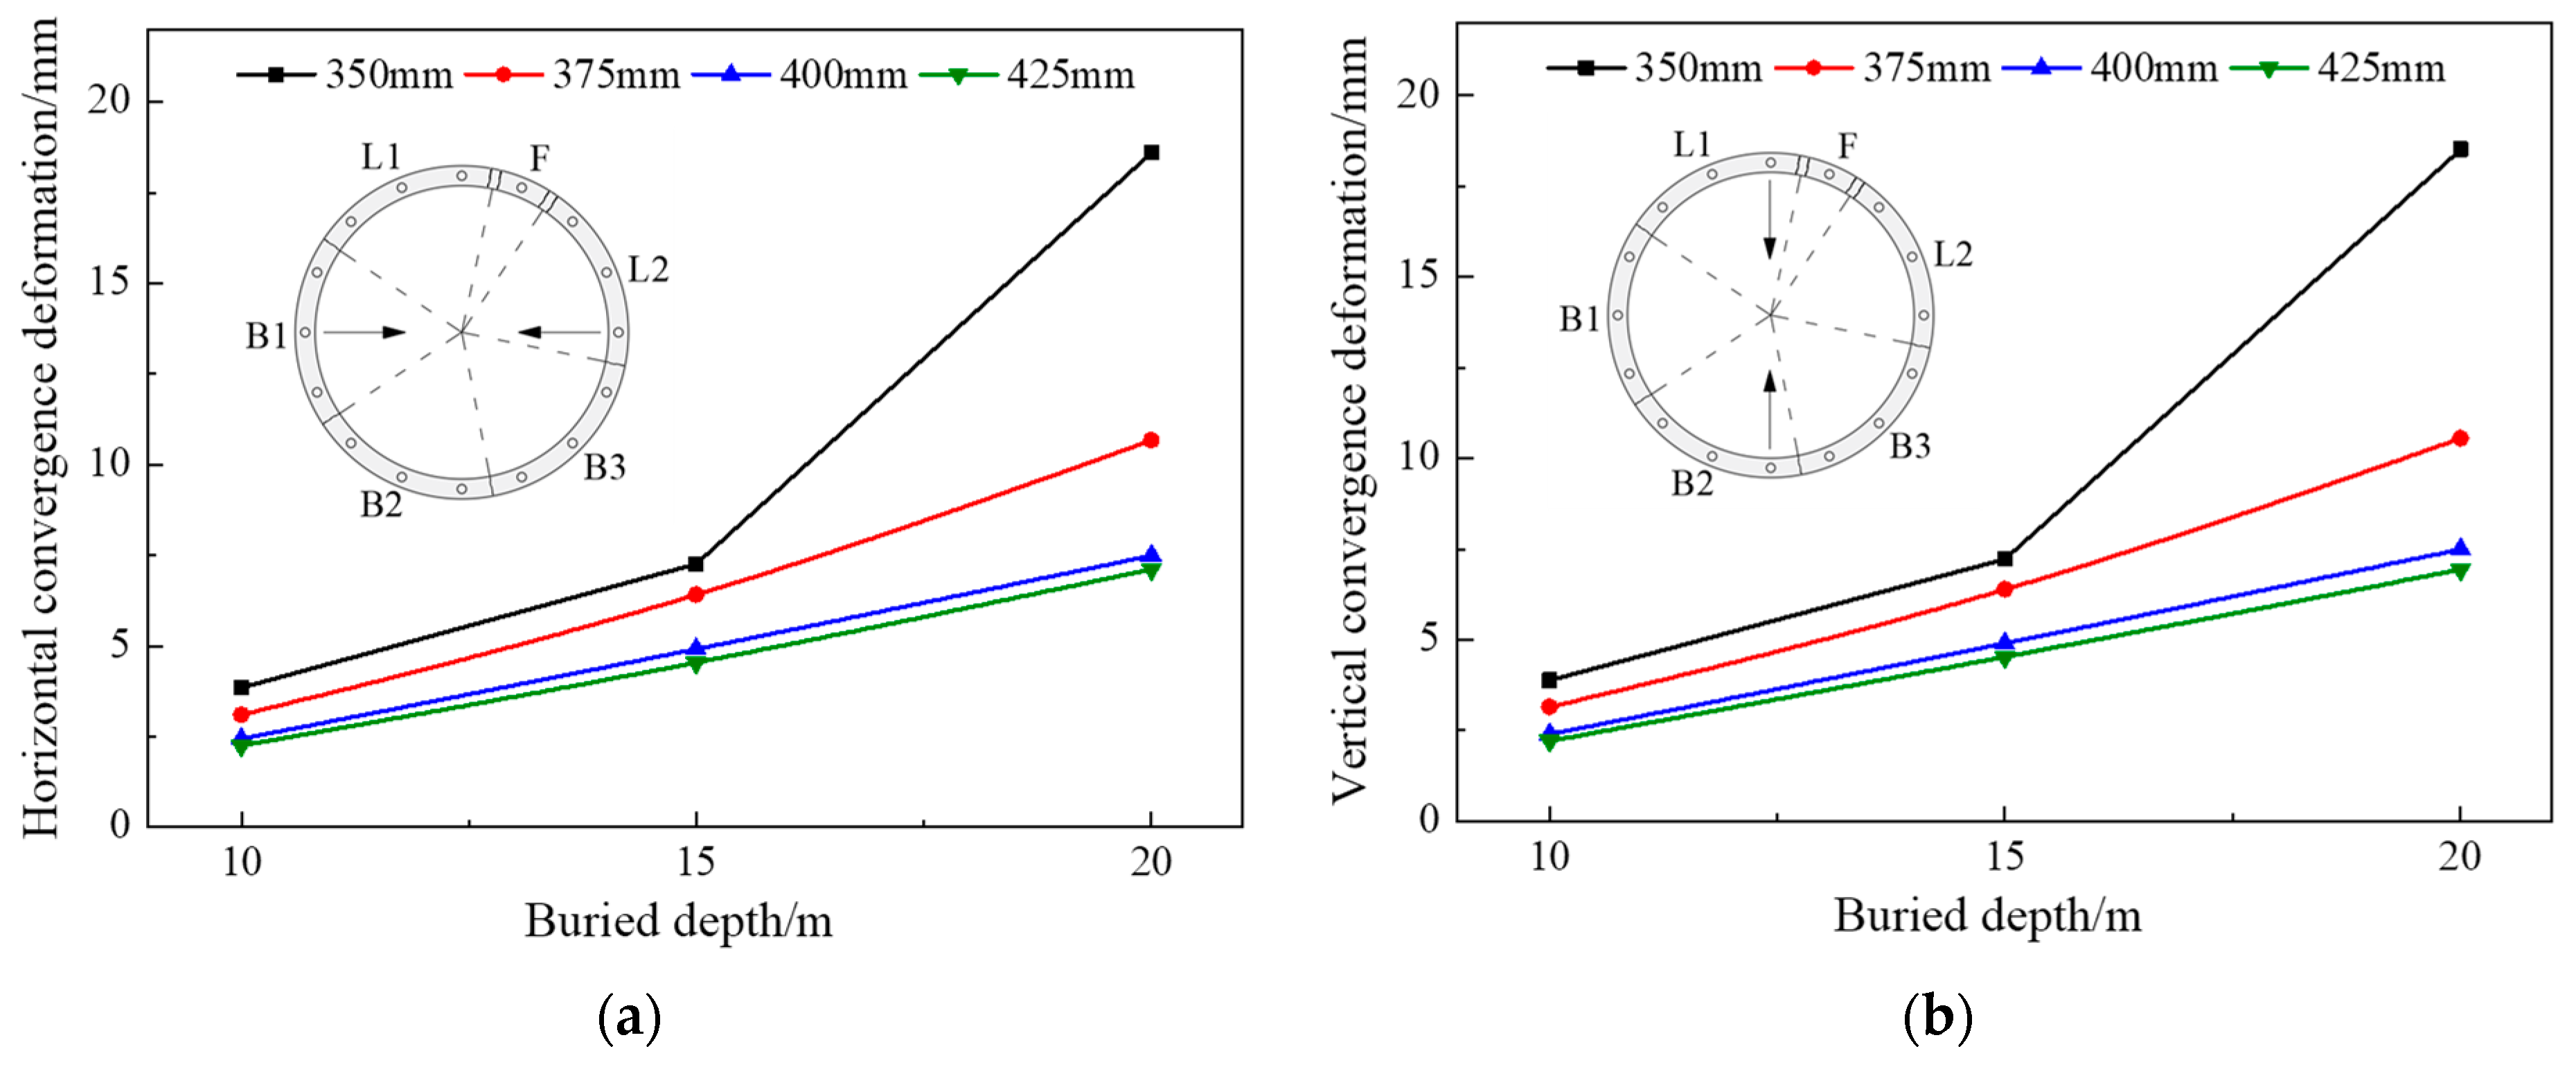
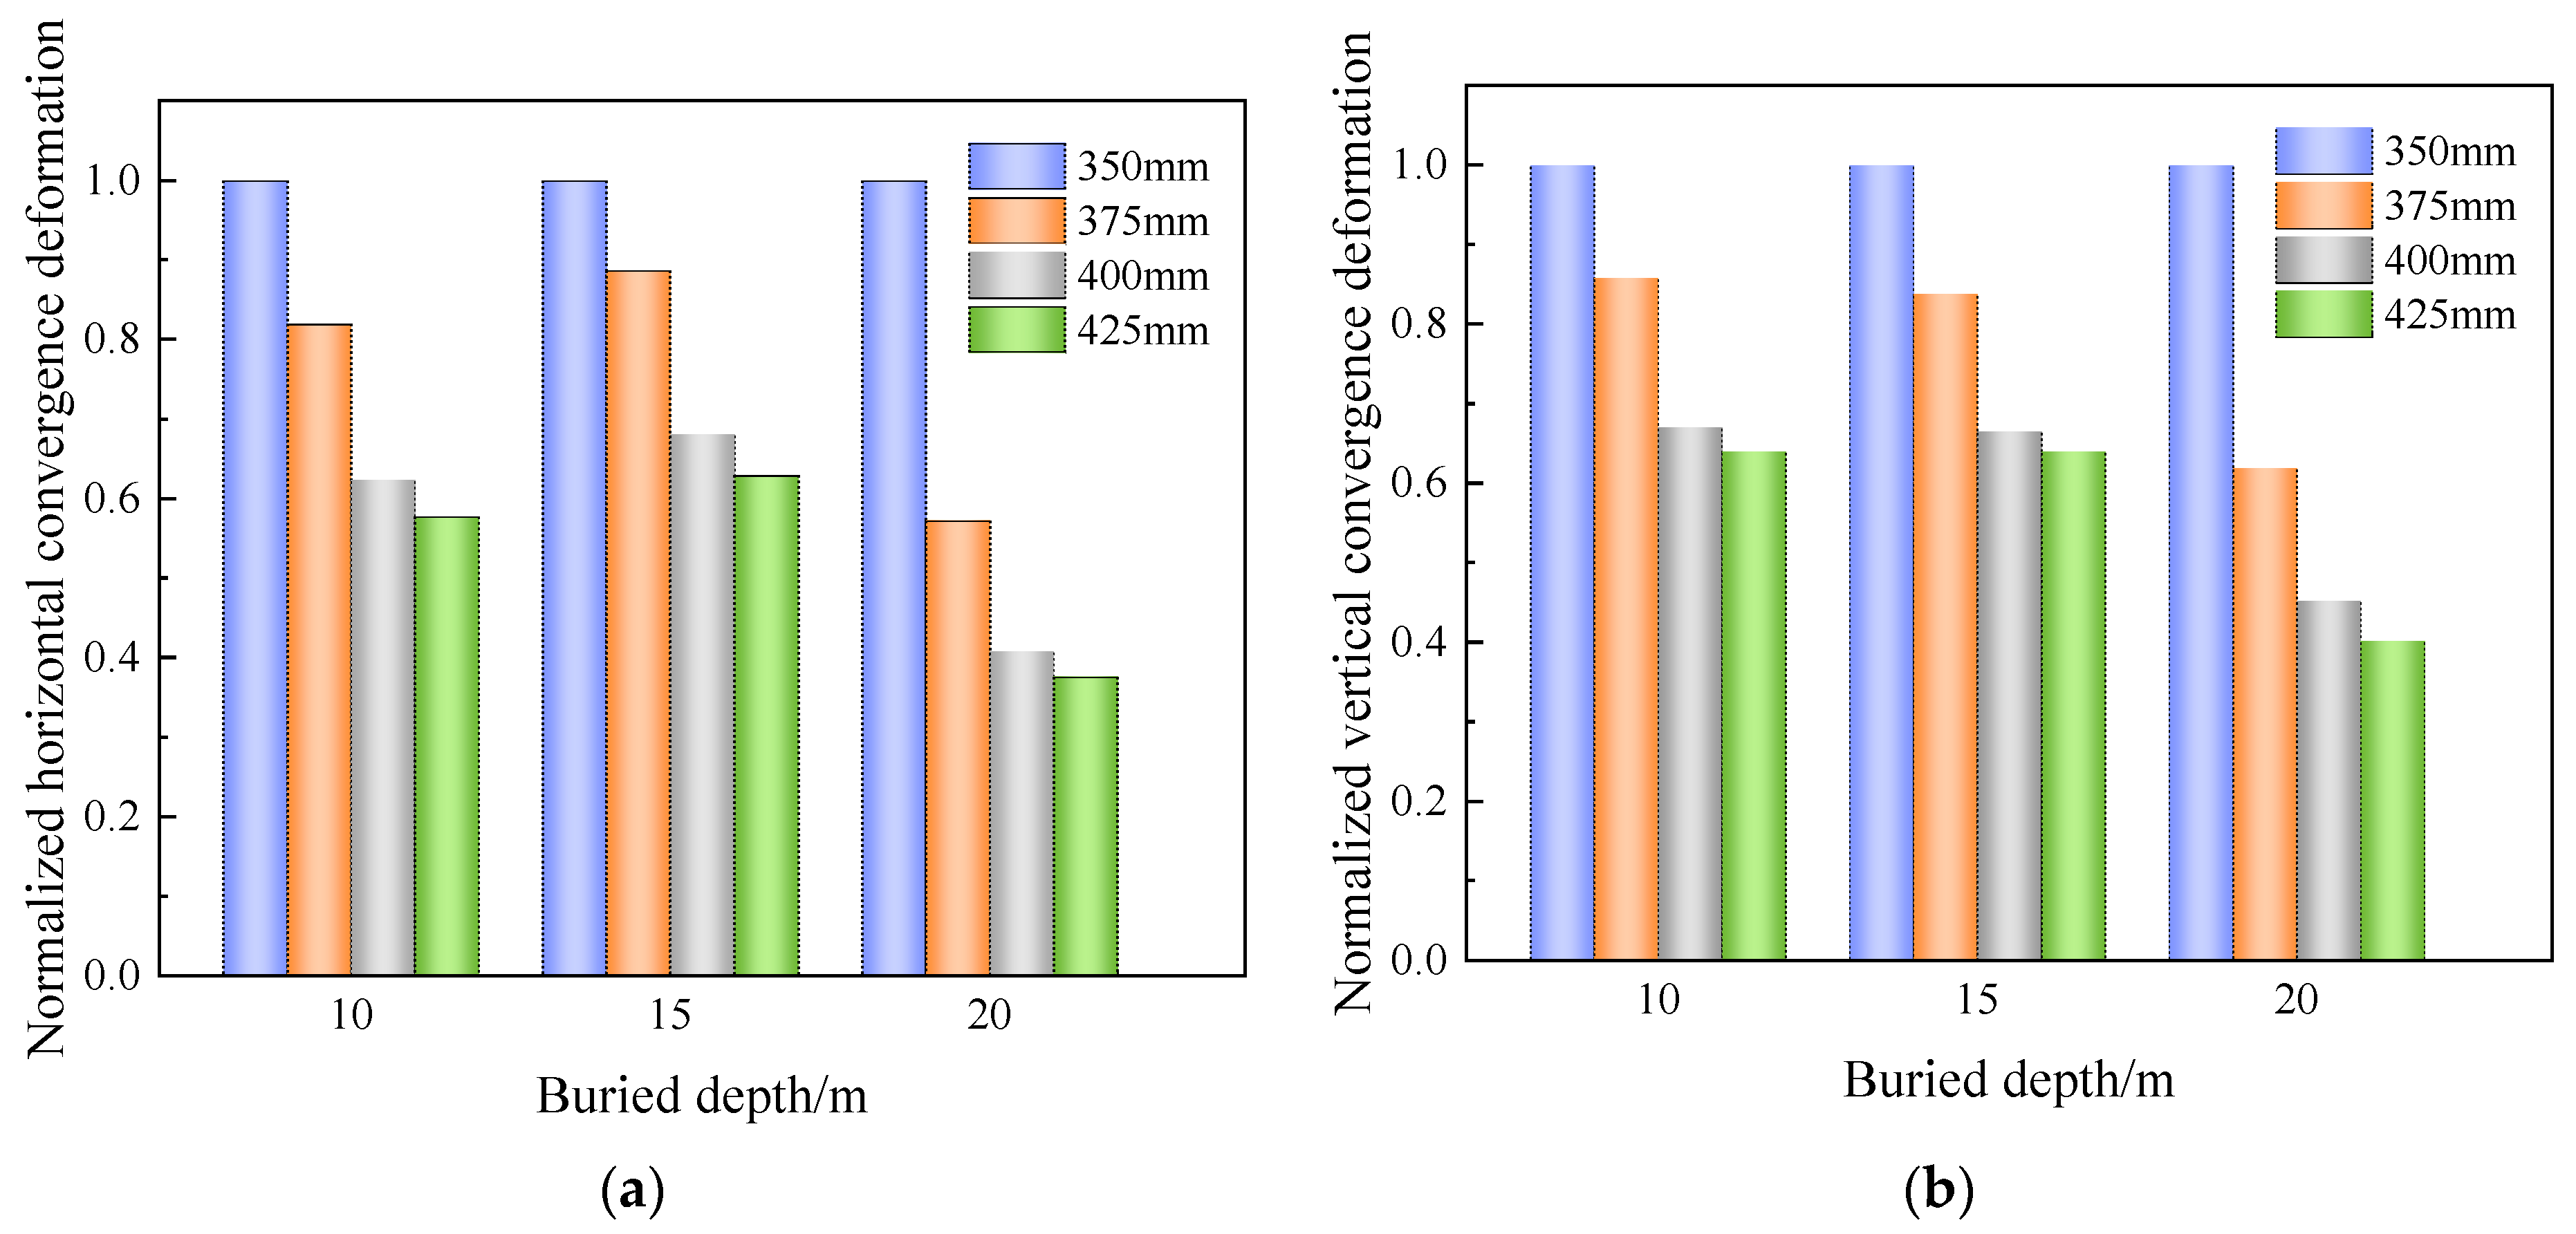
3.2. Structural Convergence Deformation under Excavation Unloading

Figure 17 shows the shield tunnel convergence deformation with different segment thicknesses under different load ratios. As the load ratio decreases, the structural deformation increases linearly in the early stage and nonlinearly in the later stage. When the thickness increases from 350 to 400 mm, the tunnel deformation decreases significantly. However, when the segment thickness continues to increase, the convergence deformation of the structure changes in a low level. Figure 18 shows the normalized graph of tunnel convergence deformation under different load ratios. When the load ratio is between 0.7 and 0.75, the horizontal convergence deformations of the tunnel with segment thickness of 375 mm and 400 mm decrease by about 19% and 39% compared to 350 mm, respectively. When the load ratio is between 0.7 and 0.66, the horizontal convergence deformations of the tunnel with segment thickness of 375 mm and 400 mm decrease by about 20%~50% and 39%~64% compared to 350 mm, respectively. The result shows that the increase in the segment thickness to a certain degree can improve the structural stiffness and deformation resistance of the shield tunnel. Therefore, 400 mm is recommended as the optimized segment thickness for a shield tunnel with a large inner diameter of 5.9 m.

4. Shield Tunnel Load-Bearing Performance Analysis by Full-Scale Test

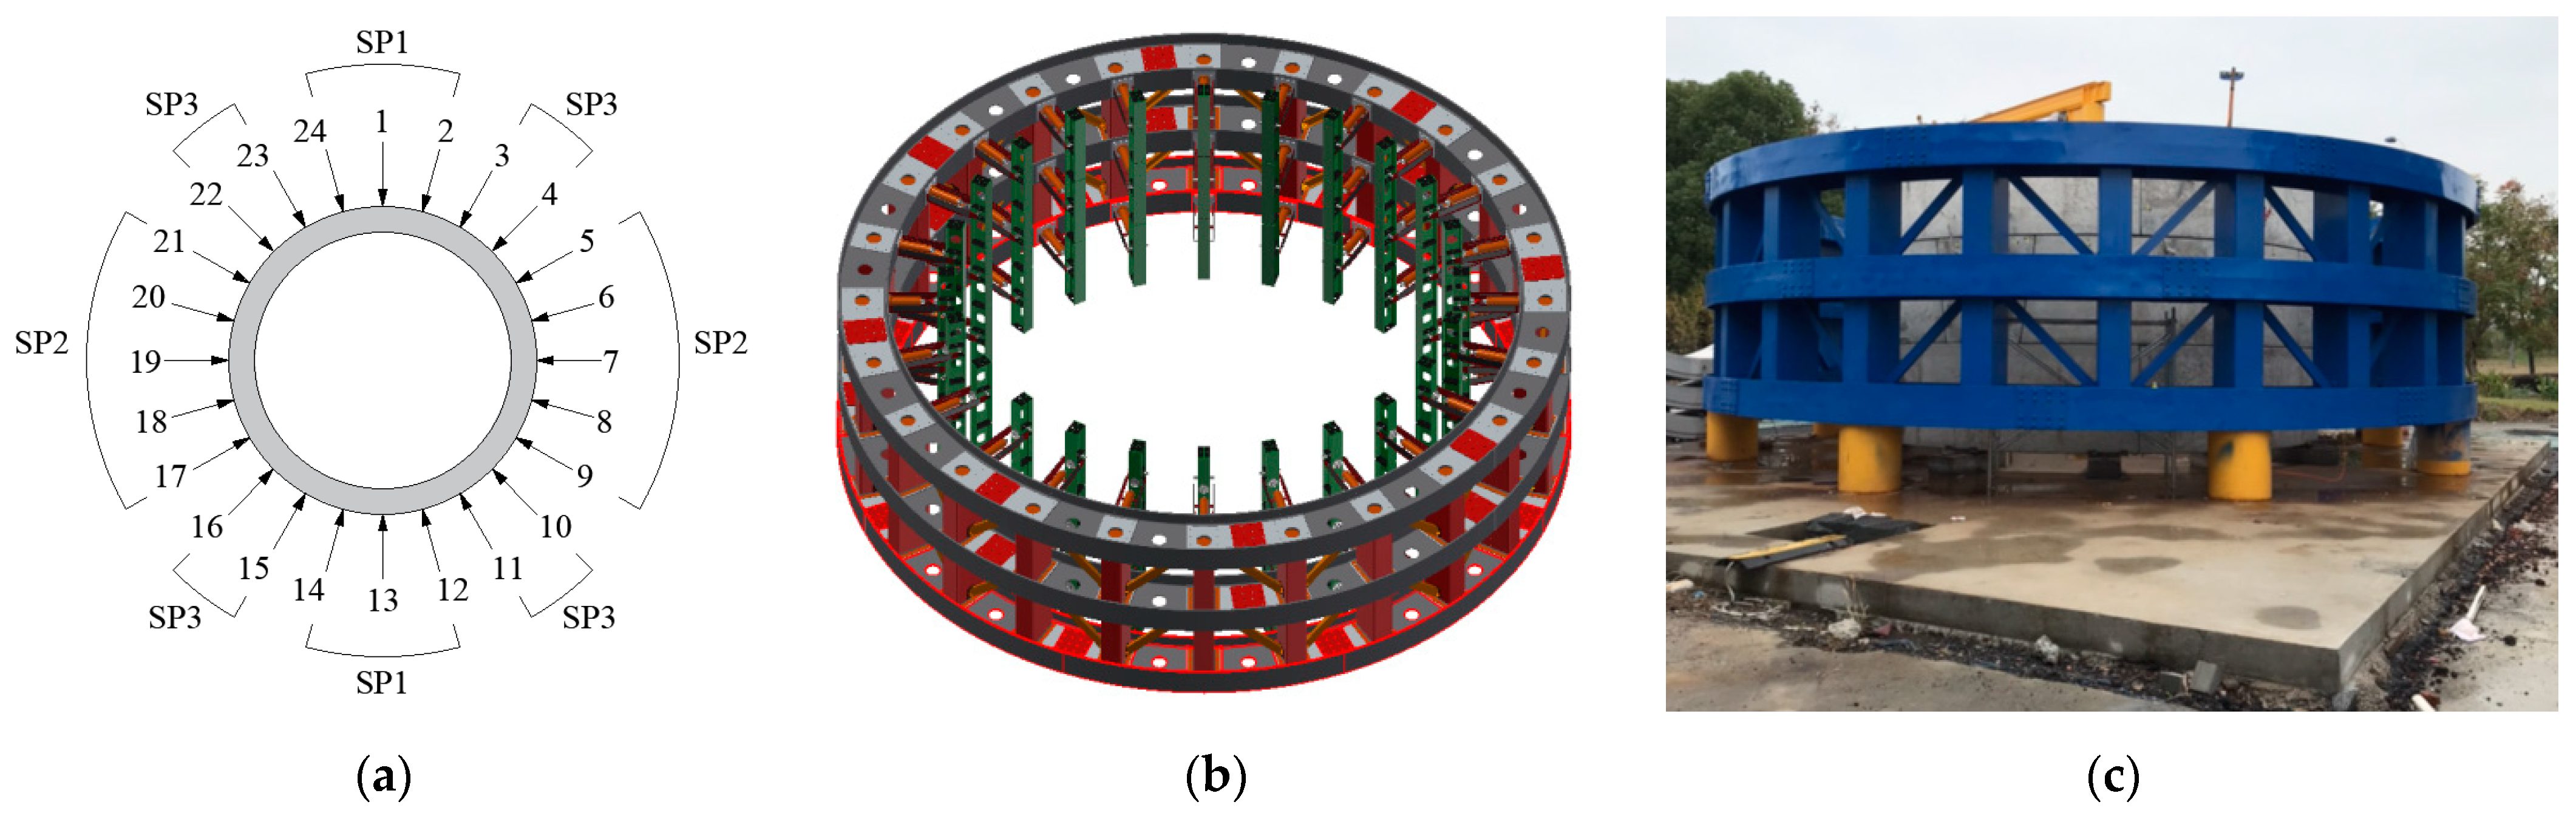
4.1. Loading Scheme of Test

Considering the operability of the full-scale test, three rings of the shield tunnel are selected as the research object. The external loads applied on the shield tunnel are zoned for design, and 24 loading points are arranged to simulate the soil pressure and the ground surface loading on the shield tunnel, as shown in Figure 19. In the test, 24 loading points are symmetrically divided into three groups: SP1 is the vertical soil pressure at the top of the tunnel and the foundation reaction at the bottom of the tunnel; SP2 is the lateral pressure on the shield tunnel; and SP3 is the transitional pressure. SP2 is calculated by the vertical pressure SP1 and the lateral pressure coefficient λ. It should be noted that the lateral pressure coefficient λ represents the ratio of horizontal pressure to vertical pressure and is set as 0.7 in the test. SP3 is calculated by taking half of the sum of SP1 and SP2. The soil layer around the tunnel is shown in Figure 10. Therefore, the loads in the test for the tunnel buried depth of 20 m are as follows: SP1 = 356 kN, SP2 = 249 kN, and SP3 = 303 kN.
To simulate the longitudinal constraint effect between the tunnel rings during operation, six uniformly distributed vertical loading points are installed in the test, and the vertical force of each loading point is 25 t. The vertical loading device includes a vertical jack, tensioning threaded rod and loading beam, as shown in Figure 20.
The loading process of the test involves the following steps: firstly, applying vertical loading force F1~F6; then gradually loading P1 from zero to the design load while keeping P2 = 0.7 × P1 and P3 = (P1 + P2) simultaneously; finally, gradually unloading P2 to the tunnel failure state while keeping P1 unchanged and P3 = (P1 + P2).

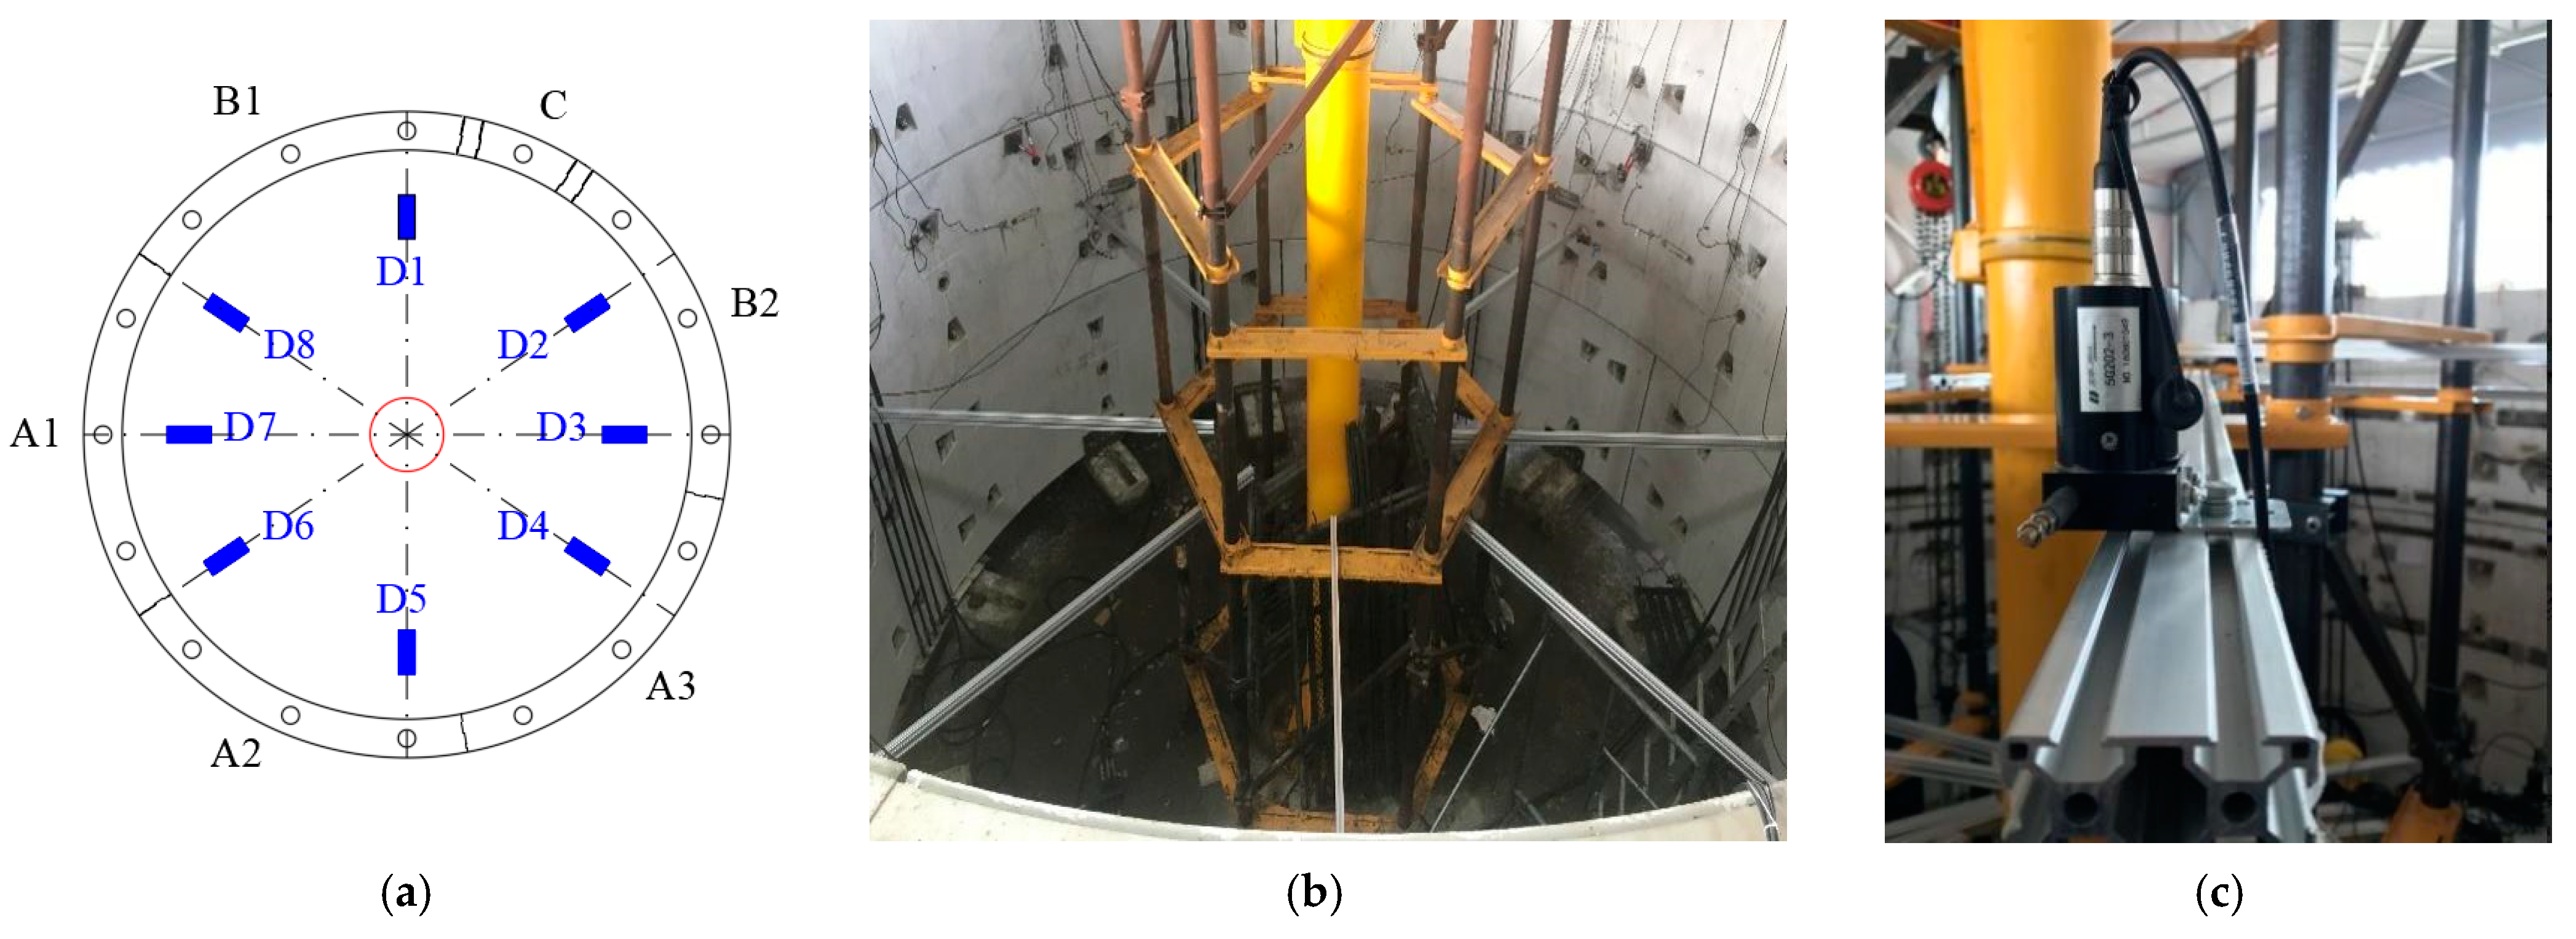
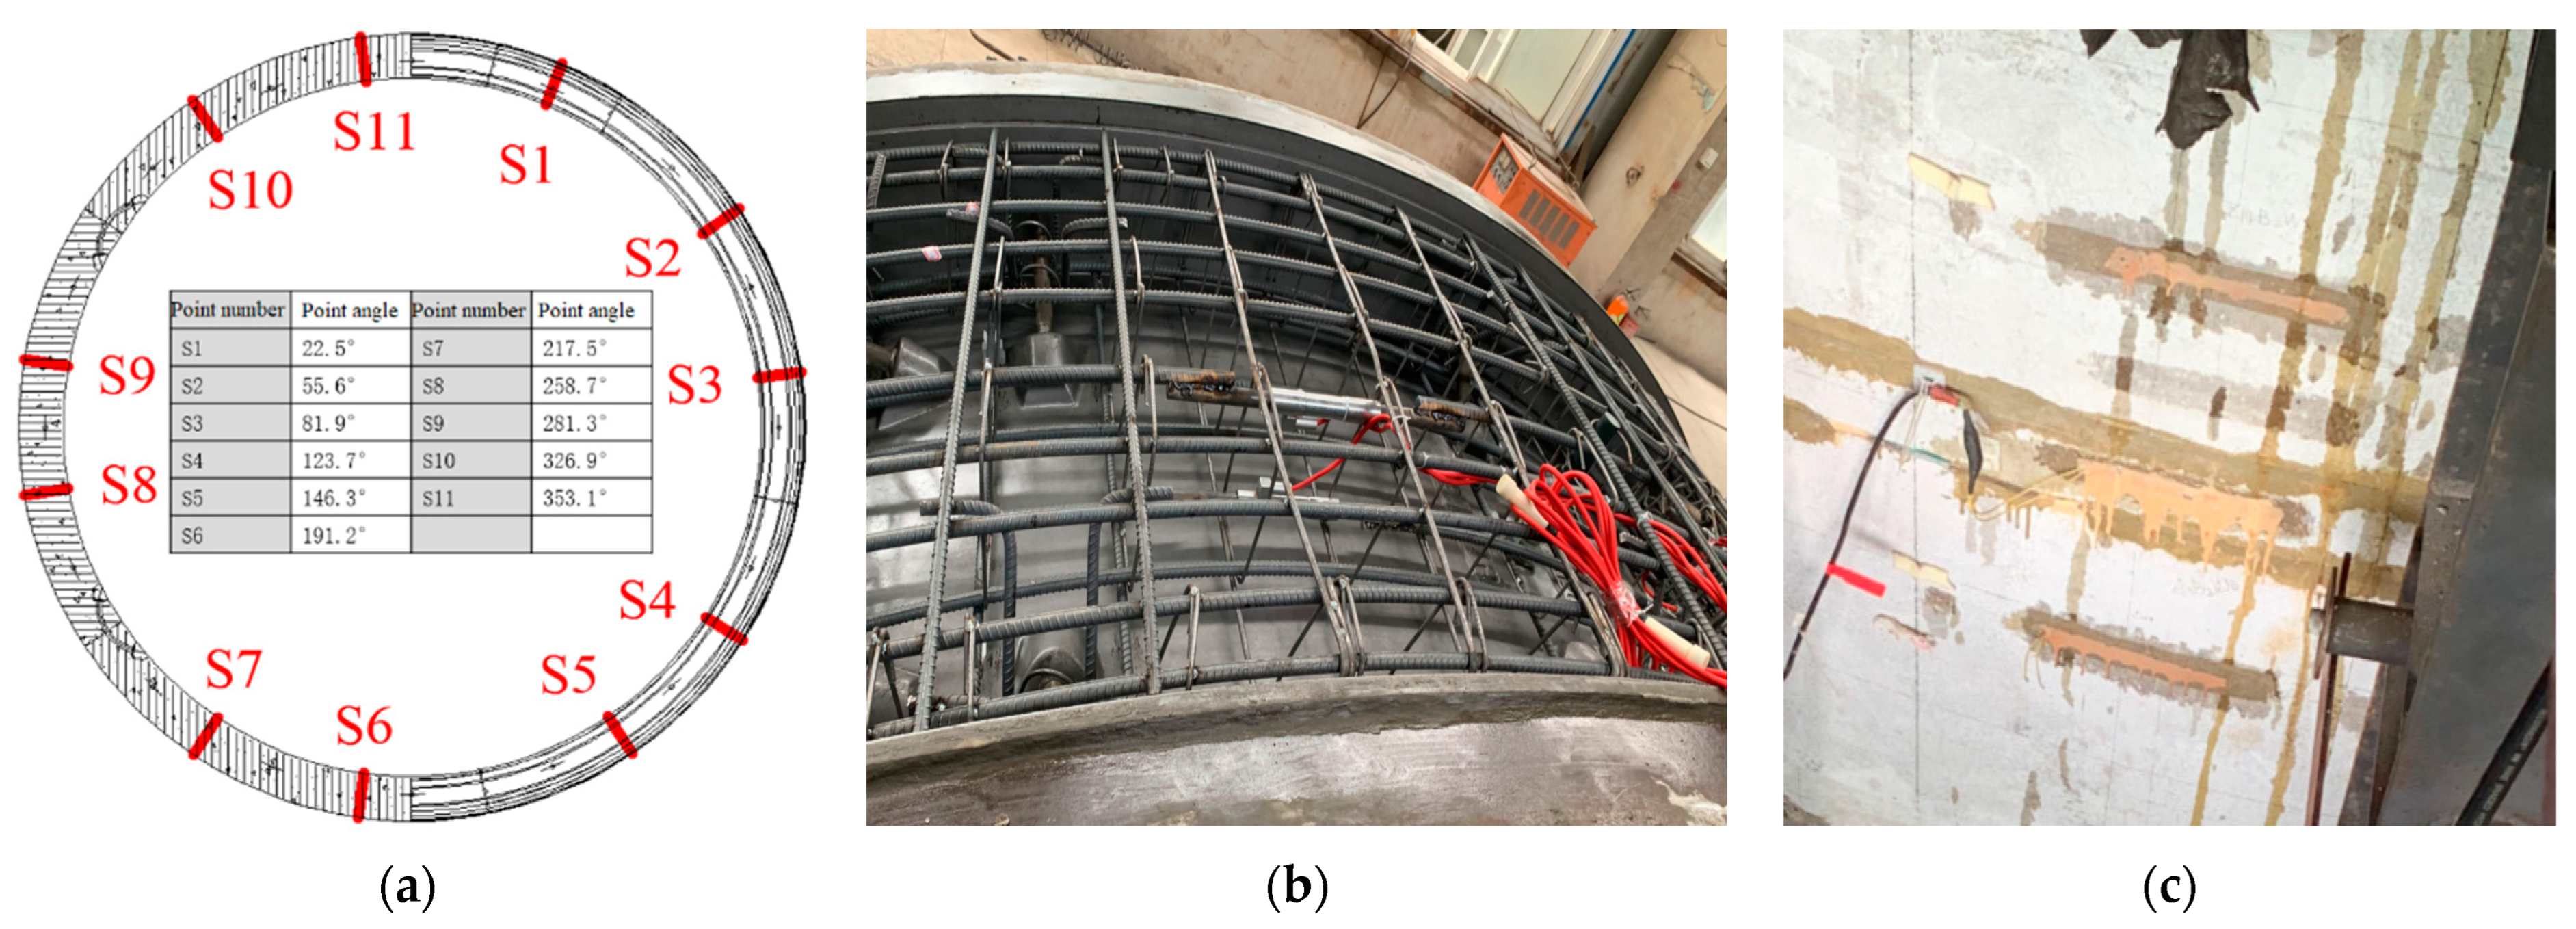
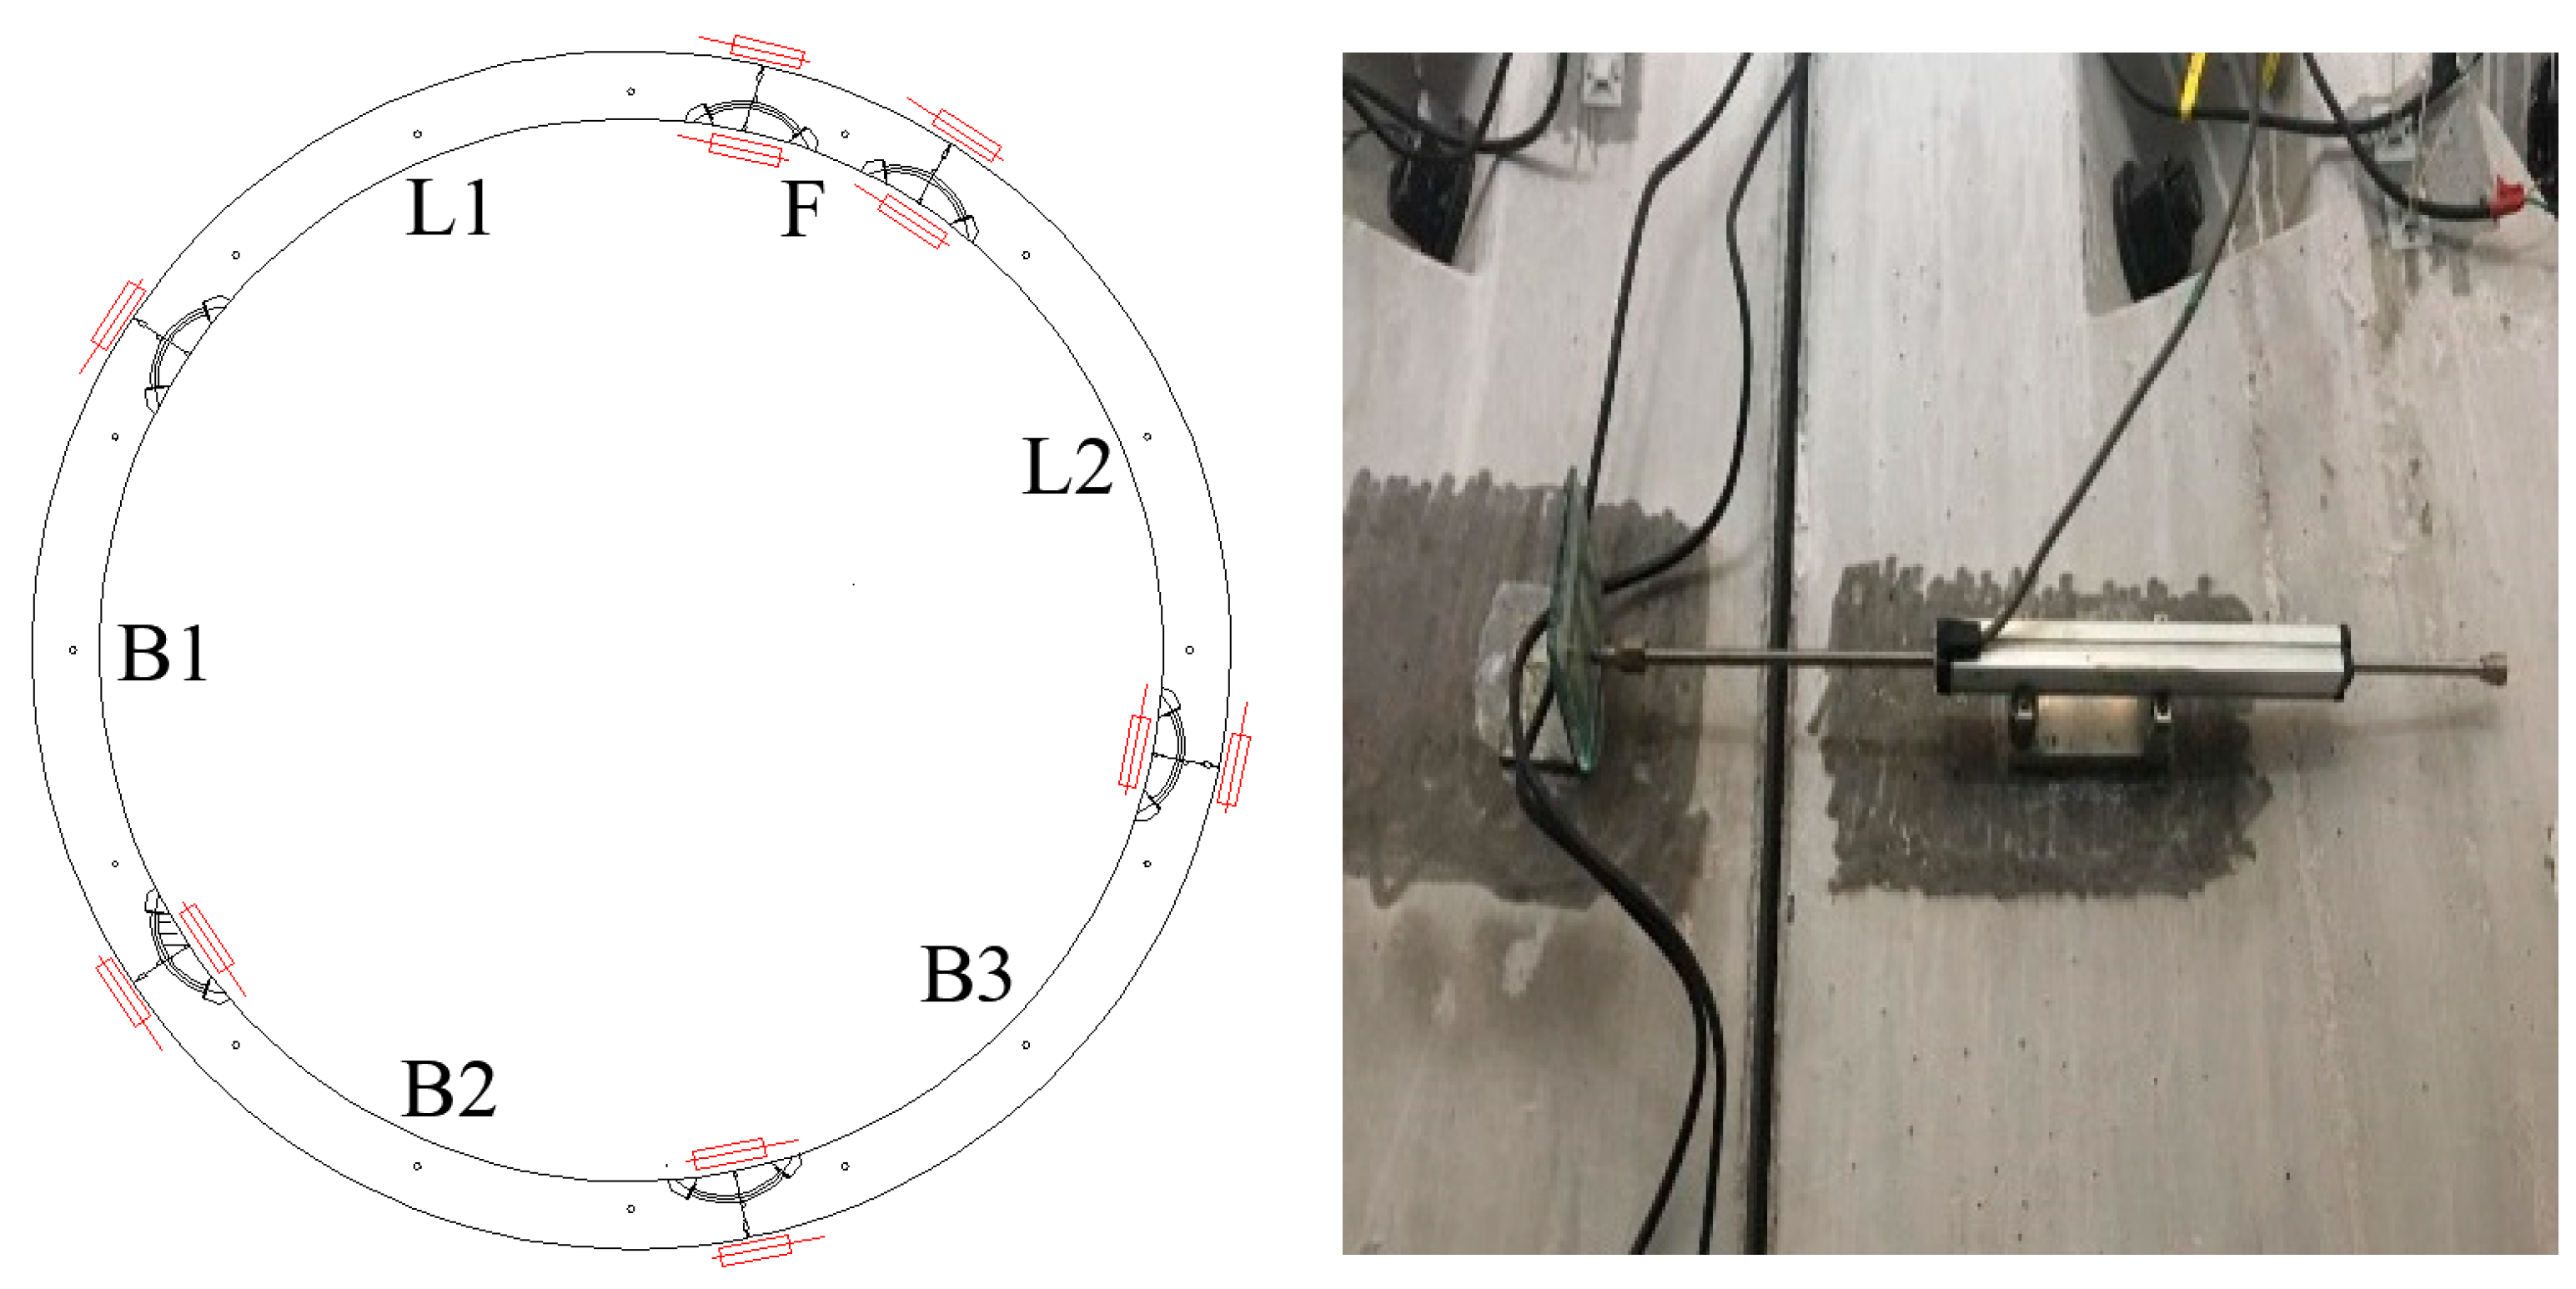
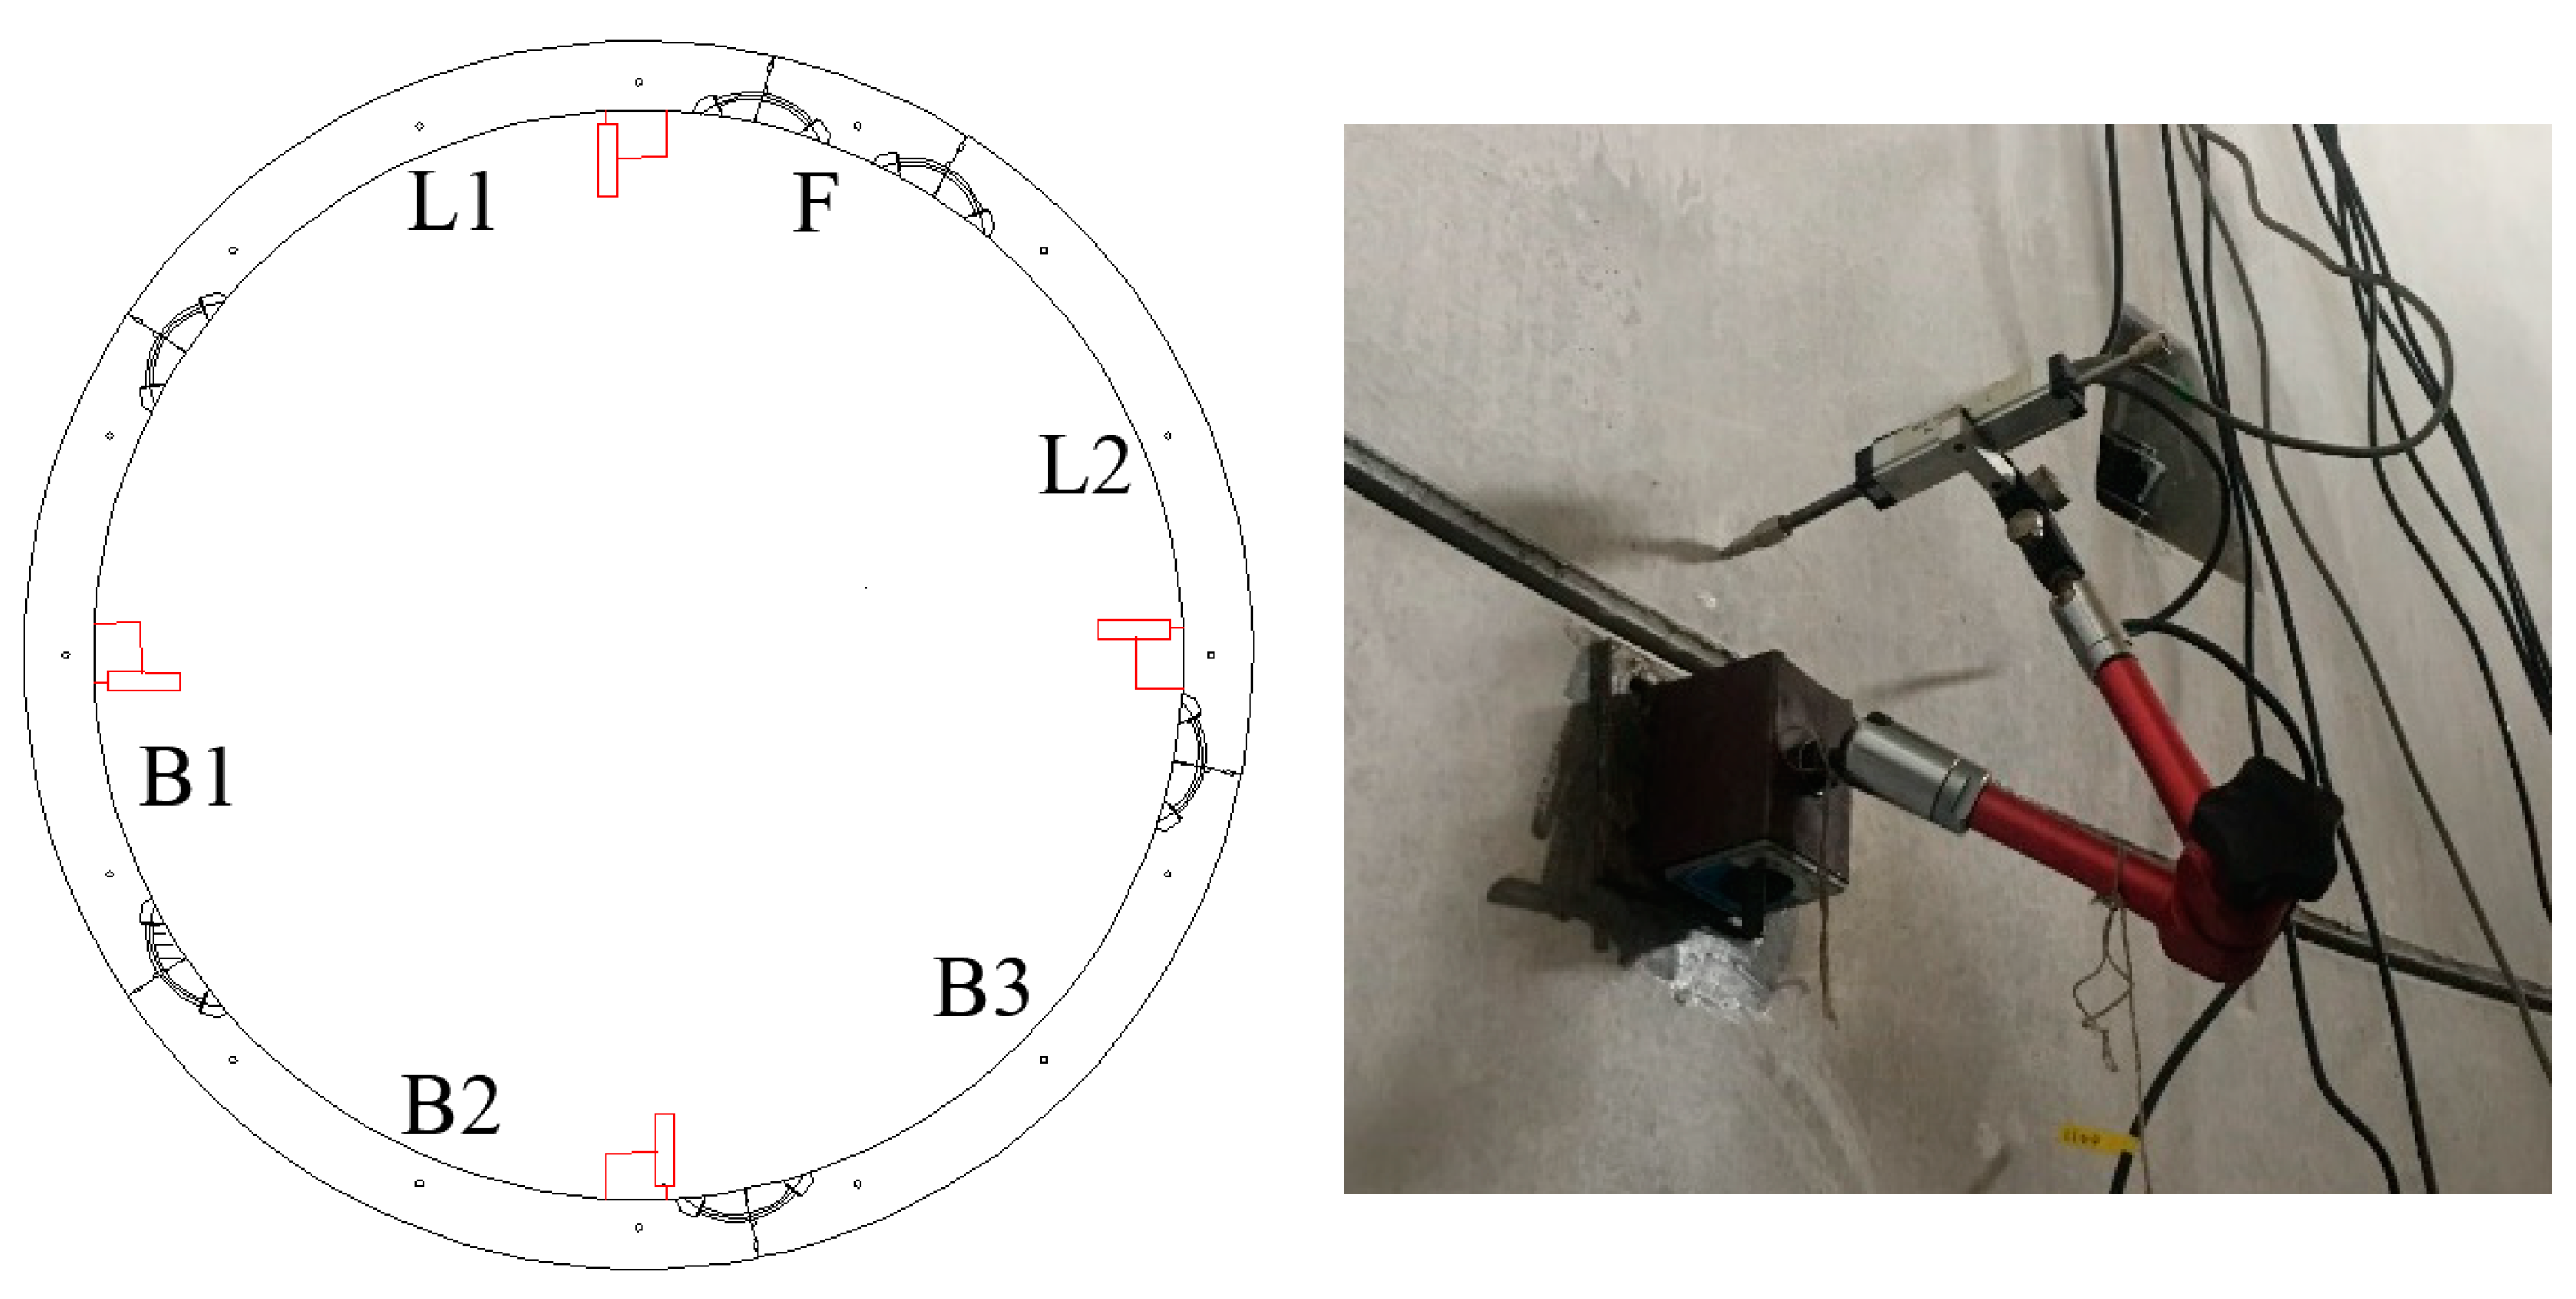
4.2. Measurement Point

Based on the analysis in Section 3, 400 mm is selected as the thickness of the test segment. In order to study the load-bearing performance of the large inner diameter shield tunnel under excavation unloading conditions, the measurement content of the full-scale test includes the tunnel convergence deformation, internal force, longitudinal joint opening, circumferential joint dislocation, and curved bolt stress.
In the test, the middle ring of the tunnel is selected as the displacement observation object. The displacement sensor is fixed on the support rod, and the support rod is fixed on the center column. A total of eight sensors (D1~D8) are used to analyze the variation in the tunnel displacement, as shown in Figure 21. A total of 11 sections (S1~S11) are set as the measurement areas for the internal force testing of the shield tunnel. The angle distribution of these sections is shown in Figure 22. The stress of the segment rebar is measured by vibrating wire stress gauges, and the strain of the segment concrete is measured by resistance strain gauges.
The bolts stress in the middle ring of the tunnel is measured by resistance strain gauges, and the grooves are made on the inner and outer sides of the screw before installing the strain gauge, as shown in Figure 23. There are a total of 12 measuring points for the longitudinal seam bolt and 8 measuring points for the circumferential seam bolt. Both the longitudinal seam opening and the circumferential seam dislocation are measured by rod displacement sensors, as shown in Figure 24 and Figure 25. There are a total of 12 points to measure the longitudinal seam opening and 4 points to measure the circumferential seam dislocation.

4.3. Test Result

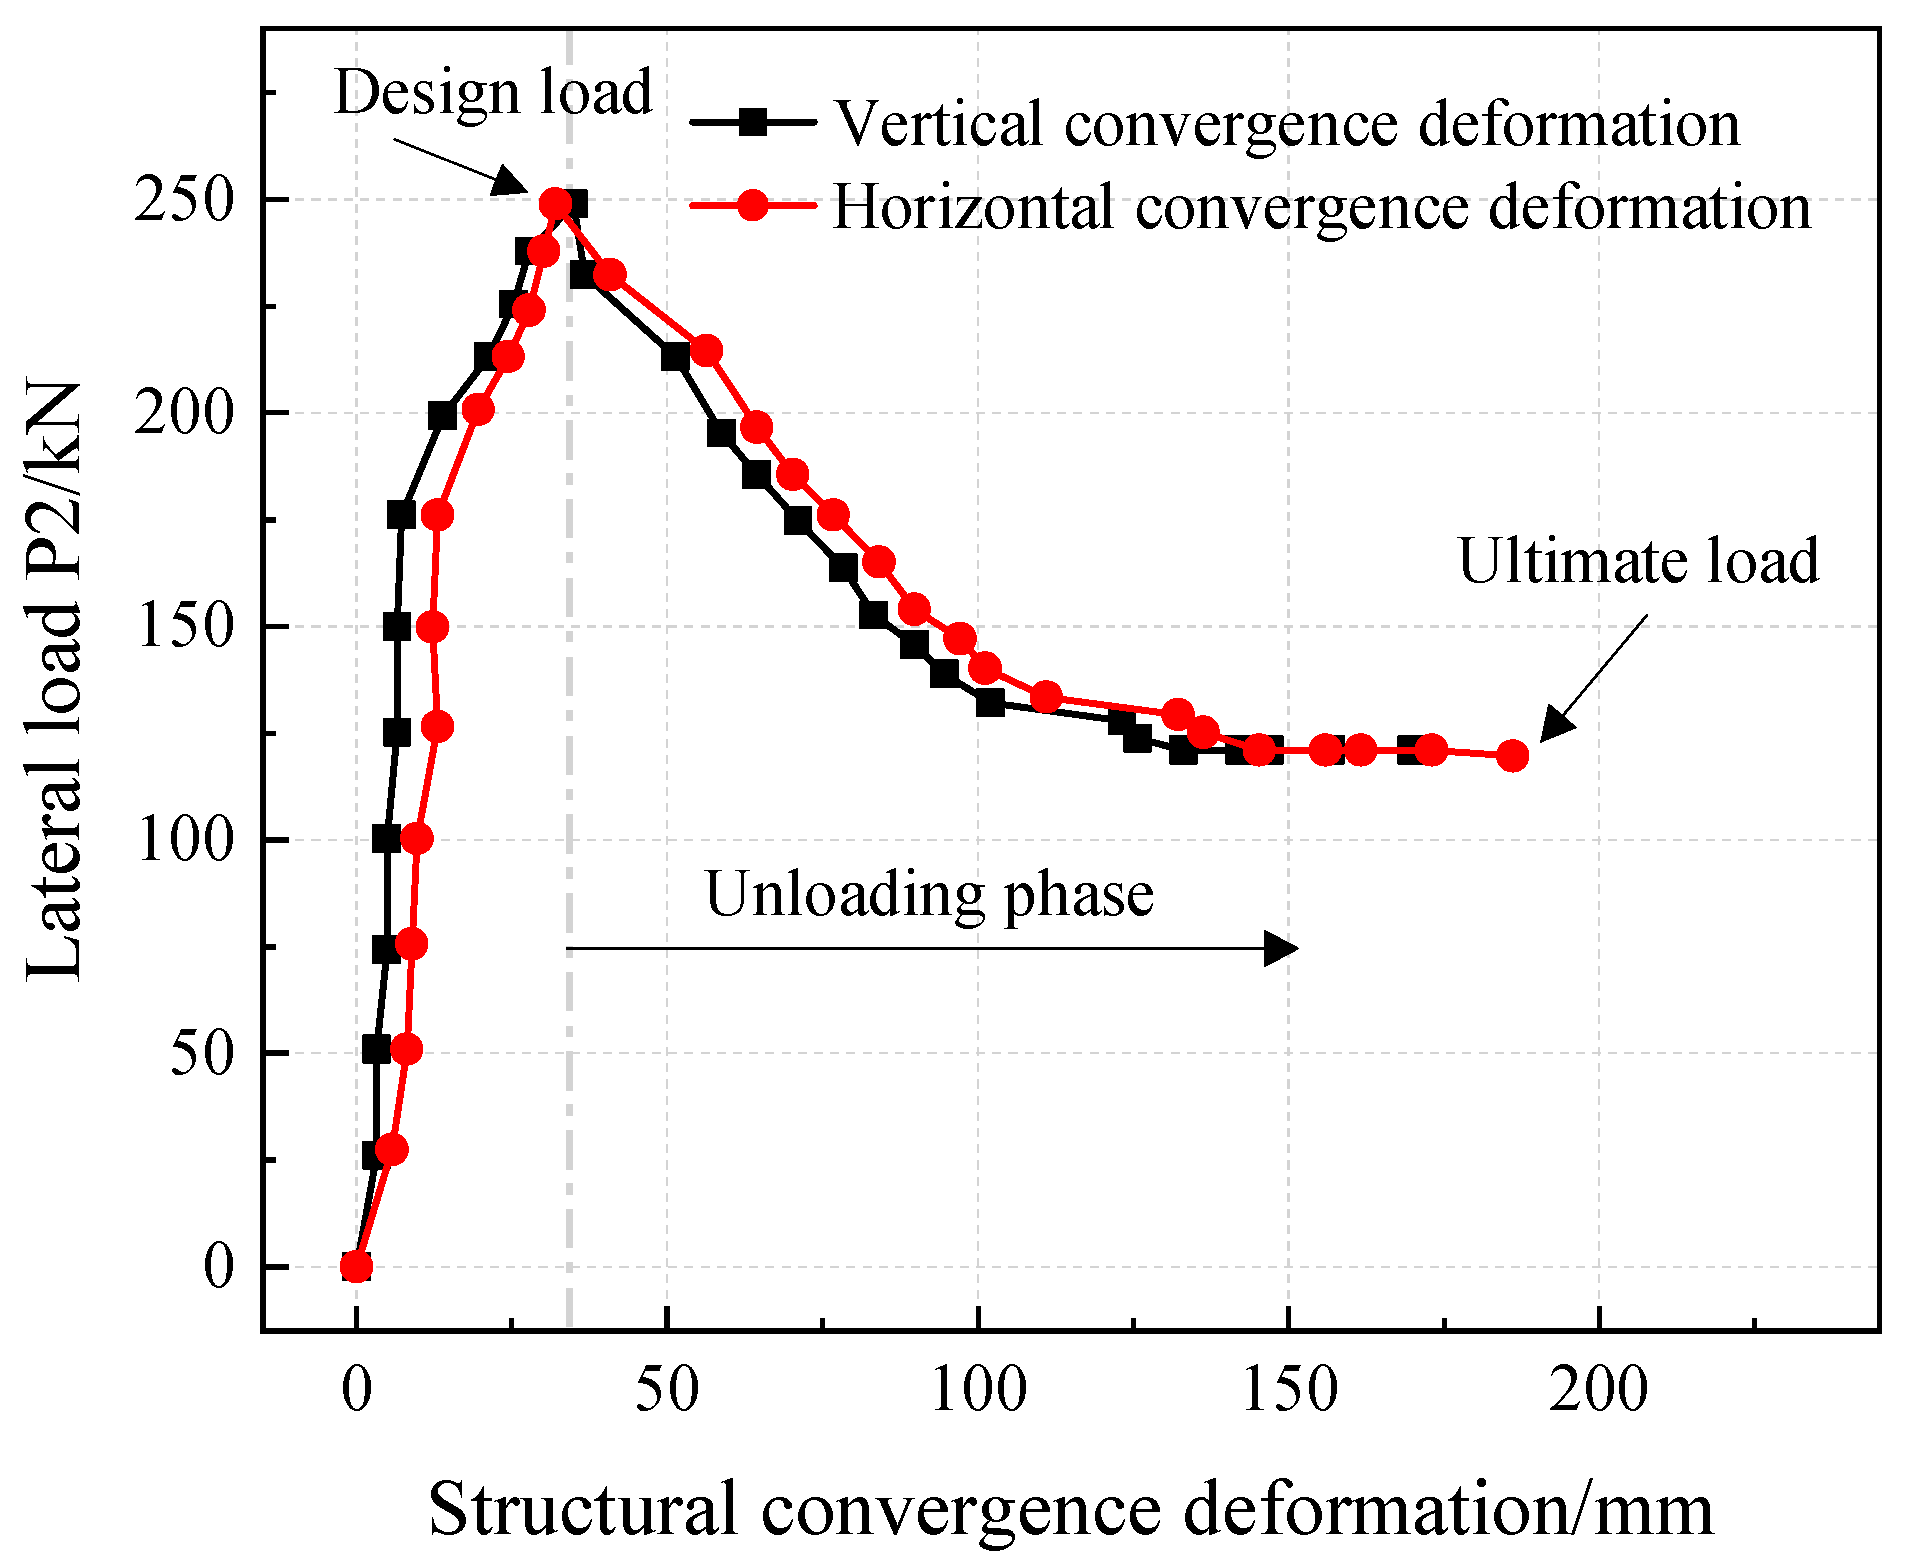
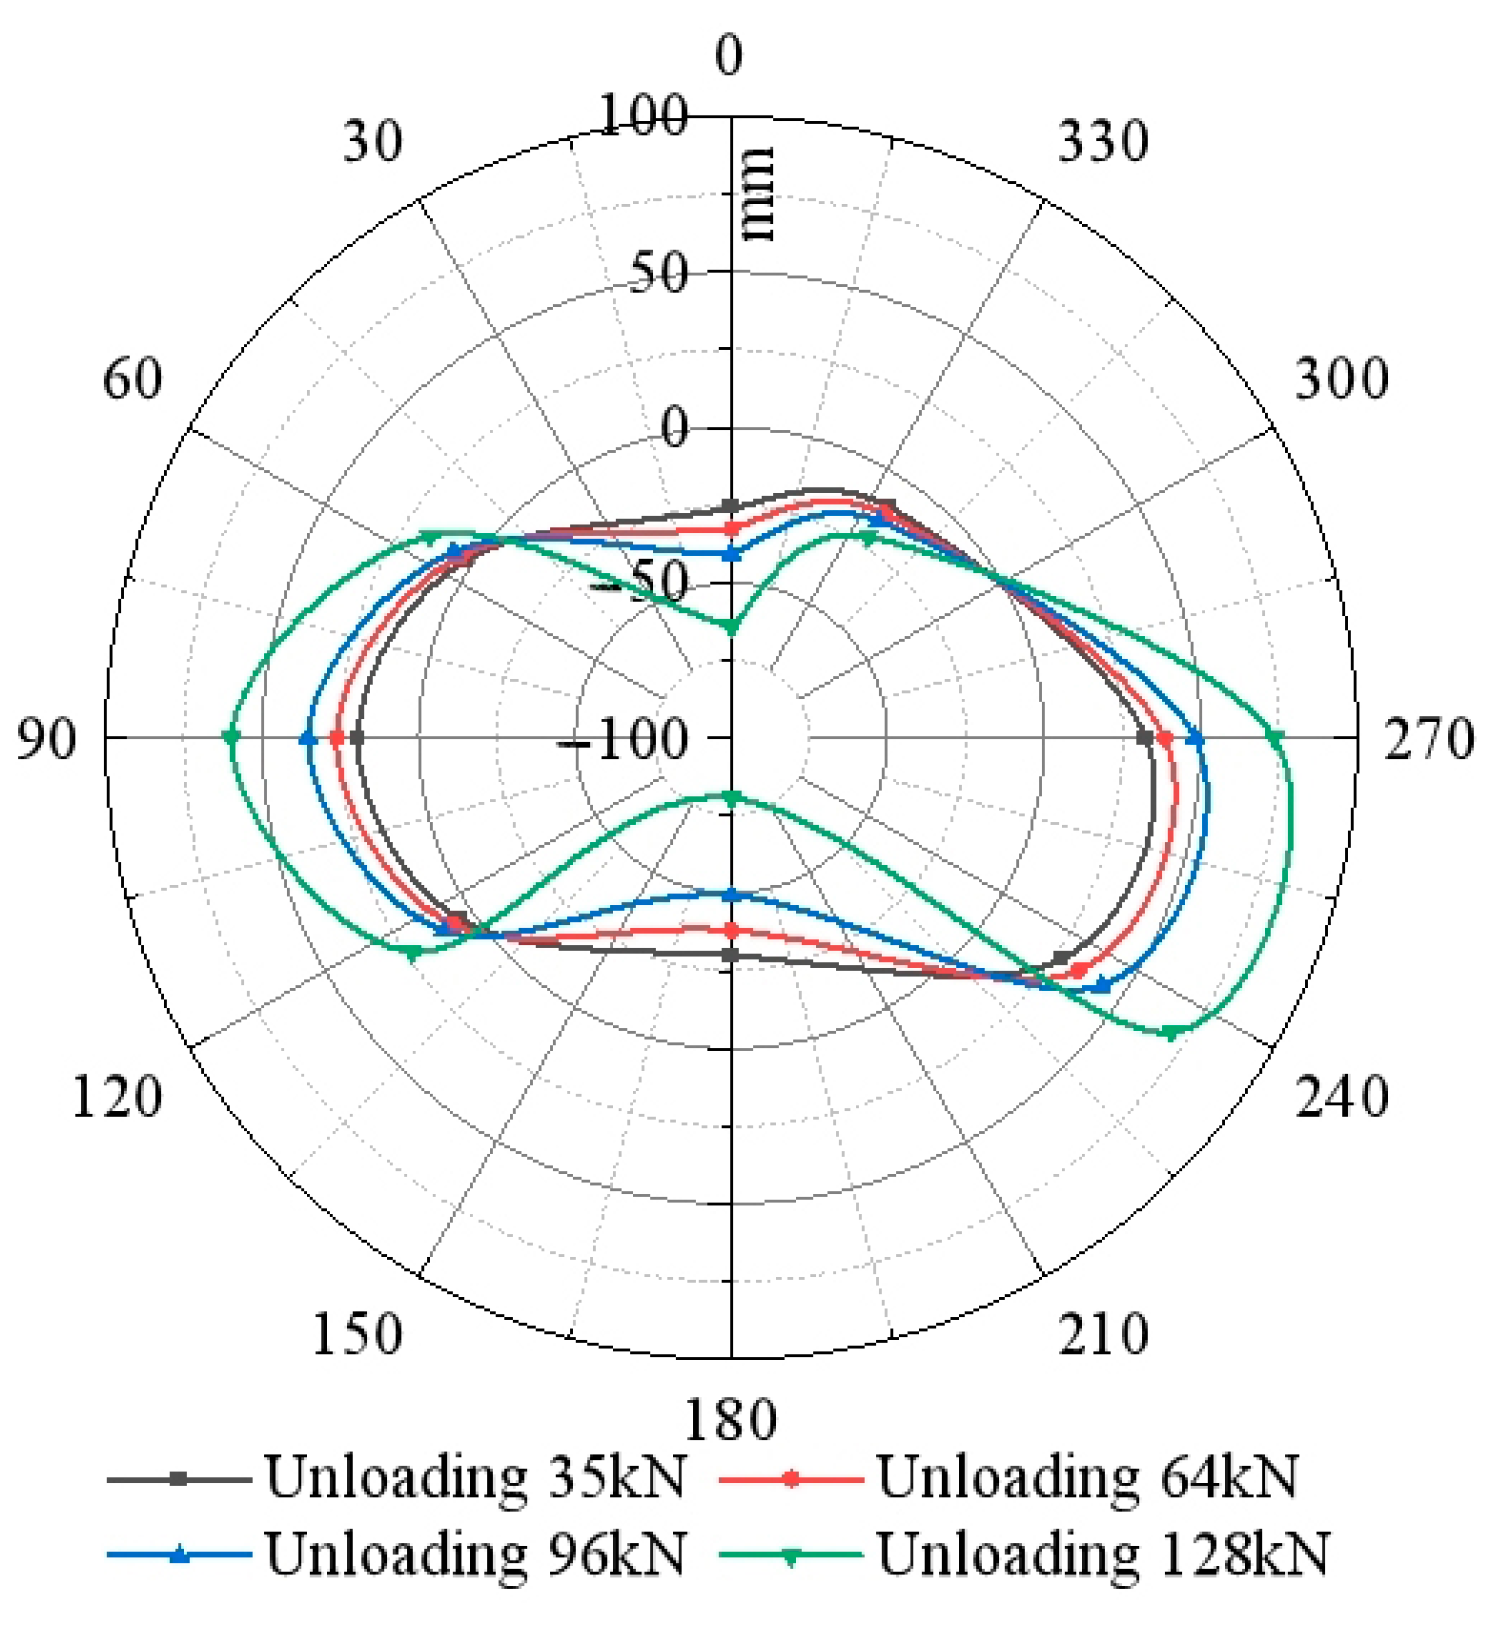
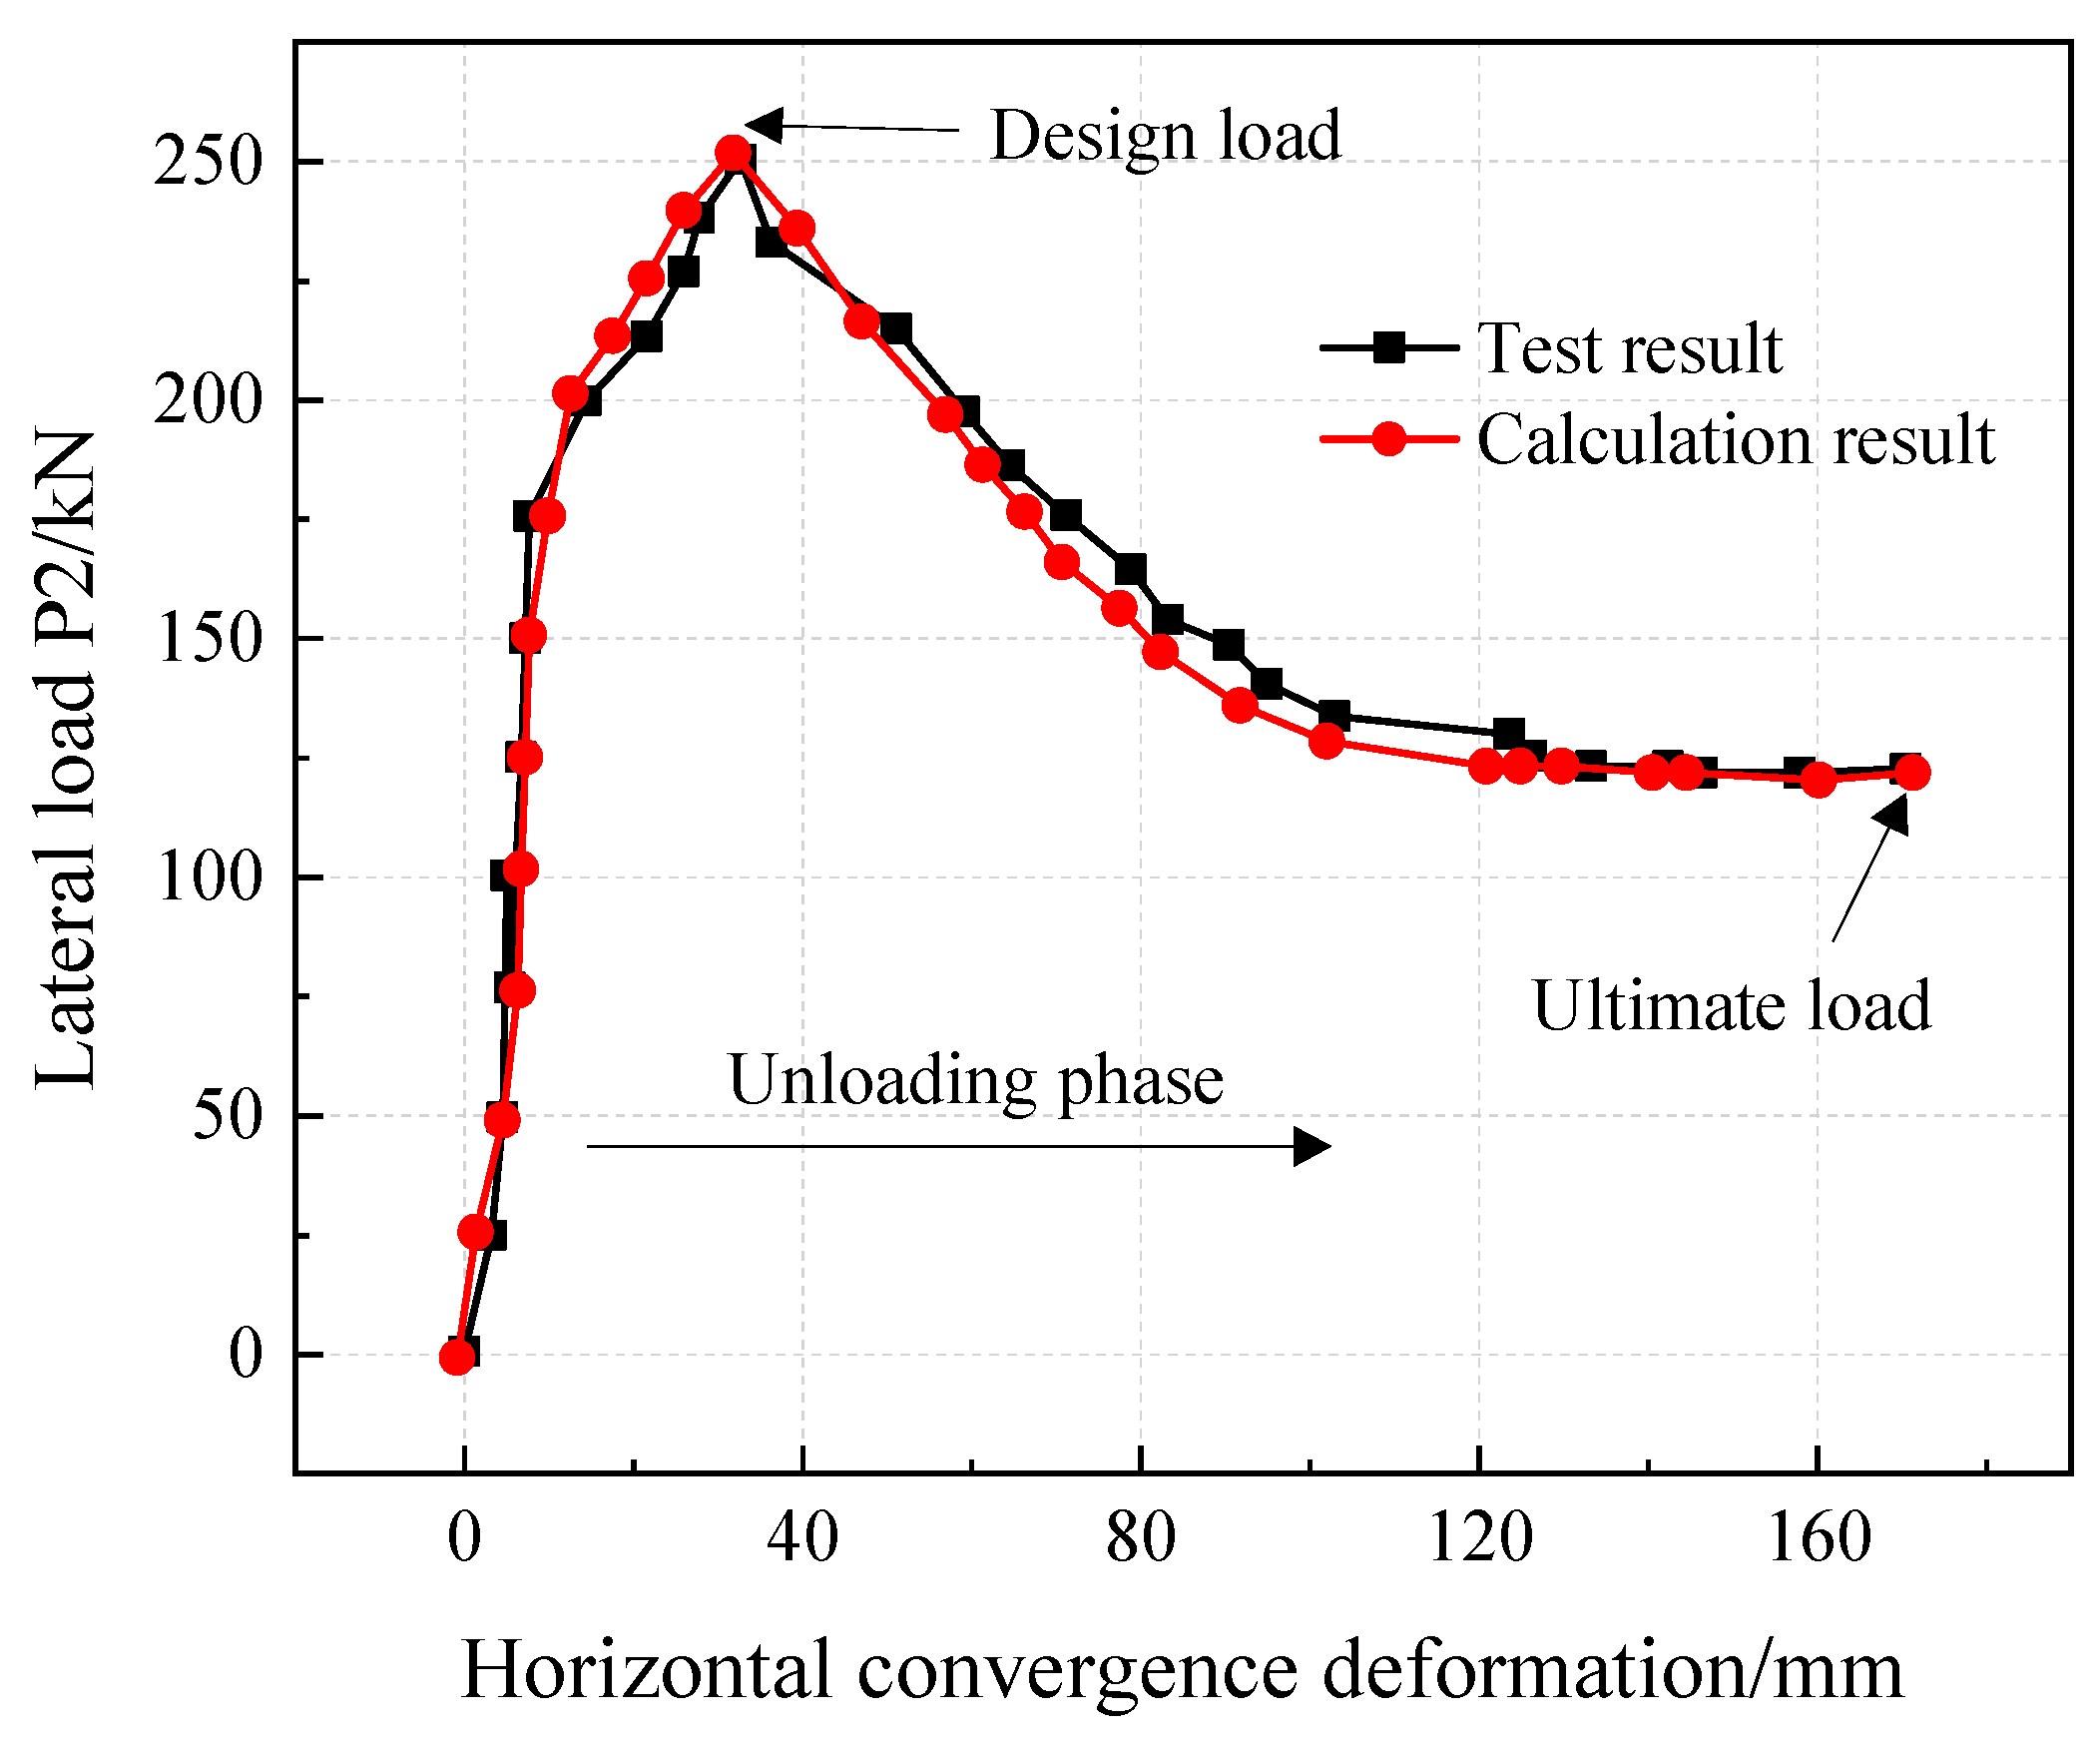
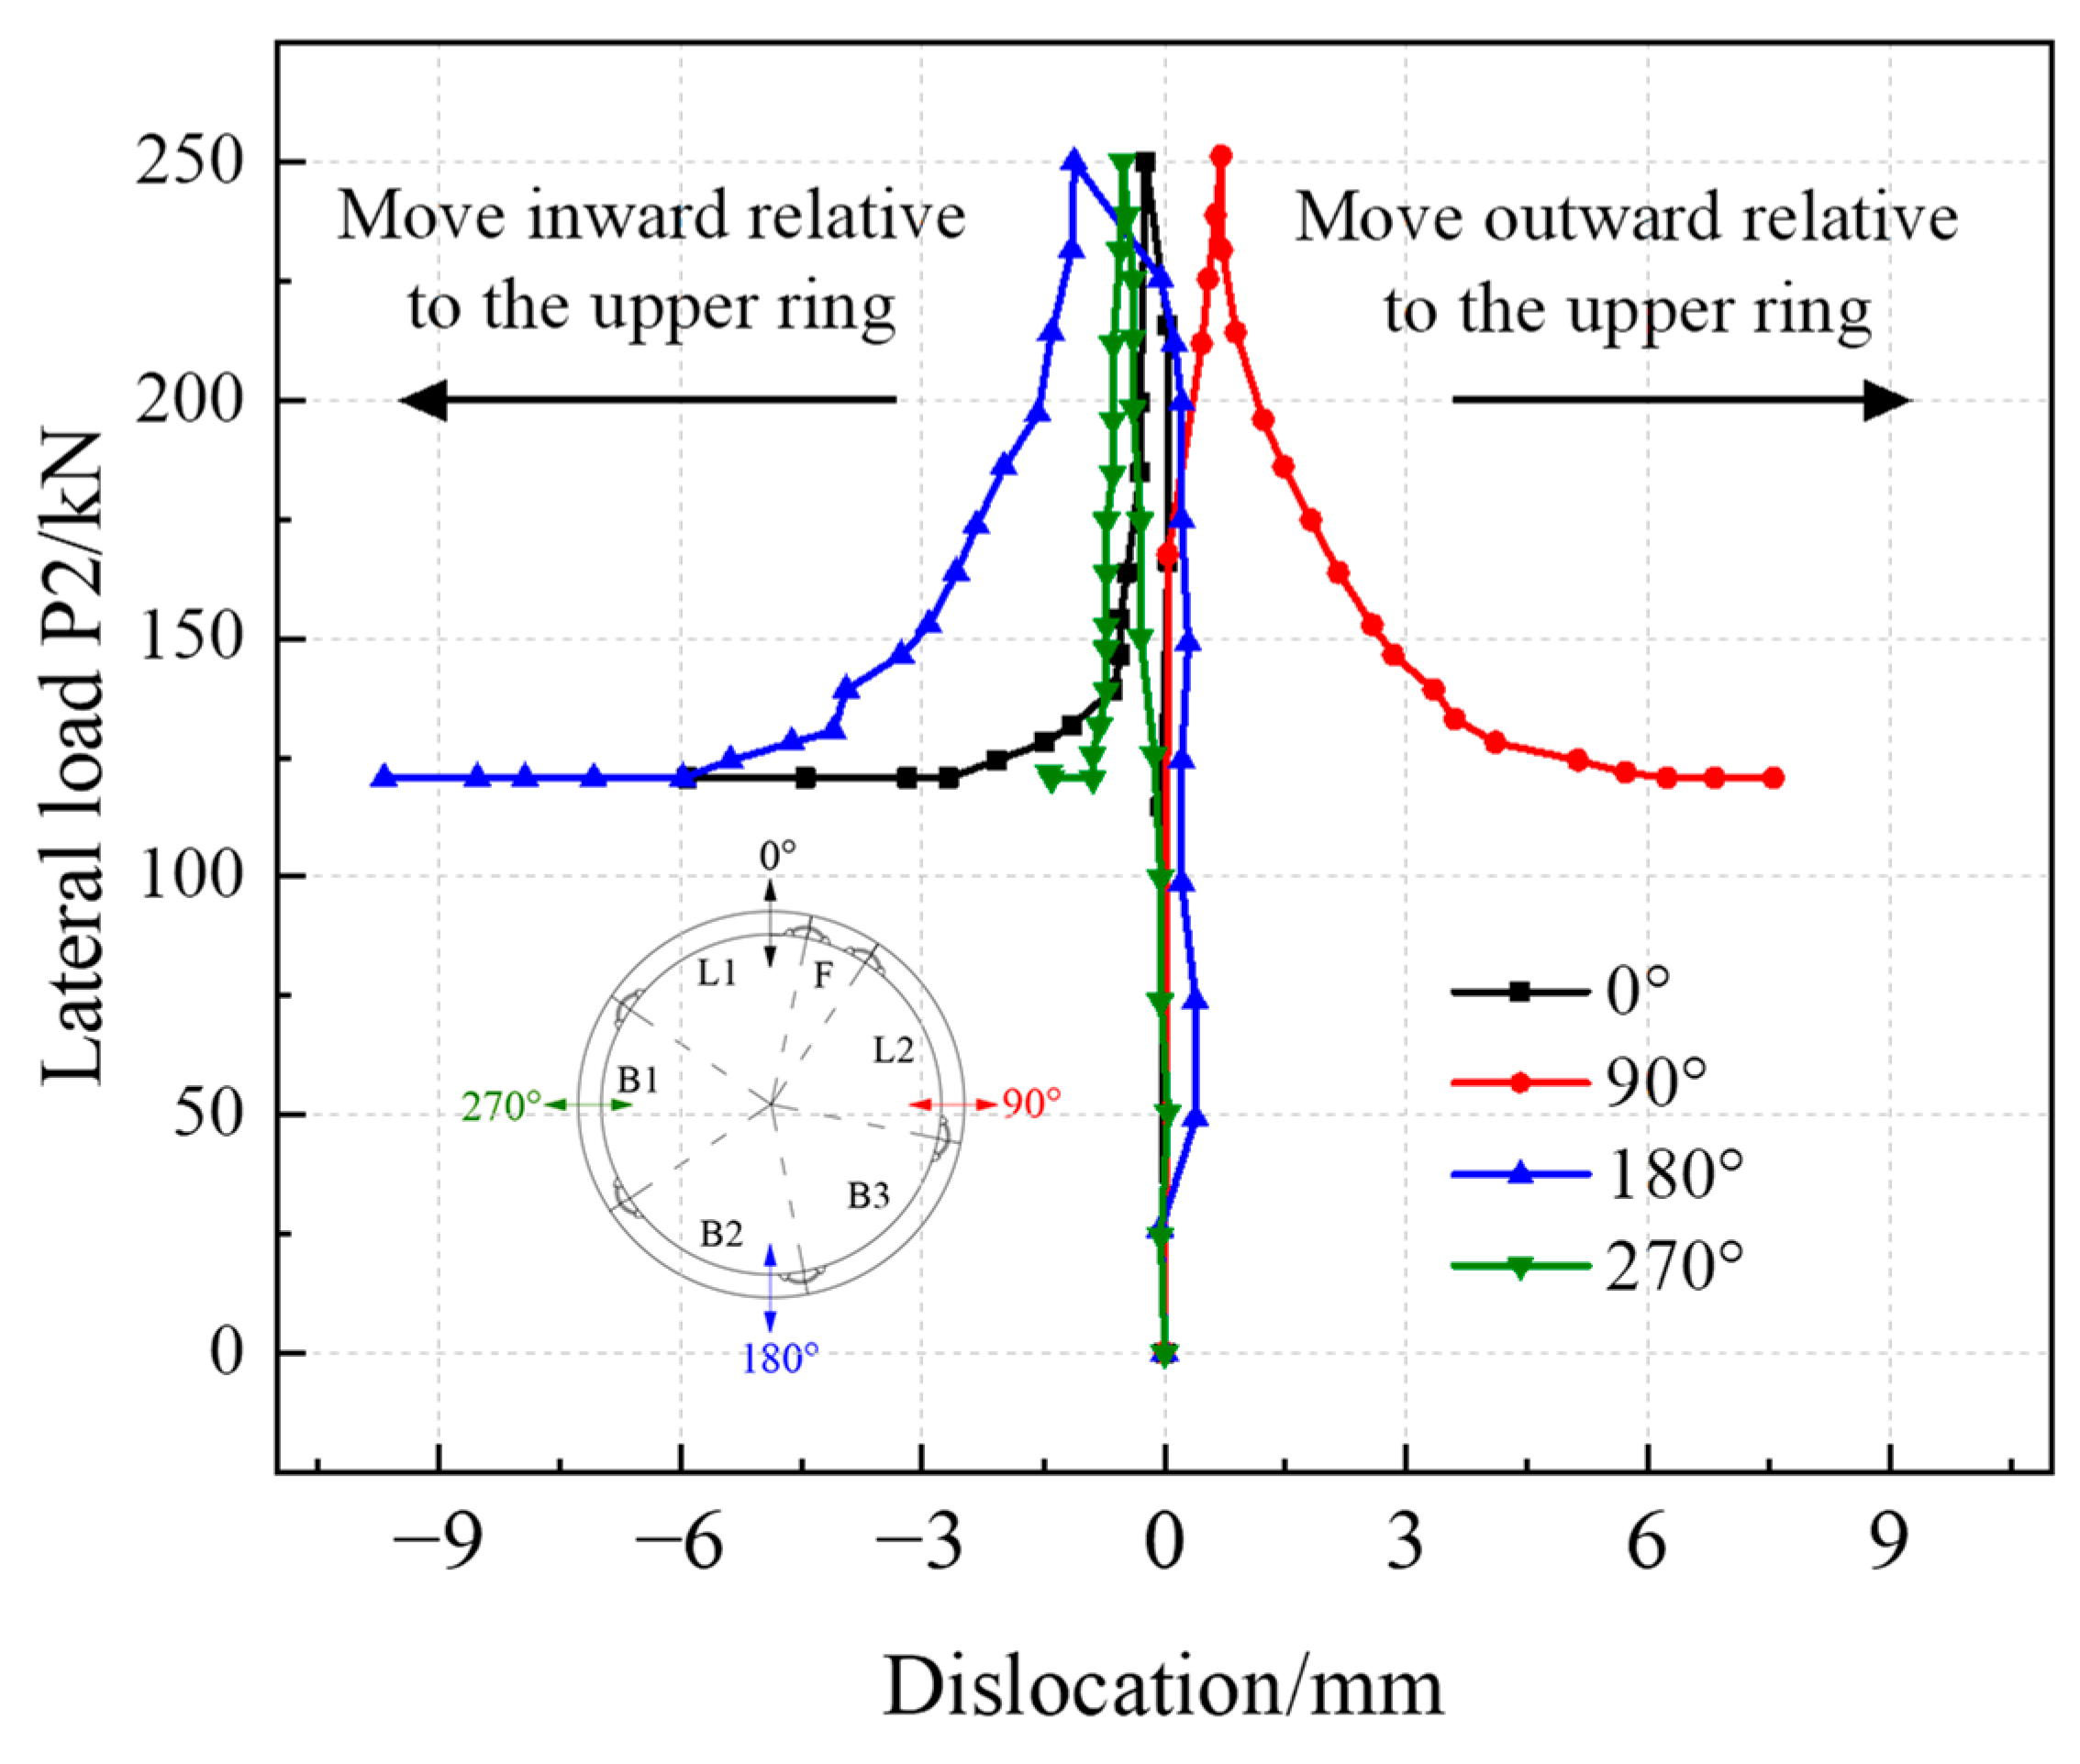
4.3.1. Convergence Deformation of Shield Tunnel Structure

Figure 26 and Figure 27 show the variation of the tunnel convergence deformation with external load and the cross-sectional deformation under unloading conditions, respectively. It can be seen from the figure that the convergence deformation of the shield tunnel increases approximately linearly with the external load in the early stage. When the test load P2 reaches the design load of 249 kN, the vertical and horizontal convergence deformation reaches 34.9 mm and 32.1 mm, respectively. The result shows that the numerical calculation value is close to the value in the test in Section 3.1. Moreover, the vertical convergence deformation is greater than the horizontal convergence deformation in the early stage. Once entering the unloading stage, the convergence deformation of the shield tunnel increases rapidly with the external load, especially at the sections of 90°, 180°, 240° and 270°. When P2 decreases to 128 kN, the shield tunnel structure enters the failure state. The maximum vertical and horizontal convergence deformations reach 186.1 mm and 169.8 mm, respectively.
Applying the same load as described in Section 2.1 to the numerical model for calculation, Figure 28 shows the comparison of the horizontal convergence deformation between the numerical model and the full-scale test. The result shows that the growth trend of the horizontal convergence deformation of the two curves is basically consistent. During the unloading stage, the maximum difference of the horizontal deformation between the two curves does not exceed 5%. Figure 29 shows the cross-sectional deformation of the shield tunnel when unloading 64 kN by calculation and test. It can be seen from the figure that there are slight differences in the deformation at the some angles, but the maximum deformation difference between the two curves does not exceed 7%, which indicates that the shield tunnel numerical model used for research is reasonable.

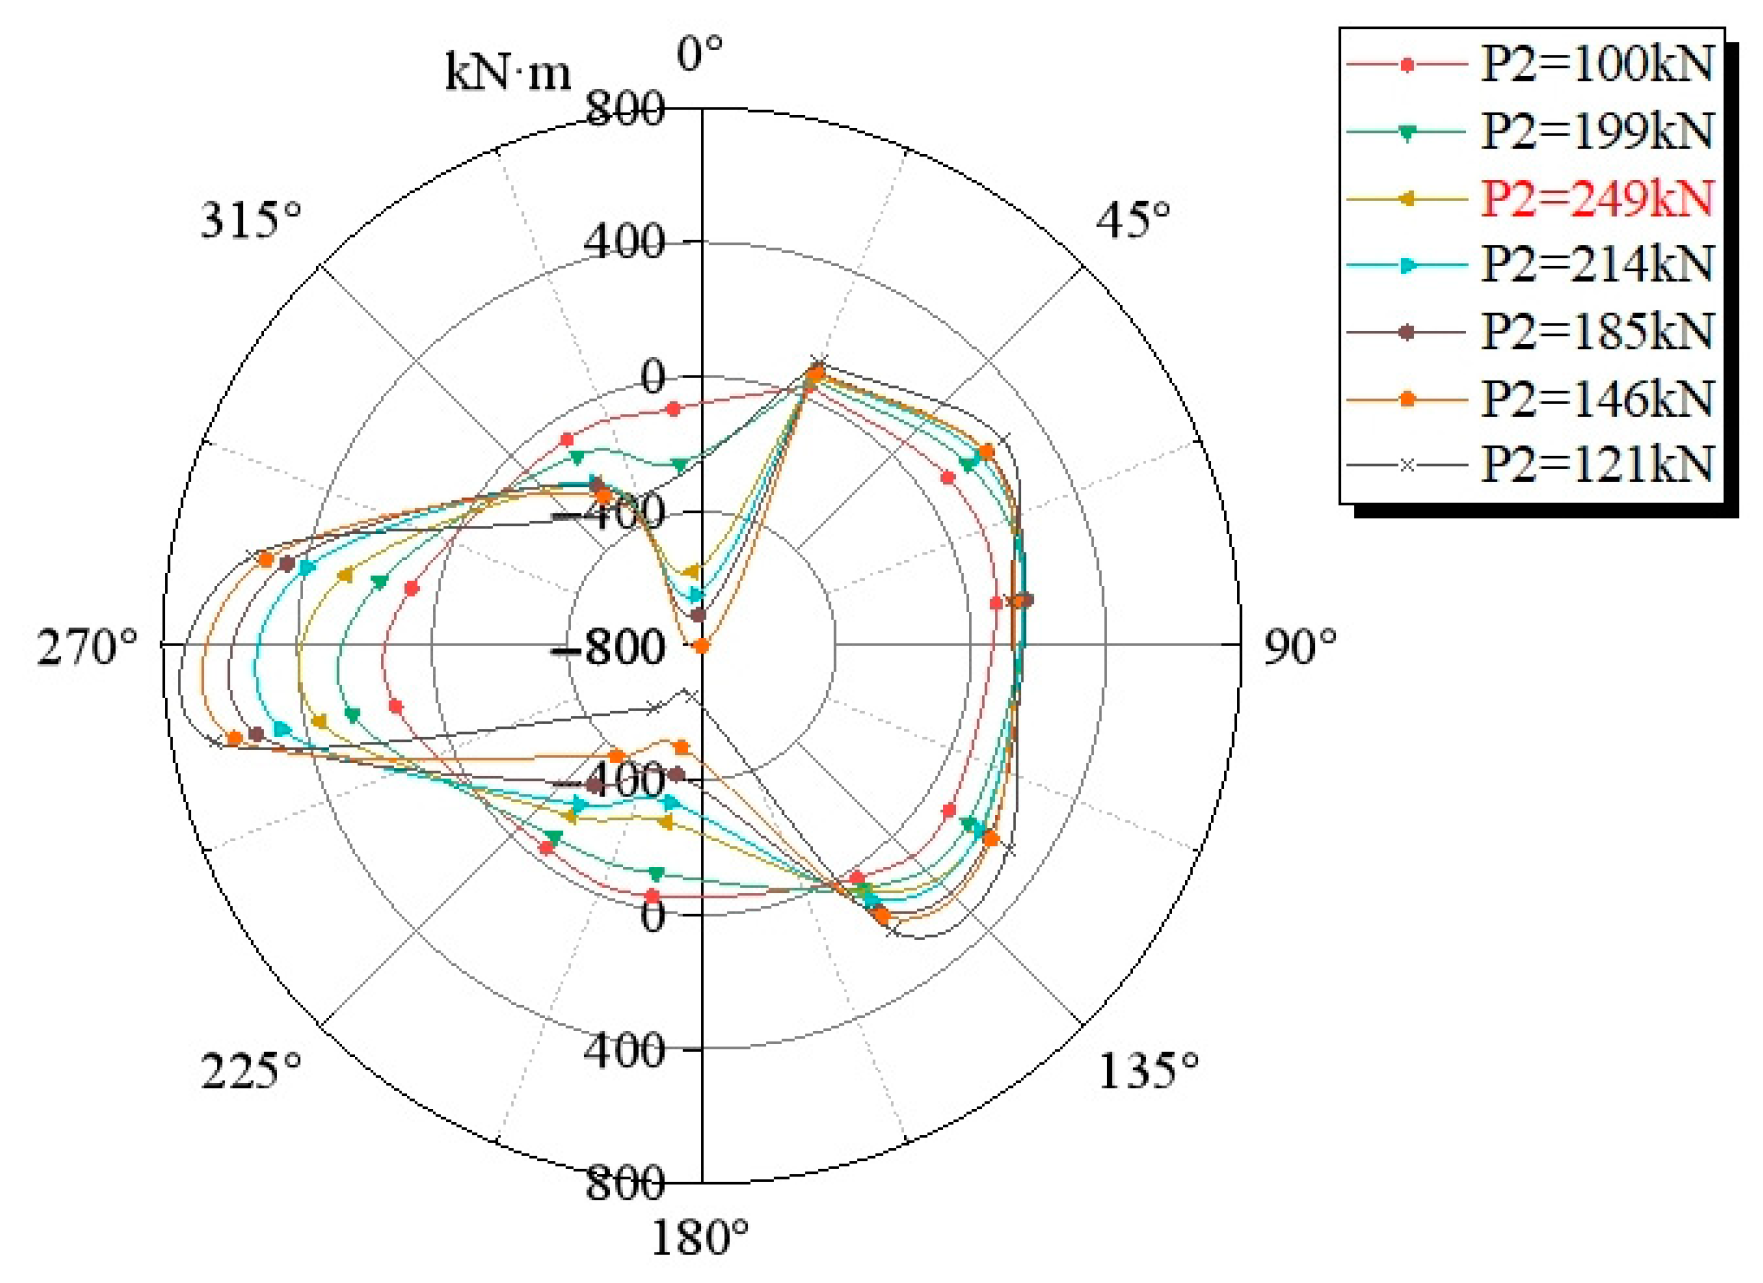
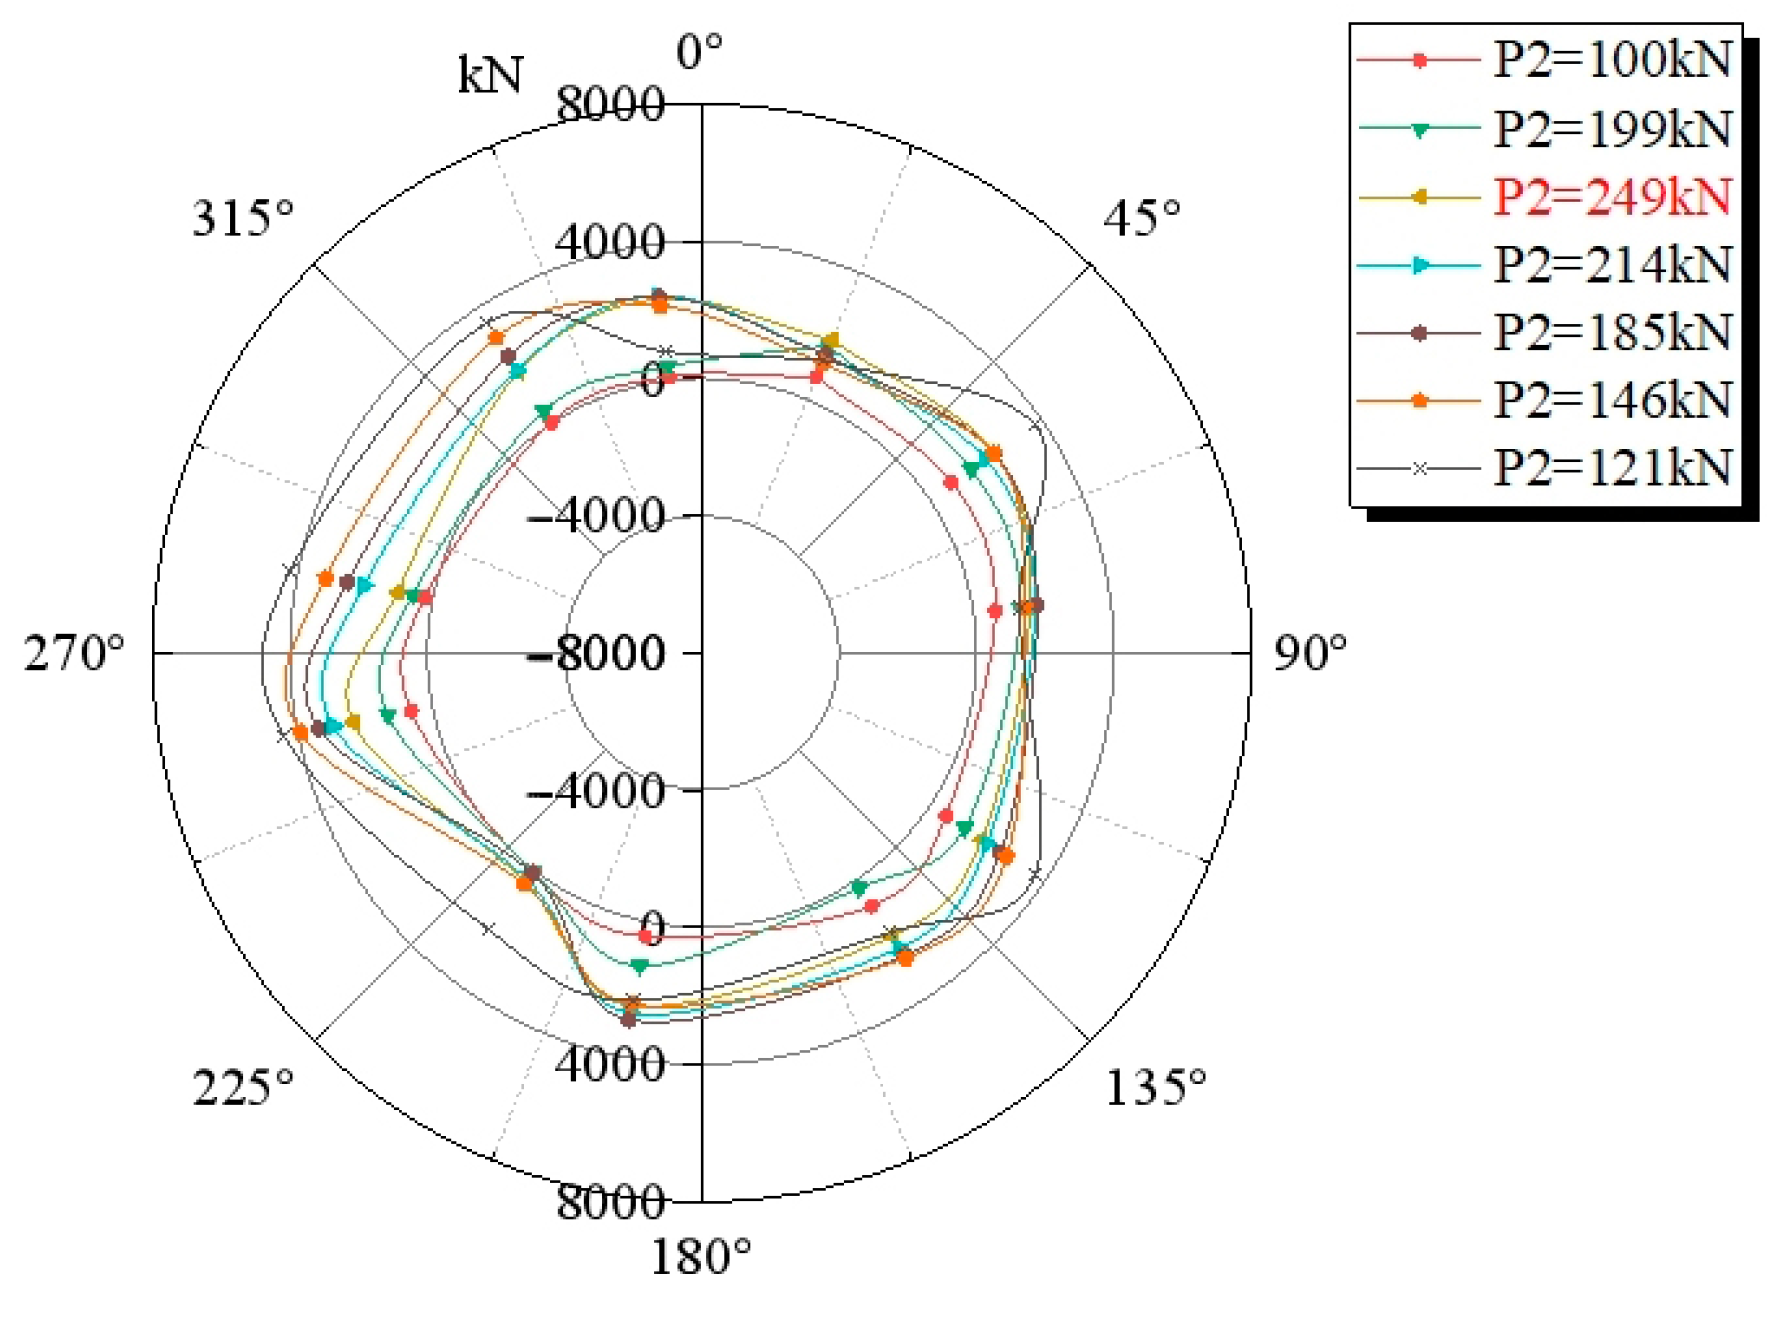
4.3.2. Internal Force of Shield Tunnel Structure

Figure 30 presents the variation curve of the bending moment under different load conditions. It can be seen from the figure that the bending moment of the shield tunnel is positive at the waist, while it is negative at the top and bottom. Because of the staggered assembly type of the tunnel segment, the bending moment exhibits an asymmetric distribution characteristic. When P2 reaches the design load, the bending moment of the structure significantly increases at the sections of 0°, 55°, 135°, 190°, and 270°. The reason is that the tunnel ring joints are located around these sections, and these joints have lower stiffness than the segment concrete. Under the excavation unloading condition, the bending moment transfer effect between the middle and upper rings continues to increase. As a result, the bending moment of the tunnel structure increases significantly at the sections of 0°, 55°, 125° and 190°. When P2 is decreased to 121 kN, the shield tunnel reaches the final failure state. Compared to the design load stage, the maximum bending moment increases by 36% in the final failure stage, and the maximum positive bending moment occurs around the section of 270°.
Figure 31 shows the variation of the axial force under different load conditions. It can be seen from the figure that the distribution of the structural axial force has a certain correlation with the bending moment, as the tunnel sections with larger bending moments also have a larger axial force. Before P2 is increased to the design load, the increment of axial force is small, and the maximum axial force occurs at around the section of 270°. When P2 enters the unloading stage, the axial force at different tunnel sections significantly increases. When P2 is decreased to 121 kN, the shield tunnel reaches the final failure state. Compared to the design load stage, the maximum axial force increases by 74.1% in the final failure stage.

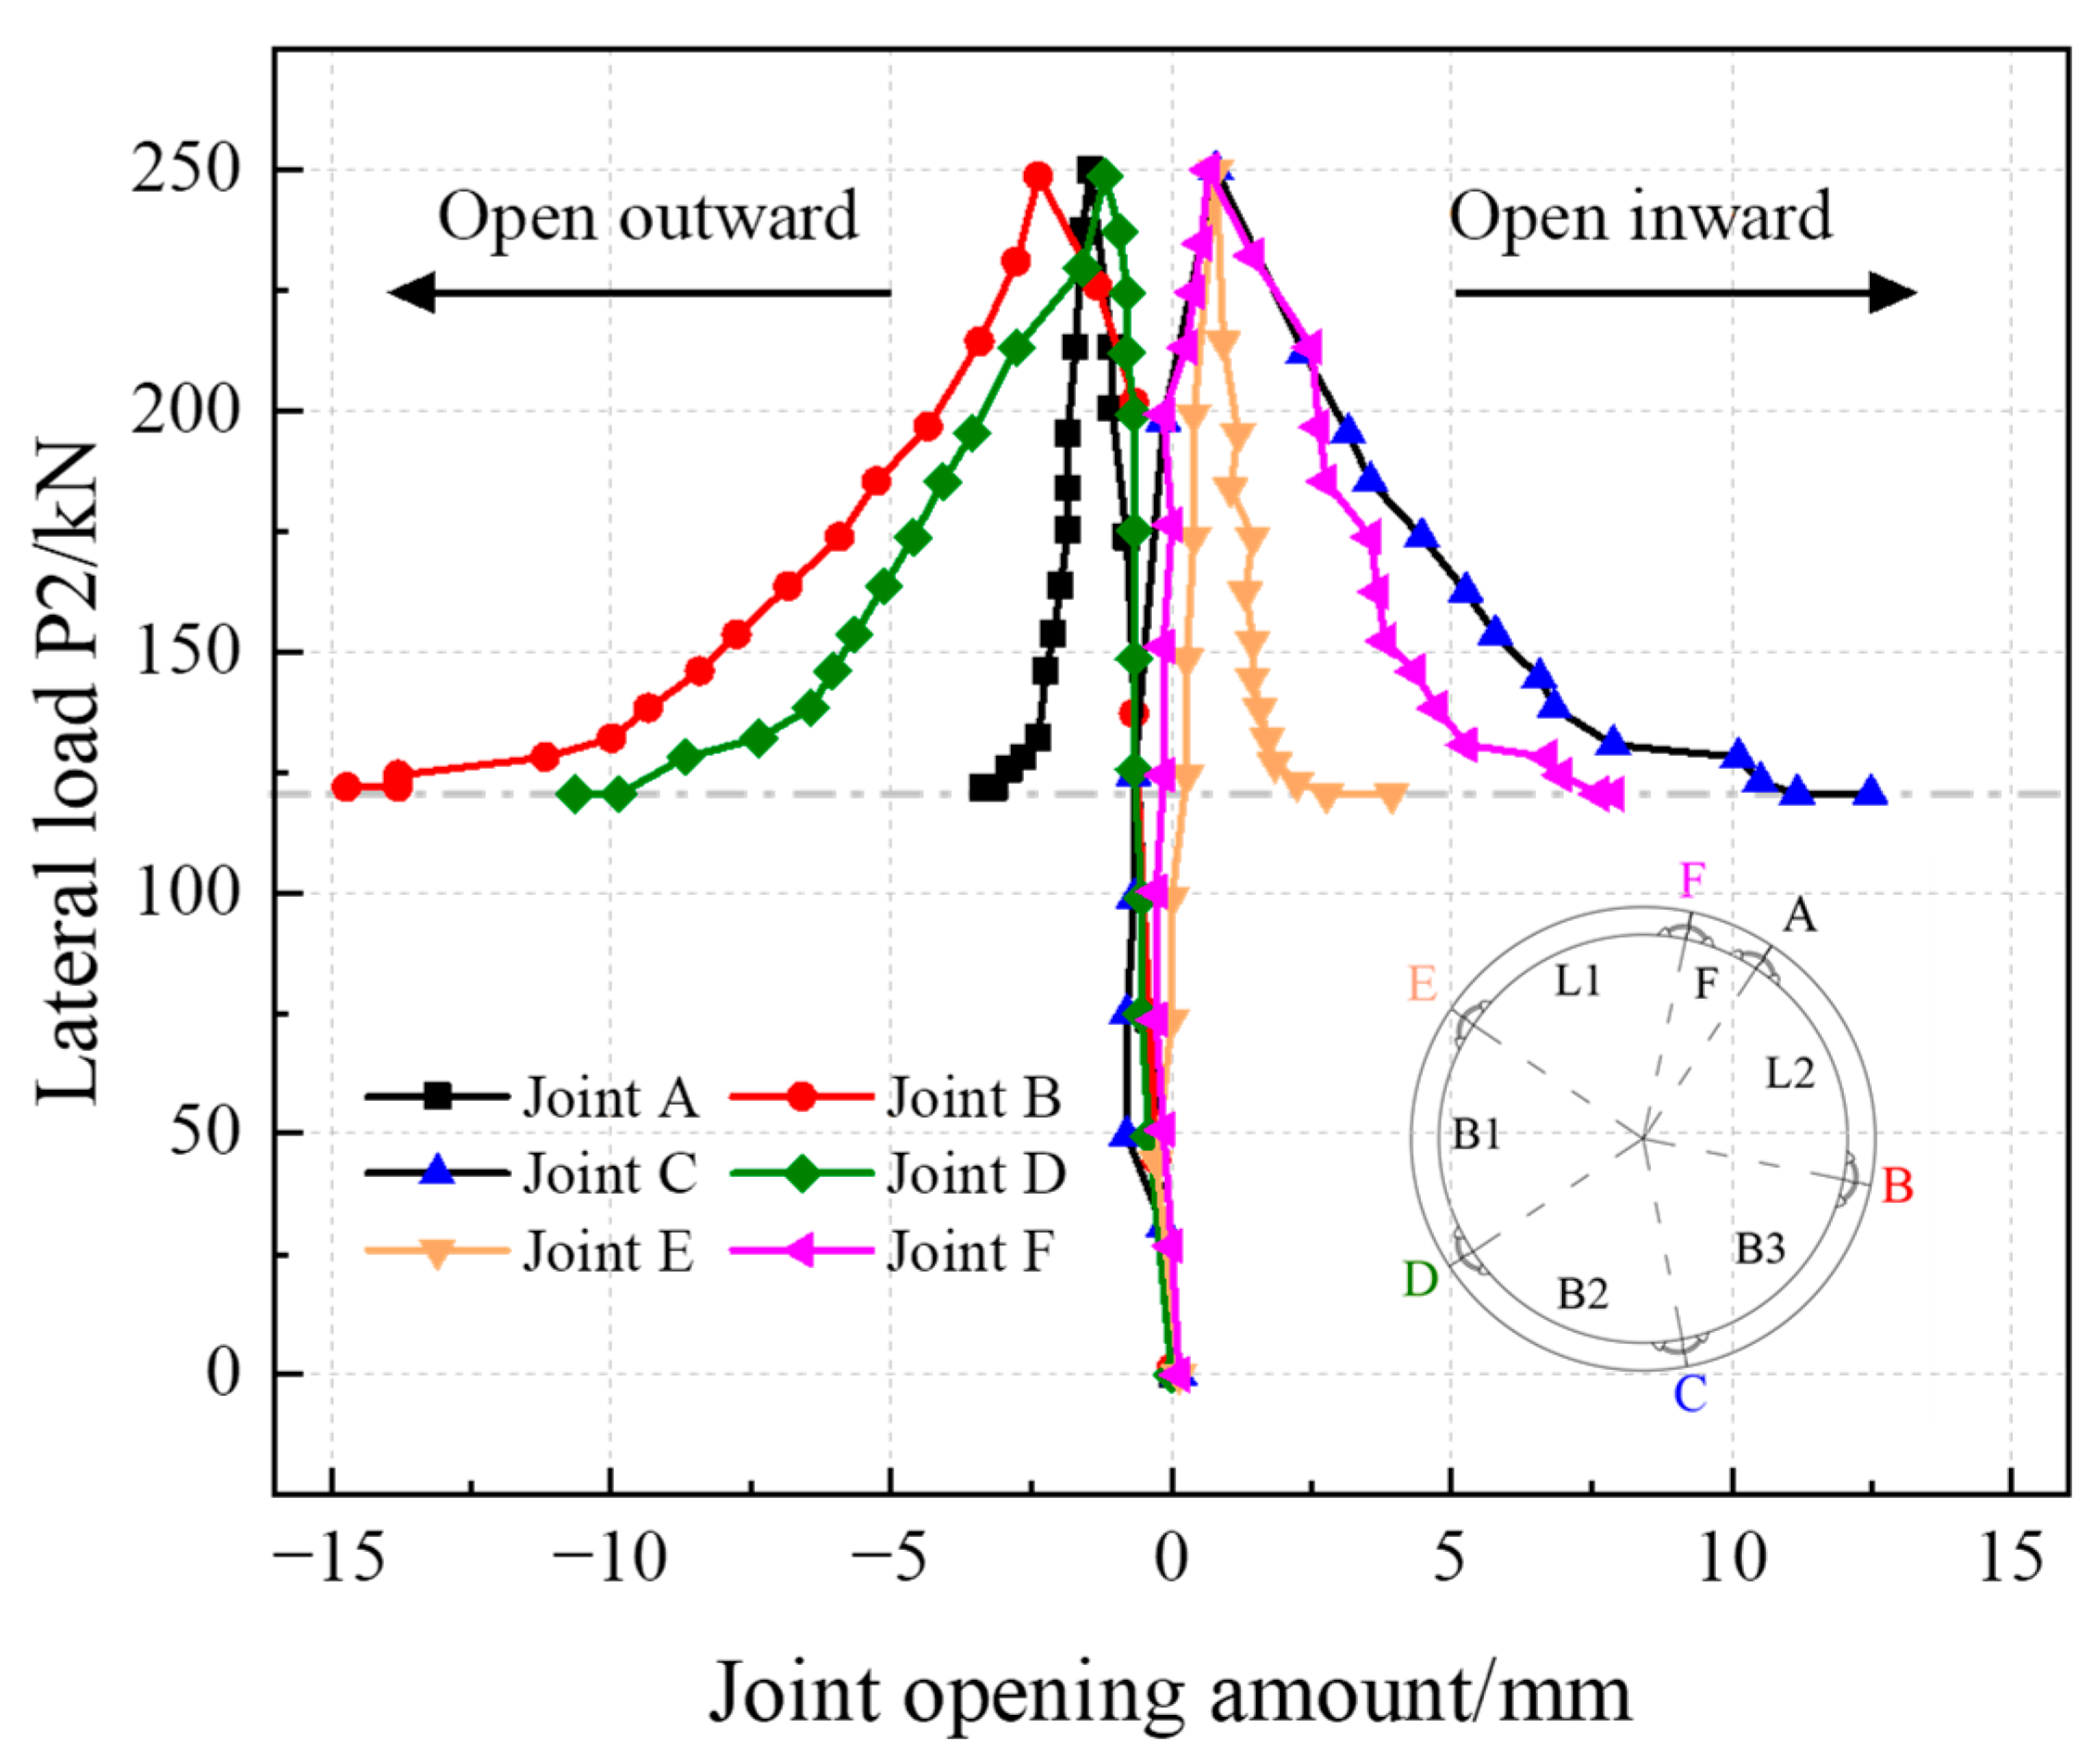
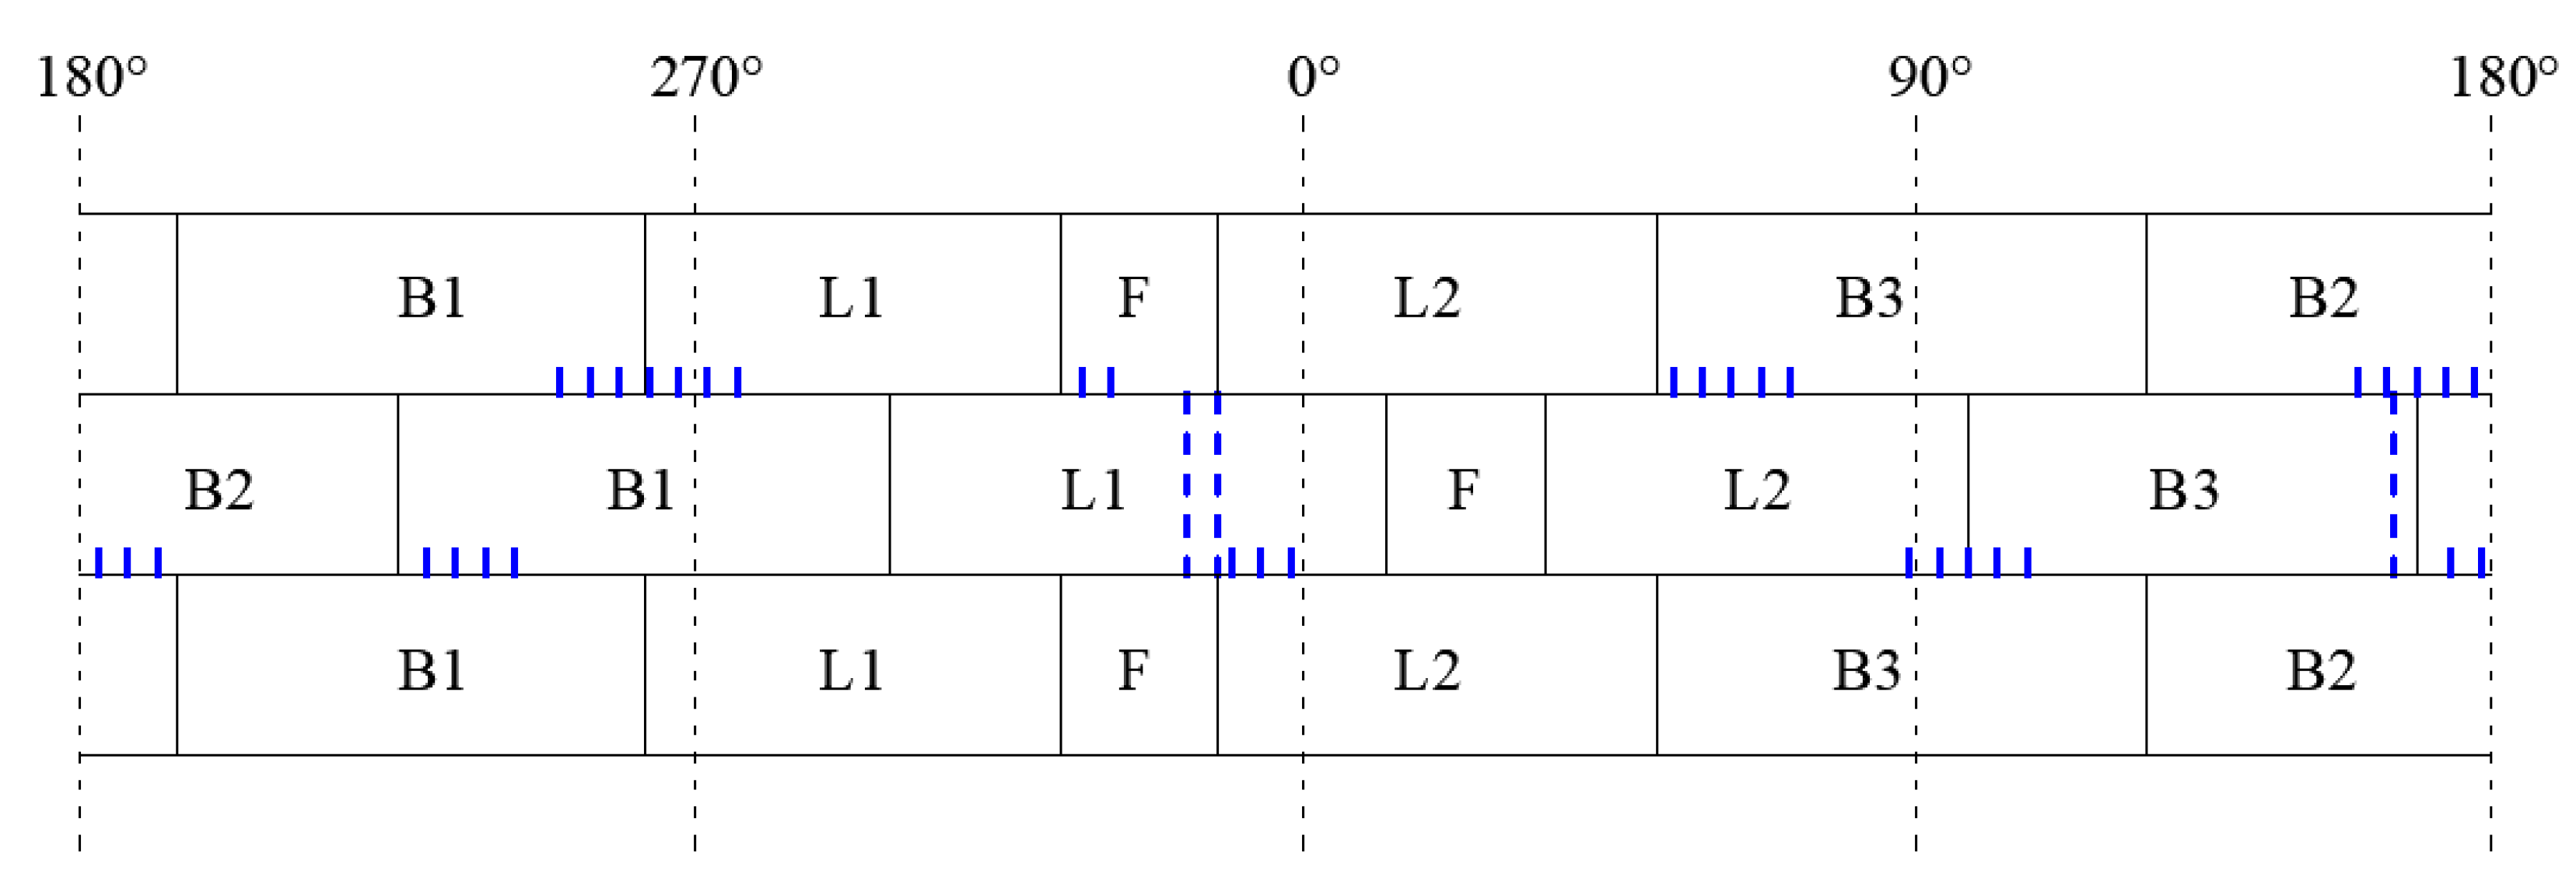
4.3.3. Joint Deformation
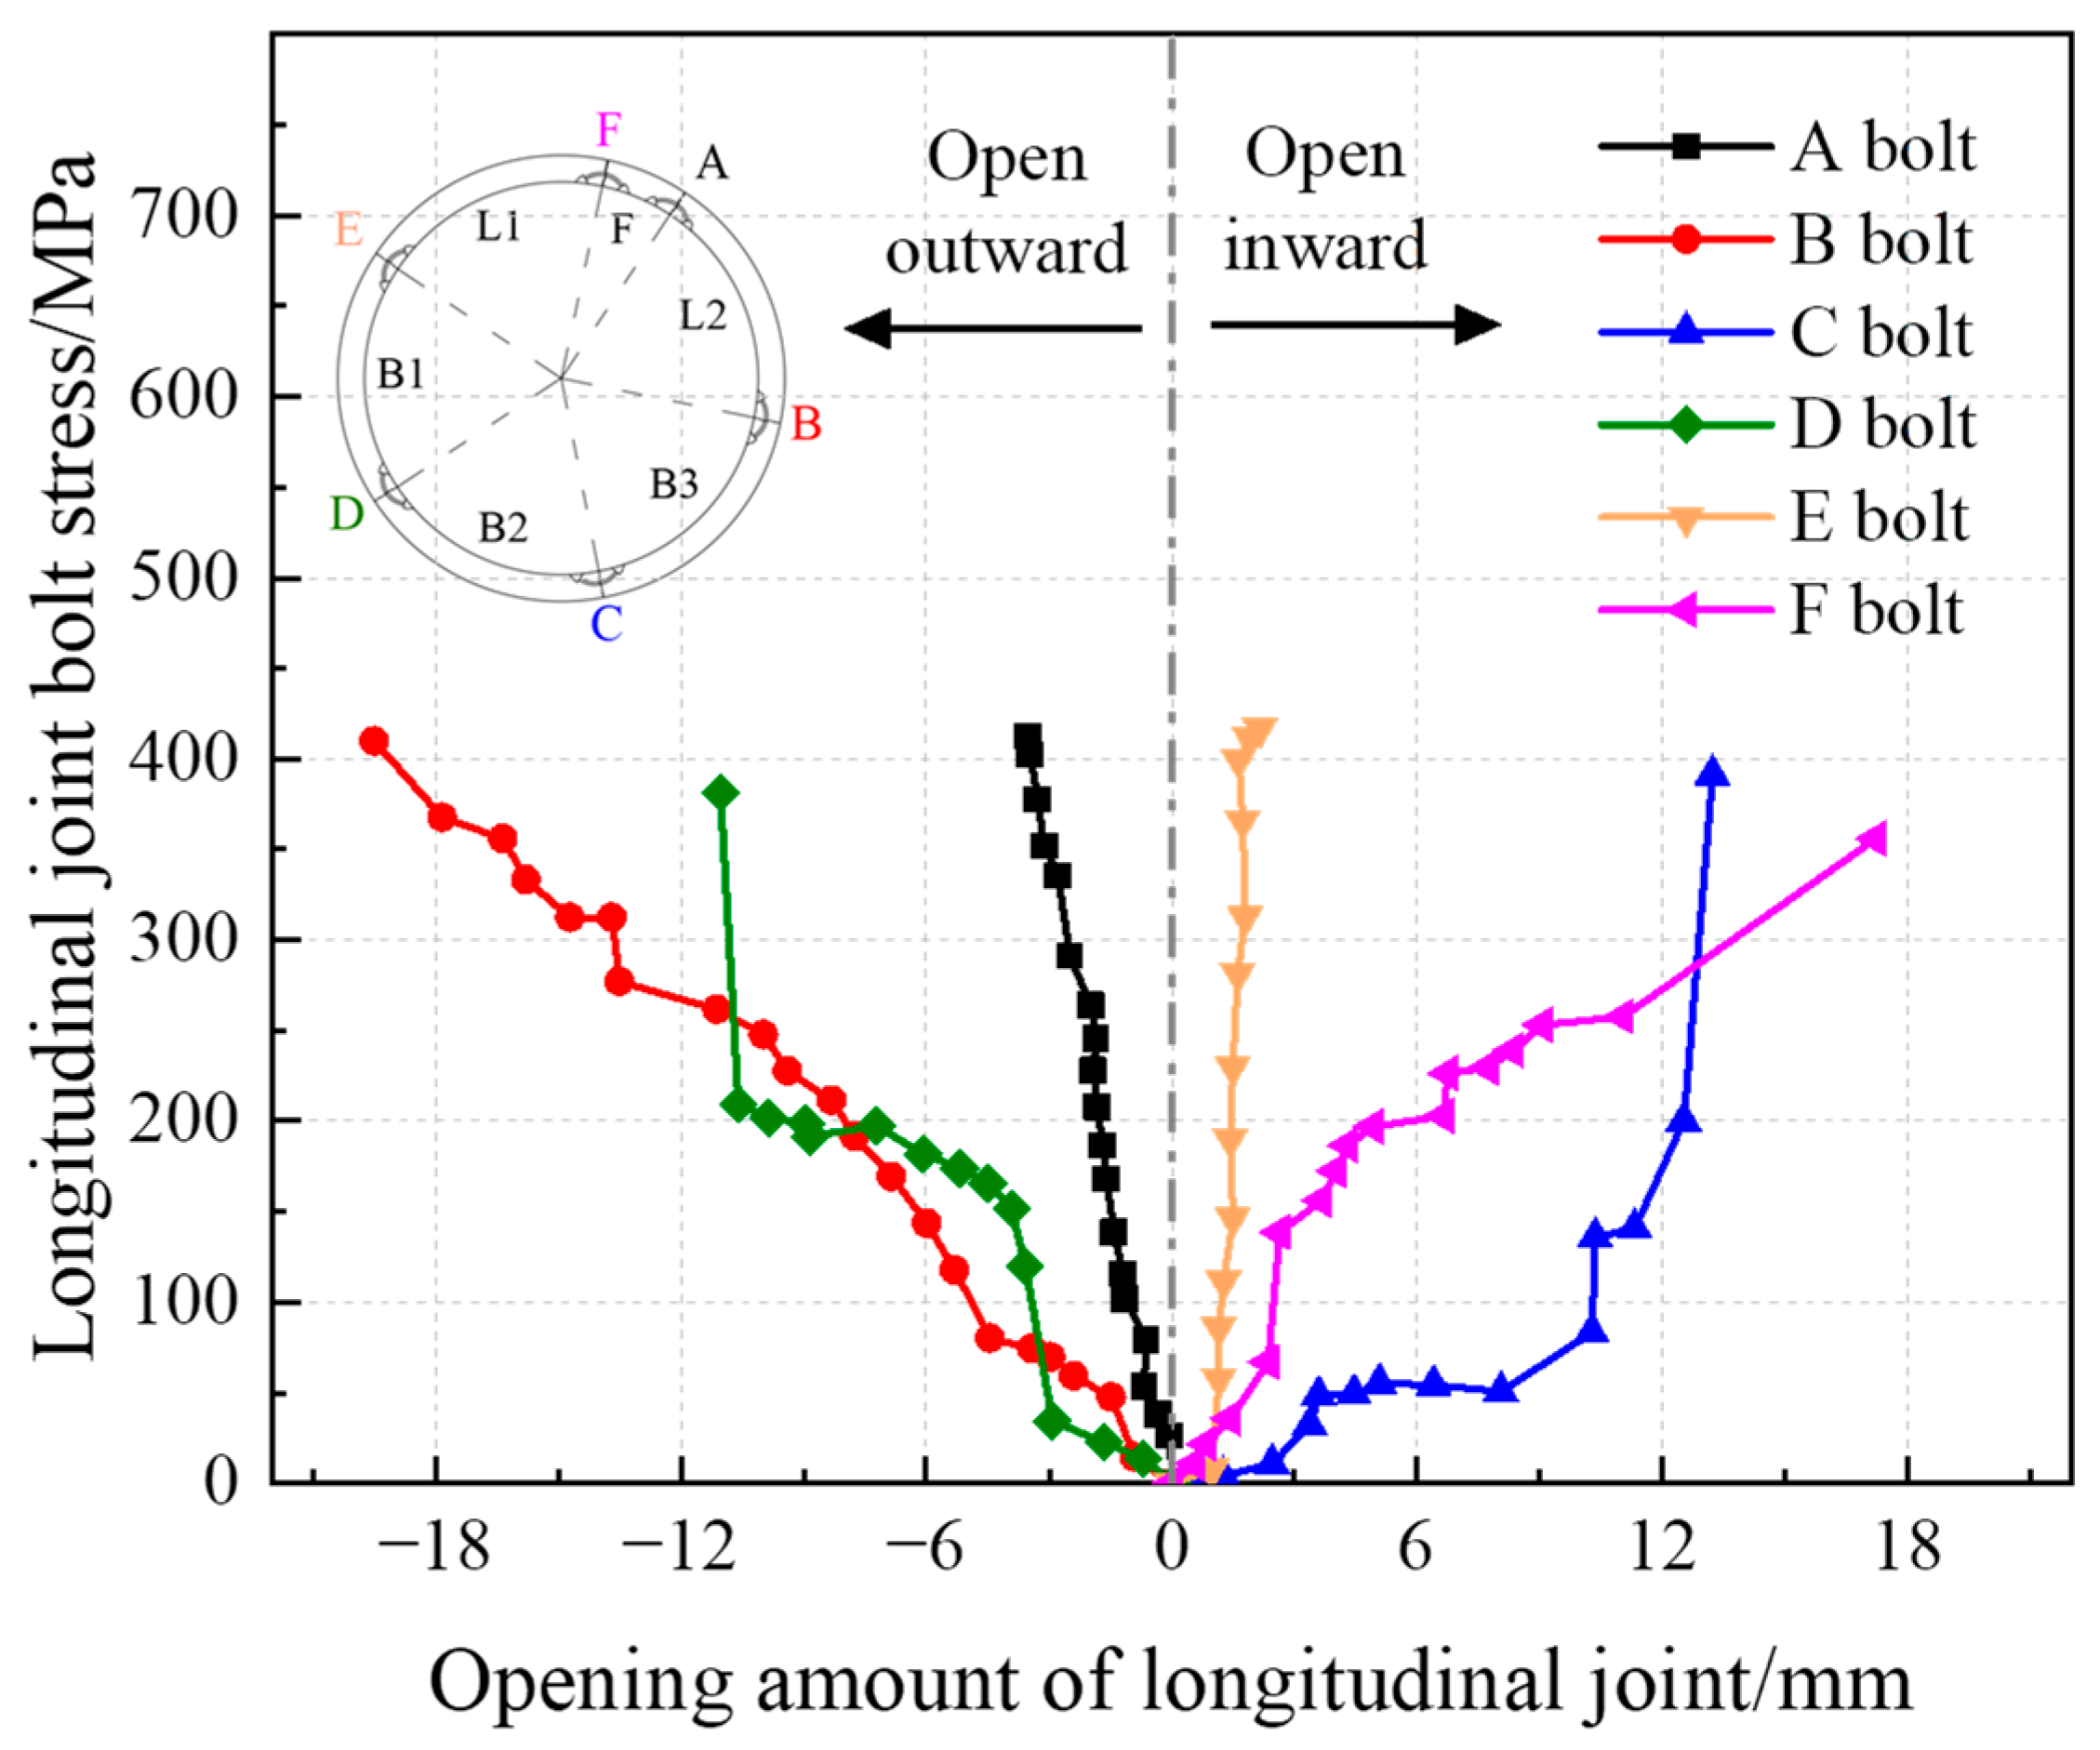
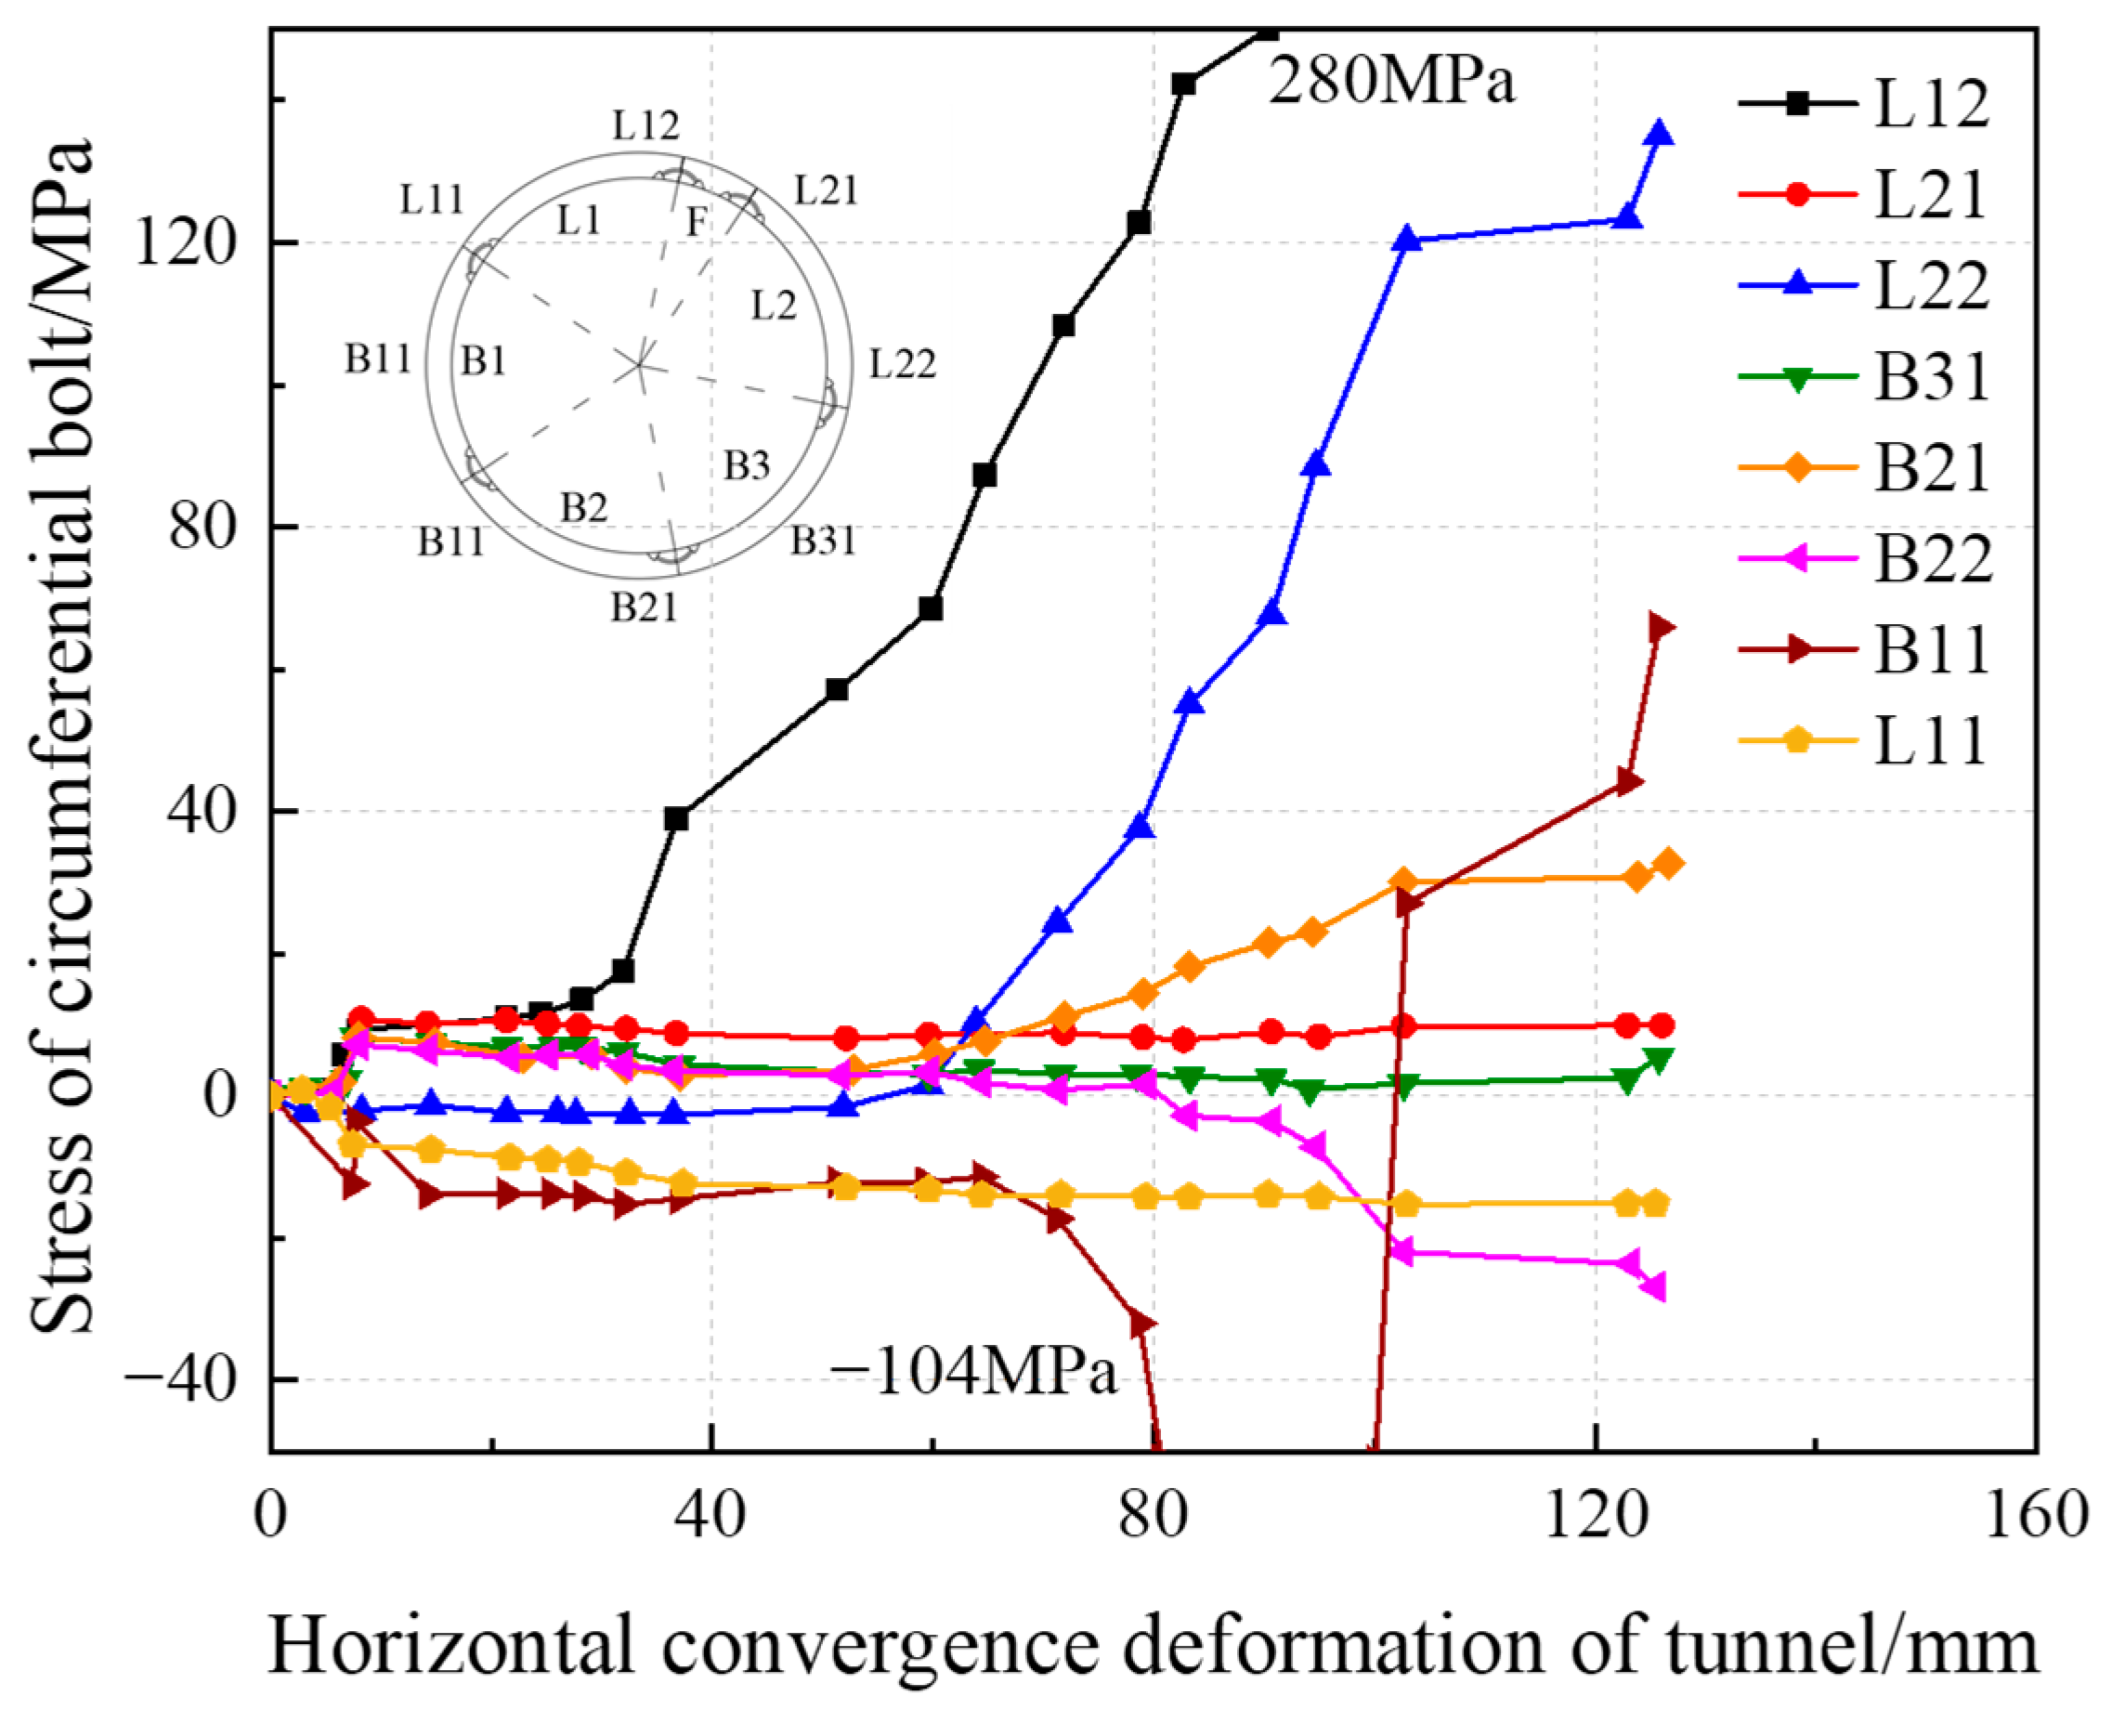
Figure 32 shows the variation of the opening of the longitudinal joints with the external load. It can be seen from the figure that the opening of the joint can be divided into an inner opening and outer opening. The inner opening joints are the C joint, E joint, and F joint. When P2 reaches the design load, the opening amounts of the C joint, E joint, and F joint are 0.91 mm, 0.82 mm, and 0.71 mm, respectively. After the shield tunnel enters the unloading stage, the opening amount of the E joint still increases at a small rate, while the opening amounts of the C joint and F joint exhibit a nonlinear increase. In the final failure state, the opening amounts of the E joint, C joint, and F joint are 3.93 mm, 12.48 mm, and 7.9 mm, respectively. The outer opening joints are the A joint, B joint, and D joint. When P2 reaches the design load, the opening amounts of the A joint, B joint, and D joint are 0.91 mm, 0.82 mm, and 0.71 mm, respectively. After the shield tunnel enters the unloading stage, the opening amount of the A joint still increases at a small rate, while the opening amounts of the B joint and D joint exhibit a nonlinear increase. In the final failure state, the opening amounts of the A joint, B joint, and D joint are 3.37 mm, 15.78 mm, and 10.64 mm, respectively. The final sequence of the opening amount of each joint is as follows: B > C > D > F > E > A.
Figure 33 shows the variation curves of the tunnel dislocation between the middle ring and upper ring. It can be seen from the figure that the middle ring moves inward relative to the upper ring in the sections at 0°, 180° and 270°, while the middle ring moves outward relative to the upper ring in the 90° section. Compared to the upper ring, the position of the longitudinal joint in the middle ring changes, and the side boundary of the middle ring is constrained by the upper ring and the lower ring simultaneously. These factors cause significant differences in the growth rate of the dislocation between different angles. When loading to the design load, the dislocations at 0°, 90°, 180°, and 270° are 0.24 mm, 0.71 mm, 1.12 mm, and 0.52 mm, respectively. After entering the unloading stage, the dislocations at 90° and 180° exhibit a nonlinear increase, while the dislocations at 0° and 270° still maintain a relatively small growth rate. In the final failure state, the dislocation in the sections at 0°, 90°, 180° and 270° increase to 5.91 mm, 7.56 mm, 9.68 mm, and 1.43 mm, respectively.

4.3.4. Bolt Stress

Figure 34 shows the relationship between the stress of the longitudinal joint bolts and the opening of longitudinal joints. It can be seen from the figure that for the inner opening joint, the stress of the A bolt increases rapidly with the opening of the joint, while the stress growth rate of the B and D bolts is relatively slow. For the outer opening joint, the bolt stress of both E and F increases rapidly with the opening of the joint, while the stress of the C bolt is relatively small in the early stage. When the opening of the C joint is greater than 7.9 mm, the stress of the C bolt begins to increase rapidly.
Figure 35 shows the relationship between the tunnel horizontal deformation and the circumferential bolt stress. It can be seen from the figure that when the tunnel convergence deformation is less than 25 mm, the stress of the circumferential bolt increases linearly with the tunnel deformation, and the stress of all circumferential bolts is relatively small. When the tunnel convergence deformation is greater than 25 mm, the stress of the L12 circumferential bolt at the top of the tunnel increases rapidly with the deformation. When the deformation is greater than 60 mm, the stress of the B11 and L22 bolts at the waist of the tunnel begins to increase rapidly, while the stress of circumferential bolts in other areas increases little.

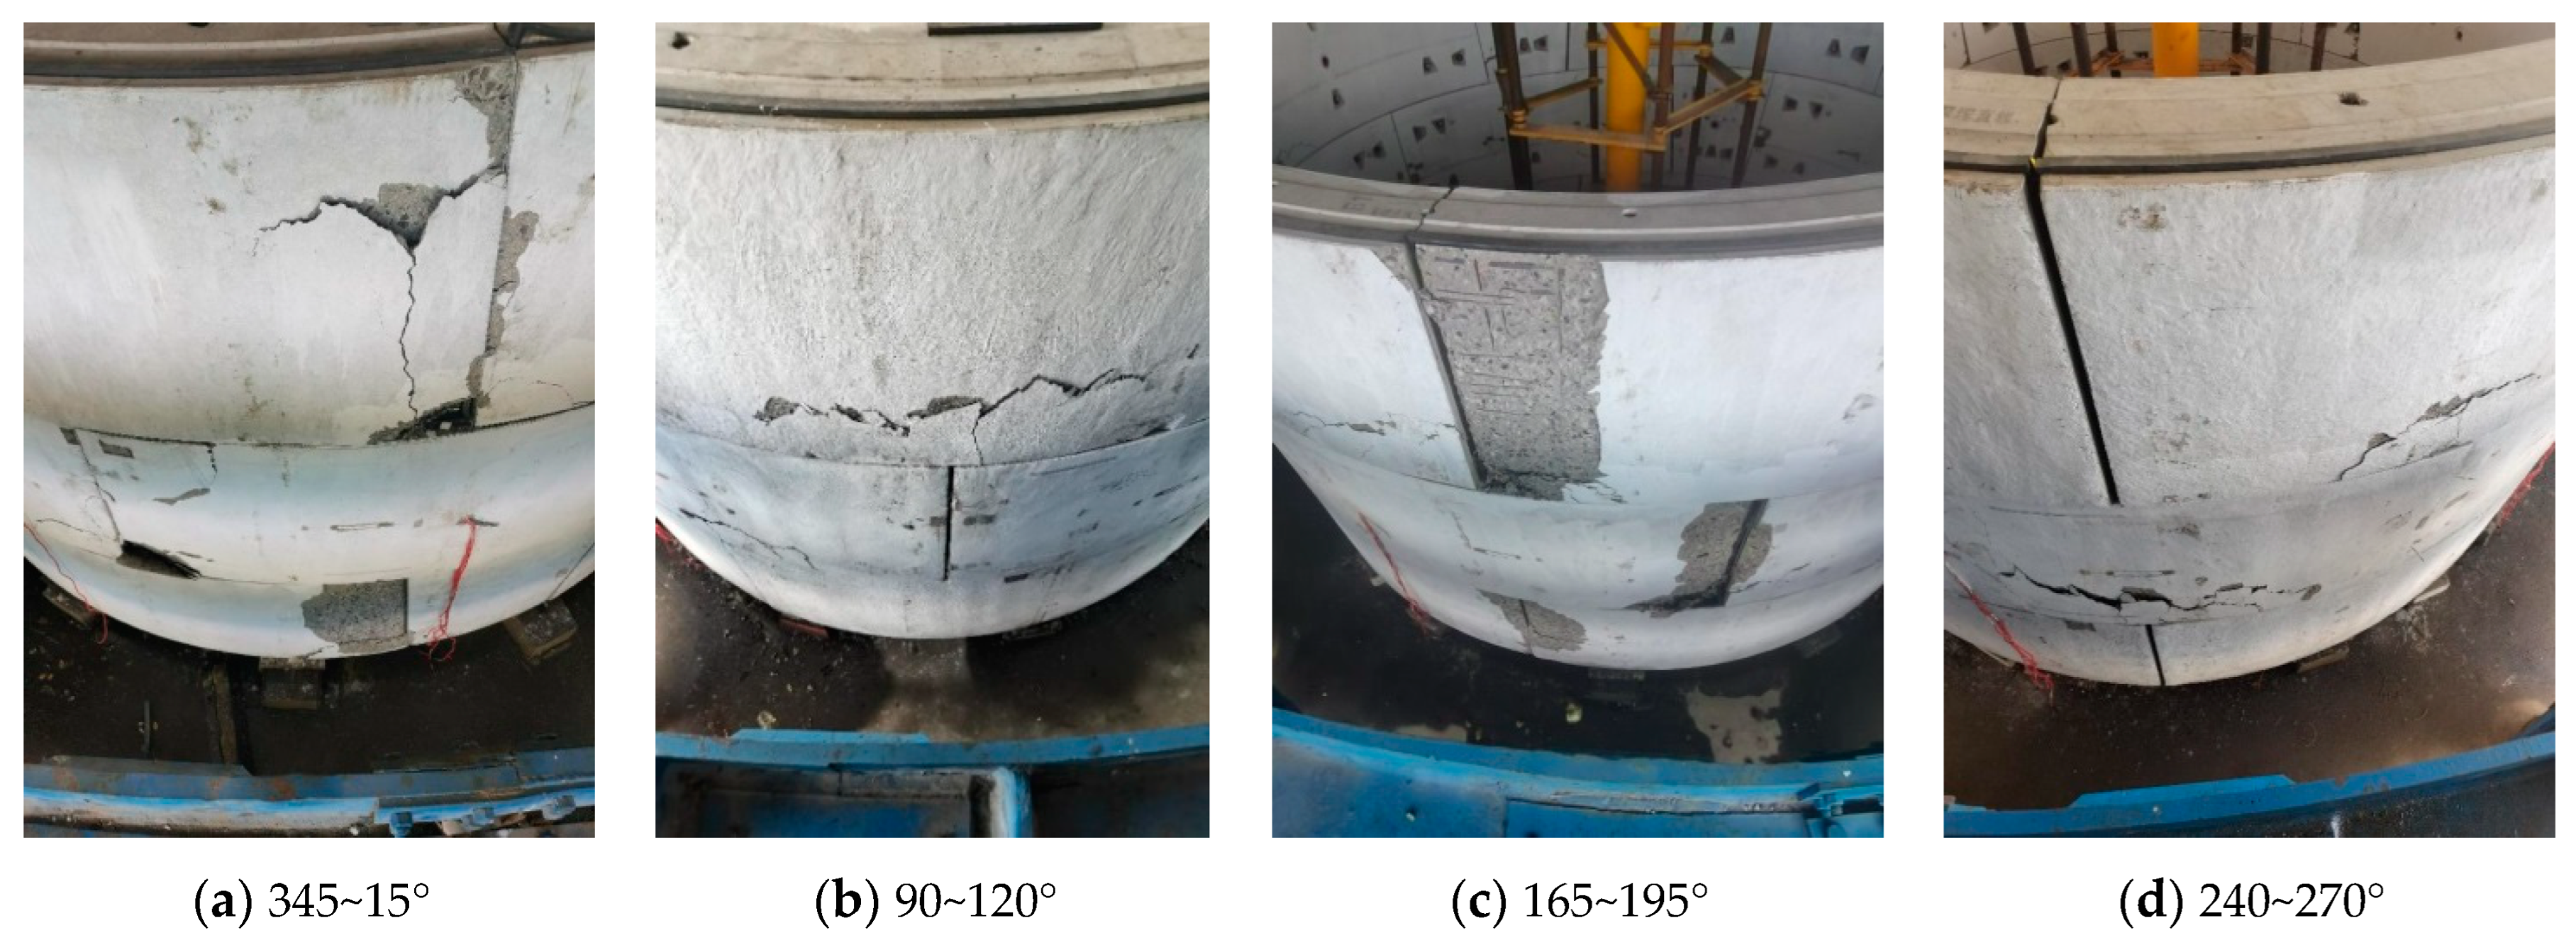
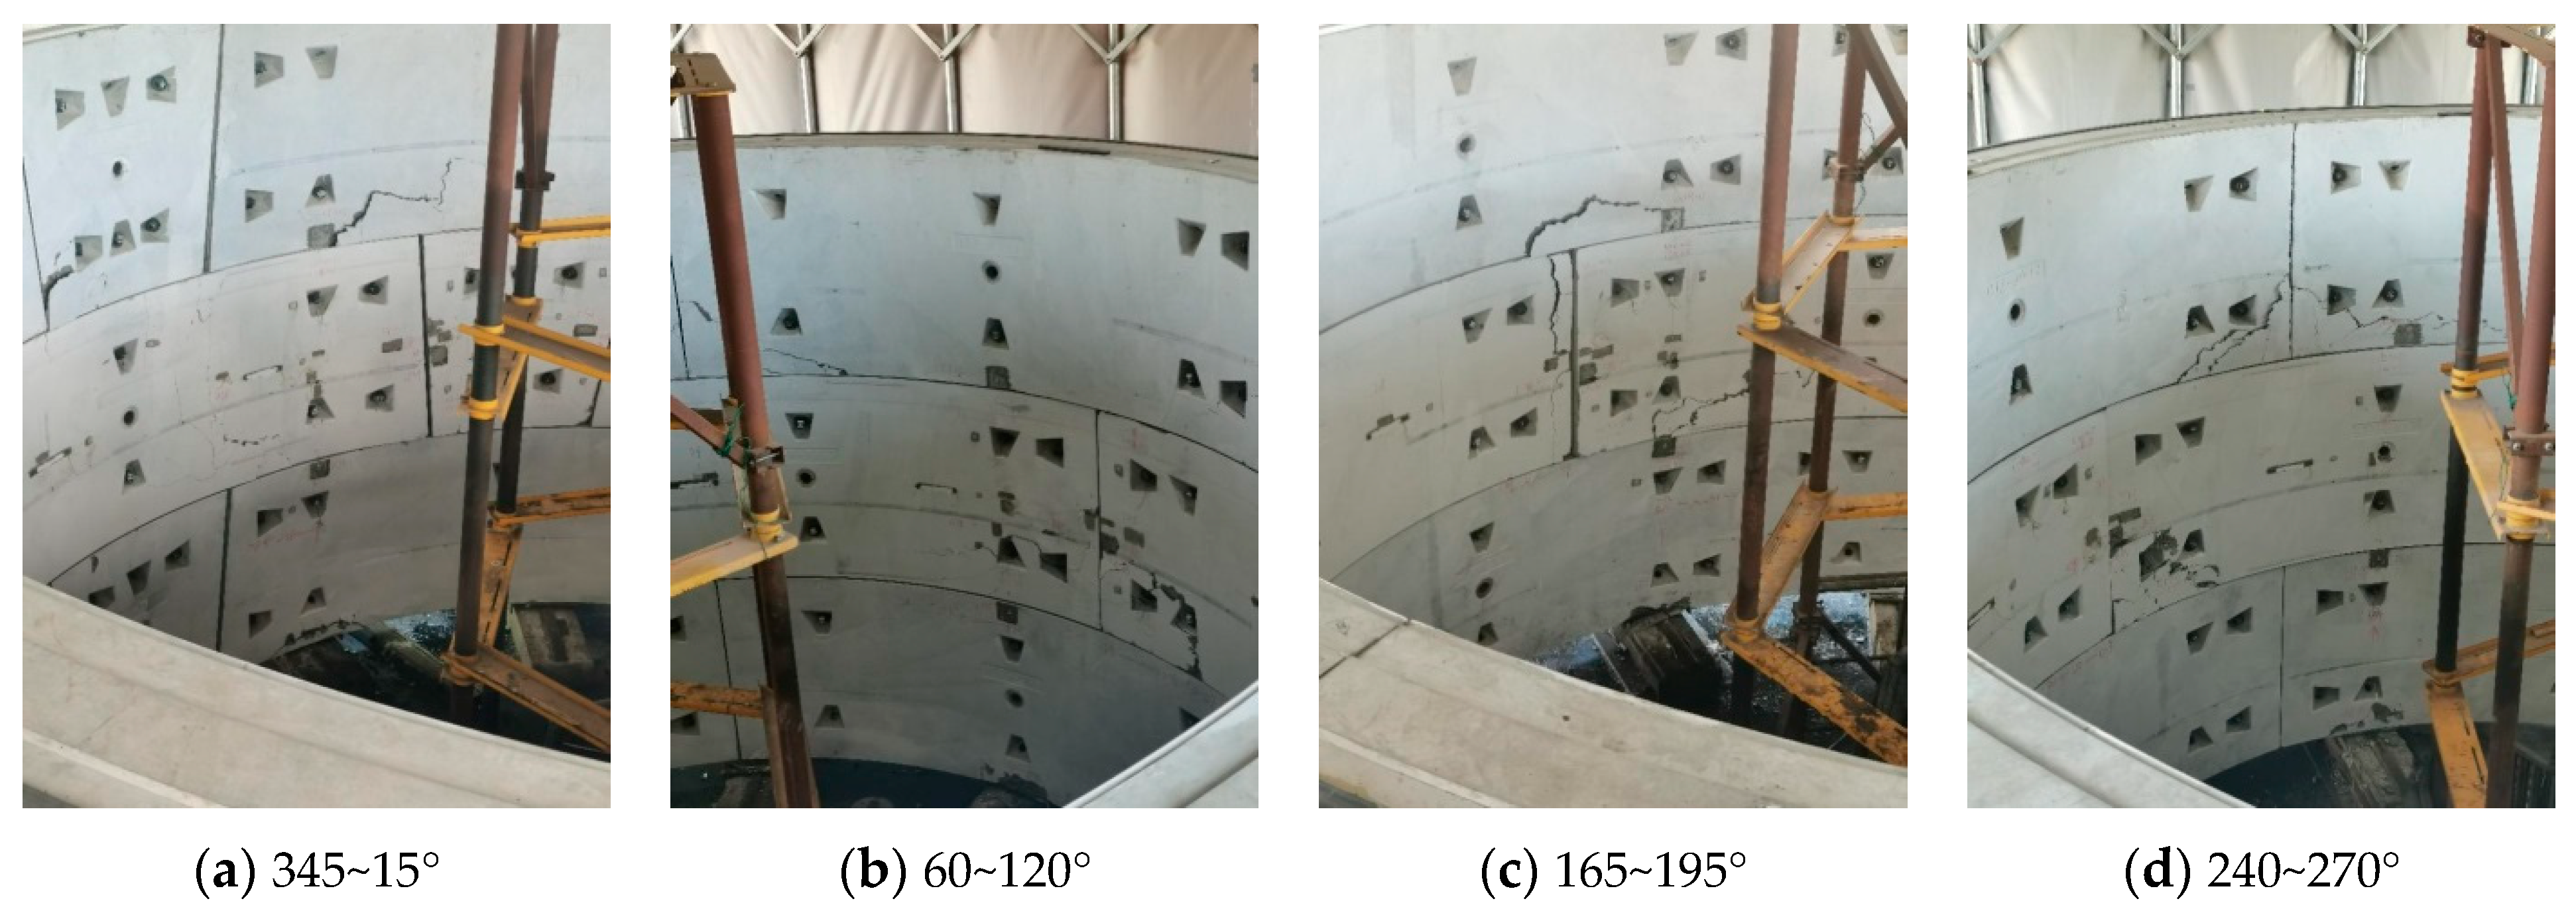
4.3.5. Distribution of Segment Crack

The cracks on the outer and inner surfaces of the tunnel segment are mainly concentrated at the joints between the rings. In the final failure state, the areas of the outer surface cracks are concentrated at 345~15°, 90~120°, 165~195° and 240~270°, corresponding to the tunnel top, bottom, and waist. The areas of the inner surface cracks are concentrated at 345~15°, 60~120°, 165~195°, and 240~270°. In the test, there is a relatively serious phenomenon of block falling from the outer side of the top and bottom of the tunnel. Furthermore, there are several through cracks at the outer surface of the tunnel top and bottom, as shown in Figure 36, Figure 37, Figure 38 and Figure 39.

5. Conclusions

In this paper, a 3D refined numerical model is established to analyze and determine the optimal segment thickness for the shield tunnel with an inner diameter of 5.9 m. A full-scale test is carried out to study the bearing performance of the shield tunnel under excavation unloading conditions. The main conclusion are as follows:
(1) Increasing the segment thickness to a certain degree can improve the structural stiffness and deformation resistance of the shield tunnel. When the thickness increases from 350 to 400 mm, the tunnel deformation decreases significantly. However, once the segment thickness continues to increase, the convergence deformation of the structure changes little.
(2) Under the excavation unloading condition, the bending moment transfer effect between the middle and upper rings continues to increase. The internal force of the tunnel structure increases significantly at positions of 0°, 55°, 125°, 190° and 270° as the surrounding load decreases. Compared to the design load stage, the maximum bending moment and axial force increase by 36% and 74.1%, respectively, in the final failure stage.
(3) At the excavation unloading stage, the dislocations at the 90° and 180° sections exhibit a nonlinear increase, while the dislocations at the 0° and 270° sections still maintain a relatively small growth rate.
(4) There was no bolt yield during the entire unloading process, indicating that the excessive strength of the bolt is not fully utilized in the entire life cycle of the large inner-diameter tunnel structure.
(5) In the final failure stage, due to the loss of the load-bearing capacity of the tunnel and the effect of the collaborative constraints between the upper and lower rings, the internal force of the middle ring of the tunnel decreases slightly.
(6) The failure mechanism of the shield tunnel can be described as follows: in the early stage of the external load, the shield tunnel will display joint openings and dislocations; as the load increases, cracks gradually appear near the tunnel joint in different directions; in the ultimate load stage, the shield tunnel will lose the load–bearing capacity, leading to falling blocks at the top and bottom of the tunnel.
(7) The optimal thickness of the shield tunnel is closely related to the tunnel structure profile and the surrounding geological environment. It is necessary to consider the inner diameter of the shield tunnel, the strength of the tunnel segment, the types of soil layers around the tunnel, and the distance from the surrounding construction.
(8) This paper discussed the bearing performance of the large inner diameter shield tunnels under symmetric unloading conditions. In practical situations, the external load applied to shield tunnels is not completely symmetrical due to the excavation of foundation pits or adjacent tunnel constructions. In the future, research can be focused on the bearing performance of the large inner-diameter shield tunnels under asymmetric unloading conditions.

Author Contributions

Conceptualization, X.Z.; methodology, X.Z.; software, C.L. (Cirong Lu); validation, C.L. (Cirong Lu); formal analysis, X.Z.; investigation, C.L. (Changbao Liu); resources, C.L. (Cirong Lu); data curation, C.L. (Cirong Lu); writing—original draft preparation, X.Z.; writing—review and editing, C.L. (Cirong Lu); visualization, C.L. (Changbao Liu); supervision, X.Z.; project administration, C.L. (Cirong Lu); funding acquisition, X.Z. All authors have read and agreed to the published version of the manuscript.

Funding

This research was funded by the National Natural Science Foundation of China grant number 52208443, China Postdoctoral Science Foundation grant number 2022M722958, Natural Science Foundation of Shanghai grant number 22ZR1466500, and Key R&D Program of Zhejiang grant number 2023C03182.

Institutional Review Board Statement

Not applicable.

Informed Consent Statement

Not applicable.

Data Availability Statement

The data presented in this study are available on request from the corresponding author. The data are not publicly available due to copyright restrictions.

Conflicts of Interest

Author Liu.C. was employed by the Powerchina Huadong Engineering Corporation. The remaining authors declare that the research was conducted in the absence of any commercial or financial relationships that could be construed as a potential conflict of interest.

References

  1. Mussa, M.H.; Mutalib, A.A.; Hamid, R.; Naidu, S.R.; Radzi, N.A.M.; Abedini, M. Assessment of damage to an underground box tunnel by a surface explosion. Tunn. Undergr. Space Technol. 2017, 66, 64–76. [Google Scholar] [CrossRef]
  2. Mussa, M.H.; Mutalib, A.A.; Hamid, R.; Raman, S.N. Blast damage assessment of symmetrical box-shaped underground tunnel according to peak particle velocity (PPV) and single degree of freedom (SDOF) criteria. Symmetry 2018, 10, 158. [Google Scholar] [CrossRef]
  3. Zeng, Y.; Njock, P.G.A.; Xiong, W.; Zhang, X.-L.; Shen, S.-L. Risks analysis of large diameter slurry shield tunneling in urban area. Undergr. Space 2023, 13, 281–300. [Google Scholar] [CrossRef]
  4. Zhao, Z.; Cui, J.; Liu, C.; Liu, H.; Rehman, M.U.; Chen, W.; Peng, Z. Seismic damage characteristics of large-diameter shield tunnel lining under extreme-intensity earthquake. Soil Dyn. Earthq. Eng. 2023, 171, 107958. [Google Scholar] [CrossRef]
  5. Su, D.; Song, Q.; Lin, X.; Li, Q.; Chen, X. Limit equilibrium models for active failures of large-diameter shield tunnel faces in soft clay reinforced with soil–cement walls. Comput. Geotech. 2023, 153, 105104. [Google Scholar] [CrossRef]
  6. Gao, F.; Ye, J.; Zhao, C.; Bian, X. Soil disturbance induced by shield tunnelling in sensitive clay: In Situ test and analyses. Transp. Geotech. 2023, 42, 101106. [Google Scholar] [CrossRef]
  7. Zheng, G.; Wang, R.; Lei, H.; Zhang, T.; Fan, Q. Load-transfer-associated settlements of a piled building during shield tunnelling in soft ground. Tunn. Undergr. Space Technol. 2023, 133, 104964. [Google Scholar] [CrossRef]
  8. Song, X.; Meng, F.-Y.; Chen, R.-P.; Wang, H.-L.; Wu, H.-N. Effect of seepage on soil arching effect in deep shield tunnel. Undergr. Space 2023, 12, 218–233. [Google Scholar] [CrossRef]
  9. Liu, C.; Peng, Z.; Cui, J.; Huang, X.; Li, Y.; Chen, W. Development of crack and damage in shield tunnel lining under seismic loading: Refined 3D finite element modeling and analyses. Thin-Walled Struct. 2023, 185, 110647. [Google Scholar] [CrossRef]
  10. Zhao, S.; Zhang, D.; Xue, Y.; Zhou, M.; Huang, H. A deep learning-based approach for refined crack evaluation from shield tunnel lining images. Autom. Constr. 2021, 132, 103934. [Google Scholar] [CrossRef]
  11. Zhang, Z.; Liang, R.; Li, Z.; Kang, C.; El Naggar, M.; Xiao, M.; Wu, W. Analytical solution for longitudinal deformation of shield tunnel induced by overcrossing tunnelling considering circumferential joints. J. Rock Mech. Geotech. Eng. 2023, 15, 2355–2374. [Google Scholar] [CrossRef]
  12. Zhang, J.; He, C.; Geng, P.; He, Y.; Wang, W. Improved longitudinal seismic deformation method of shield tunnels based on the iteration of the nonlinear stiffness of ring joints. Sustain. Cities Soc. 2019, 45, 105–116. [Google Scholar] [CrossRef]
  13. Li, R.; Lei, H.; Ma, C.; Liu, Y.; Liu, N. The development of sand erosion induced by shield-tunnel joint leakage. Eng. Fail. Anal. 2023, 148, 107068. [Google Scholar] [CrossRef]
  14. Shi, C.; Chao, C.; Lei, M.; Peng, L.; Ai, H. Effects of lateral unloading on the mechanical and deformation performance of shield tunnel segment joints. Tunn. Undergr. Space Technol. 2016, 51, 175–188. [Google Scholar] [CrossRef]
  15. Liu, J.; Shi, C.; Lei, M.; Wang, Z.; Cao, C.; Lin, Y. A study on damage mechanism modelling of shield tunnel under unloading based on damage–plasticity model of concrete. Eng. Fail. Anal. 2021, 123, 105261. [Google Scholar] [CrossRef]
  16. Wu, H.N.; Chen, S.; Chen, R.P.; Cheng, H.Z.; Feng, D.L. Deformation behaviors and failure mechanism of segmental RC lining under unloading condition. Tunn. Undergr. Space Technol. 2022, 130, 104687. [Google Scholar] [CrossRef]
  17. Guo, W.; Feng, K.; Lu, X.; Qi, M.; Liu, X.; Fang, Y.; He, C.; Xiao, M. Model test investigation on the longitudinal mechanical property of shield tunnels considering internal structure. Tunn. Undergr. Space Technol. 2023, 140, 105293. [Google Scholar] [CrossRef]
  18. Guo, R.; Zhang, M.; Xie, H.; He, C.; Fang, Y.; Wang, S. Model test study of the mechanical characteristics of the lining structure for an urban deep drainage shield tunnel. Tunn. Undergr. Space Technol. 2019, 9, 103014. [Google Scholar] [CrossRef]
  19. Zhang, J.-Z.; Huang, H.-W.; Zhang, D.-M.; Phoon, K.K. Experimental study of the coupling effect on segmental shield tunnel lining under surcharge loading and excavation unloading. Tunn. Undergr. Space Technol. 2023, 140, 105199. [Google Scholar] [CrossRef]
  20. Wei, G.; Feng, F.; Cui, Y.; Wang, X.; Diao, H.; Wu, Y. Research on the influence of foundation pit excavation on the lateral force and deformation of side shield tunnels based on full-scale experiments. Tunn. Undergr. Space Technol. 2023, 140, 105236. [Google Scholar] [CrossRef]
  21. Liang, K.; Feng, K.; Zhang, L.; He, C.; Su, A.; Guo, W. Failure mechanism of underwater shield tunnel: An experimental and theoretical study. Tunn. Undergr. Space Technol. 2023, 137, 105155. [Google Scholar] [CrossRef]
  22. Liu, X.; Dong, Z.; Bai, Y.; Zhu, Y. Investigation of the structural effect induced by stagger joints in segmental tunnel linings: First results from full-scale ring test. Tunn. Undergr. Space Technol. 2017, 66, 1–18. [Google Scholar] [CrossRef]
  23. Jin, H.; Yu, K.; Gong, Q.; Zhou, S. Load-carrying capability of shield tunnel damaged by shield shell squeezing action during construction. Thin-Walled Struct. 2018, 132, 69–78. [Google Scholar] [CrossRef]
  24. Jin, H.; Yu, K.; Zhou, S.; Gong, Q.; Yan, H. Performance assessment of shield tunnel damaged by shield shell extrusion during construction. Int. J. Civ. Eng. 2019, 17, 1015–1027. [Google Scholar] [CrossRef]
  25. Zhang, X.; Jin, H.; Yu, S.; Bi, X.; Zhou, S. Analysis of bending deflection of tunnel segment under load- and corrosion-induced cracks by improved XFEM. Eng. Fail. Anal. 2022, 140, 106576. [Google Scholar] [CrossRef]
  26. Yu, S.; Jin, H.; Cao, M.; Liu, C. Effect of straight bolt corrosion on mechanical properties of shield tunnel under DC stray current. Structures 2022, 45, 1607–1620. [Google Scholar] [CrossRef]
  27. Zhang, X.; Zhou, S.; Di, H.; Wang, P.; Wang, J. Semi–analytical solution for ultimate bearing capacity of straight–jointed segmental tunnel lining. Tunn. Undergr. Space Technol. 2023, 138, 105160. [Google Scholar]
Figure 1. Partition of each shield tunnel ring.
Applsci 13 11871 g001
Figure 2. Numerical model of three rings of the shield tunnel.
Applsci 13 11871 g002
Figure 3. Assembly method of adjacent tunnel rings.
Applsci 13 11871 g003
Figure 4. Different types of numerical segment model: (a) key block, (b) adjacent block, and (c) standard block.
Applsci 13 11871 g004
Figure 5. Diagram of the distribution of joint bolts in the segment model: (a) circumferential joint bolt and (b) longitudinal joint bolt.
Applsci 13 11871 g005
Figure 6. Distribution of rebar in the tunnel model.
Applsci 13 11871 g006
Figure 7. Diagram of the size of the tunnel segment rebar.
Applsci 13 11871 g007
Figure 8. Tensile stress–strain curve of the concrete.
Applsci 13 11871 g008
Figure 9. Compressive stress–strain curve of the concrete.
Applsci 13 11871 g009
Figure 10. Diagram of different burial depths of the shield tunnel.
Applsci 13 11871 g010
Figure 11. External load mode diagram of the shield tunnel.
Applsci 13 11871 g011
Figure 12. External loads applied in the numerical model.
Applsci 13 11871 g012
Figure 13. Boundary constraints of the tunnel model.
Applsci 13 11871 g013
Figure 14. Diagram of the effect of excavation unloading on the tunnel.
Applsci 13 11871 g014
Figure 15. Convergence deformation curves of tunnel under different burial depths: (a) horizontal deformation and (b) vertical deformation.
Applsci 13 11871 g015
Figure 16. Tunnel convergence deformation normalization diagram under different burial depths: (a) horizontal variation and (b) vertical variation.
Applsci 13 11871 g016
Figure 17. Convergence deformation curves of the tunnel under different loading ratios: (a) horizontal deformation value and (b) vertical deformation value.
Applsci 13 11871 g017
Figure 18. Tunnel convergence deformation normalization diagram under different loading ratios: (a) horizontal variation value and (b) vertical variation value.
Applsci 13 11871 g018
Figure 19. Horizontal loading test method for the shield tunnel: (a) distribution of loading point, (b) horizontal loading beam, and (c) horizontal loading instrument photo.
Applsci 13 11871 g019
Figure 20. Vertical load device on the tunnel: (a) distribution of loading points, (b) loading beam, and (c) device photo in the test.
Applsci 13 11871 g020
Figure 21. Arrangement of displacement measurement for shield tunnel structure: (a) distribution of displacement measurement points, (b) support rod, and (c) displacement sensor.
Applsci 13 11871 g021
Figure 22. Arrangement of interforce measurement for shield tunnel structure: (a) distribution of interforce measurement points, (b) vibrating wire stress gauge, and (c) resistance strain gauge.
Applsci 13 11871 g022
Figure 23. Diagram of the bolt measurement point arrangement.
Applsci 13 11871 g023
Figure 24. Diagram of the joint opening measurement point arrangement.
Applsci 13 11871 g024
Figure 25. Diagram of the joint dislocation measurement point arrangement.
Applsci 13 11871 g025
Figure 26. Relationship between the convergence deformation and the lateral load.
Applsci 13 11871 g026
Figure 27. Cross-sectional deformation of the tunnel under different loads.
Applsci 13 11871 g027
Figure 28. Comparison of the horizontal convergence deformation between the numerical model and the full-scale test.
Applsci 13 11871 g028
Figure 29. Cross-sectional deformation of the shield tunnel when unloading 64 kN between the numerical model and the full-scale test.
Applsci 13 11871 g029
Figure 30. Bending moment variation curve under different loads.
Applsci 13 11871 g030
Figure 31. Axial force variation curve under different loads.
Applsci 13 11871 g031
Figure 32. Joint opening variation curve under different loads.
Applsci 13 11871 g032
Figure 33. Dislocation variation curve under different loads.
Applsci 13 11871 g033
Figure 34. Relationship curve between the longitudinal bolt and the tunnel joint opening.
Applsci 13 11871 g034
Figure 35. Relationship curve between the circumferential bolt and the tunnel horizontal deformation.
Applsci 13 11871 g035
Figure 36. Diagram of the crack distribution on the outer surface of the tunnel segment.
Applsci 13 11871 g036
Figure 37. Photos of the cracks on the outer surface of the tunnel segment at different angles.
Applsci 13 11871 g037
Figure 38. Diagram of crack distribution on the inter surface of the tunnel segment.
Applsci 13 11871 g038
Figure 39. Photos of the cracks on the inter surface of the tunnel segment at different angles.
Applsci 13 11871 g039
Table 1. Concrete parameters used in the FEM model.
Ec/GPaνψκfb0/fc0Kcμ
200.238°0.11.160.6670.001
Table 2. Uniaxial stress–strain relationship and concrete damage parameters.
Compressive BehaviorTensile Behavior
Yield Stress/MPaInelastic StrainDamage ParameterYield Stress/MPaCracking StrainDamage Parameter
22.663797003.21200600
32.4072990.000620.2072.6472910.0000240.115139
30.2633240.001100.3132.2711040.0000640.266938
26.1879980.001640.4151.8276340.0001050.399685
22.2057420.002180.5011.4991560.0001440.496630
18.8845960.002690.5691.2649510.0001790.567478
16.2366370.003180.6230.9655780.0002430.662001
14.1390700.003660.6660.6677700.0003630.762434
12.4647490.004120.7010.4323690.0005900.847499
10.5302910.004790.7420.2718030.0010350.907989
8.4885880.005770.7860.1692770.0019170.946488
6.5342310.007200.8310.1051930.0036730.969498
4.8311390.009300.8710.0653760.0071740.982788
2.8365980.014800.9210.0407130.0141370.990323
Table 3. External loads on the shield tunnel under different buried depth/kPa.
Buried Depth/mP1P2P3P4
10255281179244
15267298187261
20356383249325
Table 4. Calculation load table under different load ratios when the buried depth is 15 m.
Load RatiosP1/kNP2/kNP3/kNP4/kN
0.75267298200285
0.72267298192274
0.70267298187261
0.68267298182258
0.66267298176251
0.65267298174247
Disclaimer/Publisher’s Note: The statements, opinions and data contained in all publications are solely those of the individual author(s) and contributor(s) and not of MDPI and/or the editor(s). MDPI and/or the editor(s) disclaim responsibility for any injury to people or property resulting from any ideas, methods, instructions or products referred to in the content.

