Article

Using Eye Tracking to Reveal Responses to the Built Environment and Its Constituents

by
Hernan J. Rosas
1,2,
Ann Sussman
1,
Abigail C. Sekely
1 and
Alexandros A. Lavdas
1,3,4,*
1
The Human Architecture and Planning Institute, Inc., 43 Bradford St, Concord, MA 01742, USA
2
School of Architecture, Planning, and Preservation, The University of Maryland, 3835 Campus Drive, College Park, MD 20742, USA
3
Eurac Research, Institute for Biomedicine, Affiliated Institute of the University of Lübeck, Via A. Volta 21, 39100 Bolzano, Italy
4
Department of Psychology, Webster University, Athens Campus, 9 Ipitou Street, 10557 Athens, Greece
*
Author to whom correspondence should be addressed.
Appl. Sci. 2023, 13(21), 12071; https://doi.org/10.3390/app132112071
Submission received: 19 September 2023 / Revised: 25 October 2023 / Accepted: 27 October 2023 / Published: 6 November 2023

Abstract

:
Eye-tracking technology has numerous applications in both commercial and research contexts. The recent introduction of affordable wearable sensors has significantly broadened the scope of potential uses, spanning fields such as computer gaming, education, entertainment, health, neuromarketing, and psychology, among others. Another development is the use of downloadable software, which permits participants to record their responses to presented images with the use of calibrated webcams without leaving their homes, allowing for easier recruitment of larger numbers of study volunteers online. This paper reviews findings from seven Building Studies conducted by the Human Architecture + Planning Institute with iMotions-Online eye-tracking software, highlighting the significance of the new technology and its ability to assess the human experience of the built environment, as well as its limitations. Overall, images with a certain type of organized complexity, such as that found in nature and pre-modern architecture, attracted the gaze faster and kept it for significantly longer, as compared to images lacking these features. These results add to our existing knowledge about environmental complexity and give us insights into non-conscious and early conscious actions such as first gaze attraction, helping us understand the role of specific morphological features in the architectural/environmental experience.

1. Introduction

Biometrics is the field pertaining to measuring and analyzing human bodily and behavioral characteristics. The former can be used for authentication purposes, while the latter are usually applied for monitoring behavioral responses to environmental stimuli. Eye-tracking tools that follow eye movements belong to the second group, and can help us gain insights on how we take in visual stimuli. It is a technology ideally suited for side-by-side comparisons of different structures, where quantitative and semi-quantitative data of relative parameters can be directly compared. This second type has been used by a number of researchers, including some of the authors of the present study, to examine images of architecture and built structures both by eye-tracking volunteers [1,2,3] and with Artificial Intelligence (AI) eye-tracking simulation [4,5,6].
These studies delved into the initial focusing of attention in individuals’ gazes when they first encounter various types of images. This initial focusing is informed by pre-attentive processing in the brain. Neurons in the initial stages of perception are specialized to detect basic visual attributes like differences in brightness, contrasting colors and, further down the processing chain, in the visual cortex, to characteristics such as orientation, direction, and speed of movement (for a review see [7]). These visual features are computed pre-attentively in a parallel manner, creating an early “saliency map” [8]. These are not only feedforward processes, but they lso incorporate feedback in the most advanced stages.
Given the critical importance of quick and appropriate responses to environmental cues for survival, it is to be expected that a failure in this early registration mechanism could lead to a heightened sense of potential danger and stress. In broad terms, any environment that visually deviates from what we have come to consider as “safe”, based on our evolutionary history, has the potential to evoke feelings of anxiety. An environment that is not easy to register can feel unsafe, and research has already linked stress to surroundings lacking a certain level of organized complexity [9], an effect related to sensory input deprivation [10].
The initial eye-tracking and AI-simulated eye-tracking work, mentioned above, has yielded several intriguing findings. An immediate observation was that early gaze, informed by pre-attentive processing, consistently gravitated towards the presence of people, especially their faces, even when they appeared within images of architectural or urban scenes. Additionally, it was demonstrated that the gaze was naturally drawn towards specific elements such as details, contrasts, and structural aspects that and structures that make overall geometrical sense.
The meaning of “geometrical sense” has to be explained here: Pioneering work of Christopher Alexander [11] has identified a number of parameters that contribute to a special connectedness between the viewer and the surroundings. It has been shown [12,13] that the exposure to certain fractal visual patterns [14] both in nature and architecture, as well as visual arts, has measurable physiological effects. The recruitment of the Default Mode Network of the brain (a functional network mostly related to “internal” thought processes, as opposed to task execution) during the visual perception of fractals can be considered as an indicator of their privileged state in terms of perceptual fluency [15,16]. While clinical benefits from exposure to nature scenes have been shown in many investigations for the last decades (including even an early finding of improved recovery from surgery [17]), such effects can also result from exposure to artificial environments mimicking nature’s geometrical qualities [18,19]. It should be noted that there is more to these qualities than their fractal properties, as pioneering work of Nikos Salingaros has shown [20,21,22]. Our processing “… system is acutely tuned to the visual complexity of the natural environment, specifically to respond positively to the highest levels of organized complexity. Fractals are an important component of this effect, but by no means represent the full gamut of connective qualities” [23]. This “organized complexity”, found both in nature and in pre-modern architecture, is also defined by a hierarchy of scales, the presence of local contrasts, as well as overall coherence. The experience of beauty, often ignored in modern architecture, represents the sum total of a multiparametric evaluation of a scene, is anything but arbitrary, and should be considered as a necessity, not a luxury [24]. Further discussion about these topics can be found in the relevant literature, and is beyond the scope of this introduction.
In the seven Building Studies presented here, we eye-tracked a large number of images of buildings, urban environments. natural scenes, and objects with certain features in paired combinations, including, among others, images from the Harris Poll study of the National Civic Arts Society [25]. Preference surveys, like the 2020 Harris Poll commissioned by the NCAS offer insights into the conscious preferences for designs. This survey of over 2000 Americans, found that 72% of people preferred traditional architecture over modern for United States federal buildings. The preference held true regardless of age, sex, race, or political affiliation. However, uncovering the underlying unconscious perceptual processes correlated with this preference requires further exploration. Building Study-1 sought to address this aspect, and the photographic material was chosen exactly because it had been previously assessed in a preference survey. The theme of this and the other eye-tracking studies presented here was to correlate early gaze behavior with the presence of specific geometric features (such as discussed above) in the presented material—and, when available, with preference feedback for the same material. More images, appropriate for further examining some of these features of interest in isolation, were used to investigate how their presence and configuration would affect early gaze.
We hypothesized that the human gaze would fixate first on images of buildings with features of organized complexity, natural scenes, and face-like features/fenestration and dwell on these images for longer. The findings, which confirmed our hypothesis to various degrees, are presented and discussed here.

2. Materials and Methods

2.1. Software

The seven studies used biometric software, developed by the behavioral research company iMotions [26]. iMotions’ Online, which was released in 2020, combines webcam-based eye-tracking and facial expression analysis (AFFECTIVA) software. Data collected is stored on an online iMotions account and processed with iMotions software installed on a Windows-based computer.

2.2. Image Presentation and Data Acquisition

In these studies we posted the call for participants on the GeneticsofDesign.com blog and also announced them on social media (Facebook, Twitter, LinkedIn, and ResearchGate) and via email, with no special demographic targeting or demographic information collected. Participants followed a web link to access the study from their computers with a web camera for all Building Studies. They were asked to have ample lighting throughout the study to ensure accurate results. The study paused if a participant’s head position shifted and restarted when repositioned correctly. For each study, there was an initial calibration phase for the camera/software setup. Users were first asked what type of device they were using (desktop/laptop/tablet) and asked to allow their webcam to start functioning. An outline of the desired head position appeared superimposed on the webcam image, and users were asked to make sure that their head was in that position and to avoid moving it for the duration of the data recording. Then a series of black screens with white crosshairs appeared at different screen positions, one at a time, after the users had been notified, and asked to gaze at the crosshairs. No further instructions were given (like prompts for comparison etc). The study images were then presented side-by-side. Pairs of images were presented for 12 s with a 0.5-s black transition slide appearing between them, By recording up to 12 s, we incorporated both pre-attentive and early attention-driven eye movements.
All participants saw images in the same order. The resolution of the images on the screen was 1920 × 1080 pixels. Each study ended with a post-calibration of the respondents’ web camera with crosshairs, like in the beginning, to account for potential head movement in the intervening time. The total time participants spent completing each study ranged from four to seven minutes. Participant data were automatically uploaded to an online iMotions account. When the collection of data was complete, the data were downloaded for processing on the iMotions desktop software. This software analyzed eye-tracking data, generated aggregate heatmaps, processed Areas of Interest (AOI), and coded facial expressions.

2.3. Content of the 7 Studies

The images (51 sets, mostly in pairs or, in a few cases, in 3) were divided into five categories for analysis: modern vs. traditional buildings/poor vs. rich texture/fenestrations/presence of eyes and face-like features/artificial vs. natural scenes. With the exception of study 1, which contained only modern vs. traditional building comparisons, each of the other studies contained comparisons for more than one categories, so, for example, both studies 5 and 6 contained comparisons of images with different fenestration.
The content of each study was as follows:
Building Studies #1–#7
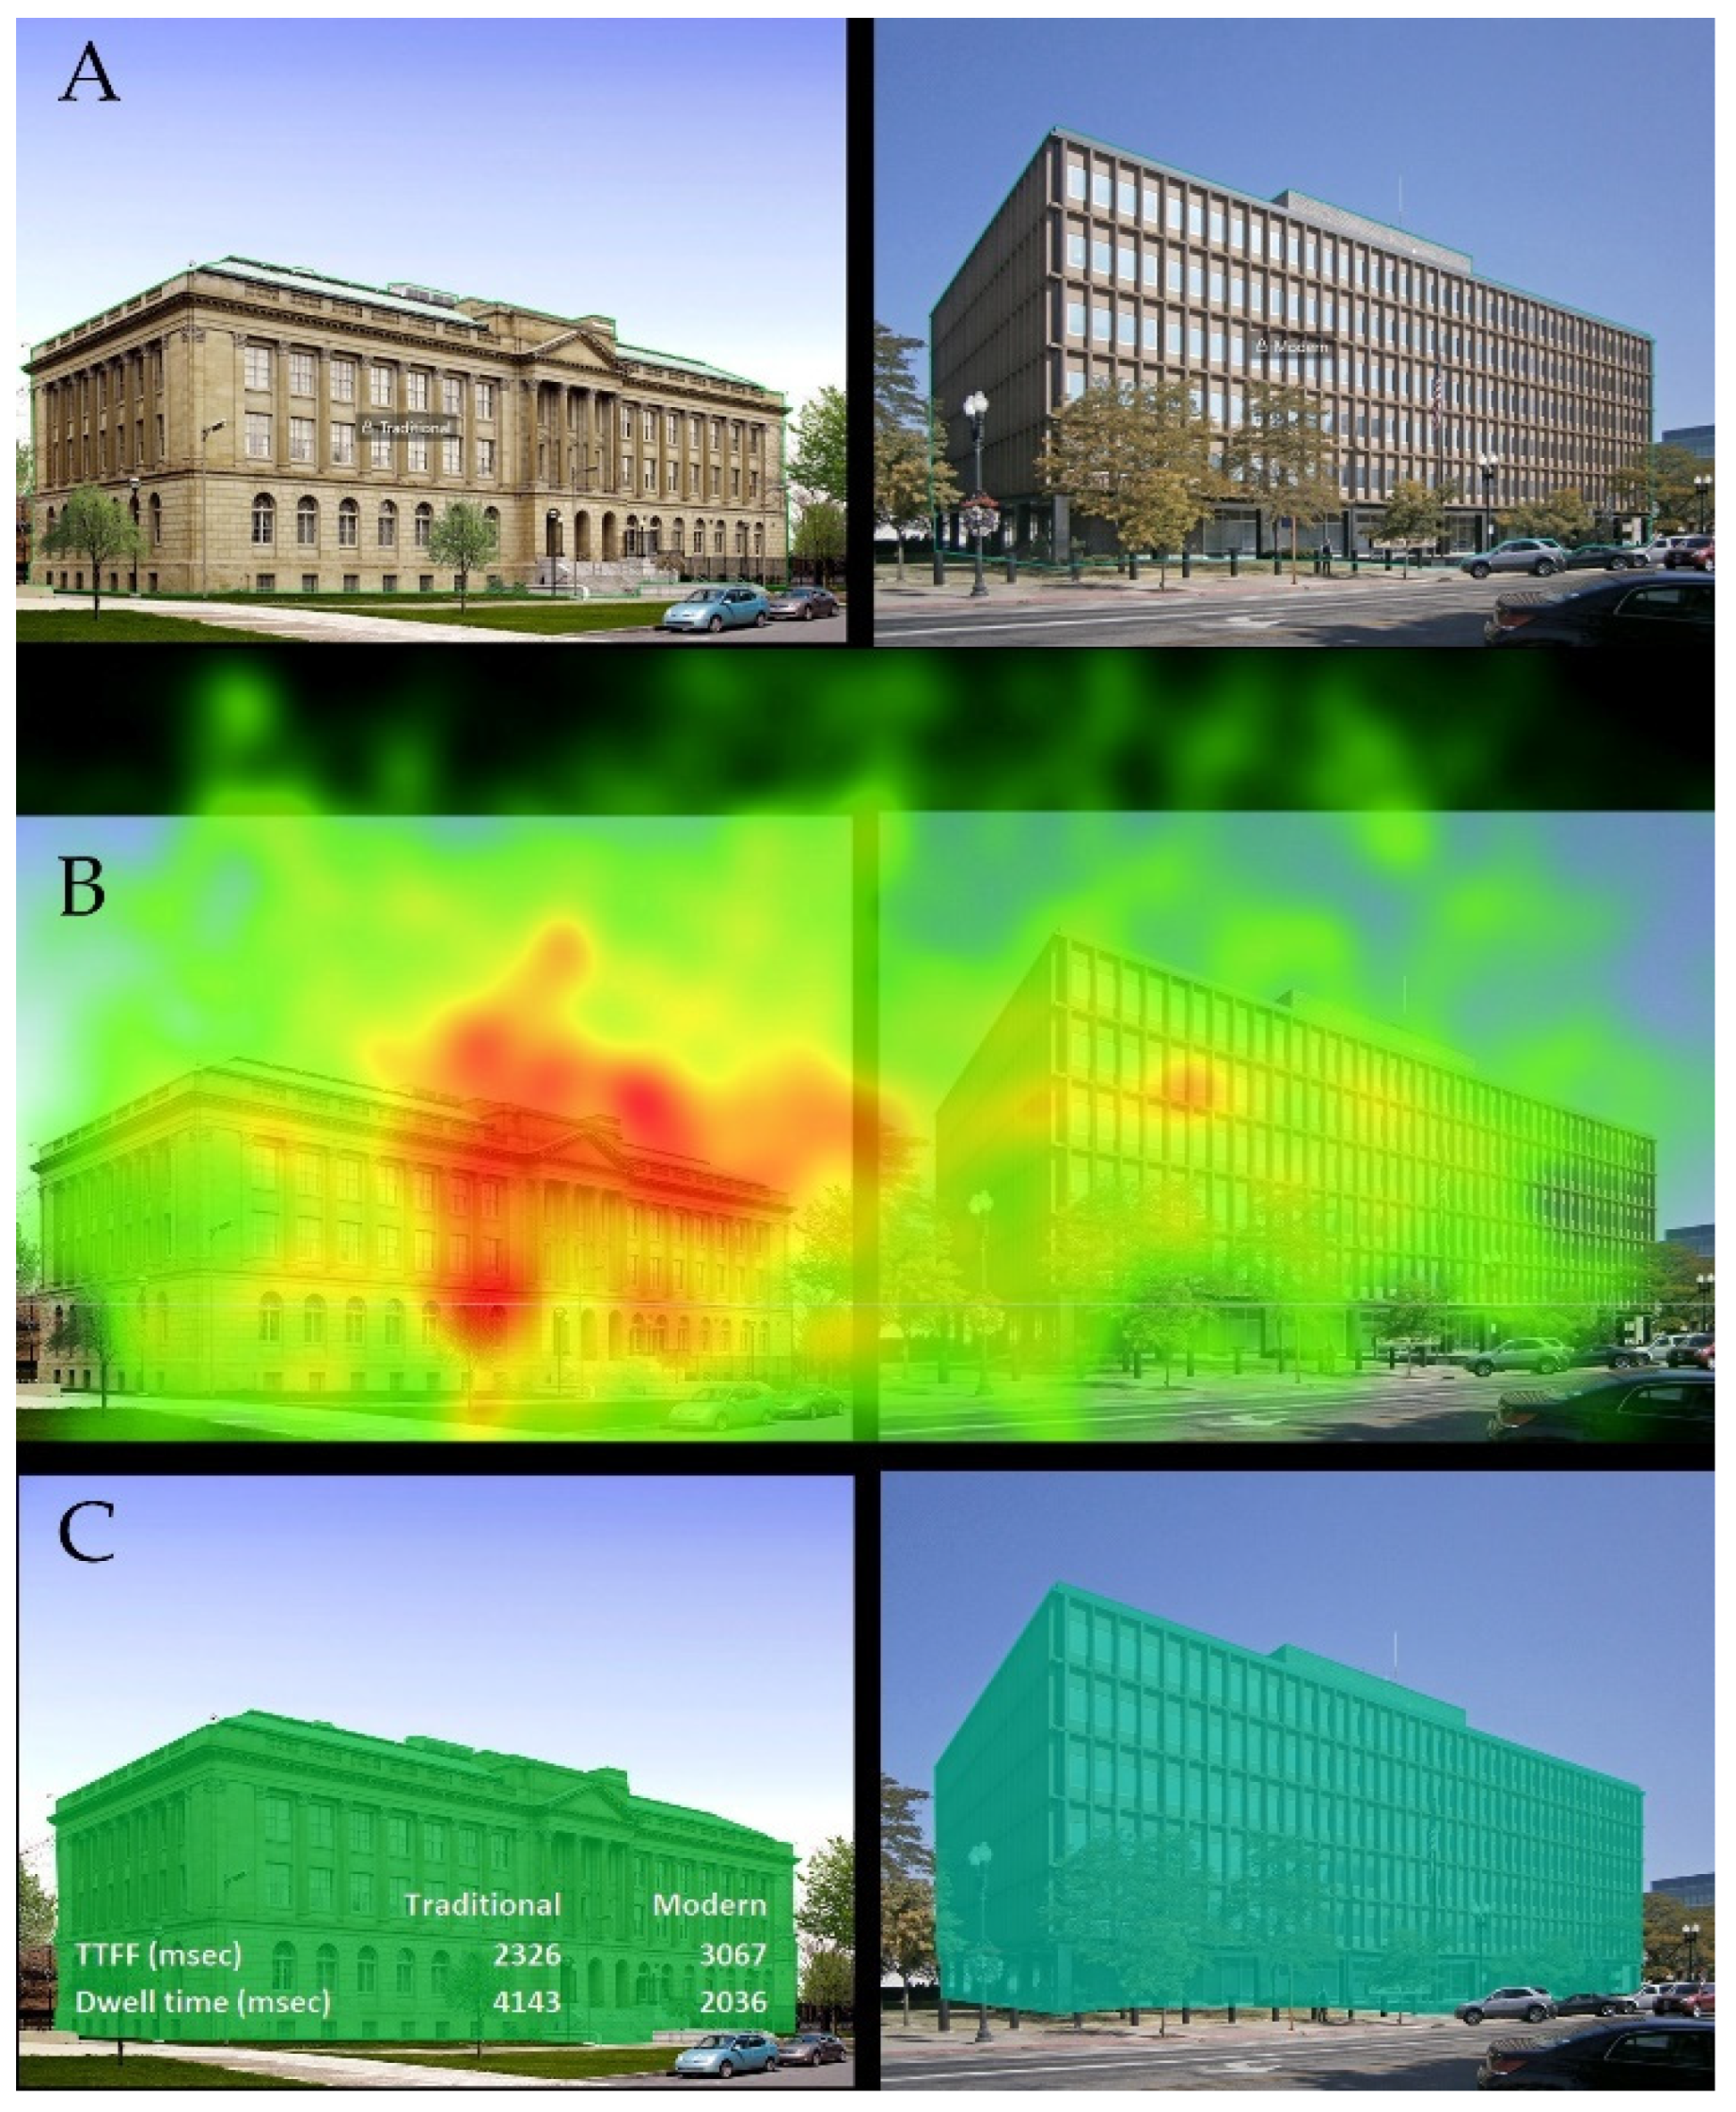
  • Building Study-1 compared images of traditional and modern civic architectures. The images were provided by the National Civic Art Society (NCAS.org) and originally used in a 2020-NCAS-sponsored Harris Poll, in exactly the same pairings as presented in our eye-tracking study. Seventy-six people completed the study, with 60 responses meeting the quality standards for data processing. 182 people abandoned the study without completing it.
  • Building Study-2 used photographs provided by Nikola Olic, a Texas-based photographer (structurephotography.org) whose pictures of buildings, he calls ‘Architectural Portraiture’, have appeared in the New York Times. Sixty-eight people completed the study, with 62 responses meeting the quality standards for data processing; 115 people abandoned the study without completing it.
  • Building Study-3 looked at the impact of texture in architectural images, comparing images of buildings with processed versions of the same structure with and without detail. Fifty-six people completed the study, with 56 responses meeting the quality standards for data processing; 85 people abandoned the study without completing it.
  • Building Study-4 further explored how people view buildings versus natural settings using photographs from the US, Canada and Europe. 50 people completed the study, with 49 responses meeting the quality standards for data processing; 124 people abandoned the study without completing it.
  • Building Study-5 focused on the importance of fenestration and architectural detail, presenting processed versions of buildings from the United States, Greece and Italy, with windows or architectural features removed. Fifty-four people completed the study, with 52 responses meeting the quality standards for data processing; 92 people abandoned the study without completing it.
  • Building Study-6 further explored the importance of detail, fenestration and face-like features in architecture and other images. Fifty-one people completed the study, with 48 responses meeting the quality standards for data processing; 98 people abandoned the study without completing it.
  • Building Study-7 used architectural photographs from Brazil, Finland and Greece and artifacts with and without face-like features. Seventy-one people completed the study, with 54 responses meeting the quality standards for data processing; 210 people abandoned the study without completing it.

3. Results

Results were expressed in two different ways. 1. Heatmaps that indicate levels of visual attention, glowing bright red in areas attracting the most attention, fading to yellow and then light green and blue in areas receiving less, and having no color in areas that had been ignored. The original images and their corresponding heatmaps are presented in the relevant figures. Heatmaps are a useful means for easily and intuitively visualizing the distribution of visual attention, by representing the probability of the gaze falling onto a part of the image using a color-coding scheme, where the warmer the color, the higher the probability. 2. Analysis within AOI, which are regions of an image chosen for specific data analysis. AOI are created by drawing an outline around each building to set the area from which fixation data are collected, and is indicated in the figures by the presence of a color tint. AOI give quantitative data on the predicted eye movements within the specific area, which include Time to First Fixations (TTFF-how many milliseconds for the first eye fixation at a point within the AOI, as a means of correlating the presence of specific features with first gaze attraction) and dwell time (the aggregate time, in milliseconds, that the eyes spend looking within the AOI, as a means of assessing the exploration potential that the different types of presented material offer). Representative results are illustrated here, while all remaining images and their heatmaps can be found in the supplementary data. The cumulative data graphs from all images can be found at the end of this section.

3.1. Study 1

In this study, we used paired images from the 2020 Harris Poll commissioned by the NCAS [25]. We noted the considerable care NCAS took to pair buildings similar in size and shape. Eye-tracking of these pairs showed a clear visual bias for traditional-style buildings, as indicated by the redd areas in side-by-side heatmap comparisons (Figure 1, Figure 2, Figure 3 and Figure 4, images at right). Modern buildings had fewer and more minor red spots, and more areas received no attention at all. Both styles showed low-level distributed attention (green) throughout the buildings. More hot spots (red) on traditional buildings also appeared near the roofline and areas of detail, such as pediments, cornices, fenestrations, and columns. Traditional architecture commanded more visual attention regardless of which side (left or right) the images appeared on the screen. Red spots often appeared in the sky above both types of buildings, which is expected, with the daylight sky providing an area of high contrast with the edge of the structure.
In these comparisons, dwell time was always longer for traditional buildings, but TTFF seemed to be more dependent on the position of the building in the pair, than the style, with the left position always achieving lower TTFFs.

3.2. Study 2

In this study, paired images combined repetitive building facades with ones with detail or with natural scenes. Red areas of heatmaps focused more on areas of natural complexity and organic detail. Repetitive parallel lines were largely ignored in all images, displaying a few, if any, red heatmap areas. Natural scenes also commanded attention (Figure 5, Figure 6 and Figure 7). In the AOIs, some first fixations went to natural views or a building featuring more organic forms; however, these correspond to the position on the left; similar images in inverted configuration in Study 4 (see below) resulted in the opposite TTFF score, repeating what was already seen in Study 1, that the position of the image is more important than its content, with the left position always achieving lower TTFFs. Dwell times were significantly higher for the “organic” stimuli.

3.3. Study 3

In this study, paired images compared building facades with detail and texture to alternative versions (processed using Adobe Photoshop) showing less detail and texture. More red heatmap areas were found on architectural images with higher levels of detail and texture. Participants avoided blank portions of building elevations (Figure 8, Figure 9, Figure 10 and Figure 11). In AOI, first fixations usually favored textured surfaces over ones with less texture and detail, in this case irrespective of the first or second position. Dwell times also showed substantial increase on detailed surfaces.

3.4. Study 4

In this study, natural scenes were contrasted with man-made modern structures/surfaces, with the hotspots of the map found predominantly on the natural scene (Figure 12, Figure 13 and Figure 14). First fixations were more influenced by position than content, with the left position coming first. Dwell times showed a substantial increase on detailed surfaces.

3.5. Study 5

In this study, we explored the importance of detail and fenestration patterns. Heatmaps focused strongly on bilateral symmetrical and face-like facades. Participants avoided repetitive facades and blank building walls (Figure 15, Figure 16 and Figure 17). TTFFs were almost always shorter for the images showing buildings with fenestration and/or more detail, as opposed to those lacking these features. Dwell time was also always longer for these images.

3.6. Study 6

In this study, more images with pairs of modern vs. traditional buildings were tested, and we further explored the importance of fenestration and face-like patterns. Heatmaps focused more on traditional and highly organized facades, than simpler ones. TTFF was influenced by both position and content, while dwell time was higher in images with more organized complexity (Figure 18 and Figure 19).

3.7. Study 7

In this study, we further explored traditional vs. modern structures, natural vs. artificial images and presence vs. absence of face-like features (Figure 20, Figure 21 and Figure 22). In keeping with the previous studies, heatmaps focused more on images with higher complexity. Once again, TTFF was influenced by both position and content, while dwell time was higher in images with more organized complexity.

3.8. Results Summary

In total, the results for the different categories are illustrated in Figure 23, while the remainder of the images used and their heatmaps, not shown here, can be found in the supplementary data.
The results from the seven studies fall into five categories of image pairs: traditional vs. modern buildings (Style), rich vs. poor texture, presence or absence of fenestration, presence of eyes and face-like features, and natural vs. artificial environment images. Data sets were analyzed per category; they were first tested for normality using the Shapiro–Wilk test, which is appropriate for small sample sizes (<50 samples), and then compared in pairs using a t-test.)
TTFF was generally shorter for images with organized complexity (traditional, increased texture, presence of fenestration, and presence of eyes and face-like features) and similar between artificial and natural structures images. However, in t-tests, in none of these cases did the p values of the two-tailed test reach 0.05 or lower. More specifically, it was 0.145 for Style, 0.158 for Texture, 0.336 for Fenestration, 0.382 for Eyes- and face-like features, and 0.906 for Natural vs. Artificial.
Dwell times were longer for these same more complex images in all categories. In all cases (except natural vs. artificial) the p value in t-tests was lower than 0.05, as indicated by the asterisks. More specifically, it was 0.004 for Style, 0.031 for Texture, 0.003 for Fenestration, and 0.007 for Eyes- and face-like features. For Natural vs. Artificial it was 0.150.
The same results are presented in Supplementary Figure S7 (TTFF) and Supplementary Figure S8 (dwell time), but this time with data segregated according to the placement of the photographs in the pair (left-right). There is a positional bias in some cases, with the first position conferring an advantage, with shorter TTFF and longer dwell time, but always with the same pattern as seen in the cumulative results. Finally, based on the premise on which this study was conceptualized, that is, that there are some geometries that are “nature-like” and some that are not, we added together the data from all the pairs of results from the 5 categories into one large data pair, containing data from images with “Nature-Like Geometry” (NLG) and those with “Non-Nature-Like Geometry” (NNLG). The first group contained all data from images of traditional buildings, rich textures, presence of fenestration, presence of eyes-and face-like features, and nature, while the NNLG category contained all data from modern buildings, poor textures, absence of fenestration, absence of eyes-and face-like features, and artificial structures. The results were the same as when individual categories were examined separately. TTFF was shorter for NLG, but again with p > 0.05 (p = 0.17), while dwell time was longer in NLG, with a very high significance (p = 7.8 × 10⁻⁸, Figure 24).

4. Discussion

The study of visual perception of the built environment is a field that remains relatively nascent, but has seen an increasing amount of interest in recent years [28,29,30]. Here, we have used eye-tracking to investigate particular features of buildings and other structures in paired images.
The results from the 7 studies analyzed in the present work fall into 5 categories of image pairs: traditional vs. modern buildings, rich vs. poor texture, presence or absence of fenestration, presence of eyes and face-like features, and natural vs. artificial environment images. The main point of these studies was to approach the “traditional vs. modern” question but that, in itself, leads to all the rest: pre-modern architecture is associated with more textured surfaces, either because of the presence of decoration, or because of the materials used; fenestration as a distinct pattern of openings (as opposed to curtain walls, for example) is also more associated with traditional architecture, and its arrangement is sometimes reminiscent of the basic arrangement of a human face, with two eyes and a mouth. Hence, these categories were used to examine these particular features either on buildings or on other objects. Given our understanding that the geometry of pre-modern architecture is, in broad terms, the geometry found in nature [18,19,20,21,22] a final category, natural vs. artificial environments, was introduced. The subject of this category is vast, and in no way were the few images tested here meant to explore it in any satisfactory degree; rather, the aim was to test whether the results from this category would be in the same direction as the others.
These seven studies were formulated to test our hypothesis that the human gaze would fixate first on images of buildings with features of organized complexity, natural scenes, and face-like features/fenestration and dwell on these images for longer. The findings support our hypothesis in various degrees, especially regarding the dwell time. The human unconscious seems to direct our experience of the built environment more than most realize.
The first category, modern vs. traditional, showed a clear bias for the complex detail found in traditional architecture over the repetitive facades of modern buildings. Fractal patterns on traditional facades commanded the first fixation in most image pairs, suggesting that the organized complexity offered an attractive landing spot for the 60 participants. The data suggests that complexity informs the brain of stimuli worth examining more closely, that there is more information to be found, hence producing longer dwell times, with an average difference having a p<0.01 in Student’s t-test. All the images in Study 1 (which are the majority of the images in this category) come from the 2020 Harris Poll [25], where Americans’ conscious preference for traditional buildings was demonstrated. Because of this prior study, we now have a combination of questionnaire and biometric data, acquired independently by different researchers in different population samples, all pointing in the same direction: traditional facades are, in most cases, the first to draw the gaze, the ones where gazes dwells upon for longer, and are better liked. In the additional images, a Persian Palace in Tehran was a stronger attractor for the participants’ gaze than a modern façade, in images where they were both “transplanted” in the natural surroundings of South Tyrol, in Study 6. The choice of using a non-local traditional architecture was deliberate, to avoid any association of a traditional Tyrolean building with its environment. The preferential scoring of the non-local traditional building reinforces the scoring of the same pair in a preference questionnaire study [27], so again we have a case of converging data.
Results from the second category, texture, defined here as visually complex surfaces, again indicated a visual attraction to textured facades over ones that were smooth and flat or had repeated basic patterns. This applied to both textures like rock/brick wall surfaces in Study 3 and a wall with painted patterns in Study 7. A special case in this category, with the same results, was the proclivity for looking at the Milan Cathedral in Italy over a blanker, simplified version of the building in Study 6 (first published and scanned with 3M’s Visual Attention Software, with similar results in [5]). Here, the preferred version possessed a highly ornamental façade, whose fractal properties confer a privileged state in terms of perceptual fluency [15,16] and make for a more stress-relieving sight, than a repetitive pattern [12,13], as already discussed.
The presence of fenestration would typically result in shorter TTFF and longer dwell times, as shown in Studies 5 and 6, whereas in the category Eye—and face-like patterns, whether on a spoon or a façade, a simple face-like pattern suggesting two eyes and a mouth, drew viewers to its area immediately; this pattern also received the most attention (Studies 5 and 7). Viewers also spent more dwell time on face-like images.
When comparing natural vs. artificial environments in Studies 2, 4 and 7, dwell time went for more than 50% of the testing interval to the natural scene. In the one instance where this did not happen, and viewers favored the manmade scene, 20 percent of the image, however, featured natural elements, including a tree and blue sky. In some of the tests, the artificial environment was a blank wall, as a reference to the study that had shown improved recovery from surgery for patients whose hospital room had windows looking out on a natural scene, over those in rooms with windows facing a blank wall [17].
Looking at the average values per category, TTFF is always shorter for images with organized complexity (except for the natural vs. artificial category, for which it is the same) and dwell time is always longer for the images with organized complexity. Out of these, in two-tailed Students’ t-tests, none of the TTFF comparisons gave p values of 0.05 or lower, while the dwell time in four out of five categories (again with the exception of natural vs. artificial) the p value was lower than 0.05, and three of those it was p < 0.01. The lack of what is commonly called “statistical significance” in some of these findings, should not detract from their importance; the trend is clear, and we should not forget that a certain p value represents a probability, not a cut-off point, as it is often thought of [31]. In addition, given the obvious trend, we might expect that the p value would further decrease if the sample was larger, which would result in smaller standard error.
Results from these studies reveal our bias to fixate on detail, visual complexity, face-like and fractal geometries. Certainly, documenting an initial gaze attraction does not necessarily imply that the subject of this attraction will be deemed to be more appealing, and the results of these, or any other biometric studies that do not incorporate some measure of valence, are not enough by themselves to lead us to conclusions about preference. However, there is extensive literature on the connection between organized complexity and aesthetic preference, perceptual fluency and psychophysiological benefit (see introduction). Also, some of the photographic material used here has already been assessed for preference in other studies, with the preferred images being the same as those that scored higher in the present work. Hence, while we cannot claim to have assessed preference, we can say that we have found that images which scored favorably in the tests presented here, were images that incorporated those same features that are associated with aesthetic preference. Our visual system evolved to promote survival—and what was true in the past, seems to carry on in the present, despite stylistic changes. Infants are instantly attracted to faces, and no more than a week after birth they tend to look longer at faces deemed attractive by adults [32], a phenomenon that generalizes across race, sex, and age by the age of 6 months [33]. This reveals the early emergence of a capability that is of much higher resolution than simply spotting an abstract facial pattern, and is certainly challenging to current views of aesthetics as purely socially constructed. As another example, we learned to distinguish between twigs and snakes very fast—and snake detection is a function for which, amazingly, primates even have a dedicated circuit in the pulvinar region of the thalamus [34]—or rough and smooth surfaces, attuning our vision to perceive aspects of the environment that were salient for survival. And all this, in surroundings that are high in perceptual fluency, as discussed above, which fulfill our subliminal need to anchor in space, as a first step to secure ourselves in a place. Details, organized complexity, fractals in nature, and face-like patterns, appear to provide requisite anchors for the brain—while blankness, repetitive parallel geometries, and most man-made building materials, including concrete, glass and asphalt, in the cases explored here, cannot. We interpret our built environments today with brains fine-tuned during the Pleistocene, (some 2.5 million to 12,000 years ago), but buildings and artificial materials are relatively new in our history. These studies aim to help look at human perception of the built environment from this premise.
Today’s architectural practice often shies away from organic, detailed and fractal patterning for ideological and economic reasons. Formal architectural training also generally ignores essential aspects of human evolution and biology. It neglects the human biological and psychological experience of built spaces, as well. However, investigations like the present, can offer a new path forward for practice, showing how embracing our biology and evolutionary heritage and predispositions, promotes community health, wellbeing, and better placemaking for all. When we ignore our evolutionary predispositions, we do so at our peril, creating environments where people cannot attach non-consciously, so they feel like they do not belong. The studies suggest that introducing natural materials and fractal geometry aids anchoring to a space, requisite for creating a successful sense of place. Continuing to build architecture with blank facades that humans cannot anchor to, has the opposite effect.

Potential Shortcomings

These studies, conducted online, on individual laptops, inevitably may not account for distractions, lighting changes, and other factors beyond the experimenters’ control. Compared to eye-tracking in a dedicated laboratory setting with infrared eye trackers, webcam-based data can have lower accuracy and precision, and the framerate and resolution are dictated by the quality of the webcam. However, these shortcomings apply as a common denominator to all images and cannot favor one type over another; if anything, the introduction of inaccuracies might blunt potential differences between responses. Also, our studies relied on real buildings, and scenes photographed from a distance where details are harder to see. Another potential shortcoming is the bias introduced by the image positions: because of the left-to-right bias, which seems to exist not only in people whose native languages are written in this direction, but also in infants [35] and even in other species [36], the image on the left side would be at an advantage, especially regarding TTFF. Indeed, in some (but not all) cases, we noticed that this position correlated with a shorter TTFF and occasionally longer dwell time. To compensate for this, different images of each category were placed in both positions, so that, for example, in one pair the modern building was on the left, and in another pair it was on the right. In one sense, ideally all pairs should be presented in both configurations, to make sure that the effect is cancelled out for every pairing. But this would mean that in half of the cases, participants would be exposed to images they had already seen before, and this is something we wanted to avoid, as we were interested in first reactions. Also, to avoid any potential random bias within a study, the studies were not monothematic, so that the analysis of each category was not based on data from only one study.

5. Conclusions and Future Prospects

The studies here suggest a broad range of possibilities for future research to understand the built environment and improve its design in support of human health, and personal and community wellbeing. Future biometric studies could focus on specific details of various styles of architecture, such as material, articulation, and geometric proportions. Eye-tracking glass facades, for example, may show how difficult it is to attach to artificial surfaces that dominate most new construction today, worldwide, as we have already demonstrated in AI-simulated eye-tracking experiments [5].
Combining eye-tracking with facial expression analysis, and additional biometric tools, including galvanic skin response and electroencephalogram recordings, is expected to capture a more complete profile of physiological responses that are key to better understanding human behavior and experience in the built environment. Our studies presented here did not include analysis of facial expressions; however, the relevant module, Affectiva, was part of the software, and the data has been collected, and will be analyzed in a future publication.
We are in a paradigm-shifting moment, where new findings in Psychology and Neuroscience, highlighting the role of both pre-conscious processes and the non-verbal right hemisphere in human perception, transform our understanding of our interaction with the environment. We now have a complement of necessary tools to engage in the scientific study of the built environment in new ways, gaining significant insight into how architectural spaces impact us in manifold ways, and the time has come to use them and apply the relevant findings in architectural practice.
Future explorations will include the opportunity to probe virtual immersive environments, something that has already been done [37], also combined with electroencephalography [38]—but this time to test architectural spaces for potential health impacts, in a way that produces findings which can then be directly applied to the real world. The understanding is slowly emerging [39] that, beyond the current understanding of merely providing sanitary living conditions, architectural and urban design should be seen as a public health issue in a much broader sense.

Supplementary Materials

The following supporting information can be downloaded at: https://www.mdpi.com/article/10.3390/app132112071/s1, Figure S1 The remainder of the Harris Poll image pairs and their heatmaps. Figure S2 The remainder of Modern vs. traditional image pairs and their heatmaps. Figure S3 A Rich vs. poor structure image pair and its heatmap. In the poor structure image pair, the area of the painted tile has been blurred. Figure S4 The remainder of Fenestration image pairs and their heatmaps. Figure S5 The remainder of Eyes and face-like features image pairs and their heatmaps. B and D are works by Bruce Rosenbaum. Figure S6 A Natural vs. artificial image pair and its heatmap. Figure S7. TTFF in milliseconds from all studies, organized by thematic category and with first and second position data plotted separately. A: style. B: texture, C: fenestration, D: eyes- and face-like features, and E: artificial vs. natural. Figure S8. Dwell time in milliseconds from all studies, organized by thematic category and with first and second position data plotted separately. A: style. B: texture, C: fenestration, D: eyes- and face-like features, and E: artificial vs. natural.

Author Contributions

Conceptualization, A.S., H.J.R., A.C.S. and A.A.L.; Methodology, A.S., H.J.R., A.C.S. and A.A.L.; Software, A.S., H.J.R. and A.C.S.; Validation, H.J.R.; Formal Analysis, A.S., H.J.R., A.C.S. and A.A.L.; Investigation, A.S., H.J.R., A.C.S. and A.A.L.; Resources, A.S., H.J.R., A.C.S. and A.A.L.; Data Curation, H.J.R. and A.A.L.; Writing—Original Draft Preparation, A.S. and H.J.R.; Writing—Review & Editing, A.S., H.J.R., A.C.S. and A.A.L.; Visualization, H.J.R. and A.A.L.; Supervision, A.S., A.C.S. and A.A.L.; Project Administration, A.S., H.J.R. and A.C.S.; Funding Acquisition, A.S. All authors have read and agreed to the published version of the manuscript.

Funding

This research received no external funding.

Institutional Review Board Statement

The topic is not ethically sensitive and was carried out in accordance with national and institutional legal and ethical requirements. The project follows institutional guidelines and the internal ethics reference person (Eurac) has indicated that there is no need for ethical approval when surveys are not directly health related. Sensitive data or research involving human subject undergo ethical approval through ethical research committees based in hospitals, that do not assess projects like the present. Also, ethical concerns were assessed internally: participation was on a voluntary basis and all participants were informed that the survey was anonymous, that all data would be only used for research and evaluated anonymously. To secure privacy, all data was collected via a web survey with no collection of identifiers/codes and analyzed therefore anonymously, and no IP addresses were collected (i.e., no possibility to reidentify whatsoever).

Informed Consent Statement

Informed consent was obtained from all subjects involved in the study.

Data Availability Statement

Data is contained within the article and supplementary material.

Acknowledgments

We thank the iMotions team in Boston, including Kieu Wong, Nam Nguyen, Francesca Marchionne and Cazmon Suri for their guidance and help. We want to thank the National Civic Arts Society for permitting us to use their images of traditional and modern architecture, as well as Silva Melo, Myllena Miliann, and Marjo Uotila for images of buildings and Bruce Rosenbaum for images of his artwork. We would also like to thank over 500 participants in North America, South America, Europe, and Africa who took part in the Studies and have patiently waited for the results.

Conflicts of Interest

The authors declare no conflict of interest.

References

  1. Lisińska-Kuśnierz, M.; Krupa, M. Suitability of Eye Tracking in Assessing the Visual Perception of Architecture-A Case Study Concerning Selected Projects Located in Cologne. Buildings 2020, 10, 20. [Google Scholar] [CrossRef]
  2. Sussman, A.; Ward, J. Eye-tracking Boston City Hall to better understand human perception and the architectural experience. New Design Ideas 2019, 3, 53–59. [Google Scholar]
  3. Zou, Z.; Yu, X.; Ergan, S. Integrating Biometric Sensors, VR, and Machine Learning to Classify EEG Signals in Alternative Architecture Designs. Comput. Civ. Eng. 2019 2019. [Google Scholar]
  4. Lavdas, A.A.; Salingaros, N.A. Architectural Beauty: Developing a Measurable and Objective Scale. Challenges 2022, 13, 56. [Google Scholar] [CrossRef]
  5. Lavdas, A.A.; Salingaros, N.A.; Sussman, A. Visual Attention Software: A New Tool for Understanding the “Subliminal” Experience of the Built Environment. Appl. Sci. 2021, 11, 6197. [Google Scholar] [CrossRef]
  6. Sussman, A.; Ward, J. Game-Changing Eye-Tracking Studies Reveal How We Actually See Architecture. Available online: https://commonedge.org/game-changing-eye-tracking-studies-reveal-how-we-actually-see-architecture/ (accessed on 1 August 2023).
  7. Itti, L.; Koch, C. Computational modelling of visual attention. Nat. Rev. Neurosci. 2001, 2, 194–203. [Google Scholar] [CrossRef]
  8. Tollner, T.; Zehetleitner, M.; Gramann, K.; Muller, H.J. Stimulus saliency modulates pre-attentive processing speed in human visual cortex. PLoS ONE 2011, 6, e16276. [Google Scholar] [CrossRef]
  9. Ellard, C. Places of the Heart: The Psychogeography of Everyday Life; Perseus Books LLC, Ed.; Perseus: New York City, NY, USA, 2015. [Google Scholar]
  10. Merrifield, C.; Danckert, J. Characterizing the psychophysiological signature of boredom. Exp. Brain Res. 2014, 232, 481–491. [Google Scholar] [CrossRef]
  11. Alexander, C.; Ishikawa, S.; Silverstein, M.; Jacobson, M.; Fiksdahl King, I.; Angel, S. A Pattern Language; Oxford University Press: New York, NY, USA, 1977. [Google Scholar]
  12. Taylor, R.P. Reduction of Physiological Stress Using Fractal Art and Architecture. Leonardo 2006, 39, 245–251. [Google Scholar] [CrossRef]
  13. Taylor, R.P.; Spehar, B.; Van Donkelaar, P.; Hagerhall, C.M. Perceptual and Physiological Responses to Jackson Pollock’s Fractals. Front. Hum. Neurosci. 2011, 5, 60. [Google Scholar] [CrossRef]
  14. Mandelbrot, B.B. How long is the coast of Britain? Statistical self-similarity and fractional dimension. Science 1967, 156, 636–638. [Google Scholar] [CrossRef]
  15. Fischmeister, F.P.; Martins, M.J.D.; Beisteiner, R.; Fitch, W.T. Self-similarity and recursion as default modes in human cognition. Cortex 2017, 97, 183–201. [Google Scholar] [CrossRef] [PubMed]
  16. Martins, M.J.; Fischmeister, F.P.; Puig-Waldmuller, E.; Oh, J.; Geissler, A.; Robinson, S.; Fitch, W.T.; Beisteiner, R. Fractal image perception provides novel insights into hierarchical cognition. Neuroimage 2014, 96, 300–308. [Google Scholar] [CrossRef]
  17. Ulrich, R.S. View through a window may influence recovery from surgery. Science 1984, 224, 417–419. [Google Scholar] [CrossRef] [PubMed]
  18. Frumkin, H. Beyond toxicity: Human health and the natural environment. Am. J. Prev. Med. 2001, 20, 234–240. [Google Scholar] [CrossRef] [PubMed]
  19. Joye, Y. Architectural lessons from environmental psychology: The case of biophilic architecture. Rev. Gen. Psychol. 2007, 11, 305–328. [Google Scholar] [CrossRef]
  20. Salingaros, N.A. The laws of architecture from a physicist’s perspective. Phys. Essays 1995, 8, 638–643. [Google Scholar] [CrossRef]
  21. Salingaros, N.A. A Scientific Basis for Creating Architectural Forms. J. Arch. Plan. Res. 1998, 15, 283–293. [Google Scholar]
  22. Salingaros, N.A.; Mehaffy, M.W. A Theory of Architecture; Umbau-Verlag: Solingen, Germany, 2006; 278p. [Google Scholar]
  23. Salingaros, N.A. Unified Architectural Theory: Form, Language, Complexity: A Companion to Christopher Alexander’s “The Phenomenon of Life: The Nature of Order, Book 1”; Sustasis Foundation: Portland, OR, USA, 2013; 300p. [Google Scholar]
  24. Zeki, S. Beauty in Architecture: Not a Luxury—Only a Necessity. Arch. Des. 2019, 89, 14–19. [Google Scholar] [CrossRef]
  25. NCAS. Americans’ Preferred Architecture for Federal Buildings. Available online: https://www.civicart.org/americans-preferred-architecture-for-federal-buildings (accessed on 1 August 2023).
  26. iMotions. iMotions. Available online: https://imotions.com/ (accessed on 21 October 2023).
  27. Lavdas, A.A.; Schirpke, U. Aesthetic preference is related to organized complexity. PLoS ONE 2020, 15, e0235257. [Google Scholar] [CrossRef]
  28. Albright, T.D. Neuroscience for Architecture. In Mind in Architecture: Neuroscience, Embodiment, and the Future of Design; Robinson, S., Pallasmaa, J., Eds.; MIT Press: Cambridge, MA, USA, 2015; pp. 197–217. [Google Scholar]
  29. Chatterjee, A.; Coburn, A.; Weinberger, A. The neuroaesthetics of architectural spaces. Cogn. Process. 2021, 22, 115–120. [Google Scholar] [CrossRef] [PubMed]
  30. Coburn, A.; Vartanian, O.; Chatterjee, A. Buildings, Beauty, and the Brain: A Neuroscience of Architectural Experience. J. Cogn. Neurosci. 2017, 29, 1521–1531. [Google Scholar] [CrossRef] [PubMed]
  31. Grabowski, B. “P < 0.05” Might Not Mean What You Think: American Statistical Association Clarifies P Values. J. Natl. Cancer Inst. 2016, 108, djw194. [Google Scholar] [CrossRef] [PubMed]
  32. Slater, A.; Schulenburg, C.V.D.; Brown, E.; Badenoch, M. Newborn infants prefer attractive faces. Infant Behav. Dev. 1998, 21, 345–354. [Google Scholar] [CrossRef]
  33. Langlois, J.H.; Ritter, J.M.; Roggman, L.A.; Vaughn, L.S. Facial diversity and infant preferences for attractive faces. Dev. Psychol. 1991, 21, 79–84. [Google Scholar] [CrossRef]
  34. Van Le, Q.; Isbell, L.A.; Matsumoto, J.; Nguyen, M.; Hori, E.; Maior, R.S.; Tomaz, C.; Tran, A.H.; Ono, T.; Nishijo, H. Pulvinar neurons reveal neurobiological evidence of past selection for rapid detection of snakes. Proc. Natl. Acad. Sci. USA 2013, 110, 19000–19005. [Google Scholar] [CrossRef]
  35. Bulf, H.; de Hevia, M.D.; Gariboldi, V.; Cassia, V.M. Infants learn better from left to right: A directional bias in infants’ sequence learning. Sci. Rep.-Uk 2017, 7, 2437. [Google Scholar] [CrossRef]
  36. Rugani, R.; Kelly, D.M.; Szelest, I.; Regolin, L.; Vallortigara, G. Is it only humans that count from left to right? Biol. Lett. 2010, 6, 290–292. [Google Scholar] [CrossRef]
  37. Shemesh, A. Affective Response to Architecture—Investigating Human Reaction to Spaces with Different Geometry. Arch. Sci. Rev. 2016, 60, 116–125. [Google Scholar] [CrossRef]
  38. Hu, M.; Simon, M.; Fix, S.; Vivino, A.A.; Bernat, E. Exploring a sustainable building’s impact on occupant mental health and cognitive function in a virtual environment. Sci. Rep. 2021, 11, 5644. [Google Scholar] [CrossRef]
  39. Valentine, C. Health Implications of Virtual Architecture: An Interdisciplinary Exploration of the Transferability of Findings from Neuroarchitecture. Int. J. Environ. Res. Public Health 2023, 20, 2735. [Google Scholar] [CrossRef] [PubMed]
Figure 1. (A): At left, the U.S. Courthouse in Toledo, Ohio, paired with a modern counterpart, the Hansen Federal Building, in Ogden Utah. (B) Heatmaps of both buildings. (C) Outlined AOI. The TTFF was faster for the traditional building and the dwell time was longer.
Applsci 13 12071 g001
Figure 2. (A) At left, the Robert C. Weaver Federal Building in Washington D.C., paired with a traditional counterpart, the William Jefferson Clinton Federal Building, also in Washington D.C., at right. TTFF was faster for the Modern building, yet the dwell time was longer for the traditional building. (B) Heatmaps of both buildings. (C) Outlined AOI.
Applsci 13 12071 g002
Figure 3. (A) At left, the Sandra Day O’Connor in Phoenix, Arizona, paired with a traditional counterpart, the Howard M. Metzenbaum U.S. Courthouse, in Cleveland, Ohio, at right. (B) Heatmaps of both buildings. (C) Outlined AOI.
Applsci 13 12071 g003
Figure 4. (A) At left, the Martin V. B. Bostetter Jr. U.S. Courthouse in Alexandria, Virginia, paired with a modern counterpart, the U.S. Courthouse, in Newport, Virginia. (B) Heatmaps of both buildings (C) Outlined AOI. The TTFF as shorter for the traditional building and the dwell time longer.
Applsci 13 12071 g004
Figure 5. (A) Paired images show traditional and modern skyscrapers at Roosevelt University, Chicago, IL, at left, and Burnett Plaza, Fort Worth, TX. (B) Heatmap of the pair. (C) AOI. The TTFF was shorter for the traditional building in front of the modernist facade, and the dwell time longer for it, as compared to the image on the right (photos ©Nikola Olic).
Applsci 13 12071 g005
Figure 6. (A) Paired images show Calero Park, San Jose, CA, and Clara Shortridge Foltz Criminal Justice Center, Los Angeles, CA, at left. (B) Heatmap of the pair. (C) AOIs. The TTFF was shorter for the natural scene, and the dwell Time was longer (photos ©Hernan Rosas, Nikola Olic).
Applsci 13 12071 g006
Figure 7. (A) Paired images show Calero Park, San Jose, CA, and First City Tower, Houston, TX, at left. (B) Heatmap of this pair. (C) AOIs. Like in Figure 6, here the TTFF was shorter for the natural scene, at left, and the dwell Time was longer (photos ©Hernan Rosas, Nikola Olic).
Applsci 13 12071 g007
Figure 8. (A) Paired image of residence in Potrero Hill, San Francisco, CA, with a processed version smoothing the surface material, at left. (B) Heatmap of this paired image. (C) AOIs. The TTFF was shorter for the building with texture, and the dwell time was longer (photos ©Hernan Rosas).
Applsci 13 12071 g008
Figure 9. (A) Another paired image of a residence in Potrero Hill, San Francisco, CA, with a processed version adding stone texture to the tower in the photo at left. (B) Heatmap of this paired image. (C) AOIs. The TTFF again was shorter for the section of the building with texture, and the dwell time was longer (photos ©Hernan Rosas).
Applsci 13 12071 g009
Figure 10. (A) Paired image of a processed blank church wall in Cocula, Jalisco, Mexico, with the original stone wall, at left. (B) Heatmap of this pairing. (C) AOIs. The TTTF was shorter for the original stone wall, and the dwell time was longer (photos ©Hernan Rosas).
Applsci 13 12071 g010
Figure 11. (A) Paired image of a stone townhouse wall in Communications Hill, San Jose, CA, with a blank processed facade, at left. (B) Heatmap of this pairing. (C) AOIs. The TTFF was shorter for the building wall with less texture, but the dwell time was longer for the textured surface (photos ©Hernan Rosas).
Applsci 13 12071 g011
Figure 12. (A) Paired image of a repetitive glass facade in Manchester, England, with a natural setting near Bridger Bowl in Bozeman, Montana, USA, at left. (B) Heatmap of this pairing. (C) AOIs. The TTFF was shorter for the artificial scene, while the dwell time was longer for the natural scene (photos ©Alexandros Lavdas, Abigail Sekely).
Applsci 13 12071 g012
Figure 13. (A) Paired image of Bull Run Picnic Area, San Jose, CA and Porter Square transit station in Cambridge, MA, at left. (B) Heatmap of this pairing. (C) AOIs. The TTFF was shorter for the natural scene, and the dwell time was longer (photos ©Hernan Rosas, Ann Sussman).
Applsci 13 12071 g013
Figure 14. (A) Paired image of Porter Square transit station in Cambridge, MA, and woods in Canada, at left. (B) Heatmap of this pairing. (C) AOIs. The TTFF was shorter for the transit station, and also the dwell time was slightly longer for it (photos ©Ann Sussman, Kelley Prendergast).
Applsci 13 12071 g014
Figure 15. (A) Paired image of Harvard University student dormitory, Cambridge, MA, and a residential building, Boston, MA, at left. (B) Heatmap of this pairing. (C) AOIs. The TTFF was shorter for the traditional dormitory, at left, and the dwell time was longer (photos ©Ann Sussman).
Applsci 13 12071 g015
Figure 16. (A) Paired image of a processed version of the Milan Cathedral, where all details have been replaced by a photo of curtain wall face adjusted for color and the original building in Milan, Italy [5]. (B) Heatmap of this pairing. (C) AOIs. The TTFF was shorter for the original image of the Milan Cathedral, and the dwell time was longer (photos Alexandros Lavdas).
Applsci 13 12071 g016
Figure 17. (A) Paired image of a residence in Dutchess County, NY and a processed version without windows. (B) Heatmap of this pairing. (C) AOIs. The TTFF was shorter for the face-like original façade, and the dwell time was longer (photos ©Ann Sussman).
Applsci 13 12071 g017
Figure 18. (A) An Alpine landscape in Meran, South Tyrol, Italy, with two added buildings: either a building from the Golestan Palace complex in Tehran, Iran, or a public domain image of modern office building [27]. (B) Heatmap of this pairing. (C) AOIs (photos ©Alexandros Lavdas). The TTFF was shorter for the traditional elevation over the adjacent one showing an elevation with repetitive parallel lines; the dwell time was much longer for the traditional one.
Applsci 13 12071 g018
Figure 19. (A) Images of a residence in Bethlehem, PA, and two processed versions with fewer windows. (B) Heatmap of this trio. (C) AOIs. The TTFF was shorter for the house at far left, followed immediately by the one in the center; dwell time was longer for the original image on the right, becoming progressively shorter as openings are removed in the center and, even more, on the left (photos ©Abigail Sekely).
Applsci 13 12071 g019
Figure 20. (A) Paired image of Clara Shortridge Foltz Criminal Justice Center, Los Angeles, CA, and Calero Park, San Jose, CA (B) Heatmap of this pair. (C) AOIs. The TTFF was shorter for the manmade, repetitive scene over the natural one on the right; the dwell time, however, was longer for the latter (photos ©Nikola Olic, Hernan Rosas).
Applsci 13 12071 g020
Figure 21. (A) Paired image of parking garage wall in Somerville, MA, and a processed version with patterns. (B) Heatmap of this pair. (C) AOIs. The TTFF was shorter for the blank wall over the patterned one; the dwell time however was longer for the latter (photos ©Ann Sussman, Janice Ward).
Applsci 13 12071 g021
Figure 22. (A) Paired image of a spoon with rudimentary face-like cut-outs, and a processed version without them. (B) Heatmap of the pair. (C) AOIs.The TTFF was shorter for the spoon with a face over the blank one without, and the dwell time was longer for it (photos ©Ann Sussman).
Applsci 13 12071 g022
Figure 23. (A) TTFF from all studies, organized by thematic category. (B) Dwell time from all studies, organized by thematic category. Single asterisk indicates p < 0.05, and two asterisks indicate p < 0.01 in Student’s t-test.
Applsci 13 12071 g023
Figure 24. Cumulative results for comparisons between all pairs of images with Nature-Like Geometry and Non-Nature-Like Geometry (see text). Three asterisks indicate p < 0.001 in Student’s t-test.
Applsci 13 12071 g024
Disclaimer/Publisher’s Note: The statements, opinions and data contained in all publications are solely those of the individual author(s) and contributor(s) and not of MDPI and/or the editor(s). MDPI and/or the editor(s) disclaim responsibility for any injury to people or property resulting from any ideas, methods, instructions or products referred to in the content.

