Article

A Novel CA-RegNet Model for Macau Wetlands Auto Segmentation Based on GF-2 Remote Sensing Images

1
School of Computer Science and Engineering, Faculty of Innovation Engineering, Macau University of Science and Technology, Macau, China
2
School of Computer Science, Zhuhai College of Science and Technology, Zhuhai 519041, China
3
State Key Laboratory of Lunar and Planetary Sciences, Macau University of Science and Technology, Macau, China
*
Author to whom correspondence should be addressed.
Appl. Sci. 2023, 13(22), 12178; https://doi.org/10.3390/app132212178
Submission received: 9 October 2023 / Revised: 1 November 2023 / Accepted: 7 November 2023 / Published: 9 November 2023
(This article belongs to the Section Earth Sciences)

Abstract

:
Wetlands, situated at the vital intersection of terrestrial and aquatic ecosystems, are pivotal in preserving global biodiversity and maintaining environmental equilibrium. The escalating trend of global urbanization necessitates the utilization of high-resolution satellite imagery for accurate wetland delineation, which is essential for establishing efficacious conservation strategies. This study focuses on the wetlands of Macau, characterized by distinctive coastal and urban features. A noteworthy enhancement in this study is the integration of the Coordinate Attention mechanism with the RegNet model, forming the CA-RegNet. This combined model demonstrates superior performance, outdoing previous Macau wetlands segmentation studies that used ResNet, evidenced by an approximate rise of 2.7% in overall accuracy (OA), 4.0% in the Kappa coefficient, 1.9% in the mAcc, and 0.5% in the mIoU. Visual evaluations of the segmentation results reinforce the competence of the CA-RegNet model in precisely demarcating coastal wetlands and Saiwan Lake, thereby overcoming the former constraints of ResNet and underscoring the robustness and innovation of this study.

1. Introduction

Wetlands, characterized as diverse biological ecosystems, play a pivotal role in bridging terrestrial and aquatic environments, thereby sustaining life on Earth [1]. Their invaluable functions range from conserving biodiversity and supporting global hydrological cycles to mitigating climate change, highlighting their indispensable contribution to environmental balance. The rapid increase in global urbanization exerts significant stress on these ecosystems, emphasizing the urgency to adopt effective conservation measures [2]. The accurate identification, classification, and mapping of these areas are paramount, accentuating the importance of high-resolution satellite imagery for wetland segmentation. The wetlands in Macau, with their unique blend of coastal and urban attributes, provide an exemplary subject for understanding such complex terrains [3].
Previous research in wetland segmentation has extensively employed various data sources and technological advancements. Recent studies have leveraged various types of remote sensing images, including multispectral images (e.g., Landsat and Sentinel-2) [4], hyperspectral images (e.g., AVIRIS and Hyperion) [5], and synthetic aperture radar images (e.g., RADARSAT and ALOS PALSAR) [6]. Concurrently, the research on wetland remote sensing image segmentation has advanced significantly by employing a variety of techniques for classification and segmentation [7,8]. These include not only traditional machine learning algorithms such as support vector machines (SVM) and random forests (RF) [9,10], but also some deep learning models like U-Net and deep convolutional neural networks [11,12]. Moreover, several studies have ventured into combining both textural and spectral data to enhance the precision of wetland feature detection [13]. In the context of Macau’s wetlands, the introduction of ResNet, a deep learning model, marked a significant advancement, primarily aimed at reducing misclassification of features, especially in the coastal regions of Coloane Island [14]. Despite the progress attributed to the ResNet model, certain gaps remain, impeding its optimal efficacy in wetland segmentation. For example, precisely characterizing coastal wetlands continues to pose challenges, with instances like Saiwan Lake erroneously classified as a constructed wetland. These limitations highlight the necessity for ongoing research dedicated to enhancing image segmentation methodologies for wetlands [15].
In response to these challenges, the current study employs advanced deep learning models to accomplish two primary objectives. Firstly, it improves the segmentation precision when compared to preceding research, and, secondly, it accurately categorizes Saiwan Lake as a constructed wetland [14]. Moreover, this research rectifies earlier limitations by effectively identifying areas up to 6 m above sea level on Coloane Island as coastal wetlands [15]. The RegNet model, a sophisticated segmentation method, shows significant performance improvement over the ResNet model, particularly in coastal wetland extraction and the classification accuracy of Saiwan Lake. A novel aspect of this research is the integration of the recently proposed Coordinate Attention mechanism with the RegNet model [16], resulting in the innovative CA-RegNet model. Although the model encountered misclassification issues around Coloane Island due to the inconsistent quality of the source image, the CA-RegNet model exhibited a marked improvement in segmentation performance metrics.
Furthermore, this study introduces advanced wetland segmentation models such as Res2Net, ConvNeXt, EfficientNet B7, Inception-RegNet, and SE-RegNet. These models are applied to wetland image segmentation, using the previously studied ResNet model for comparison. Notably, ConvNeXt, EfficientNet B7, Inception-RegNet, and SE-RegNet models exhibit superior performance in image segmentation, marking their inaugural application in wetland remote sensing image segmentation. The results of the segmentation derived from these refined satellite imagery models undergo rigorous visual interpretation evaluation to ensure result accuracy and reliability. Consequently, the advancements realized in this study contribute significantly to wetland remote sensing image segmentation, especially within Macau’s wetlands. This provides a fresh framework for devising sound and reliable conservation strategies. The introduction and successful integration of these novel methodologies suggest a comprehensive and sustainable trajectory for wetland conservation.

2. Study Region Overview

This study focuses on the coastal city of Macau, located at the lower reaches of the Pearl River. Due to its strategic location and unique environmental features, Macau boasts a vast expanse of mudflats, fostering remarkable biodiversity. This blend of natural landscapes within an urban setting forms a complex wetland system that warrants thorough investigation and strategic conservation efforts. Macau’s specific geographic location, between North latitude 22.1068 and 22.2413 degrees and longitudes 113.5281 to 113.5989 degrees East, engenders a combination of climatic and geological factors that support a dynamic aquatic ecosystem. This ecological system, particularly the mudflats, significantly enhances the city’s biological diversity [17].
For the purpose of this study, the BOUL, representing Macau’s administrative boundary, has been carefully selected. This delineation seeks to provide accurate demarcation of the city’s wetland regions and facilitate a detailed classification of the diverse wetlands within the city’s well-defined borders. Observing Macau’s wetland distribution, the city encompasses various taxa, from coastal or marine wetlands to several constructed wetlands. The coastal wetlands, influenced by the neighboring marine ecosystem, function as dynamic biomes with diverse flora and fauna [18]. These wetlands offer essential ecological benefits, ranging from serving as natural barriers against severe marine weather, to accommodating a myriad of marine organisms. In contrast, the constructed wetlands, crafted by human intervention, fulfill numerous ecological and socio-economic roles. Created for functions including waste treatment, stormwater management, and habitat restoration, these designed wetlands coexist harmoniously with the urban environment.
Macau, characterized by a diverse range of wetland types, stands as a suitable focus for this investigation. The city’s varied wetland ecosystems, shaped by distinct geographical features and human intervention, highlight its vital ecological significance and emphasize the need for detailed study and conservation.

3. Data and Methodology
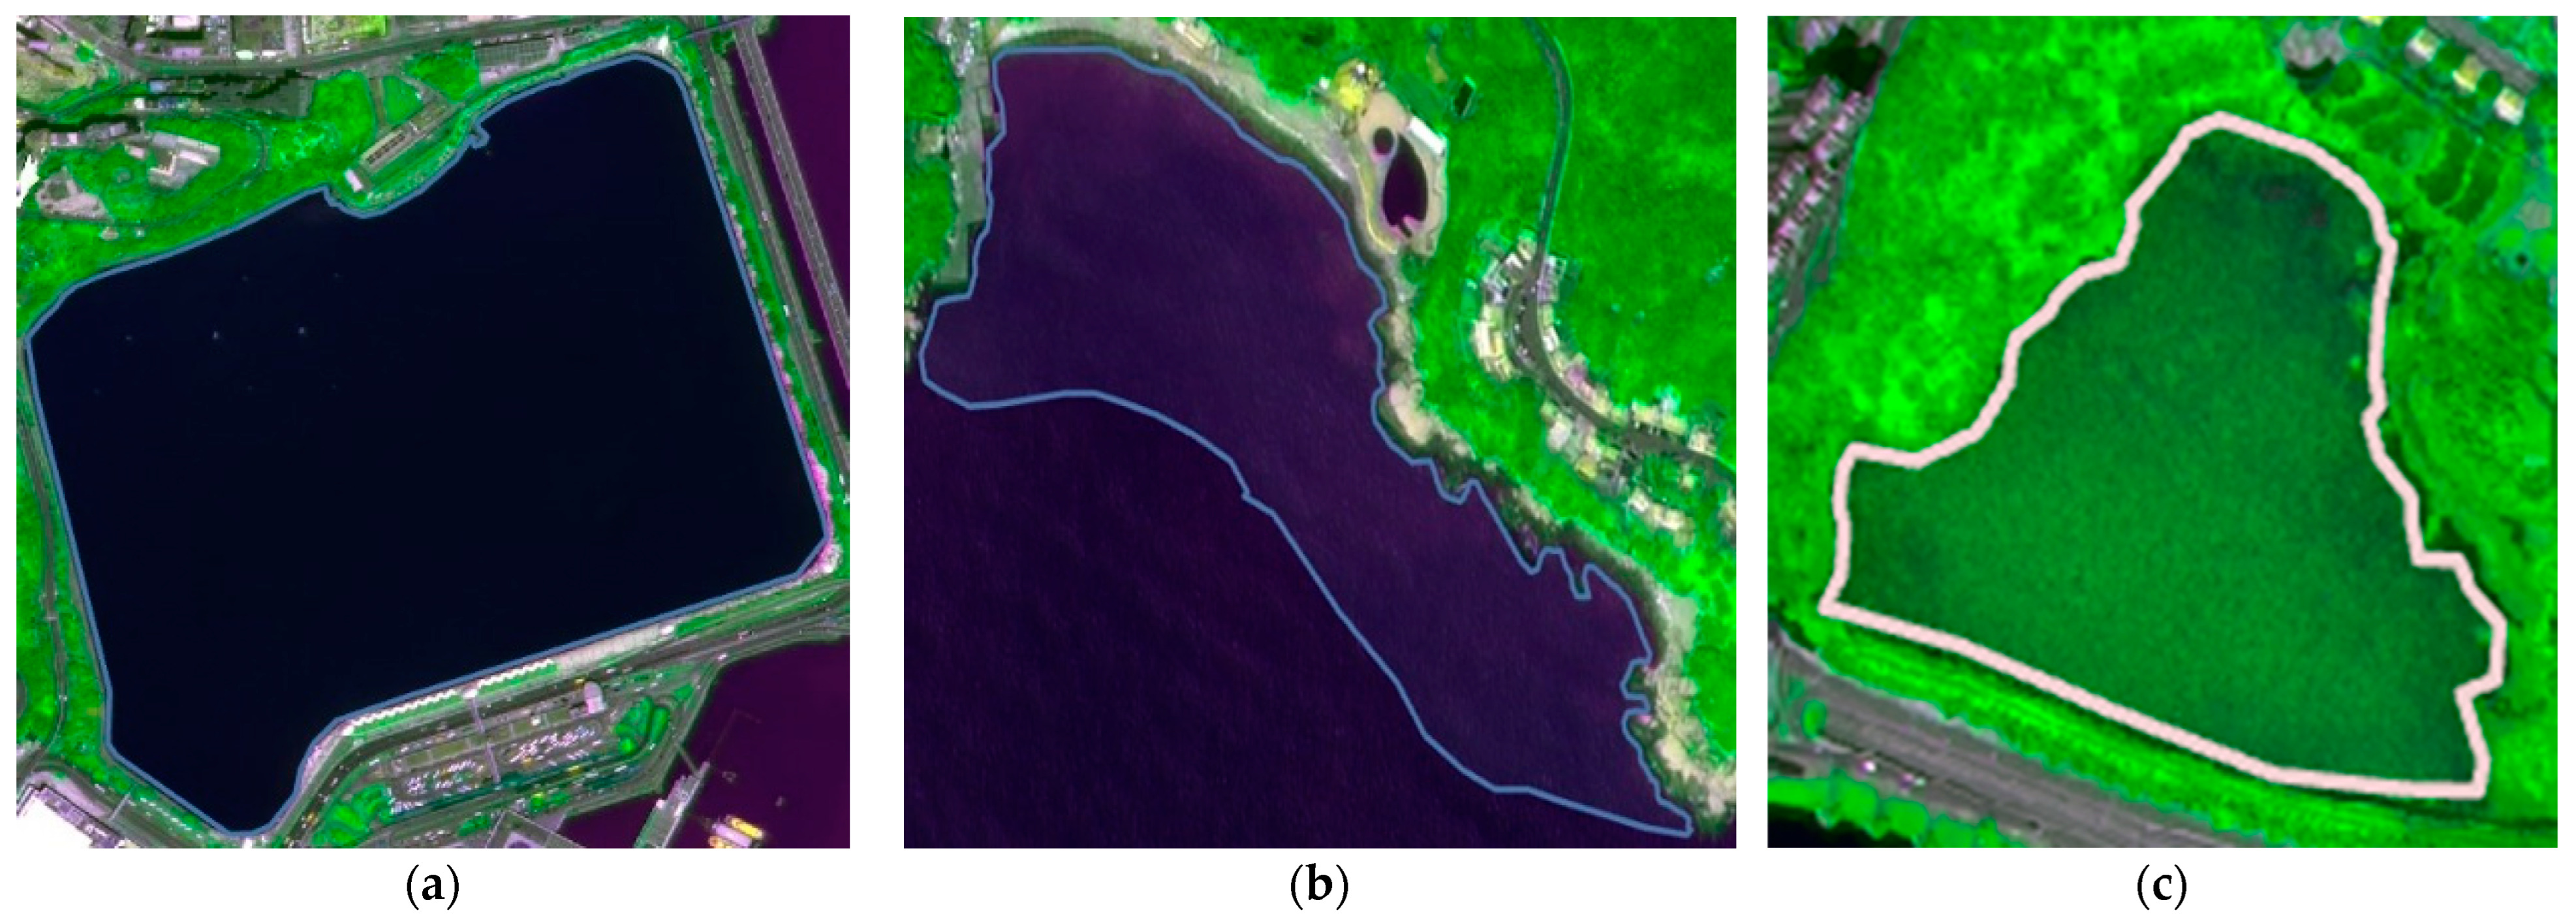
3.1. Dataset

This study utilizes high-resolution remote sensing imagery from the Gaofen-2 (GF-2) satellite. Launched and operational since 19 August 2014, the GF-2 represents China’s inaugural satellite dedicated to civilian use [19]. To optimize wetland extraction, data from April to October within the designated study area were emphasized. The period for data collection was carefully chosen, recognizing the profound impact of data quality on research results. For thorough coverage of Macau, GF-2 satellite imagery spanned three distinct scenes, with data specifically acquired on 26 August 2017 and 4 October 2018. The systematic selection and analysis of this data are crucial to ensuring the accuracy and credibility of the research outcomes.
In this study, the preprocessing of GF-2 MSS images encompasses steps such as radiometric calibration, atmospheric corrections, and orthorectification, all executed using the ENVI 5.3 software. The PAN images underwent both radiometric calibration and orthorectification. Radiometric calibration adjusts raw imagery by converting digital numbers into reflectance values, enhancing overall image quality. Atmospheric correction removes distortions induced by the Earth’s atmosphere, ensuring a truer representation of ground conditions. Orthorectification corrects for errors associated with terrain elevations, producing a geometrically accurate representation of the Earth’s surface [20]. Subsequently, the PAN and MSS images undergo image fusion, a method that merges high-resolution panchromatic images with low-resolution multispectral images. This preserves the spatial details of the former and integrates the spectral information of the latter. The image is then cropped to the study region’s specifications using ENVI software. Geometric corrections and image mosaicking are adeptly performed with the ERDAS 2016 software, aligning various images into a cohesive composite, facilitating an in-depth visual analysis [21].
Sample generation is a critical step in this study. An 11 × 11-pixel sample, chosen using the ArcGIS Pro 3.1 software, is intentionally selected to optimize compatibility with the training model. The specific dimension selection is designed to strengthen the correlation, enhancing the accuracy of predictions from the training model. Owing to the restricted availability of samples for artificial wetlands, this study implements downsampling techniques to attain sample equilibrium [22]. Figure 1 illustrates the technical approach employed in this research.
In this study, the band synthesis approach is centered around a 342-band combination scheme. This carefully devised scheme is designed to effectively distinguish various categories. Utilizing visual analytics, specific flags are interpreted to annotate diverse wetland types within the Macau region, facilitating the generation of pertinent samples. As an illustration, Figure 2a showcases the reservoir in Macau, exemplifying artificially constructed wetlands. Simultaneously, Figure 2b presents a sample from Macau’s Cheoc-Van coastal mudflats, highlighting their distinct wetland ecosystem. Figure 2c further displays the coastal mangrove wetland adjacent to Lung Wan Lohas in Macau.

3.2. Deep Learning Models
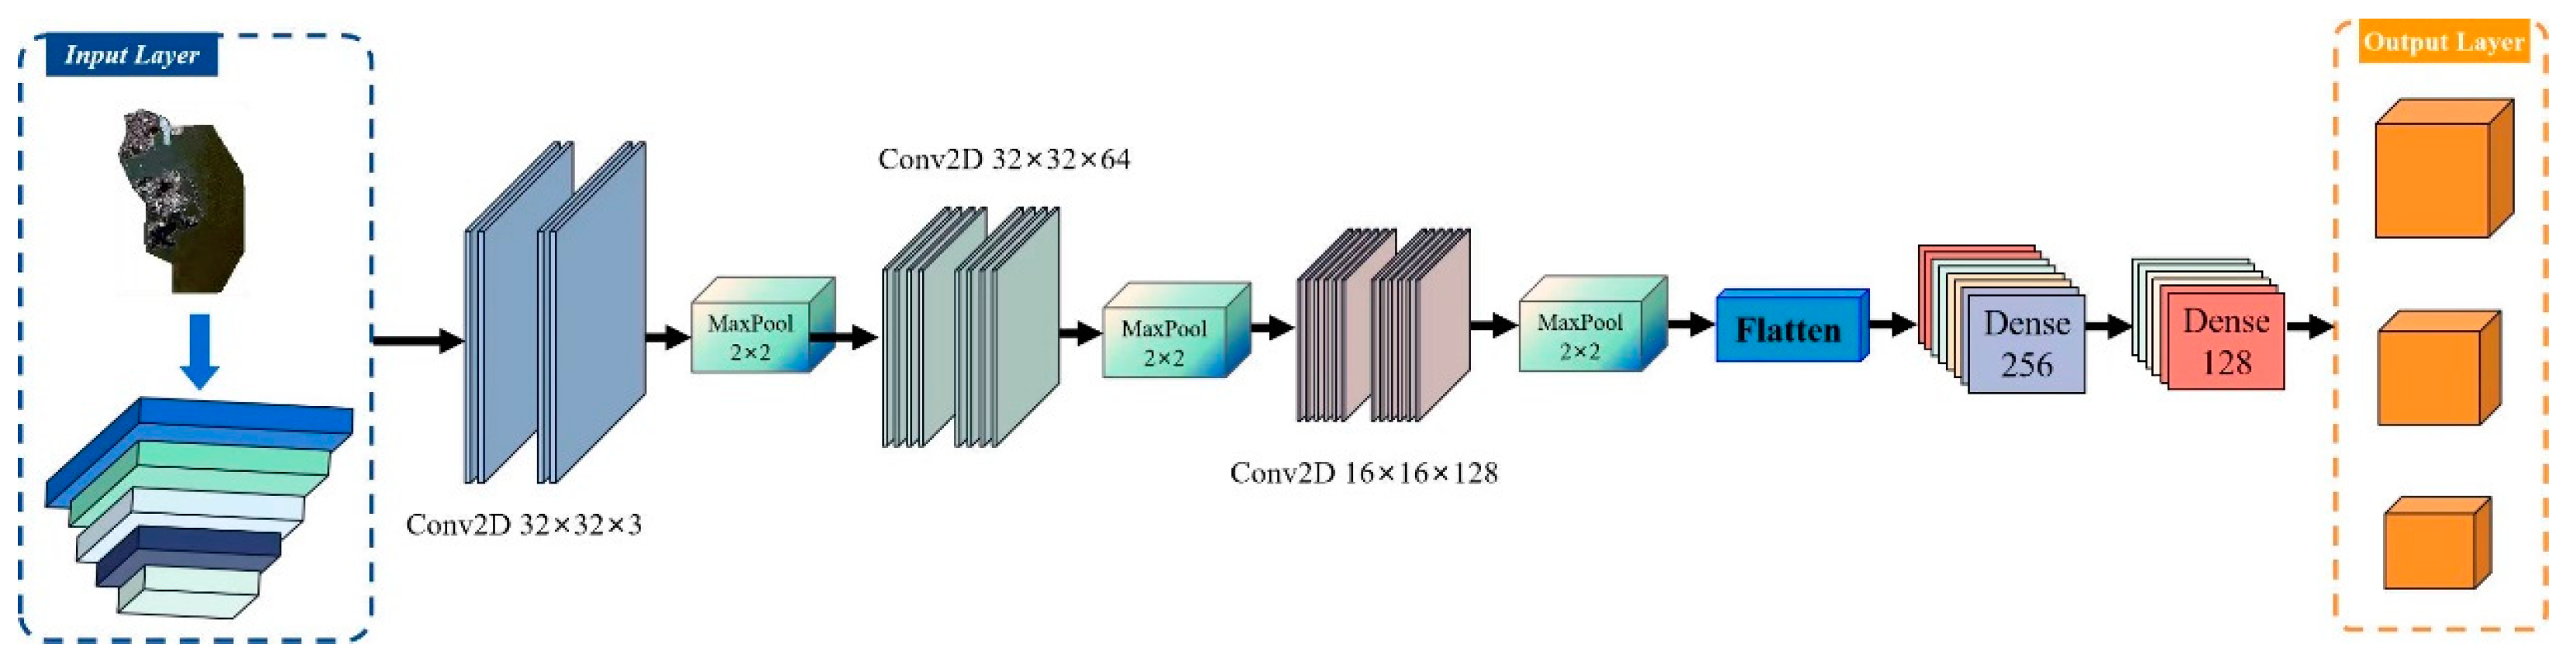
3.2.1. ResNet Model

This study employs the ResNet model for benchmarking, leveraging its renowned effectiveness in various vision tasks due to its distinctive hierarchical residual connections [23]. Given the complex landscape of wetlands, comprising heterogeneous elements like water, vegetation, and artificial structures, ResNet’s superior multi-scale feature extraction and contextual comprehension provide detailed perspectives on these elaborate attributes. The selection of ResNet for wetland image segmentation in prior research is attributed to its demonstrated proficiency in deciphering complex spectral–spatial relationships, rendering it optimal for analyzing the intricate characteristics of wetlands [24]. Consequently, ResNet is utilized in this research as the benchmark for comparison.
In this study, the ResNet model is initiated with a 2D convolutional layer for spectral–spatial feature extraction, followed by a max pooling layer to reduce spatial dimensions. Core to the model is cascading ResNet blocks, each adept at efficient multi-scale feature extraction [25]. These blocks contain parallel convolutional towers designed to capture intricate spectral–spatial relationships. A shortcut connection amalgamates the resulting feature maps, mitigating the deep learning issue of gradient vanishing. Key parameters include a primary convolutional layer with 64 filters and a 7 × 7 kernel, followed by a max pooling layer with a 3 × 3 kernel size. The design ensures efficient backpropagation and addresses deep learning challenges. In this study, the number of epochs is set at 180, ascertained through cross-validation to assess model complexity and learning rates to avoid the presence of overfitting. To further mitigate overfitting, dropout layers are incorporated, and L2 regularization is applied. Figure 3 illustrates the model’s architecture.

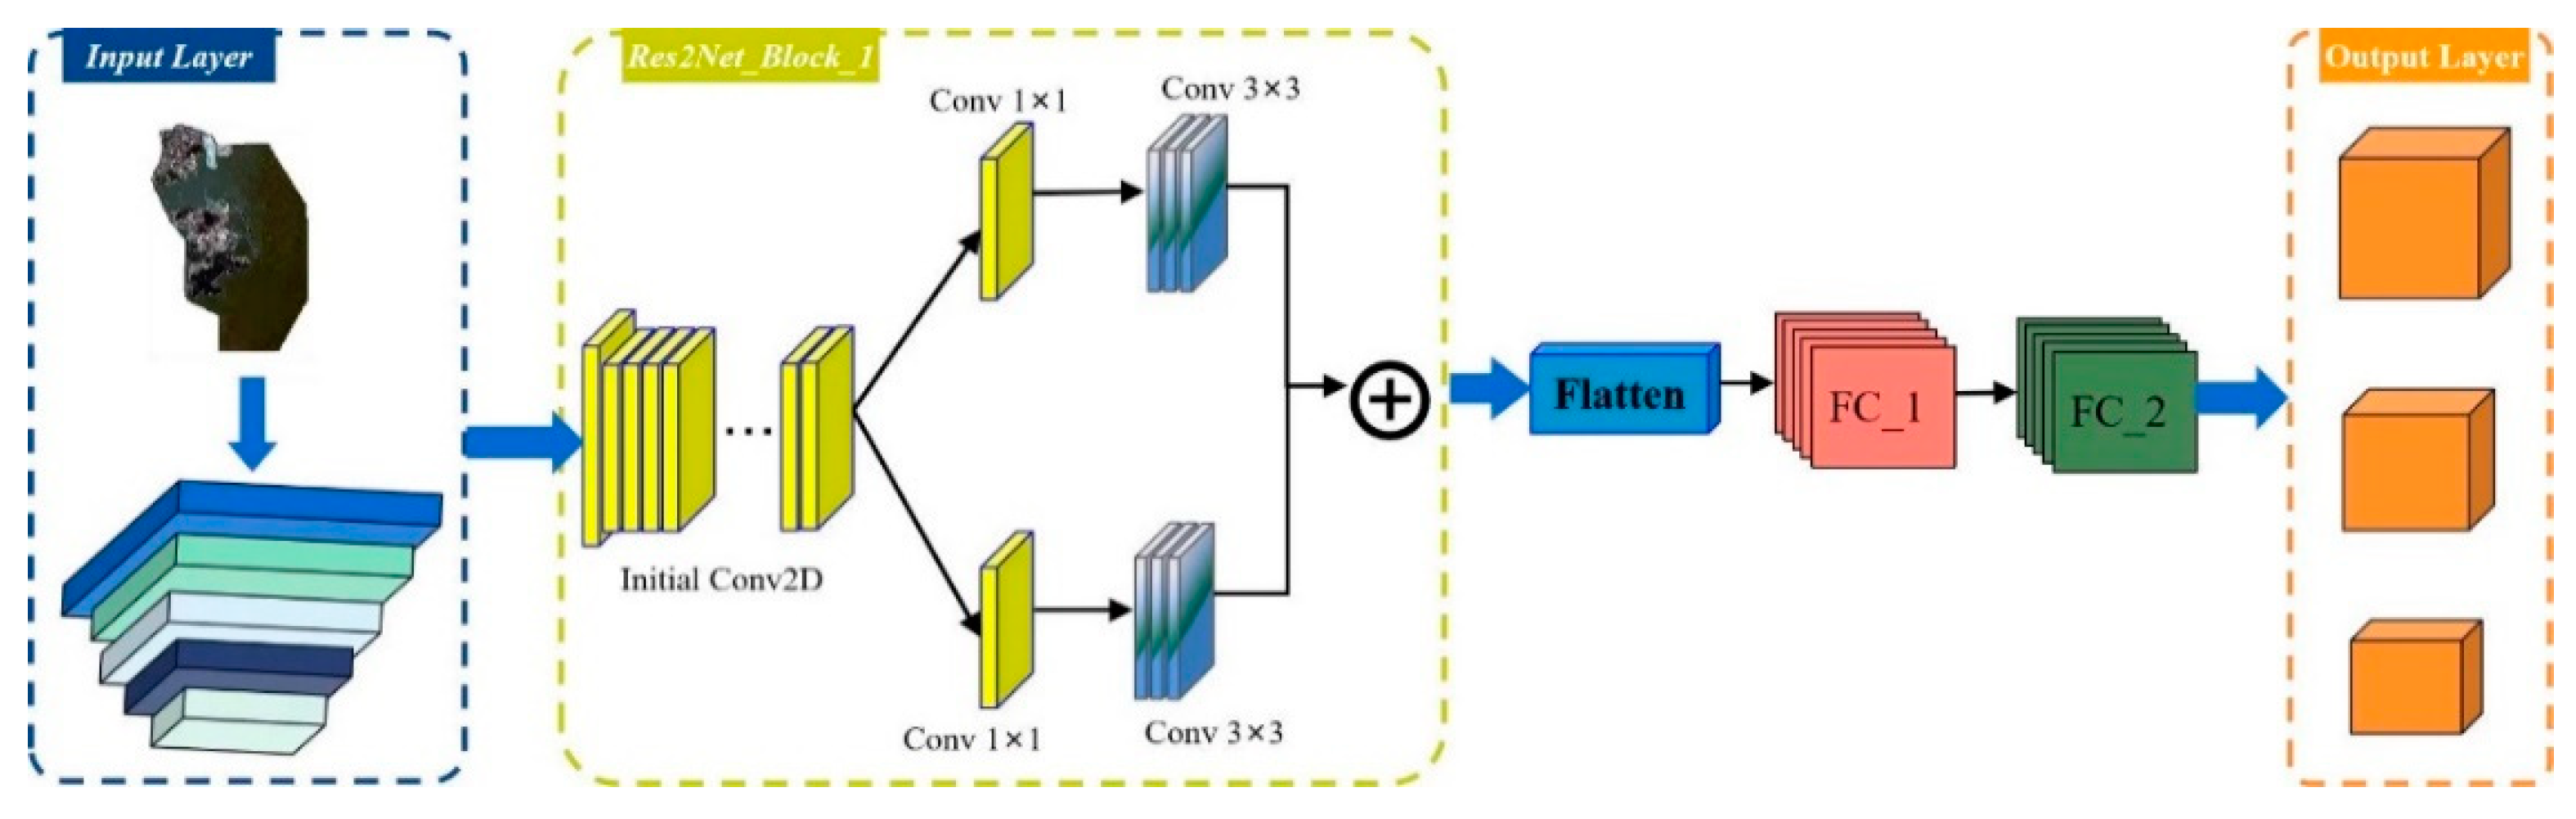
3.2.2. The Res2Net Model

This study employs the Res2Net model, known for its superior performance in vision tasks and its unique hierarchical connections within residual blocks [26]. Unlike traditional models like ResNet, Res2Net excels in extracting multi-scale features and assimilating extensive contextual data. This research highlights the proficiency of the Res2Net model in parsing the multifaceted characteristics of wetlands, encompassing components like water and vegetation. The model’s adeptness at assimilating extensive contextual nuances furnishes a more discerning array of features, advantageous for ensuing classification tasks.
This study employs the Res2Net model, starting with a 2D convolutional layer for spectral–spatial feature extraction, followed by a max pooling layer to reduce spatial complexity. Key to the model is sequential Res2Net blocks, specialized for efficient, multi-scale feature extraction [27]. These blocks contain parallel convolutional towers that capture complex spectral–spatial relationships. A shortcut connection merges the resulting feature maps, aiding efficient backpropagation and countering the challenge of gradient vanishing. Notable parameters include a primary convolutional layer with 64 filters and a 7 × 7 kernel, succeeded by a max pooling layer with a 3 × 3 kernel and a 2 × 2 stride. In this study, the model underwent 150 epochs, a parameter established through cross-validation outcomes to assess aspects such as model complexity and learning rate, which are used to avoid the overfitting. A strategic application of a hybrid loss function, integrating both CE_Loss and FocalLoss, was employed to mitigate the further risk of overfitting [28,29]. Figure 4 depicts the model’s architecture.

3.2.3. RegNet Model

The RegNet model is recognized for its methodically structured architecture and exceptional performance in vision tasks. It efficiently extracts multi-scale features from high-resolution images, making it well-suited for remote sensing applications. In this research, spectral–spatial feature extraction commences with an initial convolution layer, succeeded by a sequence of meticulously optimized RegNet blocks. Each block is specifically engineered for proficient feature extraction and dimensionality reduction, streamlining the process [30]. RegNet’s advanced proficiency in handling intricate imagery and its efficiency in delineating structural attributes of wetlands make it particularly advantageous for enhancing the accuracy of high-resolution wetland remote sensing image segmentation [31].
In this research, the model incorporates fully connected layers, specifically comprising 256 and 128 units. These layers execute non-linear transformations on the input data, utilizing ‘ReLu’ as the activation function [32]. Concluding the model architecture is an output layer with three units, tailored to differentiate designs across three distinct classes. The ‘softmax’ activation function is employed here to ensure non-negative outputs that sum to one. For model optimization and loss computation, the ‘sparse_categorical_crossentropy’ is designated as the loss function, and ‘RMSprop’ acts as the optimizer with a learning rate set at 0.001. The performance evaluation of the model is primarily based on its accuracy. In the study, 200 epochs were selected as the optimal number, following close observation of the convergence in the validation error rate. The strategy of early stopping was implemented to mitigate the risk of overfitting. The distinct architecture of the implemented RegNet model is depicted in Figure 5.

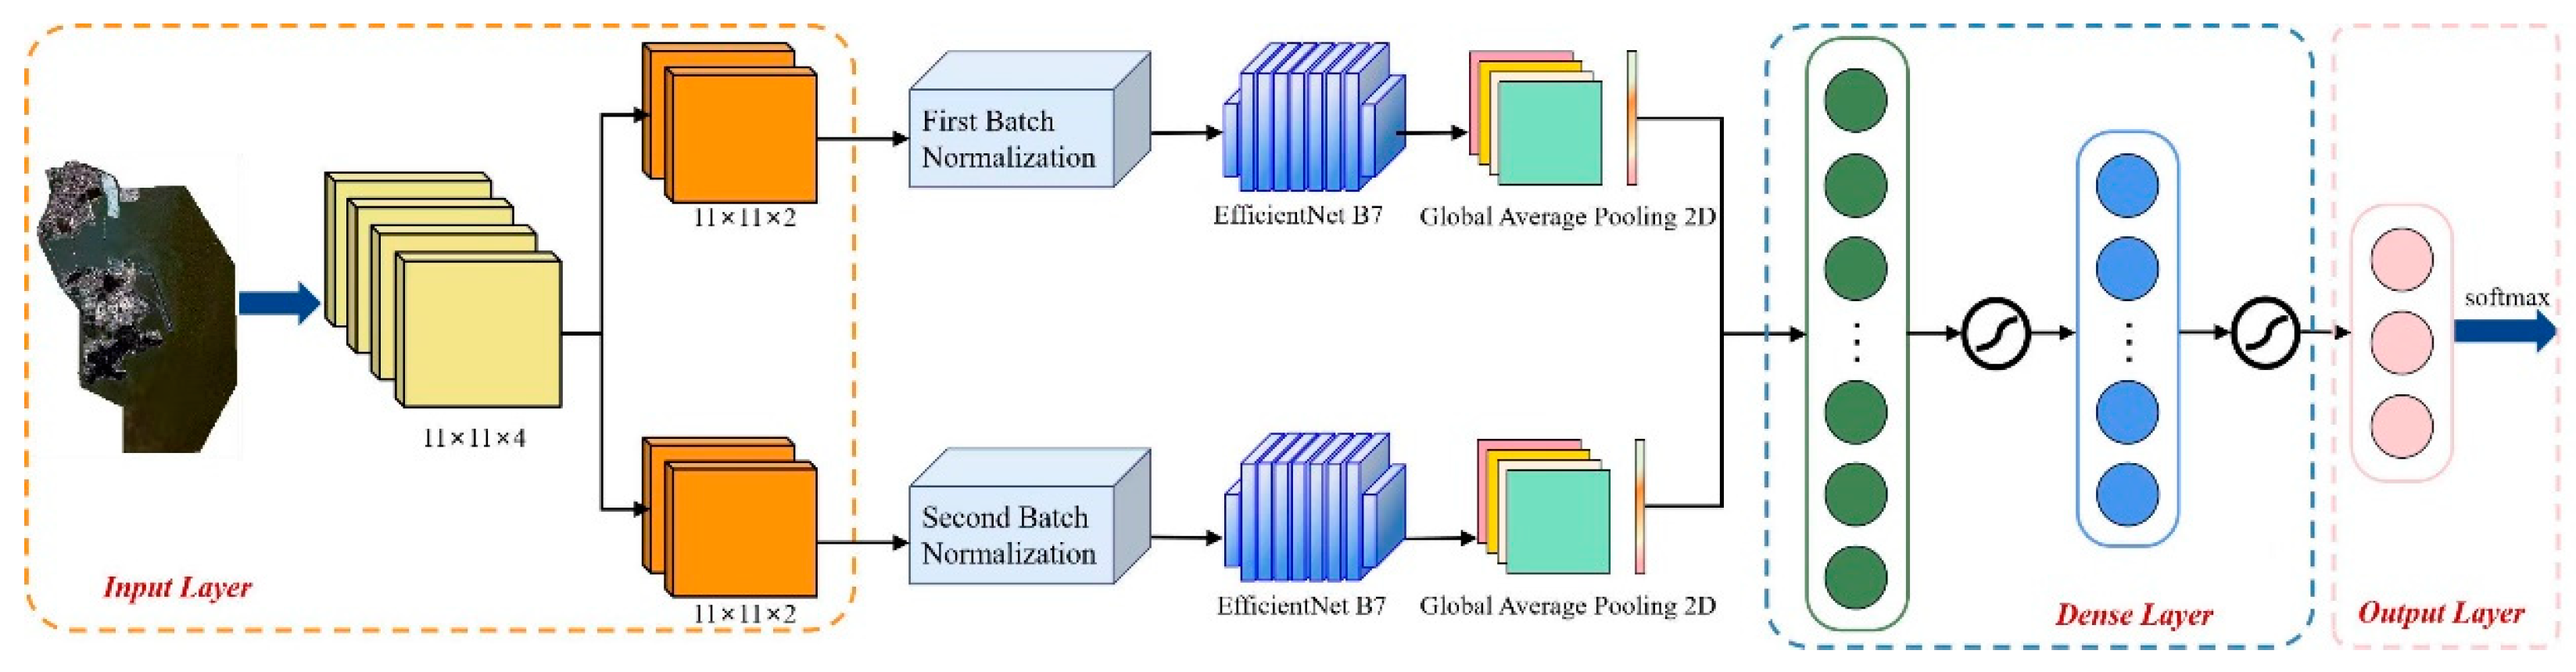
3.2.4. EfficientNet B7 Model

In the current research, EfficientNet B7 is adopted for wetland remote sensing segmentation, owing to its sophisticated architecture and capacity for managing high-resolution data. Distinct from conventional models, this approach deploys parallel sub-models to analyze two-channel data subsets independently, thereby optimizing learning processes and discerning complex data correlations. The incorporation of a distinctive batch normalization technique contributes to model stability, augmenting resilience for tasks involving high-resolution criteria [33]. The amalgamation of these varied feature sets enables EfficientNet B7 to provide an exhaustive and subtle interpretation of multichannel data, establishing it as a superior solution for enhancing the accuracy of high-resolution wetland image segmentation [34].
Given the model’s three-channel input prerequisite, four-channel image data in this study are subdivided into subsets. Each subset contains two channels, resulting in an ensemble of data slices. Each generated slice then feeds into sub-models, which are based on the EfficientNet B7 architecture. These sub-models accommodate three channels of data, simplifying the challenges typically associated with direct multichannel data processing. Batch normalization is applied before the data is inputted into the EfficientNet B7 network [35], enhancing the model’s learning environment and promoting better generalization. The sub-models produce corresponding feature sets, which undergo global pooling to achieve uniform dimensions, prior to the concatenation phase. These layers consist of 256 and 128 units, each activated by the ‘relu’ function. The study implemented 140 epochs, a parameter established through cross-validation outcomes, instrumental in assessing the intricacies of model complexity, learning rate, and the potential for both overfitting and underfitting. To counteract overfitting, an amalgamation of CE_Loss and FocalLoss was employed, as substantiated by references [28,29]. The EfficientNet B7 model’s architecture for this research is depicted in Figure 6.

3.2.5. ConvNeXt Model

In the realm of wetland remote sensing image segmentation, this study introduces the application of the ConvNeXt model. Recognized for its expertise in processing high-resolution imagery and conducting multi-scale feature extraction, ConvNeXt proves particularly effective for the analysis of the intricate spectral–spatial characteristics inherent to wetland landscapes [36]. The advanced interpretative abilities of this model not only propose an innovative methodology for wetland segmentation but also establish a pioneering standard for subsequent studies utilizing deep learning within complex ecosystems. These qualities distinctly position ConvNeXt as an exemplary selection for augmenting the accuracy and comprehensiveness of wetland image analysis [37].
In this research, the ConvNeXt model is deployed for complex wetland segmentation, starting with an initial convolutional layer for spectral–spatial feature extraction. Following this are specialized ConvNeXt blocks containing convolutional and MaxPooling2D layers for spatial reduction. The architecture utilizes 64-filter initial layers with a 7 × 7 kernel and ‘relu’ activation. Group convolutions in subsequent blocks enhance capacity without added complexity [38]. Fully connected layers with 256 and 128 ‘relu’-activated units lead to a three-unit ‘softmax’ output layer for class categorization. Optimized with ‘sparse_categorical_crossentropy’ and ‘RMSprop’, this efficient architecture underscores ConvNeXt’s suitability for high-resolution wetland segmentation. The model underwent preliminary runs, setting the epoch number at 120, a parameter established through meticulous consideration of cross-validation results to assess model complexity, learning rate, and potential scenarios of overfitting or underfitting. To circumvent overfitting, a strategic amalgamation of CE_Loss and FocalLoss was implemented [28,29]. Figure 7 delineates the ConvNeXt model’s architecture as applied in this investigation.

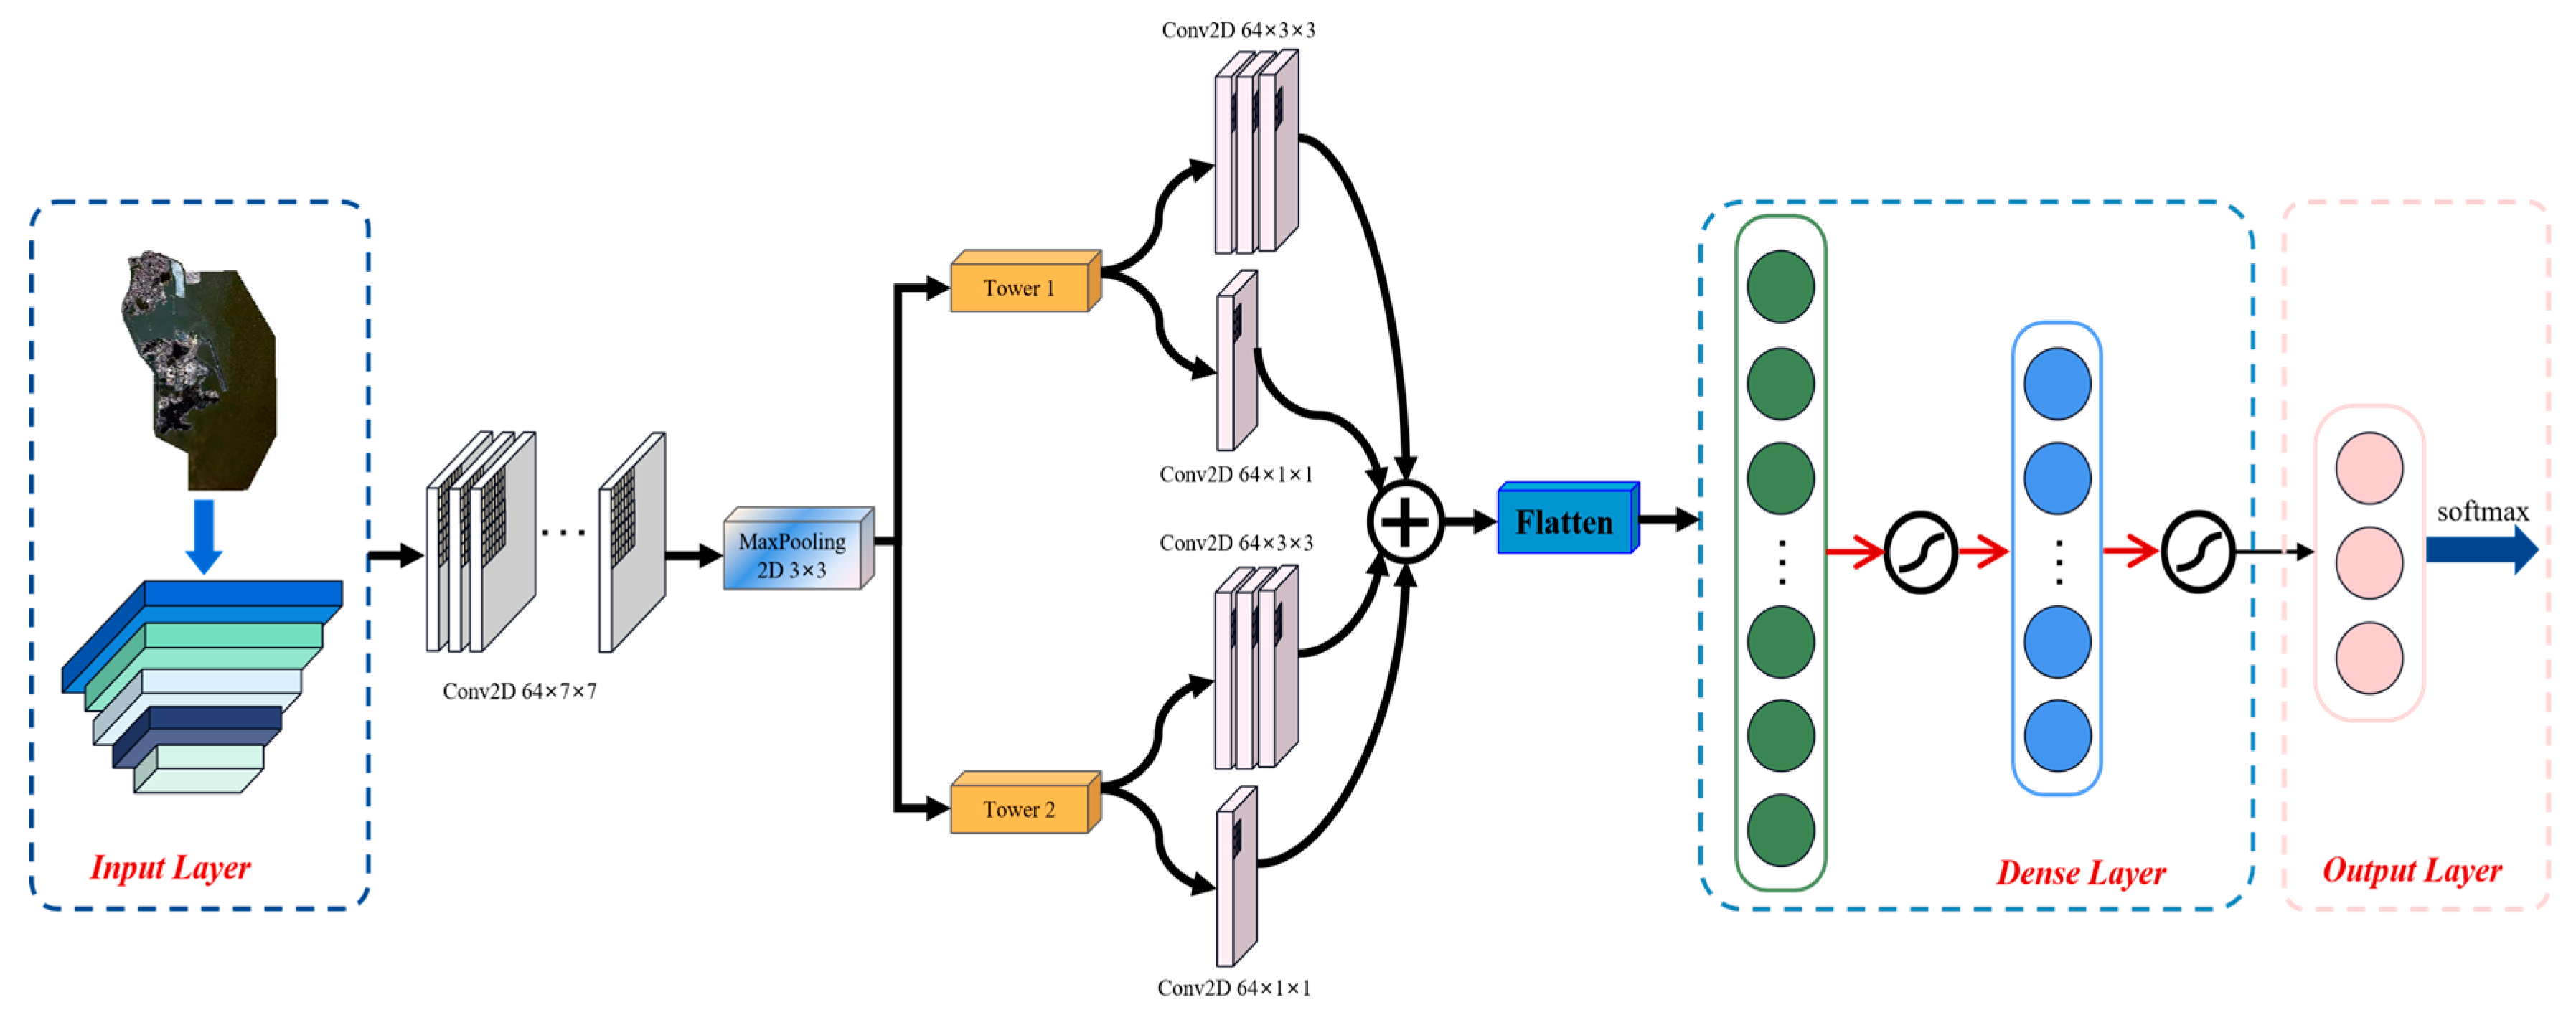
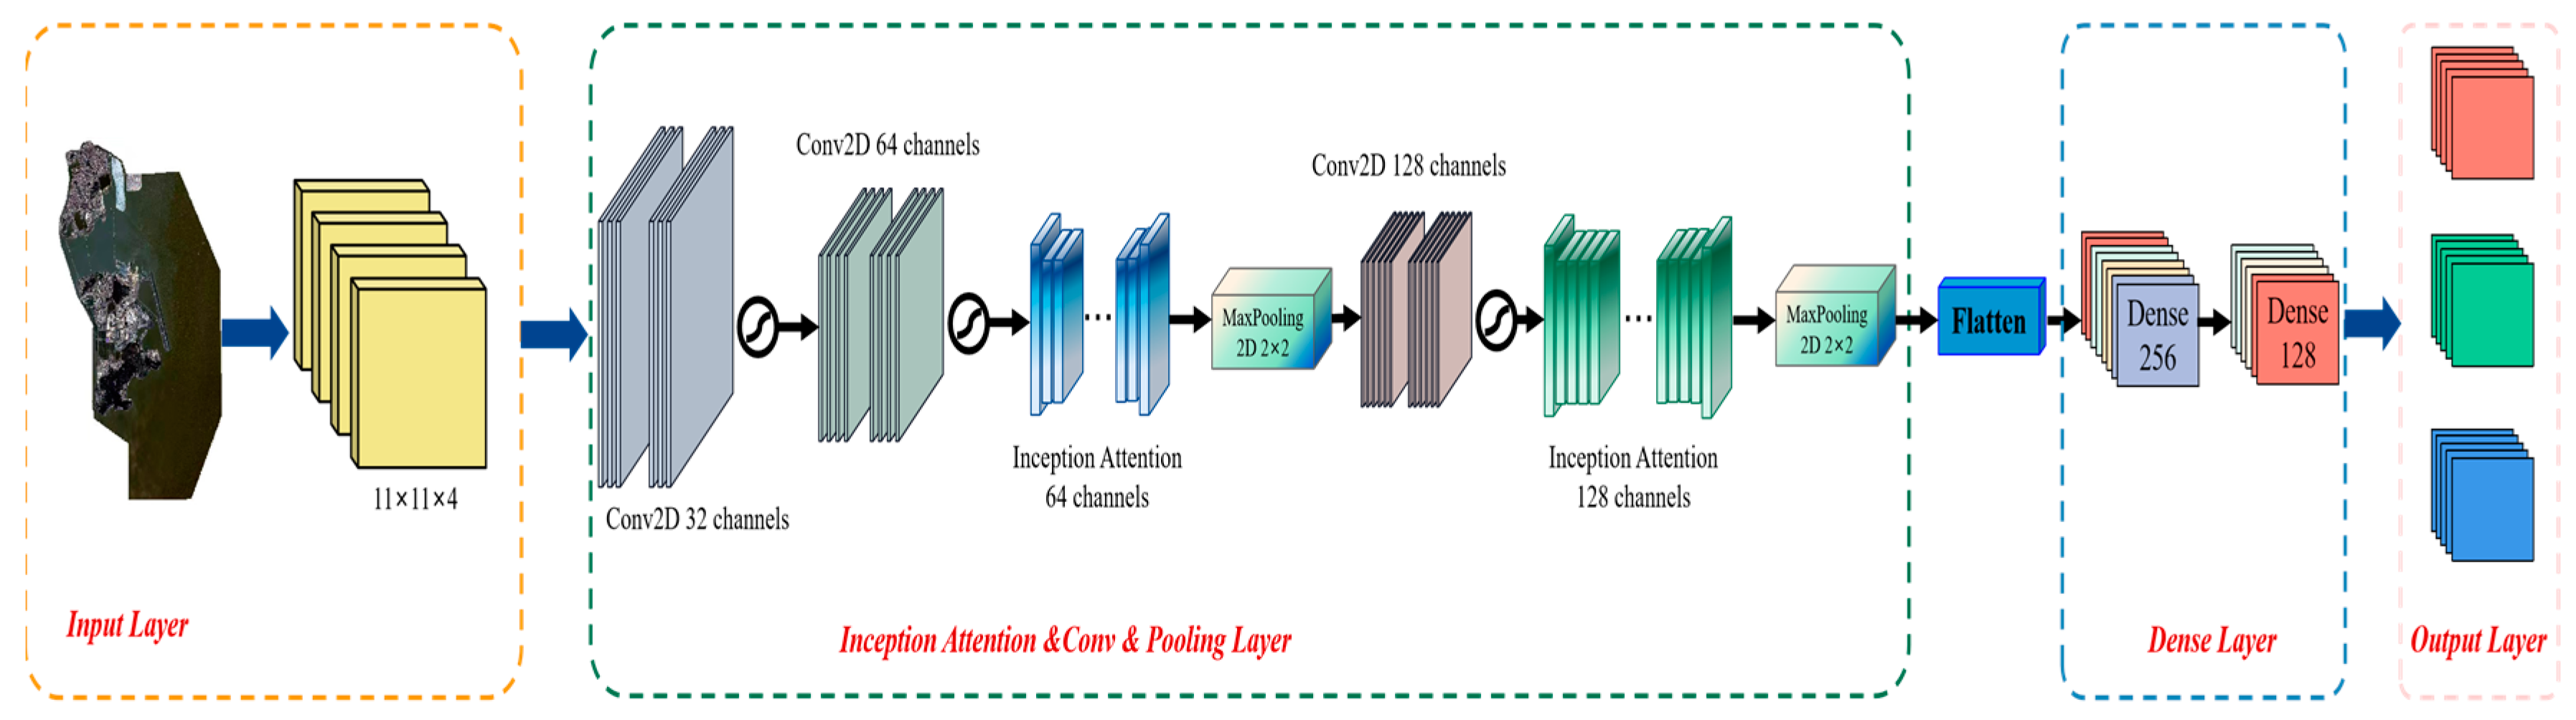
3.2.6. Inception-RegNet Model

In this study, it introduces the Inception-RegNet model, a novel fusion aimed at enhancing the extraction of spectral–spatial features from high-resolution wetland images [39]. This hybrid model harnesses the multi-level feature extraction capabilities of Inception and the scalable architecture of RegNet, facilitating a sophisticated interpretation of intricate wetland attributes [40]. The adoption of this cohesive strategy is informed by its capacity to amalgamate the virtues of both foundational models synergistically, enhancing the precision and intricacy of wetland image segmentation.
The model architecture starts with an initial convolutional layer for feature extraction, followed by a series of Inception-RegNet blocks incorporating Inception Attention modules. These modules apply channel-wise attention to prioritize key features. Each block contains Conv2D layers with escalating filter numbers and a MaxPooling2D layer for spatial reduction. The features extracted are then flattened and processed through fully connected layers, culminating in an output layer that classifies the wetland into three distinct categories. The model’s debut in wetland segmentation brings together the best of both Inception and RegNet, offering enhanced precision for analyzing complex wetland landscapes. The model was trained over 130 epochs, a parameter determined through cross-validation to assess model complexity, learning rate, and the propensity for overfitting or underfitting. To mitigate overfitting, data augmentation strategies, including rotation and flipping, were implemented. Figure 8 delineates the architecture of the Inception-RegNet model.

3.2.7. SE-RegNet Model

The SE-RegNet model advances wetland image segmentation through its sophisticated management of intricate, high-resolution spectral–spatial features. Although traditional models such as RegNet efficiently execute hierarchical feature extraction, SE-RegNet amplifies this function by integrating a Squeeze-and-Excitation (SE) block, facilitating channel-wise feature recalibration [41]. This enhanced characteristic renders SE-RegNet especially adept at interpreting the complex aspects of wetland biomes [42].
In this research, the SE-RegNet model begins with an initial convolution layer for feature extraction, followed by a series of SE-RegNet blocks. These blocks incorporate a special ‘Squeeze-and-Excitation’ (SE) operation, dynamically recalibrating channel-wise feature maps to emphasize relevant features. Each block combines a convolutional layer with a MaxPooling2D layer for spatial dimension reduction. The architecture culminates in a fully connected output layer designed for multi-class categorization, using ‘sparse_categorical_crossentropy’ for loss and ‘adam’ for optimization. This structure allows SE-RegNet to balance feature relevance and architectural complexity effectively. The model employs 200 epochs, determined through cross-validation results, assessing aspects such as model complexity, learning rate, and potential for overfitting or underfitting. Dropout layers and batch normalization are incorporated to mitigate overfitting. The detailed architecture of the model is presented in Figure 9.

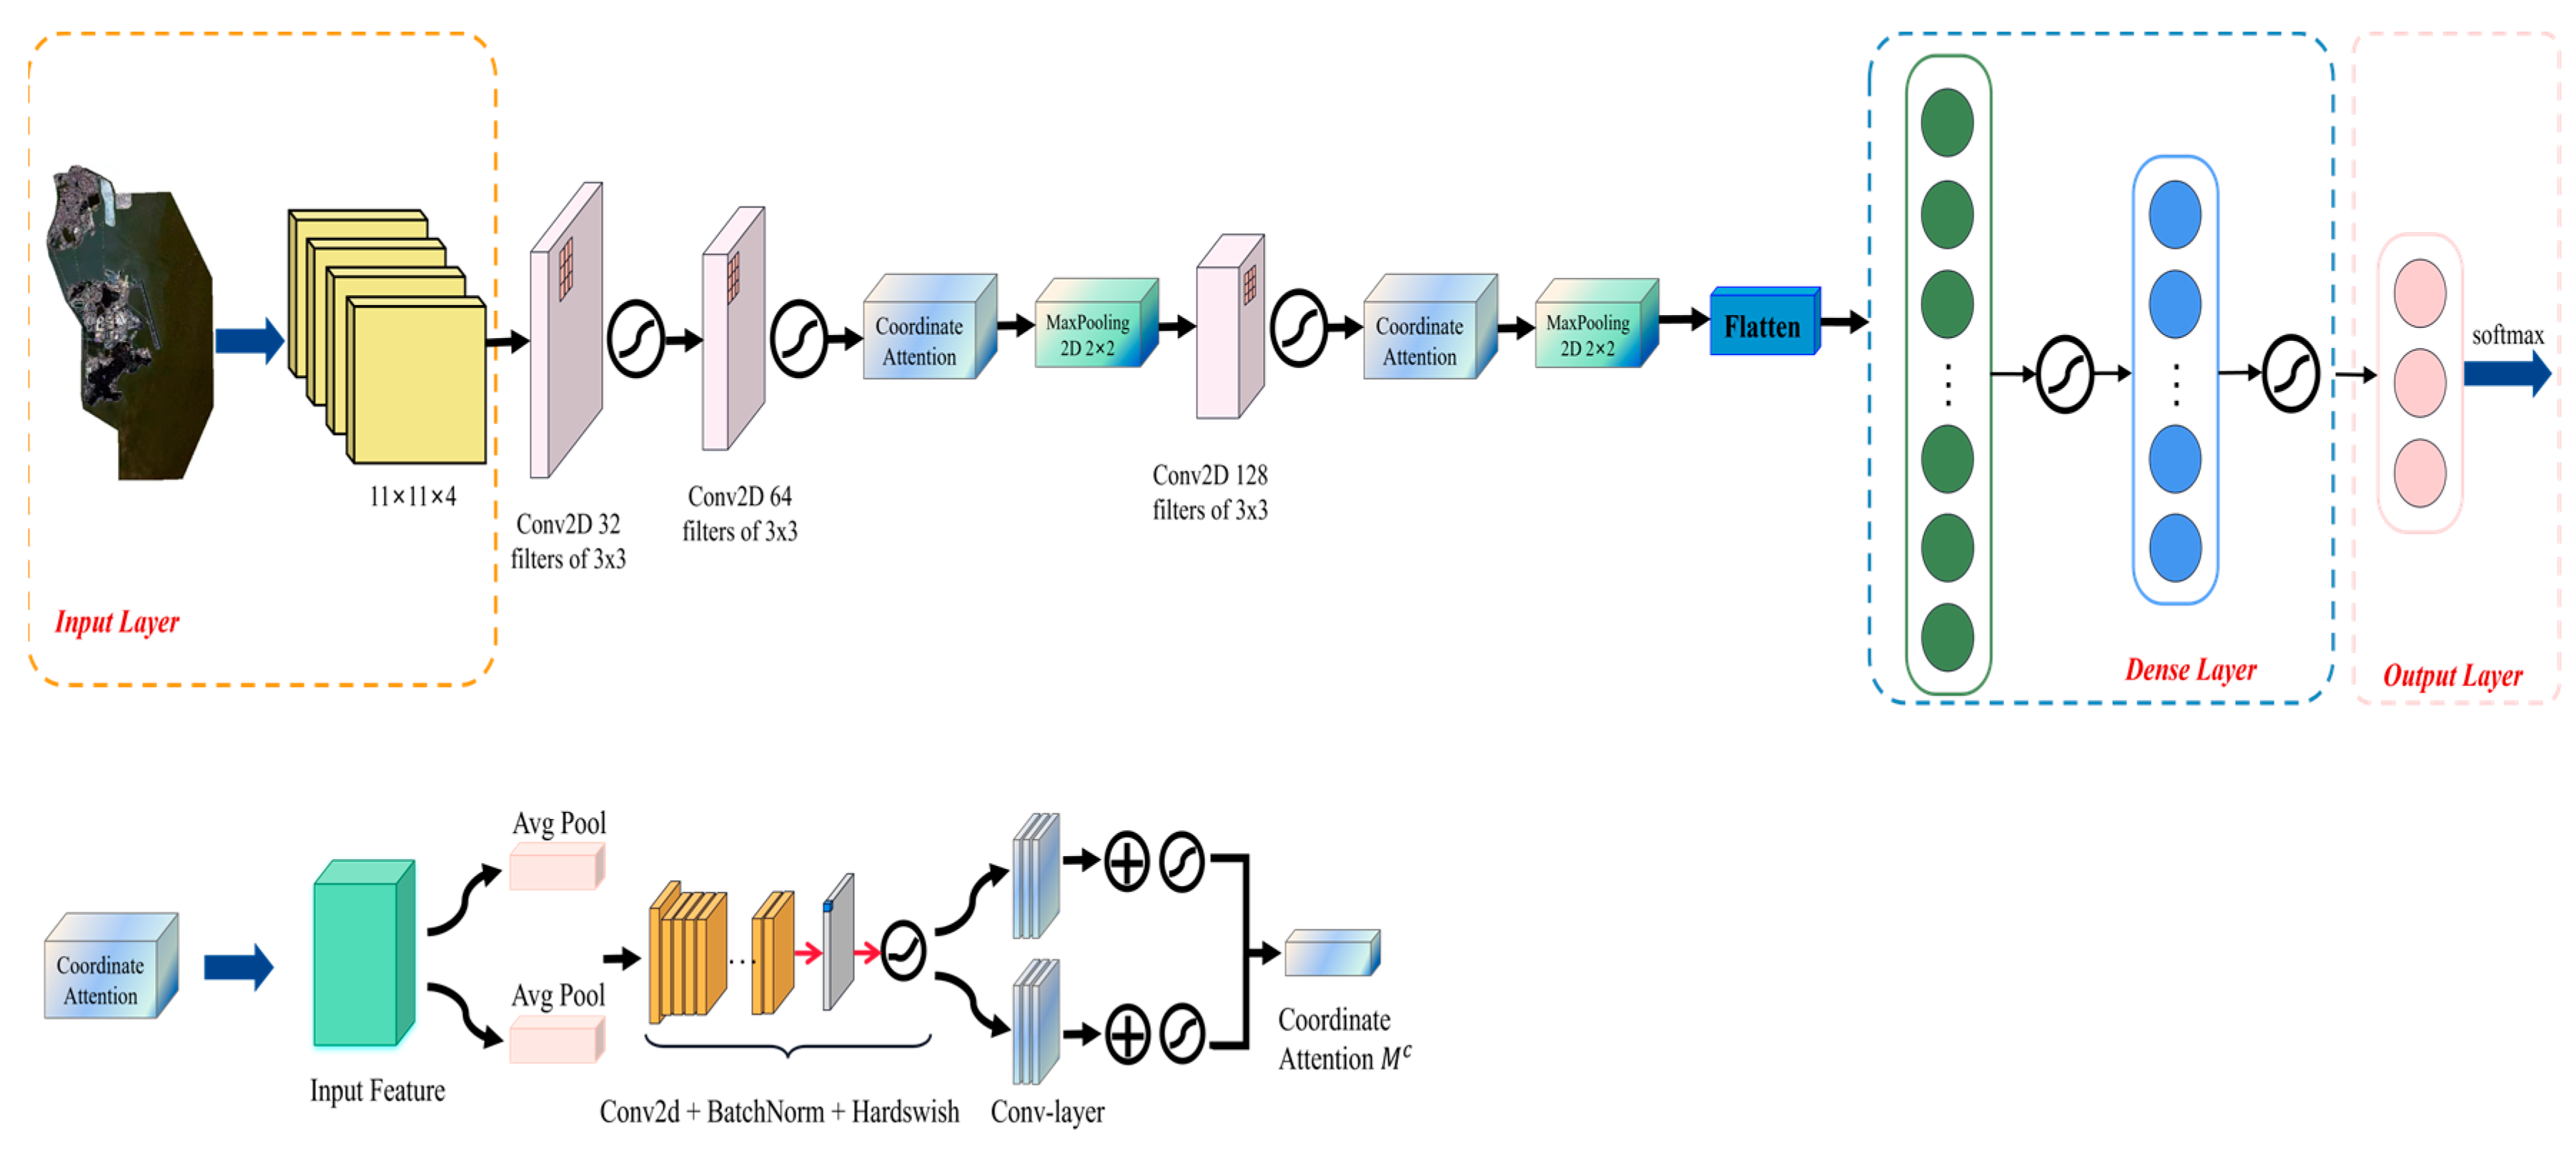
3.2.8. CA-RegNet Model
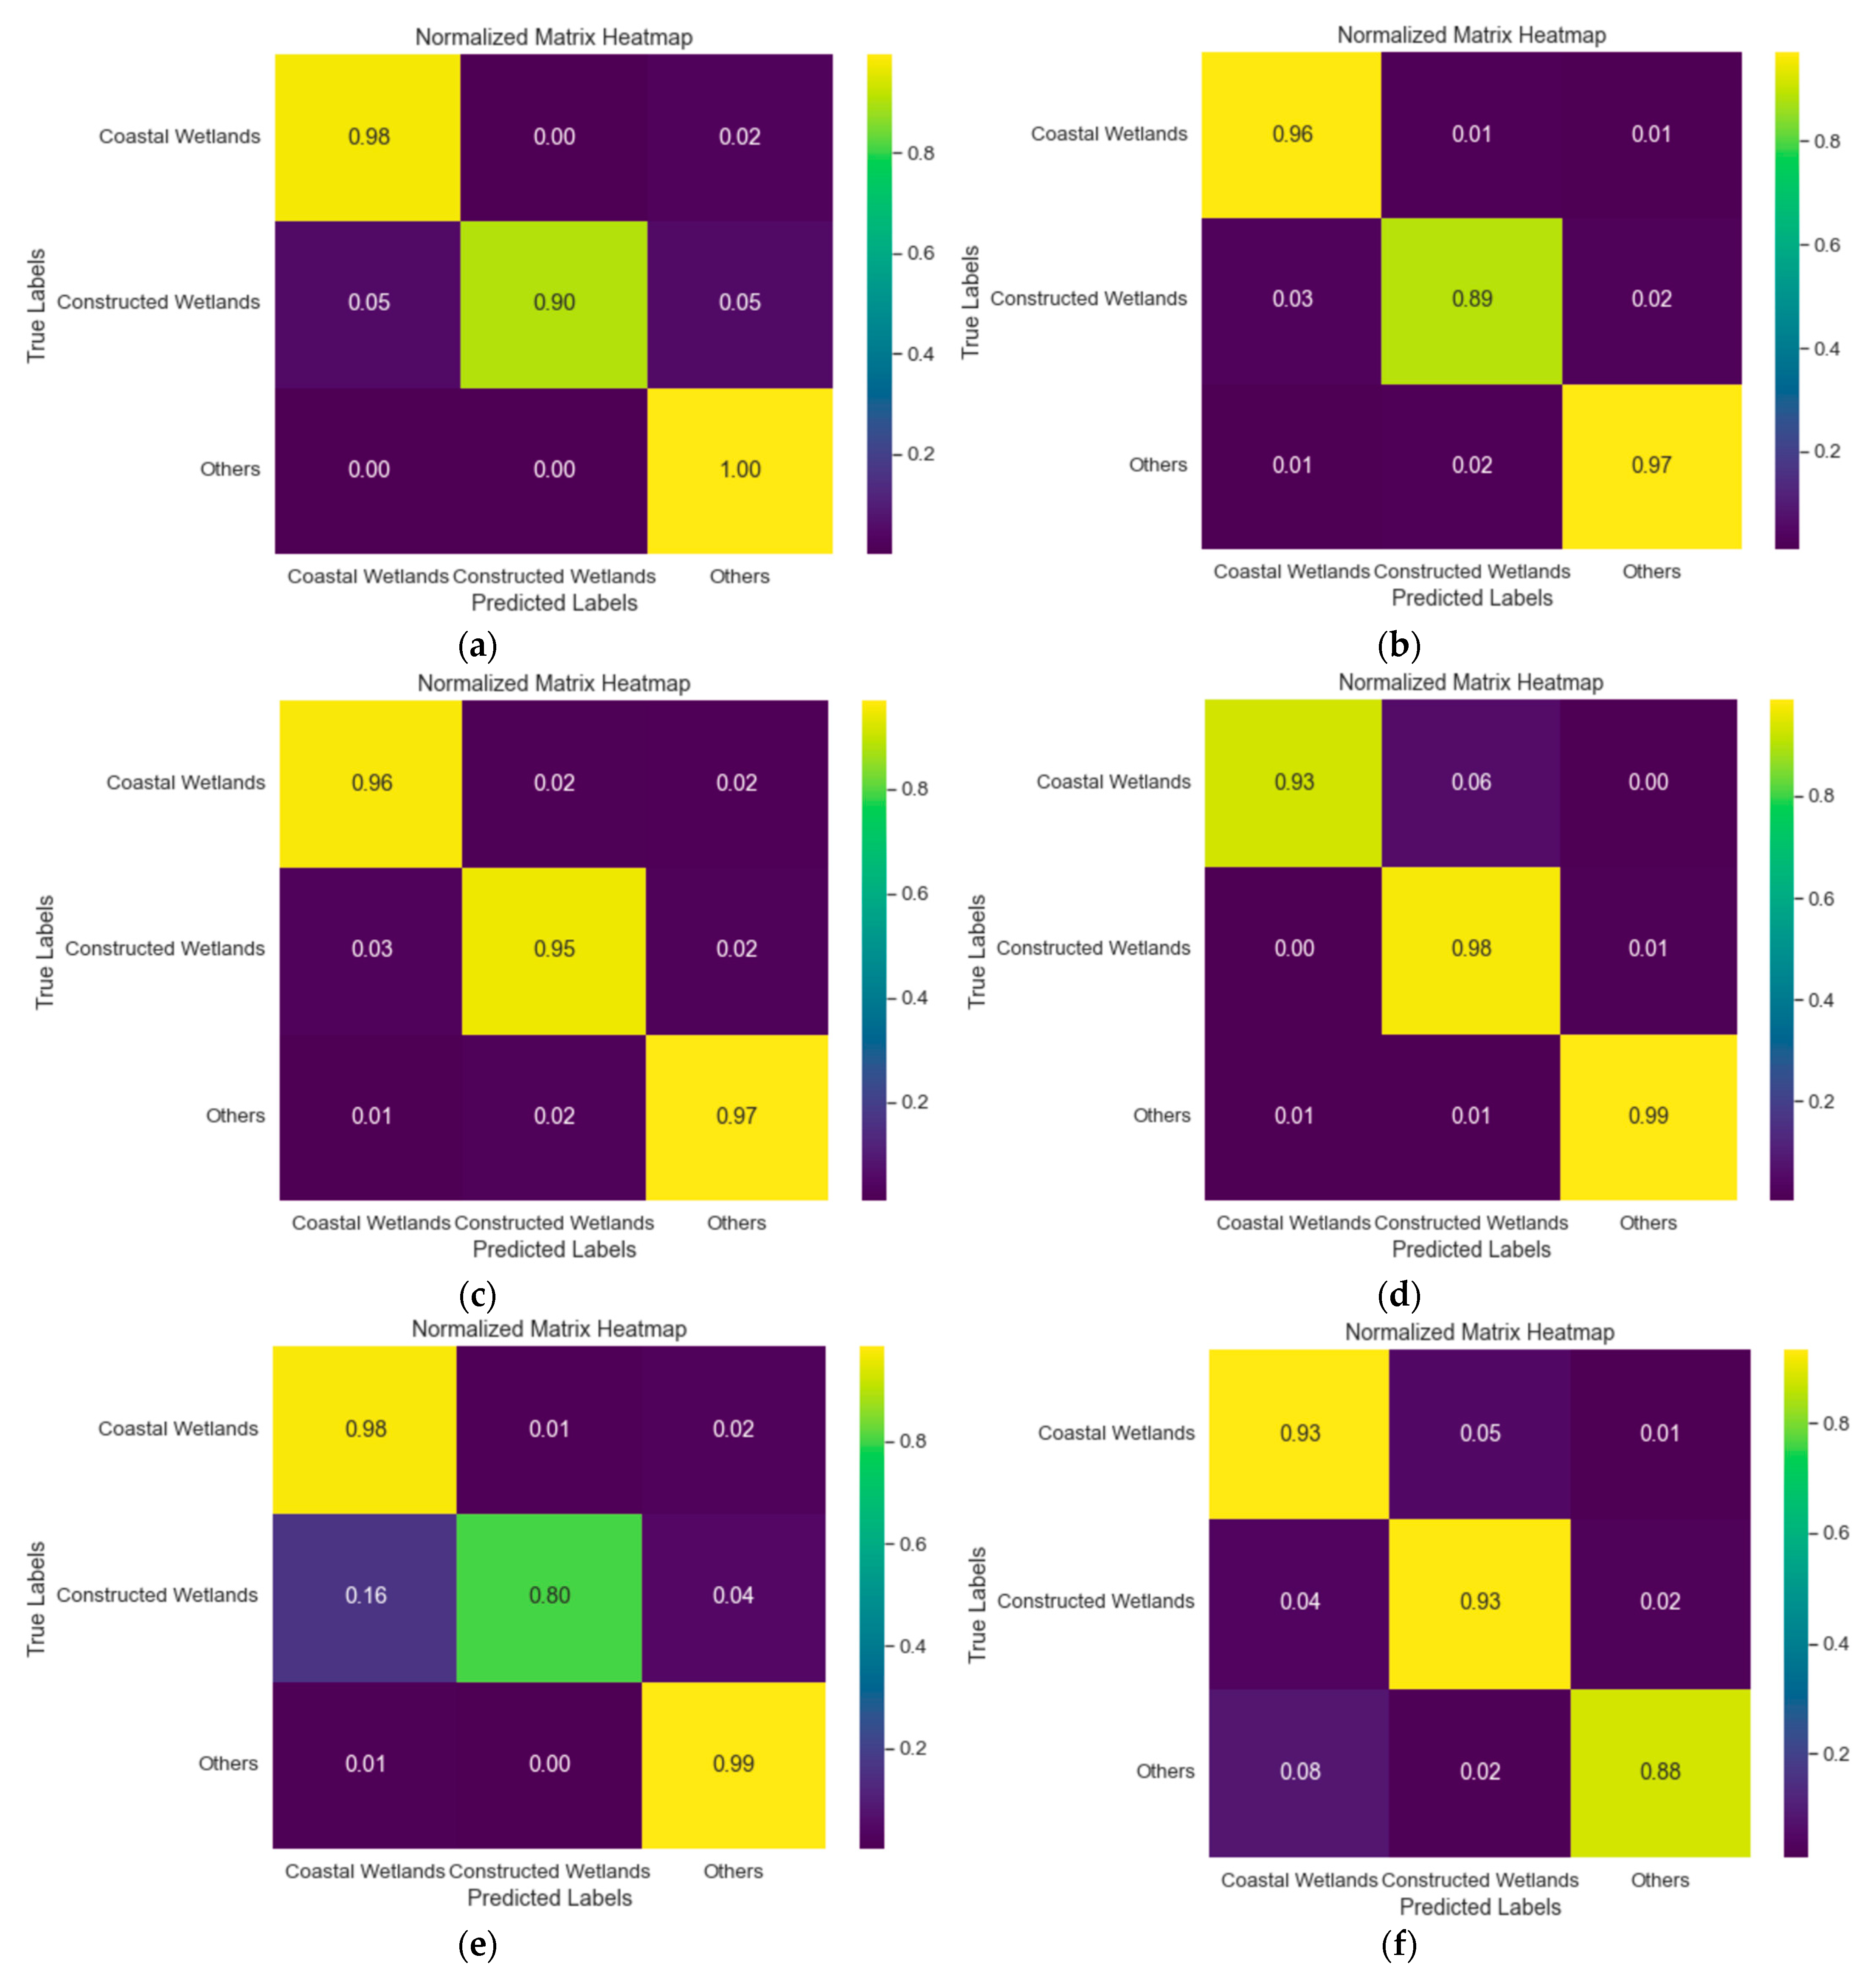
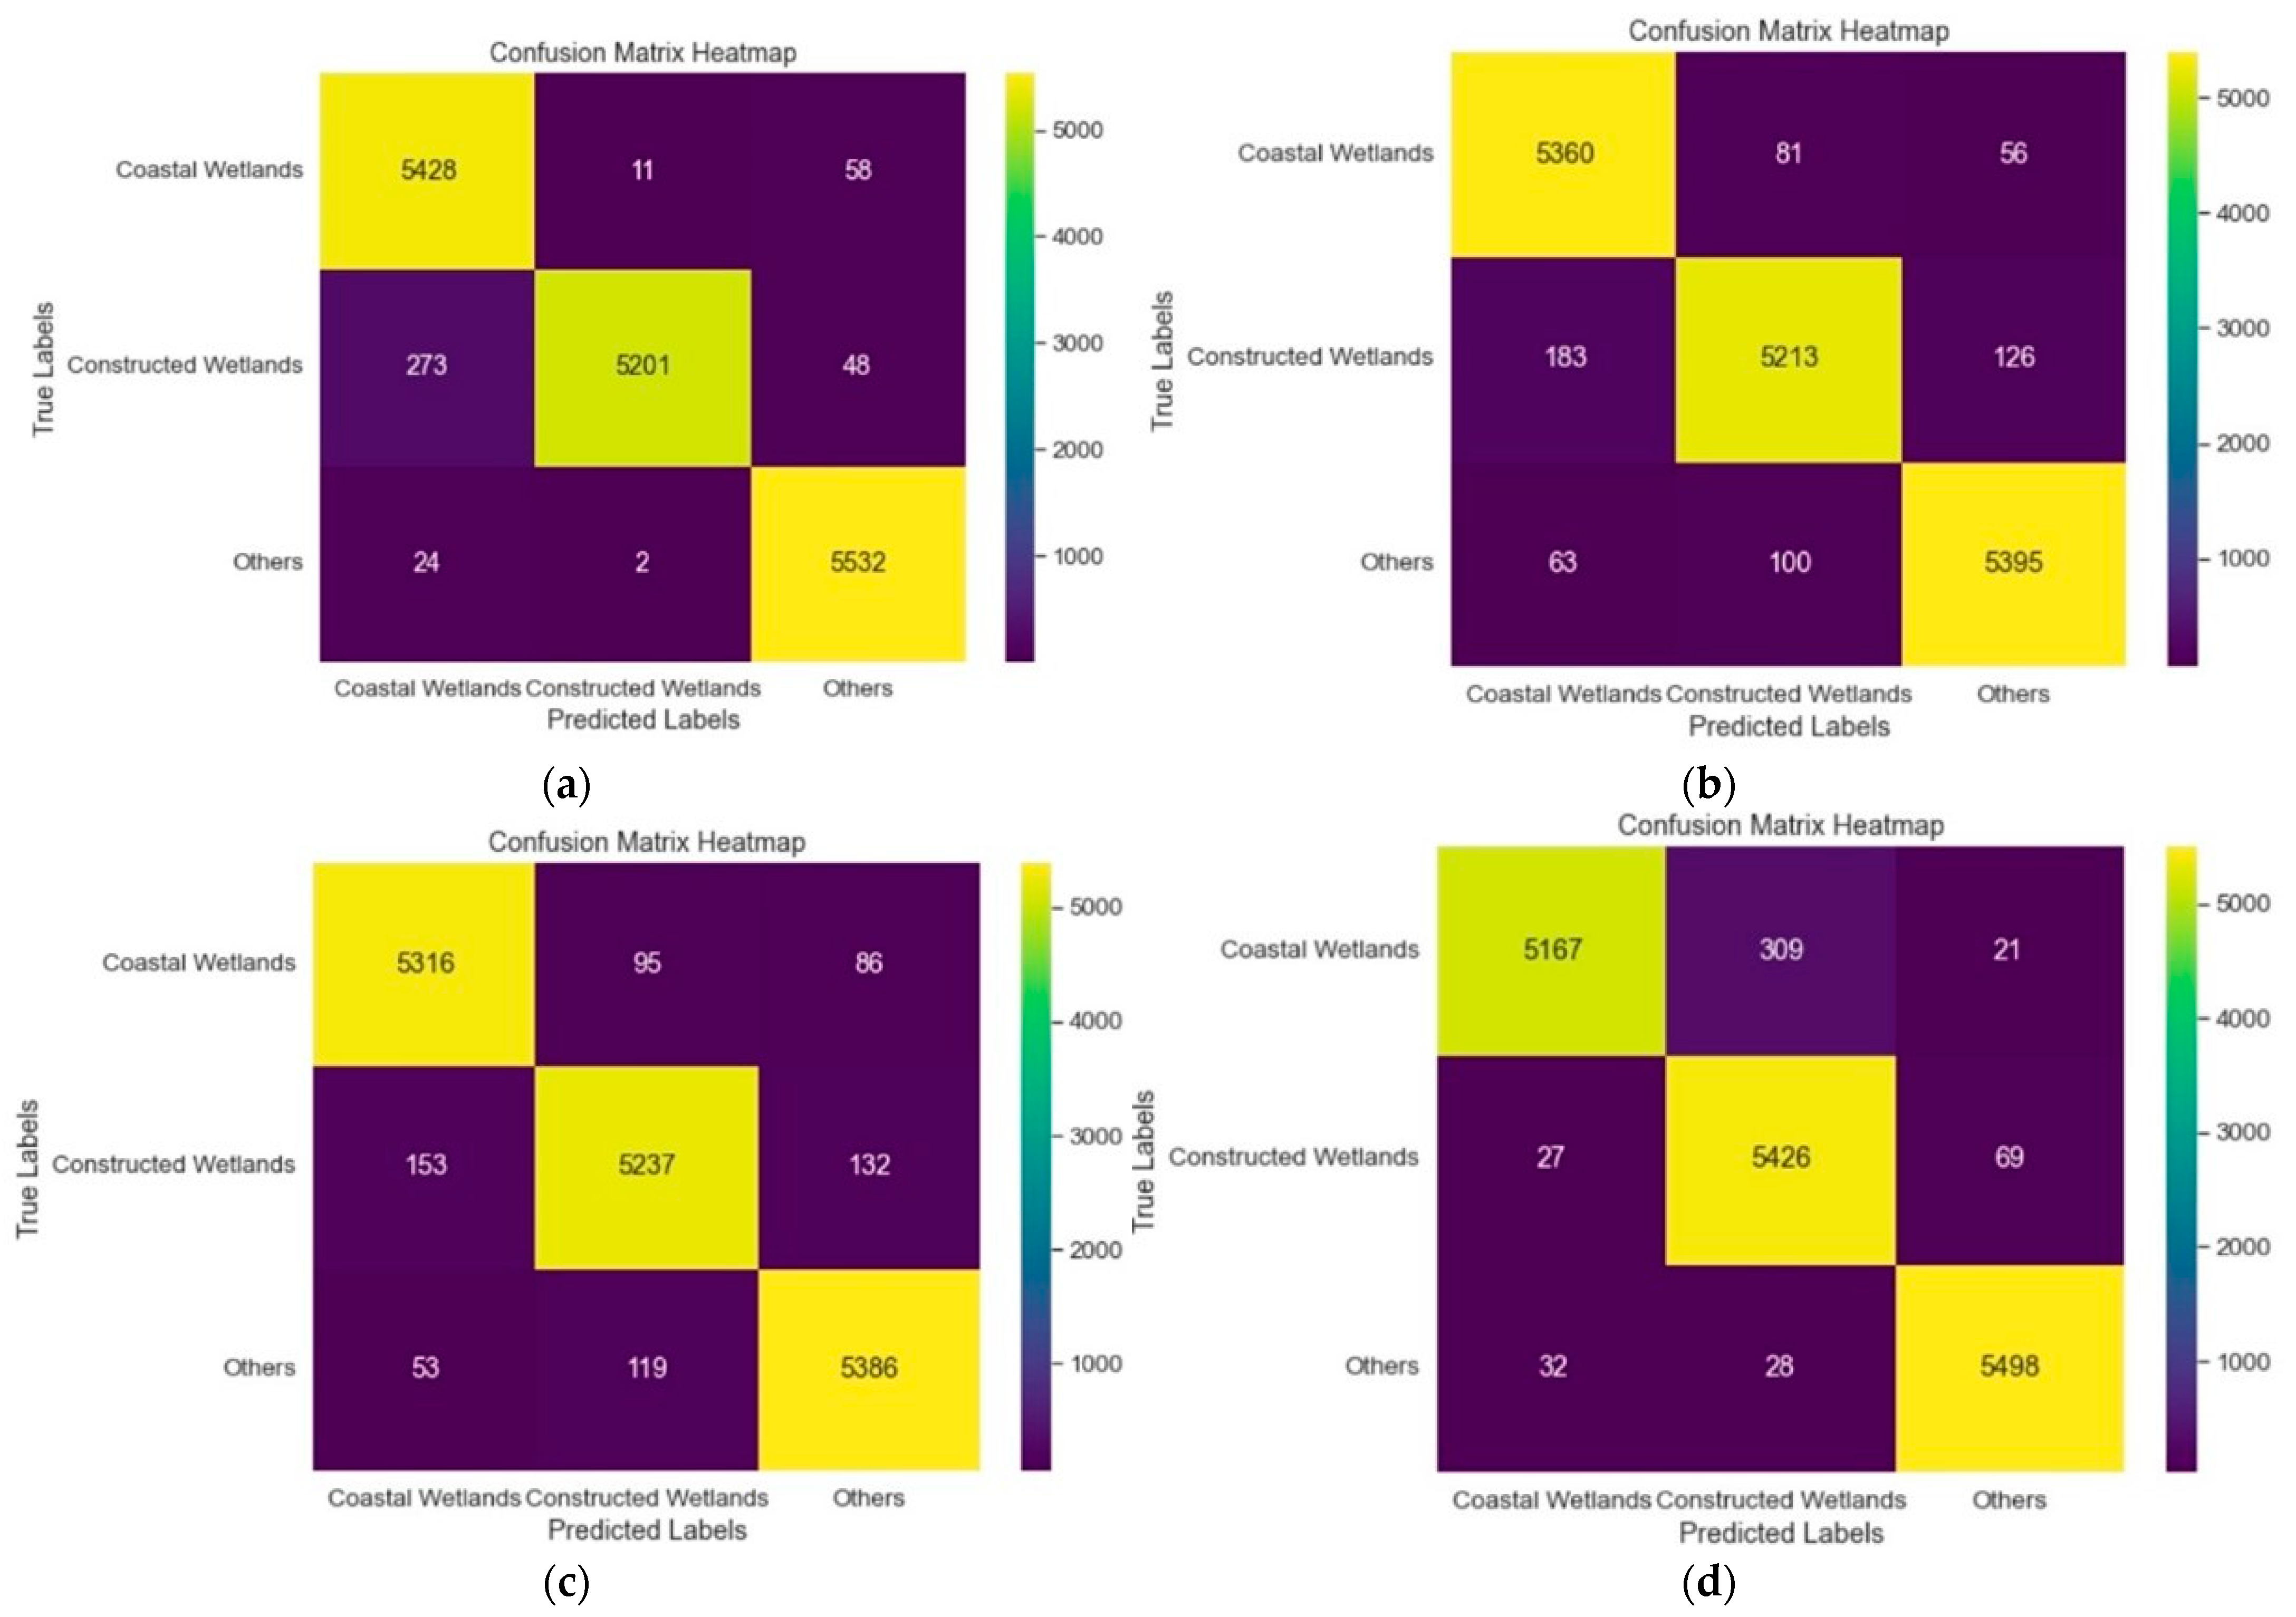
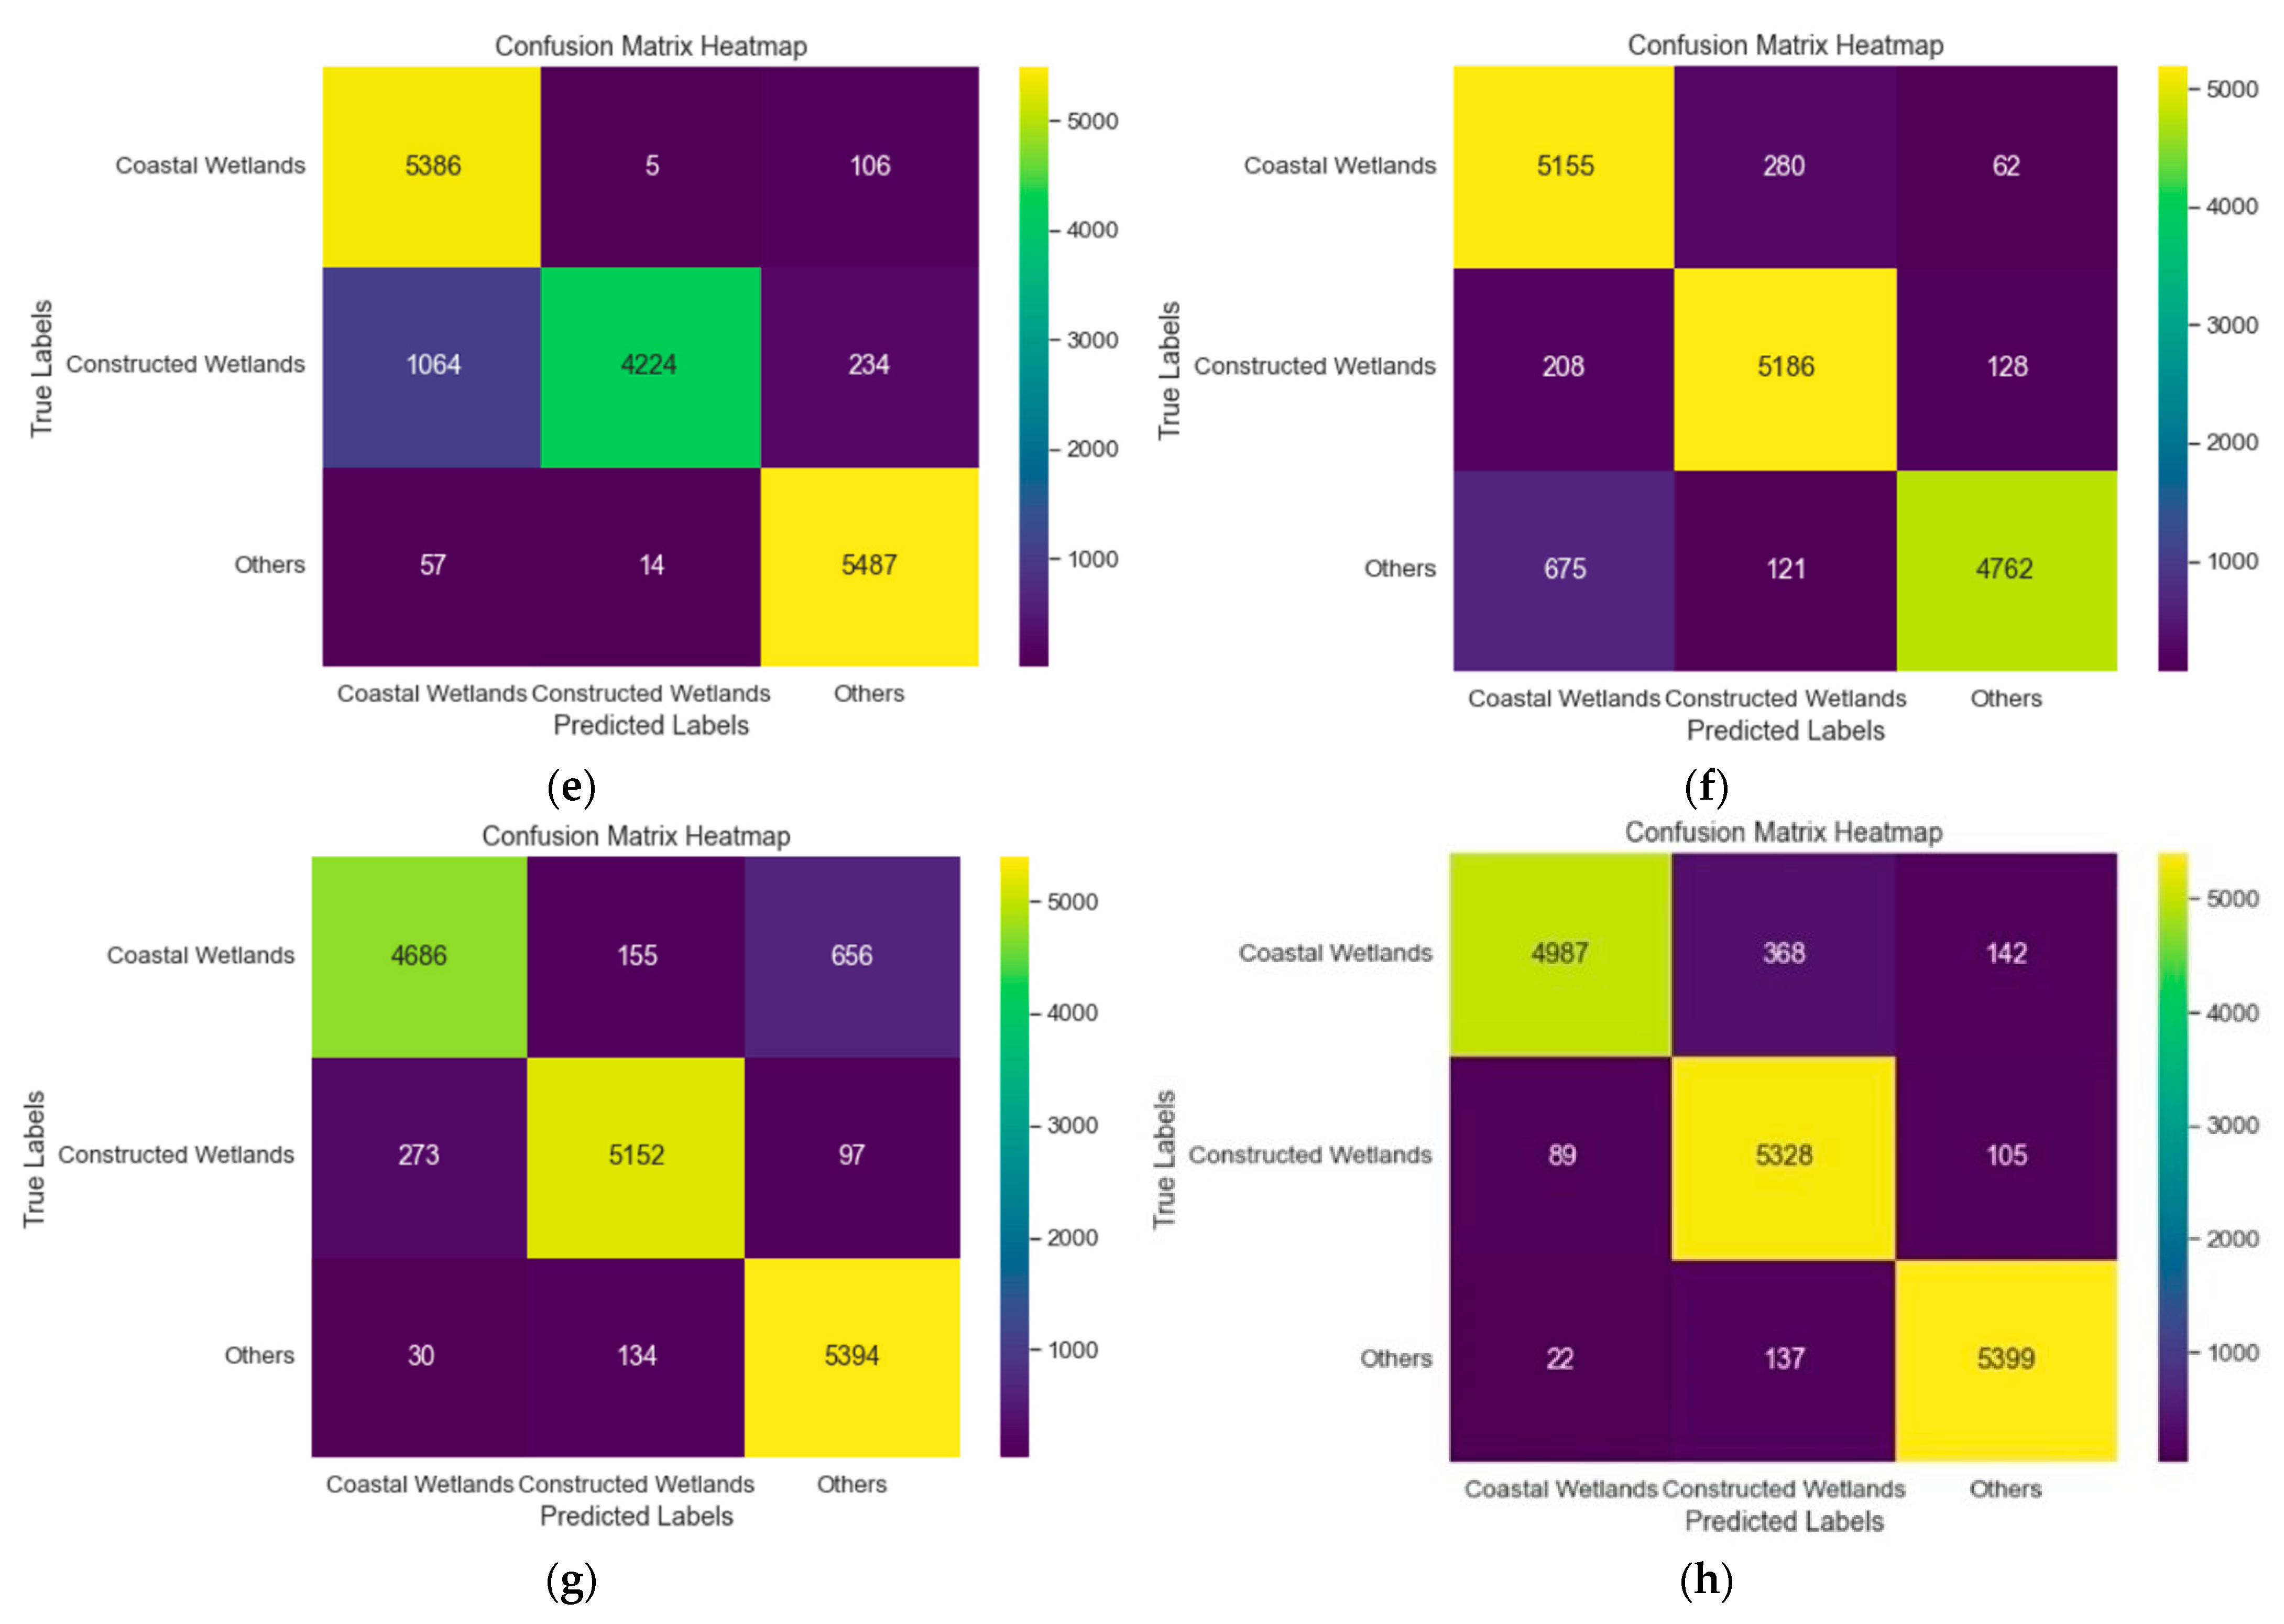
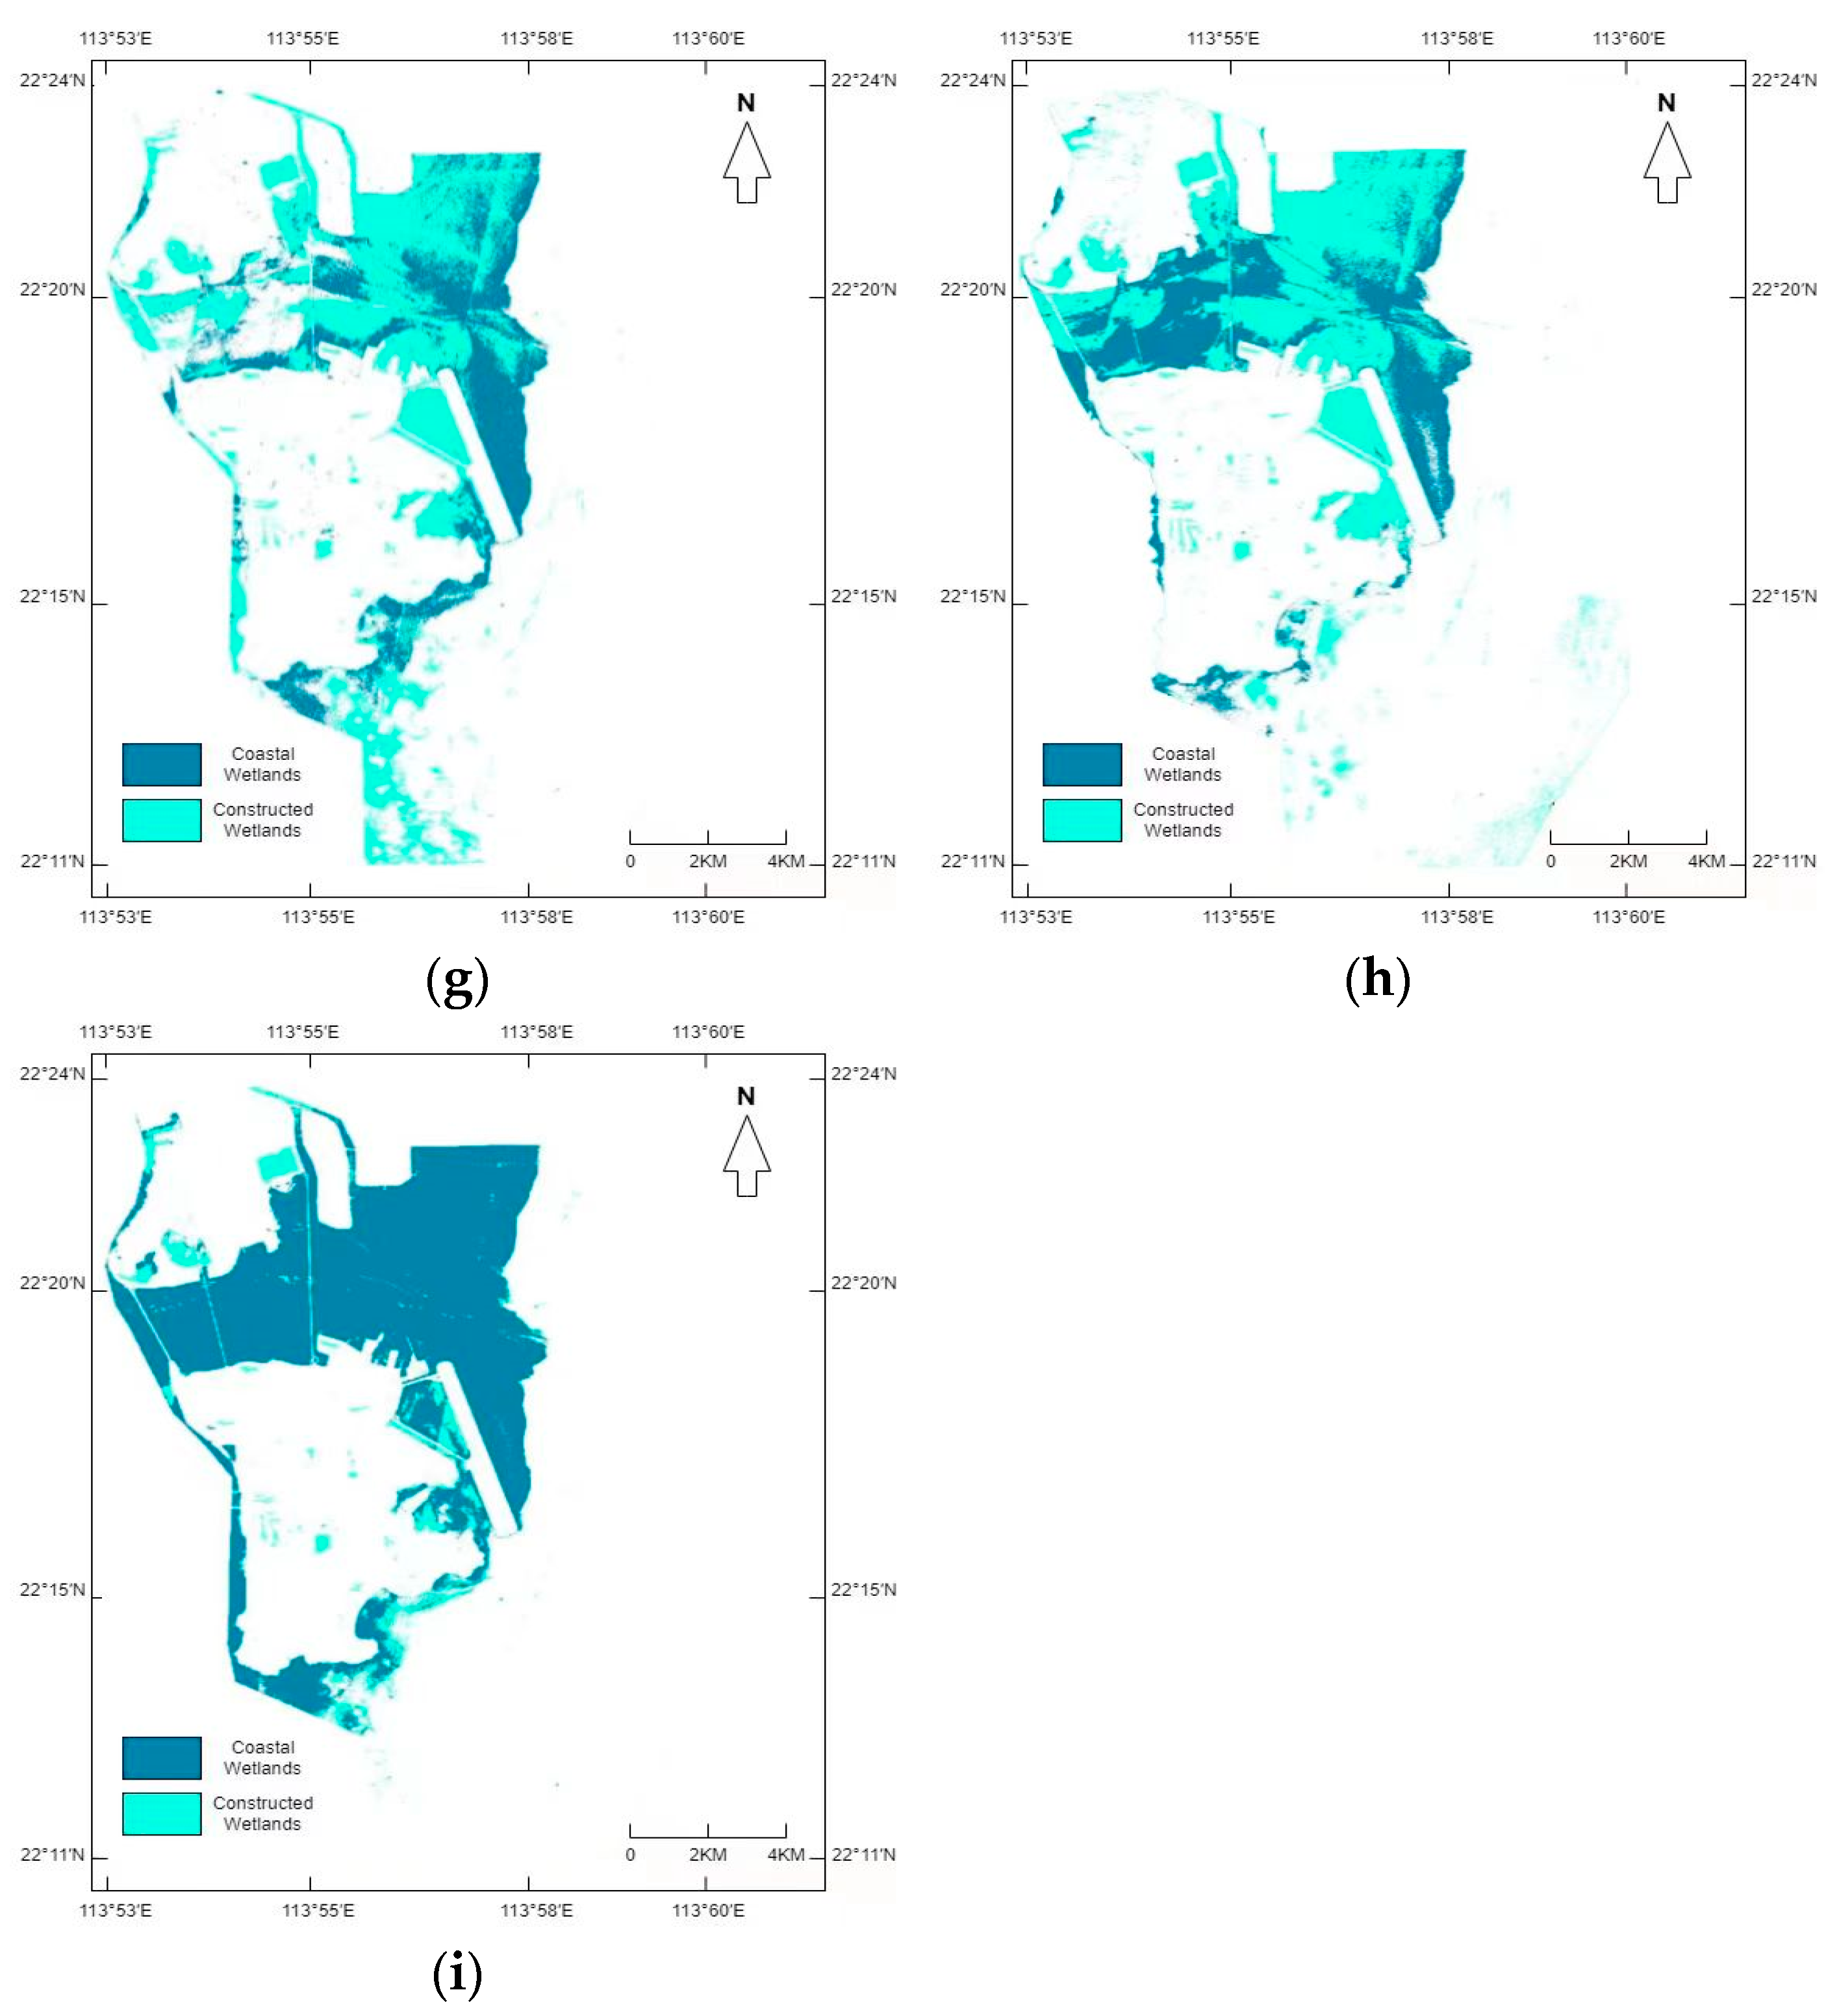
This study introduces CA-RegNet, an innovative model that amalgamates the Coordinate Attention (CA) mechanism with RegNet, aimed at sophisticated wetland image segmentation [16]. By enhancing the prioritization of significant features, both spatially and channel-wise, the CA mechanism enables the efficient discernment of attributes at various hierarchical levels. This refinement optimizes CA-RegNet efficacy in interpreting intricate wetland terrains, thereby elevating classification precision.
The implementation of the CA-RegNet model in this research initiates with an input layer. The architecture employs an initial convolutional layer for spectral–spatial feature extraction, followed by CA-RegNet blocks. Each block contains a Conv2D layer and a Coordinate Attention layer for dynamic channel-wise feature recalibration. This enhances the model’s ability to interpret complex wetland landscapes. Additional layers for convolution, spatial reduction, and tensor flattening are iteratively arranged to increase model complexity. Employing ‘sparse_categorical_crossentropy’ for loss and ‘RMSprop’ as the optimizer. The model was subjected to 200 training epochs, a parameter established from cross-validation outcomes, designed to critically assess model complexity, learning rate, and potential scenarios of both overfitting and underfitting. Employing dropout layers and L1 regularization served as strategic methodologies to mitigate the risk of overfitting. This novel approach sets a potential benchmark for future studies, amplifying the role of deep learning in environmental and ecological research. Figure 10 depicts the architecture of the CA-RegNet model.

4. Results Show

In this research, the effectiveness of each model, inclusive of the benchmark ResNet, is assessed using the overall accuracy (OA) (aAcc), the Kappa coefficient, the mean accuracy (mAcc) and the mean intersection over union (mIoU). These metrics provide an encompassing understanding of a model’s capability in classifying distinct features within wetland landscapes. Specifically, the overall accuracy (OA) denotes the proportion of correct predictions rendered by the model [43]. This metric quantifies the total accurate predictions relative to the complete dataset, offering an unambiguous assessment of the model’s proficiency in wetland landscape classification. It is determined by the summation of correct predictions (true positives and true negatives) over the total observations, as expressed in Formula (1).
OA = (TP + TN)/(TP + TN + FP + FN)
In the provided context, TP denotes true positive, TN signifies true negative, FP stands for false positive, and FN is the false negative. The Kappa coefficient (k) quantifies the concurrence between the model’s predictions and actual observations, accounting for the random agreement by chance. Fundamentally, this parameter illustrates the extent to which the model’s predictions surpass those made at random, providing a stringent analysis of the actual performance of the model, as delineated in Formula (2):
Kappa Coefficient = (Po − Pe)/(1 − Pe)
Mean accuracy (mAcc) stands as a metric computing the average classification accuracy across distinct classes. This measure aims to furnish a comprehensive perception of the model’s performance breadth over diverse categories, pertinent particularly in contexts of potential dataset imbalance. The calculation for mAcc is as follows:
mAcc   = 1 / N   × i = 1 N TP i / TP i +   FN i
Mean intersection over union (mIoU), a standard metric in segmentation endeavors, quantifies the overlap degree between the predicted and true classifications. This parameter reflects the model’s proficiency in identifying class boundaries and intricacies, proving essential in tasks that require stringent precision:
mIoU   = 1 / N   × i = 1 N TP i / TP i +   FP i +   TN i
Here, Po represents the relative observed agreement ratio, while Pe is the hypothetical probability of random agreement. For finer evaluation granularity, user’s accuracy (UA) (Recall) and producer’s accuracy (PA) (Precision) and F1-Score are utilized to measure the classification precision of each category within the models. UA conveys the likelihood that a pixel, as classified on the map/image, truly corresponds to that class on the ground [44]. The metric underscores the model’s adeptness at accurately pinpointing a specific class, establishing itself as a crucial measure when precision in individual class identification is paramount. It is determined by the ratio of correct class predictions (TP) to the total predictions for that class (sum of TP and FP):
UA = TP/(TP + FP)
Conversely, PA, also known as precision accuracy, indicates the probability that a pixel representing a specific class on the ground is appropriately classified. This metric becomes pivotal when the cost of false positives is high, providing insights into the reliability of a model’s positive predictions for each class. It is the ratio of correct predictions for a class (TP) to the total instances of that class (sum of TP and FN):
PA = TP/(TP + FN)
The F-1 score amalgamates precision and recall, forming a consolidated metric that underscores their equilibrium. This score becomes particularly crucial when there is a necessity to maintain a balance, ensuring that neither precision nor recall is compromised at the expense of the other, thereby offering a synchronized evaluation of model efficiency, as delineated in Formula (7):
F1-Score = (2 × Precision × Recall)/(Precision + Recall)
These metrics provide a nuanced comprehension of the model’s efficacy, elucidating its strengths and areas for improvement in landscape feature delineation.
Figure 11 subsequently showcases the performance metrics—OA, Kappa coefficient, mAcc and mIoU—of seven distinct models, including the benchmark, ResNet model. A thorough analysis of these metrics across the examined models reveals key insights into their competency in wetland landscape feature classification. As indicated by the data, four models—CA-RegNet, SE-RegNet, Inception-RegNet, and RegNet—outperform the benchmark ResNet model, demonstrating superior OA and Kappa Coefficient scores. Specifically, the OAs recorded for CA-RegNet, SE-RegNet, Inception-RegNet, RegNet, and ResNet are 0.9749, 0.9632, 0.9615, 0.9706, and 0.9479, respectively. Similarly, the Kappa coefficients stand at 0.9624, 0.9449, 0.9422, 0.9560, and 0.9219. The mAccs are 0.9652, 0.9620, 0.9625, 0.9637, and 0.9466, in the same order, while the mIoUs are 0.9517, 0.9524, 0.9591, 0.9615, and 0.9466. These improved metrics highlight the enhanced capability of these models to identify and classify the complex components of wetland landscapes, marking a significant advancement over the ResNet model. Most prominently, the CA-RegNet model proves to be the superior system, with three out of its four accuracy metrics leading the ranks, showing a 2.7% increase in OA, a 4.0% rise in Kappa coefficient, a 1.9% enhancement in mAcc, and a 0.5% growth in mIoU compared to the benchmark. Such marked enhancement underscores the CA-RegNet model’s prowess in precisely and consistently identifying the diverse features inherent within wetland landscapes.
The OA, the Kappa coefficient, the mAcc and the mIoU serve as comprehensive metrics, offering insights into a model’s predictive accuracy and the congruence between predicted classifications and actual observations [45]. The elevated values achieved by the CA-RegNet model in these metrics underscore its enhanced predictive capabilities and alignment in categorization, emphasizing its potential for advanced wetland feature classification. Nonetheless, it is pivotal to acknowledge that while these metrics furnish valuable comparative insights, they present a holistic perspective [46]. As such, they ought to be complemented with metrics like user’s and producer’s accuracy, F1-Score to facilitate a meticulous assessment of model performance across discrete landscape features, as detailed in Table 1. Upon a holistic analysis, the CA-RegNet model registers the pinnacle in both producer and user accuracy across categories. The normalized matrix for each model is depicted in Figure 12, and the confusion matrix of each model is shown in Figure 13.
Figure 14 presents segmentation results from various models applied to the original GF-2 remote sensing image of Macau. Figure 14a displays the original image, while Figure 14b through Figure 14i delineate the segmentation outcomes of ResNet, Res2Net, RegNet, EfficientNet B7, ConvNeXt, Inception-RegNet, SE-RegNet, and CA-RegNet models in the corresponding order. Within these figures, dark blue regions represent coastal wetlands, and light blue areas denote constructed wetlands. A visual analysis commences with the ResNet model, serving as the reference, depicted in Figure 14b. This model adeptly mitigates disturbances from uneven raw image quality and cloud cover, particularly in the Coloane Island Sea area, accurately classifying regions beyond the 6 m sea level [47]. However, shortcomings emerge, including its inability to discern coastal wetlands within the 6 m sea level and misclassifying Sai Wan Lake as coastal instead of constructed wetland. In contrast, the RegNet model (Figure 14d) demonstrates a more proficient handling of these issues. Despite slight misclassifications beyond the 6 m sea level near the Coloane Island Sea area, primarily within cloudy image regions possibly stemming from uneven original image quality [48], the model aptly categorizes Sai Van Lake and comprehensively captures coastal wetlands within the 6 m sea level, showcasing an interpretation surpassing the reference ResNet model. Figure 14i, showcasing CA-RegNet’s segmentation, emerges with the most superior quality, rectifying challenges encountered by ResNet and further reducing misclassifications near the Coloane Island Sea area—a complication faced by RegNet, potentially due to uneven original image quality. The Inception-RegNet model largely offers accurate identifications, but image obfuscation from clouds and fog degrades the segmentation quality in certain sea regions [49]. However, models like Res2Net, EfficientNet B7, and ConvNeXt, while proficient in identifying constructed wetlands on terrestrial zones, manifest considerable discrepancies, particularly within the inner sea and around the Coloane Island Sea region. The root causes might encompass uneven image quality or potential model overfitting, leading to performances lagging behind the benchmark ResNet model.
The RegNet and CA-RegNet models surpass the ResNet model both in accuracy metrics and segmentation quality. The CA-RegNet model achieves an impressive OA of 0.9749, a Kappa coefficient of 0.9624, a mAcc of 0.9652 and a mIoU of 0.9517. Upon visual examination and analysis, its segmentation results ameliorate certain challenges present in both the ResNet and RegNet models. Both quantitative accuracy indices and visual interpretation collectively attest to the robustness and superior performance of the CA-RegNet model, particularly in segmenting coastal and constructed wetlands in Macau.

5. Conclusions

This study innovative proposed CA-RegNet model and employed six distinct advanced methodologies (RegNet, Res2Net, ConvNeXt, EfficientNet B7, Inception-RegNet, SE-RegNet) to segment diverse wetland types in Macau, using ResNet as a reference benchmark. The segmentation results were evaluated based on overall accuracy (OA), the Kappa coefficient, the mean accuracy (mAcc) and the mean intersection over union (mIoU) [50]. The findings consistently revealed the CA-RegNet model’s superior performance relative to other models. Specifically, the CA-RegNet model achieved an OA of 0.9749, a Kappa coefficient of 0.9624, a mAcc of 0.9652 and a mIoU of 0.9517, all of which are commendable metrics. Detailed analysis of the segmented images further supports the assertion that the CA-RegNet model produces the most refined segmentation results. Moving forward, this research seeks to explore the potential applications of other deep learning models for image segmentation and data extraction related to Macau’s wetlands, with the goal of enhancing the accuracy of wetland segmentation and classification.

Author Contributions

Conceptualization, C.L.; Methodology, C.L.; Software, C.L. and H.C.; Validation, C.L.; Formal analysis, C.L.; Investigation, C.L.; Resources, C.L. and H.C.; Data curation, C.L. and H.C.; Writing—original draft preparation, C.L.; Writing—review and editing, C.L. and X.T.; Visualization, C.L.; supervision, X.T. and H.C.; Project administration, C.L. and H.C.; Funding acquisition, H.C. All authors have read and agreed to the published version of the manuscript.

Funding

This research was funded by Department of Education of Guangdong Province “Innovation and Strengthening Project” Scientific Research Project. Grant number 2021KTSCX176. And The APC was funded by it.

Institutional Review Board Statement

Not applicable.

Informed Consent Statement

Not applicable.

Data Availability Statement

The dataset of this study is Gaofen-2 remote sensing image data, because part of the data is related to the relevant confidentiality and privacy policy, therefore, the dataset of this study is not chosen to be made public.

Acknowledgments

The authors thank Mengjie Song for her help in the research.

Conflicts of Interest

The authors declare no conflict of interest.

References

  1. Nunziata, F.; Ferrentino, E.; Marino, A.; Buono, A.; Migliaccio, M. Monitoring Harsh Costal Environments Using Polarimetric SAR Data: The Case of Solway Firth Wetlands. In Proceedings of the IEEE International Symposium on Geoscience and Remote Sensing IGARSS, Waikoloa, HI, USA, 26 September–2 October 2020; pp. 4019–4022. [Google Scholar]
  2. Lin, X.F.; Cheng, Y.; Chen, G.; Chen, W.J.; Chen, R.; Gao, D.M.; Zhang, Y.L.; Wu, Y.B. Semantic Segmentation of China’s Coastal Wetlands Based on Sentinel-2 and Segformer. Remote Sens. 2023, 15, 3714. [Google Scholar] [CrossRef]
  3. Hosseiny, B.; Mahdianpari, M.; Brisco, B.; Mohammadimanesh, F.; Salehi, B. WetNet: A Spatial-Temporal Ensemble Deep Learning Model for Wetland Classification Using Sentinel-1 and Sentinel-2. IEEE Trans. Geosci. Remote Sens. 2021, 60, 4406014. [Google Scholar] [CrossRef]
  4. Jiao, L.L.; Sun, W.W.; Yang, G.; Ren, G.B.; Liu, Y.N. A Hierarchical Classification Framework of Satellite Multispectral/Hyperspectral Images for Mapping Coastal Wetlands. Remote Sens. 2019, 19, 2238. [Google Scholar] [CrossRef]
  5. Huang, Y.; Peng, J.T.; Chen, N.; Sun, W.W.; Du, Q.; Ren, K.; Huang, K. Cross-scene wetland mapping on hyperspectral remote sensing images using adversarial domain adaptation network. ISPRS J. Photogramm. Remote Sens. 2023, 203, 37–54. [Google Scholar] [CrossRef]
  6. Gina, L.; Saby, L.; Band, E.; Goodall, L. Effects of LiDAR DEM Smoothing and Conditioning Techniques on a Topography-Based Wetland Identification Model. Water Resour. Res. 2019, 55, 4343–4363. [Google Scholar]
  7. Li, Y.F.; Wang, C.; Wright, A.; Liu, H.Y.; Zhang, H.B.; Zong, Y. Combination of GF-2 high spatial resolution imagery and land surface factors for predicting soil salinity of muddy coasts. CATENA 2021, 202, 105304. [Google Scholar] [CrossRef]
  8. Dong, F.; Yang, F.; Liu, Z.H.; Wang, X. Spatial distribution of wetland vegetation biomass in the Longhu area using GF-2 data. IOP Conf. Ser. Earth Environ. Sci. 2019, 233, 042042. [Google Scholar] [CrossRef]
  9. Liu, T.; Abd-Elrahman, A. An Object-Based Image Analysis Method for Enhancing Classification of Land Covers Using Fully Convolutional Networks and Multi-View Images of Small Unmanned Aerial System. Remote Sens. 2018, 10, 457. [Google Scholar] [CrossRef]
  10. Duro, D.C.; Franklin, S.E.; Dube, M.C. A comparison of pixel-based and object-based image analysis with selected machine learning algorithms for the classifications of agricultural landscapes using SPOT-5 HRG imagery. Remote Sens. Environ. 2012, 118, 259–272. [Google Scholar] [CrossRef]
  11. Li, X.; Xu, F.; Lyu, X.; Gao, H.; Tong, Y.; Cai, S.; Li, S.; Liu, D. Dual attention deep fusion semantic segmentation networks of large-scale satellite remote-sensing images. Int. J. Remote Sens. 2021, 42, 3583–3610. [Google Scholar] [CrossRef]
  12. Hu, Q.; Woldt, W.; Neale, C.; Zhou, Y.Z.; Drahota, J.; Varner, D.; Bishop, A.; LaGrange, T.; Zhang, L.G.; Tang, Z.H. Utilizing unsupervised learning, multi-view imaging, and CNN-based attention facilitates cost-effective wetland mapping. Remote Sens. Environ. 2021, 267, 112757. [Google Scholar] [CrossRef]
  13. Lopez-Taipa, S.; Ruiz, P.; Smith, M.; Matthews, J.; Zercher, B.; Sydorenko, L.; Varia, N.; Jin, Y.Z.; Wang, M.Z.; Dunn, J.B.; et al. Machine Learning with high-resolution aerial imagery and data fusion to improve and automate the detection of wetlands. Int. J. Appl. Earth Obs. Geoinf. 2021, 105, 102581. [Google Scholar] [CrossRef]
  14. He, Z.; He, D.; Mei, X.; Hu, S. Wetland Classification Based on a New Efficient Generative Adversarial Network and Jilin-1 Satellite Image. Remote Sens. 2019, 11, 2455. [Google Scholar] [CrossRef]
  15. Ai, B.; Huang, K.; Zhao, J.; Sun, S.; Jian, Z.; Liu, X. Comparison of Classification Algorithms for Detecting Typical Coastal Reclamation in Guangdong Province with Landsat 8 and Sentinel 2 Images. Remote Sens. 2022, 14, 385. [Google Scholar] [CrossRef]
  16. Hou, Q.B.; Zhou, D.Q.; Feng, J.S. Coordinate Attention for Efficient Mobile Network Design. In Proceedings of the 2021 IEEE/CVF Conference on Computer Vision and Pattern Recognition, Nashville, TN, USA, 20–25 June 2021; pp. 13708–13717. [Google Scholar]
  17. Yao, W.; Francisco, V.P. Analysis on Ecological Principles in Macau Urban Design. In Proceedings of the International Conference on Intelligent Structure and Vibration Control, Chongqing, China, 14–16 January 2021; Volume 155. [Google Scholar]
  18. Huang, Y.; Teng, Y.P.; Yang, S. Evaluation of the Sustainable Development of Macau, Based on the BP Neural Network. Sustainability 2023, 15, 879. [Google Scholar] [CrossRef]
  19. Wu, X.P.; Xu, H.Q. Cross-Comparison between GF-2 PMS2 and ZY-3 MUX Sensor Data. Spectrosc. Spectr. Anal. 2019, 39, 310–318. [Google Scholar]
  20. Rezaee, M.; Mahdianpari, M.; Zhang, Y.; Salehi, B. Deep convolutional neural network for complex wetland classification using optical remote sensing imagery. IEEE J. Sel. Top. Appl. Earth Observ. Remote Sens. 2018, 11, 3030–3039. [Google Scholar] [CrossRef]
  21. Wu, N.; Shi, R.; Zhuo, W.; Zhang, C.; Zhou, B.; Xia, Z.; Tao, Z.; Gao, W.; Tian, B. A Classification of Tidal Flat Wetland Vegetation Combining Phenological Features with Google Earth Engine. Remote Sens. 2021, 13, 443. [Google Scholar] [CrossRef]
  22. Munizaga, J.; García, M.; Ureta, F.; Novoa, V.; Rojas, O.; Rojas, C. Mapping Coastal Wetlands Using Satellite Imagery and MachineLearning in a Highly Urbanized Landscape. Sustainability 2022, 14, 5700. [Google Scholar] [CrossRef]
  23. Nisa, S.Q.; Ismail, A.R. Dual U-Net with Resnet Encoder for Segmentation of Medical Images. Int. J. Adv. Comput. Sci. Appl. 2023, 13, 537–542. [Google Scholar] [CrossRef]
  24. Yang, H.L.; Liu, Y.H.; Xia, T. Defect Detection Scheme of Pins for Aviation Connectors Based on Image Segmentation and Improved RESNET-50. Int. J. Image Graph. 2023, 2450011. [Google Scholar] [CrossRef]
  25. Zhou, Z.; Zhou, Z. Remote Sensing Image Retrieval with Gabor-CA-ResNet and Split-Base Deep Feature Transform Network. Remote Sens. 2021, 13, 869. [Google Scholar] [CrossRef]
  26. Das, A.; Chandran, S. Transfer Learning with Res2Net for Remote Sensing Scene Classification. In Proceedings of the 2021 11th International Conference on Cloud Computing Data Science Engineering, Noida, India, 28–29 January 2021; pp. 796–801. [Google Scholar]
  27. Xu, Q.; Xu, S.M.; Wang, D.Y.; Yang, C.; Liu, J.P.; Luo, B. Res2Net with spectral-spatial and channel attention for hyperspectral image classification. J. Intell. Fuzzy Syst. 2022, 43, 6765–6781. [Google Scholar] [CrossRef]
  28. Liu, Y.S.; Suen, C.Y.; Liu, Y.B.; Ding, L.Y. Scene Classification Using Hierarchical Wasserstein CNN. IEEE Trans. Geosci. Remote Sens. 2019, 57, 2494–2502. [Google Scholar] [CrossRef]
  29. Yi, J.Y.; Tao, J.H.; Tian, Z.K.; Bai, Y.; Fan, C.H. Focal Loss for Punctuation Prediction. Interspeech 2020, 721–725. [Google Scholar] [CrossRef]
  30. Chen, Y.H.; Lee, P.J.; Bui, T.A. Multi-scales feature extraction model for water segmentation in satellite image. In Proceedings of the IEEE International Conference on Consumer Electronics (ICCE), Las Vegas, NV, USA, 6–8 January 2023. [Google Scholar]
  31. Yuan, J.Y.; Ma, X.; Han, G.; Li, S.; Gong, W. Research on Lightweight Disaster Classification Based on High Resolution Remote Sensing Images. Remote Sens. 2022, 14, 2577. [Google Scholar] [CrossRef]
  32. Subedi, A.; Tang, W.; Mondal, T.G.; Wu, R.T.; Jahanshahi, R. Ensemble-based deep learning for autonomous bridge component and damage segmentation leveraging Nested Reg-UNet. Smart Struct. Syst. 2023, 31, 335–349. [Google Scholar]
  33. Ahmed, K.R.; Jalil, S.Z.A.; Usman, S. Improved Tuna Swarm-based U-EfficientNet: Skin Lesion Image Segmentation by Improved Tuna Swarm Optimization. Int. J. Adv. Comput. Sci. Appl. 2023, 14, 903–913. [Google Scholar] [CrossRef]
  34. Wang, J.K.; Li, X.; Cheng, Y.Z. Towards an extended EfficientNet-based U-Net framework for joint optic disc and cup segmentation in the fundus image. Biomed. Signal Process. Control 2023, 85, 104906. [Google Scholar] [CrossRef]
  35. Kwak, T.; Kim, Y. Semi-Supervised Land Cover Classification of Remote Sensing Imagery Using CycleGAN and EfficientNet. KSCE J. Civ. Eng. 2023, 27, 1760–1773. [Google Scholar] [CrossRef]
  36. Feng, J.W.; Tan, H.L.; Li, W.W.; Xie, M. Conv2NeXt: Reconsidering ConvNeXt Network Design for Image Recognition. In Proceedings of the International Conference on Computers and Artificial Intelligence Technologies (CAIT), Quzhou, China, 4–6 November 2022; pp. 53–60. [Google Scholar]
  37. Zhou, F.Y.; Deng, H.G.; Xu, Q.G.; Lan, X. CNTR-YOLO: Improved YOLOv5 Based on ConvNeXt and Transsformer Aircraft Detection in Remote Sensing Images. Electronics 2023, 12, 2671. [Google Scholar] [CrossRef]
  38. Song, F.; Ma, R.F.; Lei, T.; Peng, Z.M. RAIH-Det: An End-to-End Rotated Aircraft and Aircraft Head Detector Based on ConvNeXt and Cyclical Focal Loss in Optical Remote Sensing Images. Remote Sens. 2023, 15, 2364. [Google Scholar] [CrossRef]
  39. Peng, Y.F.; Deng, J.N.; Gang, W. Remote sensing image data enhancement based on improved SinGAN. Chin. J. Liq. Cryst. Disp. 2023, 38, 387–396. [Google Scholar] [CrossRef]
  40. Das, B.; Saha, A.; Mukhopadhyay, S. Rain Removal from a Single Image Using Refined Inception ResNet v2. Circuits Syst. Signal Process. 2023, 42, 3485–3508. [Google Scholar] [CrossRef]
  41. Thomas, A.; Harikrishnan, P.M.; Palanisamy, P.; Gopi, V.P. Moving Vehicle Candidate Recognition and Classification Using Inception-ResNet-v2. In Proceedings of the 2020 IEEE 44th Annual Computers, Software, and Applications Conference (COMPSAC), Madrid, Spain, 13–17 July 2020; pp. 467–472. [Google Scholar]
  42. He, J.; Jiang, D. Fully Automatic Model Based on SE-ResNet for Bone Age Assessment. IEEE Access 2021, 9, 62460–62466. [Google Scholar] [CrossRef]
  43. Yue, C.; Ye, M.Q.; Wang, P.P.; Huang, D.B.; Lu, X.J. Generative Adversarial Network Combined with SE-ResNet and Dilated Inception Block for Segmenting Retinal Vessels. Comput. Intell. Neurosci. 2022, 2022, 3585506. [Google Scholar] [CrossRef]
  44. Allain, B.S.; Marechal, C.; Pottier, C. Wetland water segmentation using multi-angle and polarimetric Radarsat-2 datasets. In Proceedings of the IEEE International Geoscience and Remote Sensing Symposium (IGARSS), Munich, Germany, 22–27 July 2012; pp. 4915–4917. [Google Scholar]
  45. Ke, Z.Y.; Ru, A.; Li, X.J. ANN based high spatial resolution remote sensing wetland classifcation. In Proceedings of the 2015 14th International Symposium on Distributed Computing and Applications for Business Engineering and Science (DCABES), Guiyang, China, 18–24 August 2015; pp. 180–183. [Google Scholar]
  46. Gui, Y.; Li, W.; Xia, X.G.; Tao, R.; Yue, A. Infrared attention network for woodland segmentation using multispectral satellite images. IEEE Trans. Geosci. Remote Sens. 2022, 60, 5627214. [Google Scholar] [CrossRef]
  47. Zhao, B.Y.; Zhang, M.M.; Wang, J.B.; Song, X.K.; Gui, Y.Y.; Zhang, Y.X.; Li, W. Multiple Attention Network for Spartina alterniflora Segmentation Using Multitemporal Remote Sensing Images. IEEE Trans. Geosci. Remote Sens. 2023, 61, 5402915. [Google Scholar] [CrossRef]
  48. Zhao, W.; Guo, Z.; Yue, J.; Zhang, X.; Luo, L. On combining multiscale deep learning features for the classification of hyperspectral remote sensing imagery. Int. J. Remote Sens. 2015, 36, 3368–3379. [Google Scholar] [CrossRef]
  49. Pande-Chhetri, R.; Abd-Elrahman, A.; Liu, T.; Morton, J.; Wilhelm, V.L. Objectbased classification of wetland vegetation using very high-resolution unmanned air system imagery. Eur. J. Remote Sens. 2017, 50, 564–576. [Google Scholar] [CrossRef]
  50. Drahota, J.; Reichart, L.M. Wetland seed availability for waterfowl in annual and perennial emergent plant communities of the Rainwater Basin. Wetlands 2015, 35, 1105–1116. [Google Scholar] [CrossRef]
Figure 1. Technical Route Overview.
Applsci 13 12178 g001
Figure 2. Three different kinds of interpretation signs of Macau wetlands (a) Constructed Wetland; (b) Coastal Mudflat Wetland; (c) Coastal Mangrove Wetland.
Applsci 13 12178 g002
Figure 3. The architecture of the ResNet model.
Applsci 13 12178 g003
Figure 4. The architecture of the Res2Net model.
Applsci 13 12178 g004
Figure 5. The architecture of the RegNet model.
Applsci 13 12178 g005
Figure 6. The architecture of the EfficientNet B7 model.
Applsci 13 12178 g006
Figure 7. The architecture of the ConvNeXt model.
Applsci 13 12178 g007
Figure 8. The architecture of the Inception-RegNet model.
Applsci 13 12178 g008
Figure 9. The architecture of the SE-RegNet model.
Applsci 13 12178 g009
Figure 10. The architecture of the CA-RegNet model.
Applsci 13 12178 g010
Figure 11. Model Performance Metrics.
Applsci 13 12178 g011
Figure 12. Normalized Matrix of each model. (a) Normalized Matrix of CA-RegNet; (b) Normalized Matrix of SE-RegNet; (c) Normalized Matrix of Inception-RegNet; (d) Normalized Matrix of RegNet; (e) Normalized Matrix of EfficientNet B7; (f) Normalized Matrix of ConvNeXt; (g) Normalized Matrix of Res2Net; (h) Normalized Matrix of ResNet.
Applsci 13 12178 g012aApplsci 13 12178 g012b
Figure 13. Confusion Matrix of each model. (a) Confusion Matrix of CA-RegNet; (b) Confusion Matrix of SE-RegNet; (c) Confusion Matrix of Inception-RegNet; (d) Confusion Matrix of RegNet; (e) Confusion Matrix of EfficientNet B7; (f) Confusion Matrix of ConvNeXt; (g) Confusion Matrix of Res2Net; (h) Confusion Matrix of ResNet.
Applsci 13 12178 g013aApplsci 13 12178 g013b
Figure 14. The Segmentation results of each model. (a) The original remote sensing image of Macau; (b) ResNet model segmentation result; (c) Res2Net model segmentation result; (d) RegNet model segmentation result; (e) EfficientNet B7 model segmentation result; (f) ConvNeXt model segmentation result; (g) Inception-RegNet model segmentation result; (h) SE-RegNet model segmentation result; (i) CA-RegNet model segmentation result.
Applsci 13 12178 g014aApplsci 13 12178 g014b
Table 1. The UA (Recall), PA (Precision) and F1-Score of each category.
Coastal Wetlands UACoastal Wetlands PACoastal Wetlands F1-ScoreConstructed Wetlands UAConstructed Wetlands PAConstructed Wetlands F1-ScoreOthers UAOthers PAOthers 1-Score
ResNet0.97820.90720.94470.91340.96490.95870.95630.97140.9809
Res2Net0.85420.93050.89090.92470.94810.93240.97070.89640.9420
RegNet0.98870.94000.92770.94150.98260.94730.98390.98920.9649
EfficientNet
B7
0.97670.84440.90530.80990.99430.89010.98510.94220.9632
ConvNeXt0.93250.86690.89880.92790.92950.92870.87940.85680.9167
Inception-RegNet0.96270.96710.96370.96070.94840.94650.96110.96910.9673
SE-RegNet0.95610.97510.97090.96640.94400.94430.96740.97070.9704
CA-RegNet0.94810.98740.96740.99750.94190.94880.98120.99530.9891
Disclaimer/Publisher’s Note: The statements, opinions and data contained in all publications are solely those of the individual author(s) and contributor(s) and not of MDPI and/or the editor(s). MDPI and/or the editor(s) disclaim responsibility for any injury to people or property resulting from any ideas, methods, instructions or products referred to in the content.

