Article

The High Resolutive Detection of TiO2 Nanoparticles in Human Corneocytes via TEM/NanoSIMS Correlation

Université de Rouen Normandie, INSA Rouen Normandie, CNRS GPM UMR 6634, UFR Sciences et Techniques, F-76000 Rouen, France
*
Author to whom correspondence should be addressed.
Appl. Sci. 2023, 13(22), 12189; https://doi.org/10.3390/app132212189
Submission received: 13 October 2023 / Revised: 4 November 2023 / Accepted: 7 November 2023 / Published: 9 November 2023

Abstract

:
Titanium dioxide (TiO2) nanoparticles (NPs) are the subject of numerous studies and controversies on the risks they could pose to the environment and human health. When in contact with biological tissues, NPs can sometimes be challenging to precisely localize within subcellular structures (typically around 0.1 µm) when they exist as isolated NPs, particularly when using the SIMS approach. Indeed, the chemical signals produced by isolated NPs are very low, so they can be confused with background signals. This was the motivation behind our development of a new strategy for correlating TEM/SIMS to detect TiO2 NPs in close proximity to cutaneous corneocytes. For this purpose, we initially developed a new tool for TEM and SIMS image registration based on a non-rigid image-deformation-enabling image overlay. Combining SIMS and TEM data through this overlay enhances NP localization’s precision. Secondly, we developed an algorithm based on the statistical analysis of multiplane SIMS images to denoise them. As a result, background noise was reduced, illuminating the low yet specific signals from isolated NPs. Finally, this new correlative approach enables the precise 3D localization of isolated NPs within the analyzed volume. We consider this method a breakthrough for subcellular-scale NP localization.

1. Introduction

The innocuity and/or toxicity of titanium dioxide (TiO2) nanoparticles (NPs) are the subject of active research. Their penetration into exposed biological tissues is a subject of controversy. Differences in results may arise from the nature of the nanoparticle (rutile or anatase), its dimensions, its surface chemistry, the type and duration of exposure, the biological origin and the physiological state of the tissues or cells exposed, and the means of investigation (physicochemical or imaging approaches). They are also controversial concerning the risks they could pose to the environment and human health [1,2,3,4,5]. It has been shown that TiO2 NPs can enter the body via inhalation [6] or ingestion [7]. When used as a food additive and ingested by mothers-to-be, they can cross the placental barrier in humans [8]. As a result, titanium dioxide (E171 in the EU) has been banned in foodstuffs since January 2022, following a change in European Commission regulations.
In cosmetics, TiO2 NPs are used particularly in sunscreens as UV filters. It has often been shown that NPs applied to the skin remain on the surface of the first layers of corneocytes [9,10] and accumulate in the furrows or in the follicular orifice [11] but do not penetrate the skin [1,12]. No nanoparticles were found in the sebaceous glands [13] or in the corneocyte or follicular zones. On the one hand, the stratum corneum, therefore, appears to be an effective barrier to the entry of TiO2 NPs [14] after short-term exposure. On the other hand, NPs have penetrated the stratum granulosum via the intercellular spaces after 8 h of application [15] or the epidermis and dermis after 24 h [16]. Furthermore, it has been shown that when the skin is compromised, the risk of penetration into the skin increases [16,17].
Transcutaneous studies have revealed the passage of NPs through different layers of the skin [18,19] without precising their location in different tissues. There are different experimental approaches to address the penetration or non-penetration of NPs. Imaging methods are more interesting approaches to detect and localize TiO2 NPs in tissues. These methods include, for example, electron microscopy [9,20,21,22] or SIMS [16]. With time-of-flight-SIMS, it is possible to detect and localize titanium from TiO2 NPs but impossible to link their location to morphological structures, such as hair follicles or sebaceous glands [16].
In order to precisely localize NPs (or biomolecules, atoms, and sometimes their isotopes) close to (or in) biological structures, a commonly encountered strategy is a combination of a high-resolution technique with an analytical technique. A large list of combinations includes the following: mass spectrometry imaging and magnetic resonance imaging [23]; multiphoton tomography with fluorescence lifetime imaging microscopy [24]; TEM and SEM/EDX (scanning electron microscopy/electron dispersive X-ray spectroscopy) [14]; stimulated emission depletion and SIMS [25]; TEM and confocal microscopy [26]; electron microscopy and SIMS [27,28,29,30,31,32,33,34,35]; or even more techniques, such as autoradiography, SIMS and TEM [36], TEM, fluorescence microscopy, and SIMS [37,38]; or EDX, electron energy loss spectroscopy, cathodoluminescence, and SIMS [39]. Such strategies have been used to study TiO2 NPs using PIXE/RBS/STIM (particle-induced X-ray emission/Rutherford backscattering spectrometry/scanning transmission ion microscopy) [15,17,40,41] or PIXE/RBS/STIM with TEM [10,12], SEM [42], or autoradiography [13], or using secondary electron and mass spectral imaging in a gas field ion microscope [43,44,45].
Whatever the combination, it is important to adapt sample preparation to the physics and constraints of each instrument and to develop data analysis and correlation tools. For example, in Gontier et al. (2008) [10], TEM observations required ultra-fine sections (50–100 nm), whereas PIXE/STIM/RBS observations required semi-fine sections (500 nm). These authors pointed out differences in measurements (making interpretations difficult) that they attributed in large part to sample preparation.
Combining data from various microscopy techniques can be achieved in several ways. The simplest way is to present the images from each technique side by side, allowing readers to identify similarities between the images. Alternatively, image fusion can be employed, which involves merging the data into a new image, as reviewed in [46]. Pixel-level image fusion requires image registration, which involves associating pixel coordinates between images. In contrast, feature-level and decision-level image fusion require the detection of characteristic information in the original images to be combined.
In this paper, the aim is to detect and precisely localize single nanoparticles on human skin explants using TEM and SIMS imaging. To improve localization precision, we chose to combine TEM and SIMS images. Because single images are sometimes difficult to unambiguously interpret and annotate, we chose pixel-level image fusion using a new registration tool. Because single NPs are small, and their corresponding SIMS signals are low, it is important to reduce background noise. For this purpose, we developed a statistics-based algorithm. This data-processing method, conjugated with the multiplane SIMS analysis, was applied to precisely localize isolated NPs in all three dimensions of the analyzed volume.

2. Materials and Methods

2.1. Chemicals

All chemicals were purchased from Sigma-Aldrich (Darmstadt, Germany) except London Resin White (LR White), which was obtained from Agar Scientifics (Stansted, UK).

2.2. Characterization of TiO2 Nanoparticles

To study the shape of the NPs, X-ray diffraction analysis (λ = 1.78886 Å) was carried out on sunscreen (“Mixa lait solaire SPF 50+”) directly introduced into the X-ray analyzer (DRX Malvern Panalytical Empyrean, Coventry, UK) holder. The intensity of the deflected X-rays was measured at different deflection angles (40 kV, 4 mA, 4 s/rotor, step 0.3, and 50 s/step) and analyzed using the DIFFRAC.EVA software (v 6) with stearic acid picks as a reference. To analyze the NPs in TEM, the sunscreen was mixed with LR White resin (7% v/v), sonicated (Transsonic 080) at 35 kHz for 10 min, and then introduced into molds for polymerization at 60 °C for 48 h. Then, 90 nm sections were deposited on a TEM grid (300 mesh) coated with formvar/carbon.

2.3. Skin Sample Preparation

Healthy, defatted human skin obtained from abdominoplasty surgery was maintained at 34 °C in Petri dishes on an agar medium (Dubelcco’s Modified Eagle’s Medium and agar-agar), pH 7.35. Sunscreen (“Mixa lait solaire SPF 50+”) containing TiO2 nanoparticles was applied to the skin in one, two, or three applications at 8 h intervals. Then, 4 mm skin plunges were immediately frozen via high-pressure freezing (EM HPM100 Leica Biosystems, Wetzlar, Germany), and the ice was progressively substituted for 96 h with 0.5% uranyl acetate/methanol in an Automate Freeze Substitution (AFS2 Leica Biosystems, Nussloch, Germany). The fixed and dehydrated pieces were embedded in LR White for 72 h at −15 °C, and polymerization was performed under UV at −15 °C for 88 h. Ultra-fine sections of 90 nm were deposited on Formvar/carbon-coated copper (300 mesh) TEM grids and observed first with TEM and then with SIMS.

2.4. TEM Analysis

The TEM analyses (Jeol JEM 2010, Tokyo, Japan) were carried out at 120 kV. Images were acquired at 10 µm × 8 µm, 672 × 518 pixels with a 120 µm condenser diaphragm, a n°3 objective diaphragm, and a 3–3 spot size. Analyses using the ARM (Atomic Resolution Microscope JEOL 200F, Tokyo, Japan) were carried out at a voltage of 80 kV in a STEM (scanning transmission electron microscopy) and HAADF (high-angle annular dark field) mode, with a 50 µm condenser diaphragm and a spot size of 3. The image resolution was 0.93668 nm per pixel and 1024 × 1024 pixels.

2.5. TEM Image Processing

When required, two TEM images of contiguous fields were combined to form a mosaic using the ImageJ 1.53o software (https://imagej.nih.gov/ij, accessed on 12 October 2023). Briefly, image vignetting was corrected using a low-cut filter (30-pixel diameter Gaussian blur). The brightness of the two images was then adjusted to be uniform. The corrected images were then stitched together using the MosaicJ plugin (2011) with default settings.

2.6. SIMS Analyses

The SIMS analyses were carried out on a NanoSIMS50 (Ametek-Cameca, Berwyn, PA, USA) with a primary Cs+ beam of 16 keV, an FCp current between 20 and 30 nA, an FCo current between 0.5 and 2 pA, and a dwell time of 1 or 2 ms/pixel. The images were 256 × 256 pixels, corresponding to a 10 µm × 10 µm raster. The analysis recurred 20 or 30 times to perform multiplane analysis. Secondary ions were collected at masses of 12C14N (m/z = 26.00307), 16O (m/z = 15.99491), and 48Ti160 (m/z = 63.94286) with a mass resolution power of 5000–6000.

2.7. Drift Correction of SIMS Images

The multiplane images were aligned by translation using the WinImage (v 4.5, 2020) software (Ametek-Cameca, Berwyn, PA, USA) or the SIEDmaker v 2.32 software (https://gpm.univ-rouen.fr/sied, accessed on 12 October 2023) with plane 1 as the reference. For each alignment procedure, a “sum” image of the planes was created, retaining the ion count values. The procedure was first applied to images at a mass of 12C14N, for which a joint histogram between the image of plane 1 and the “sum” image was formed and characterized by its mutual information. The retained alignment was the one maximizing mutual information. The same transformation was then applied to the SIMS images of the other masses, 16O and 48Ti16O. In order to be able to compare the images acquired at 16O with those acquired at 48Ti16O, we checked the correlation between the signal from each image using a Pearson statistical test carried out with R (https://cran.r-project.org, accessed on 12 October 2023).

2.8. Alignment of TEM and SIMS Images

The TEM and SIMS images obtained were aligned and then overlaid using the MoDaT software (MoDaT.NET_beta_231018), developed in the GPM laboratory (University of Rouen Normandie, Rouen, France). MoDaT is multi-instrument data-processing software based on a modular operation. It allows the processing of various input data types (images, electronic signals, atoms). The modular aspect enables the creation of new specific processing modules, such as the TEM and SIMS image alignment module used in this study. The TEM image was used as the reference in bitmap format. To begin, the SIMS image chosen was the 12C14N “sum” image in bitmap format. Landmarks were added alternately to the TEM and the SIMS images on clearly identified objects. Once the first three landmarks were added, the correspondence between the coordinates of the SIMS image pixels and the TEM image pixels was calculated using Delaunay triangulation. An overlay image was constituted with SIMS pixels superimposed on the TEM image, using a chromatic scale and transparency. By adding landmarks, the aligned area of the two images could be extended. The aligned images were exported in greyscale bitmap format. The calculated correspondence of the coordinates was applied to the other SIMS images. The TEM and aligned SIMS images were colored and overlaid using ImageJ.

2.9. Application of the SCP Filter

In the GPM laboratory (University of Rouen Normandie), we developed a “Selection of Contiguous Pixels” (SCP) algorithm to filter images containing a SIMS signal and select the spatially contiguous non-zero pixels. These pixels were considered to be true positive pixels. The principle was as follows: for each pixel with coordinates (x, y, z) whose signal was non-zero, we looked for another non-zero pixel in the coordinate interval ([x − 1; x + 1]; [y − 1; y + 1]; [z − 1; z + 1]). If such a pixel existed, then the pixel with coordinates (x, y, z) was “selected,” and its value was preserved; otherwise, its value was replaced by zero. All selected pixels were then used to reconstitute an image named the “SCP filtered” image.

2.10. 3D Representation

Based on raw or SCP-filtered SIMS images, three projection images were made on the XY plane (the sum of pixels with the same coordinates (x; y) along the Z-axis), on the ZY plane (the sum of pixels with the same coordinates (z; y) along the X-axis), and on the XZ plane (the sum of pixels with the same coordinates (x; z) along the Y-axis). For these projection images, the scale along the Z-axis (an average thickness of 0.19 nm per pixel) was different from that along the X and Y axes (an average distance of 39 nm per pixel). The Z-axis scale was calculated using the average sputtered thickness according to the calculation already explained [47]. The calculation was based on a resin sputtering simulation using SRIM 2013 software [48]. For a resin density of 1.13 g/cm3, the sputtering yield was 2.1 atoms sputtered per implanted Cs+ ion. According to our analysis conditions, the average sputtered thickness was estimated at 0.37 nm/plane for a dwell time of 2 ms/pixel and 0.19 nm/plane for a dwell time of 1 ms/pixel.

3. Results

3.1. Characterization of the TiO2 NPs in the Sunscreen

In the sunscreen that we applied to the skin, the titanium dioxide (TiO2) nanoparticles were rutile, as observed via DRX analysis (Figure 1A) and TEM (Figure 1B). Their apparent size (estimated via TEM measurements) was (42 ± 10) nm by (9 ± 2) nm (n = 50)

3.2. Alignment of SIMS Images

In this study, SIMS images were obtained through a multiplane approach achieved via scanning the surface at X and Y with the primary Cs+ beam. Each plane corresponded to sputtered slices along the Z-axis. In the first approach, the analyzed planes were stacked and summed to accumulate the secondary ion signal on a “sum” image compiling the data over the entire analyzed depth of the section.
The “sum” image obtained via SIMS at a mass of 12C14N (Figure 2A) represents the biological material rich in nitrogen and carbon.
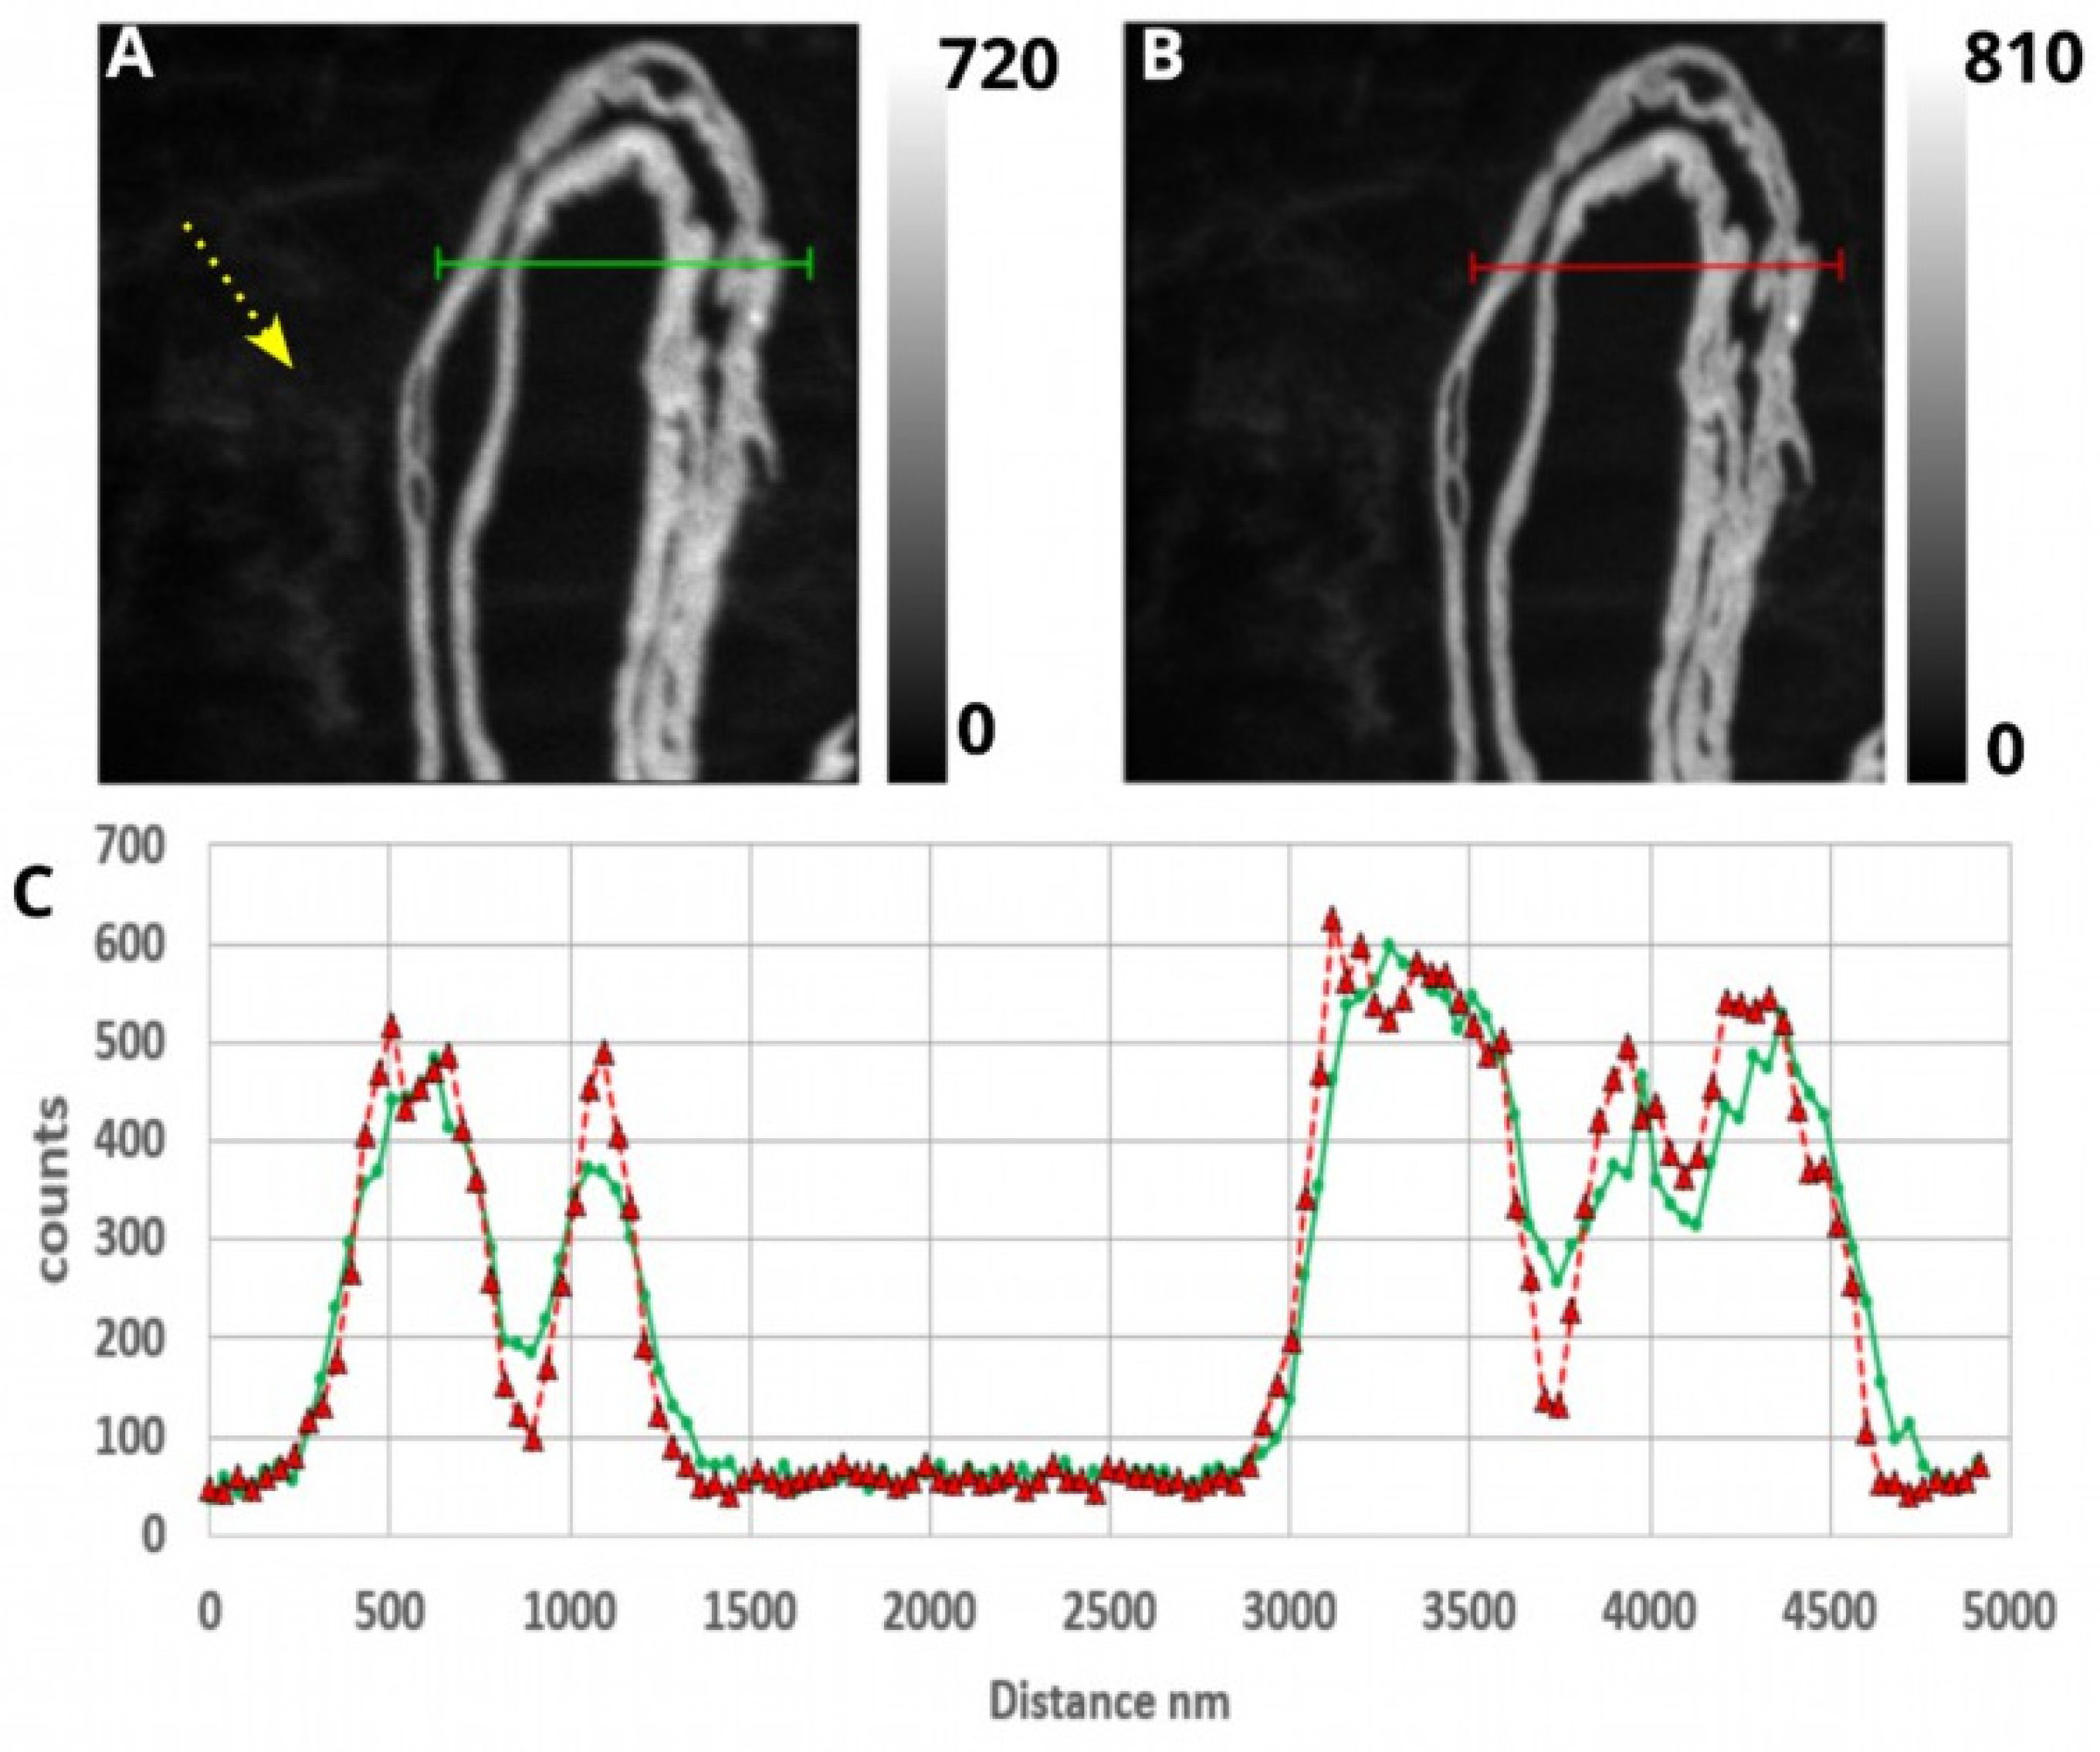
This image shows corneocytes (the outermost structures of the skin, characteristic of the peeling part) in light gray; they are clearly distinguishable from the sunscreen organic matter that is poorer in carbon and nitrogen (the arrow). In this “sum” image, the corneocytes appear blurred (SIMS signal spread) following the stacking of the 20 images acquired during the multiplane analysis (20 successive planes). This blur may result from either an acquisition drift occurring plane by plane or a genuine morphological difference, such as a change in diameter, among the corneocytes in each plane. However, at the end of 20 planes, the sputtered section thickness was about 7.4 nm. Thus, it was reasonable to assume that the diameter or thickness of the corneocytes, which were on the order of one micrometer, did not significantly vary within this sputtered thickness to account for the blur. The corneocytes could, therefore, be used as a reference to align the SIMS images. The resultant image (Figure 2B) exhibits reduced blurriness. Profiles (Figure 2C) were drawn at the same coordinates on the two images (the line) without alignment (Figure 2A) and with alignment (Figure 2B). They show that the width of the corneocytes (estimated via the width of the corresponding peaks) was reduced by 8 ± 4% (the average calculated on five different profiles) via the alignment. The contrasts at the edges of the corneocytes (estimated using the derivatives) were more pronounced with alignment (a peak growth rate of 27 ± 17%), and the maximum number of counts in the “sum” image with alignment was higher than in the “sum” image without alignment. These results confirm the reduction in blurring and the alignment efficiency. This alignment procedure was systematically applied to all multiplane analyses.

3.3. Alignment of TEM and SIMS Images Using MoDaT

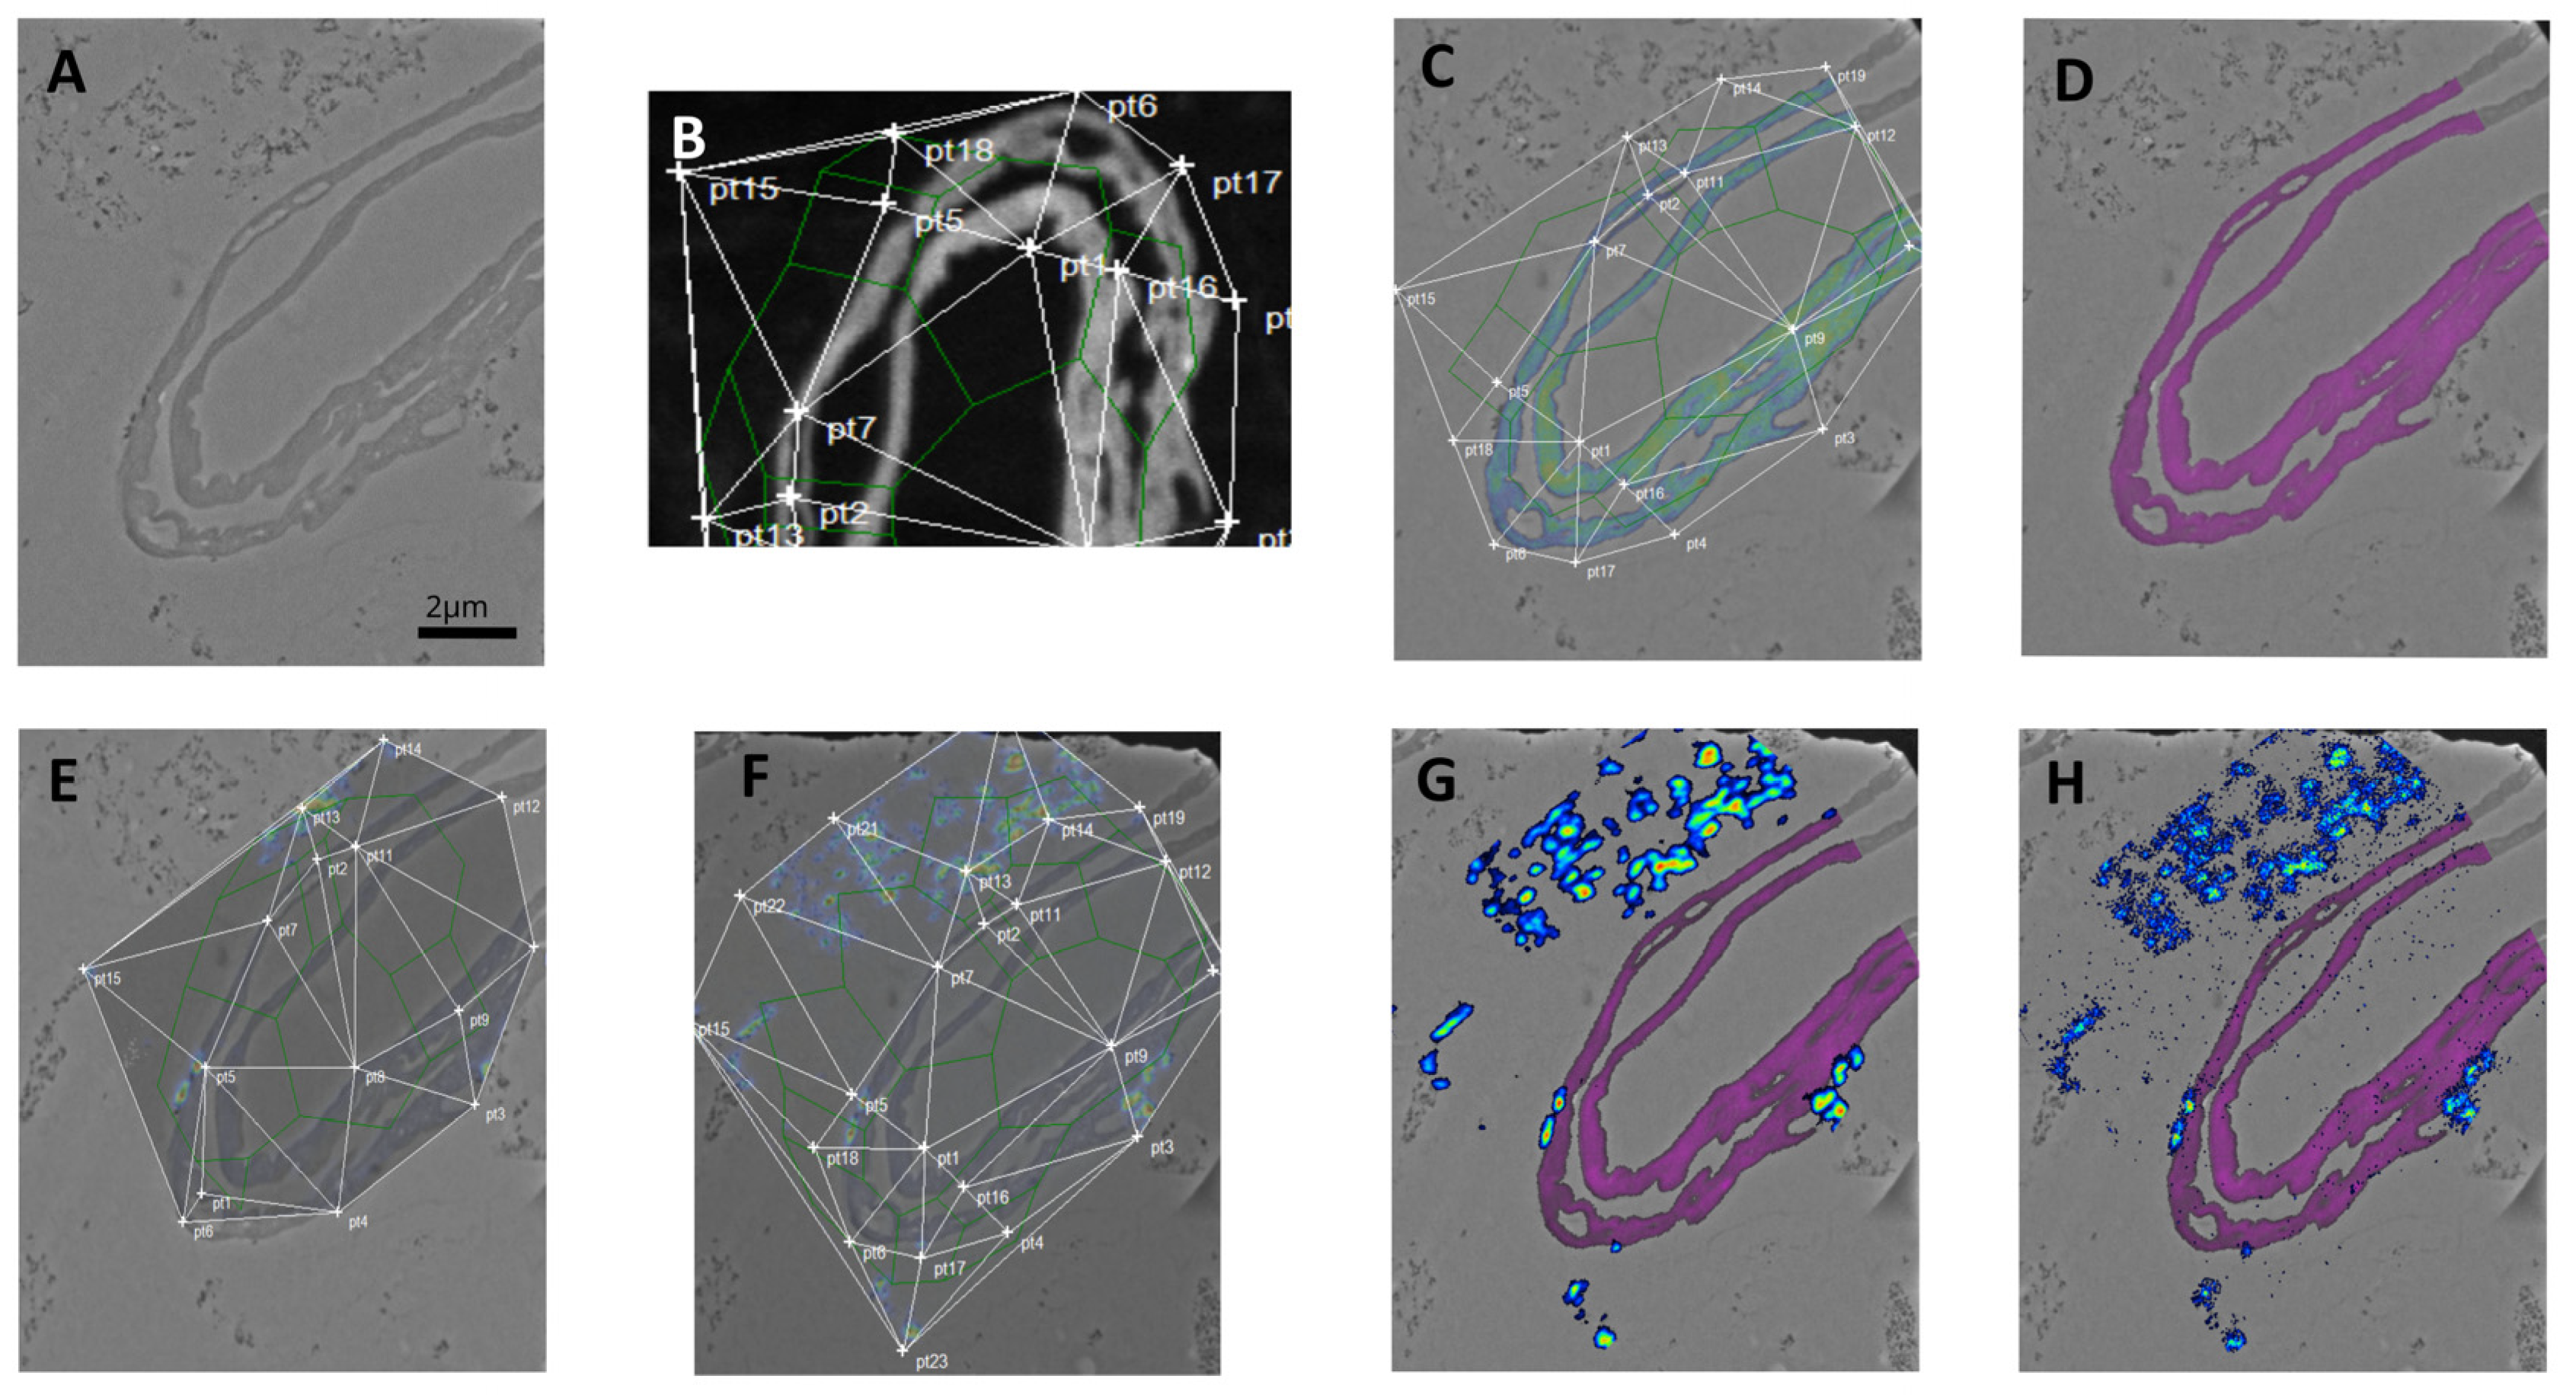
The sample presented in Figure 2 was also analyzed via TEM (Figure 3A). We distinguished corneocytes and NP aggregates. To overlay the TEM and SIMS images acquired from the same areas of the sample (Figure 3), it was necessary to account for the differences in size and resolution: the original TEM images were 672 × 518 pixels, while the original SIMS images were 256 × 256 pixels. Note that here, Figure 3A is a mosaic of two TEM images in order to represent the same field of view as the SIMS images. In addition, the corneocytes do not have the same orientation.
The images required alignment, and for this purpose, we developed a module within the MoDaT software. This module enables SIMS images to be aligned with the TEM image by applying anisotropic transformations. To perform these transformations, landmarks were placed on the images to be aligned (Figure 3B,C,E,F). These landmarks created a mesh that corresponded between the TEM and SIMS images (Figure 3B,C). Figure 3D shows the overlay of the TEM image with the SIMS image of 12C14N. The alignment appeared satisfactory, with corneocytes well superimposed and only a slight overflow of the 12C14N signal (magenta) onto the uranium contrast (gray). This alignment could then be applied to other SIMS images. By extending the alignment mesh (Figure 3F compared with Figure 3E), we could consider both the corneocytes and the NPs aggregates. Figure 3G,H is the overlay of the TEM image with the 12C14N and 16O images (Figure 3G) and with the 12C14N and 48Ti16O images (Figure 3H). The aggregates, as observed at masses 16O and 48Ti16O, are well centered with those seen in the TEM image, though they do exhibit a slight overflow. This suggests that the alignment was satisfactory despite the differences in the original images and the physics of the instruments. As the 16O and 48Ti16O images seem to reveal the same structures, potentially NPs aggregates, we checked whether the two images were correlated. We performed a Pearson test to compare the images. The correlation coefficient was 0.856 with a p-value of 2.2 10−16, which meant that there was a strong correlation between the two images and that the TiO2 NPs could be localized using the 16O signal and/or the 48Ti16O signal. However, in Figure 3E,F, there is a slight 16O signal coming from the corneocytes. So, to avoid any confusion between the 16O signal from the NPs and that from the corneocytes, it was preferable to focus on the specific signal to the NPs, i.e., 48Ti16O (Figure 3H). All these observations show that the aggregates identified via TEM and SIMS at masses of 16O and 48Ti16O were located on the outside of the corneocytes. They did not appear to have crossed the corneocyte barrier.

3.4. Localization of Small NP Aggregates

To study NPs in smaller aggregates or isolated near or in corneocytes, another area of the sample was chosen. Figure 4 shows corneocytes in contact with sunscreen analyzed via SIMS at masses of 12C14N (Figure 4A) and 48Ti16O (Figure 4B) and via TEM (Figure 4C,D).
Figure 4A,B shows NP aggregates clearly visible in the vicinity of the corneocytes. The purple framed region of interest (ROI) indicates the area observed in TEM. Note that the right edge of Figure 4A shows a signal gradient (up to 14 pixels in this case) in the ROI resulting from the alignment of the 30 successive planes; this edge is cropped in Figure 4C–F in order not to distort the interpretation. Figure 4C shows a schematic view of the TEM image (Figure 4D) with a corneocyte outgrowth, a furrow, and an assumed contact zone (arrow) between the corneocytes. In Figure 4D, several aggregates (indicated by the arrows) are visible in TEM close to the corneocytes. The aggregates indicated by the red and pink arrows were also visible in SIMS (Figure 4E) but did not have the same dimensions. For example, the size of the large aggregate (the solid red arrow) measured 75 nm × 140 nm in the TEM image (Figure 4D) and approximately 300 nm × 400 nm in the SIMS image (Figure 4E). These size differences were also observed for the corneocytes for which the SIMS 12C14N (magenta) signal extended slightly beyond their edges (as already shown in Figure 3D). These observations can be explained by the difference in the spatial resolution of the two instruments.

3.5. Toward Isolated NPs’ Detection

In Figure 4E, numerous pixels with a low-intensity 48Ti16O signal are relatively evenly and randomly distributed. They were derived from background noise. In the context of an exploration of isolated NPs, these non-specific signal pixels were considered false positives. If isolated NPs were present in the analyzed zone (true positive pixels), they produced a low signal that was difficult to distinguish from the false positive pixels. To distinguish true positive pixels with a very low signal (one or two counts on the “sum” image in Figure 4B) from false positives, the pixels were filtered using a probabilistic approach. We measured, on control images, the frequency of false positive pixels (non-zero pixels) at 0.00047. Considering the 30 analyzed planes (30 images of 256 × 256 pixels), the sputtered volume was roughly equivalent to 2.106 pixels. Thus, we could expect to observe an average of 900 false positive pixels (across the entire volume). In the “sum” image (Figure 4B), all false positive pixels are stacked with a density of 1 per 80 pixels. Considering the sputtered volume, the probability of two contiguous false positive pixels in three-dimensional space was, therefore, around 25.10−8. Given that this probability was low, we applied a filter named “Selection of Contiguous Pixels” (SCP) to the 48Ti16O images. The principle was to consider as true positive pixels only those positive pixels (a non-zero 48Ti16O signal) that had at least one non-zero neighboring pixel (a contiguous pixel in three-dimensional space). Figure 4F shows the overlay produced from this filtered 48Ti16O “sum” image. The resulting image shows fewer scattered pixels. The three large clusters (the red and pink arrows) initially identified (Figure 4D) are clearly visible. Some pixel clusters disappeared after the SCP filter was applied because they were not contiguous pixels on the X, Y, and Z-axes despite appearances (the circles in Figure 4E). On the other hand, the application of the SCP filter revealed a few true positive pixels (the green arrows in Figure 4F), which were not distinguished from the false positives in Figure 4E. These NPs were not detected via TEM.
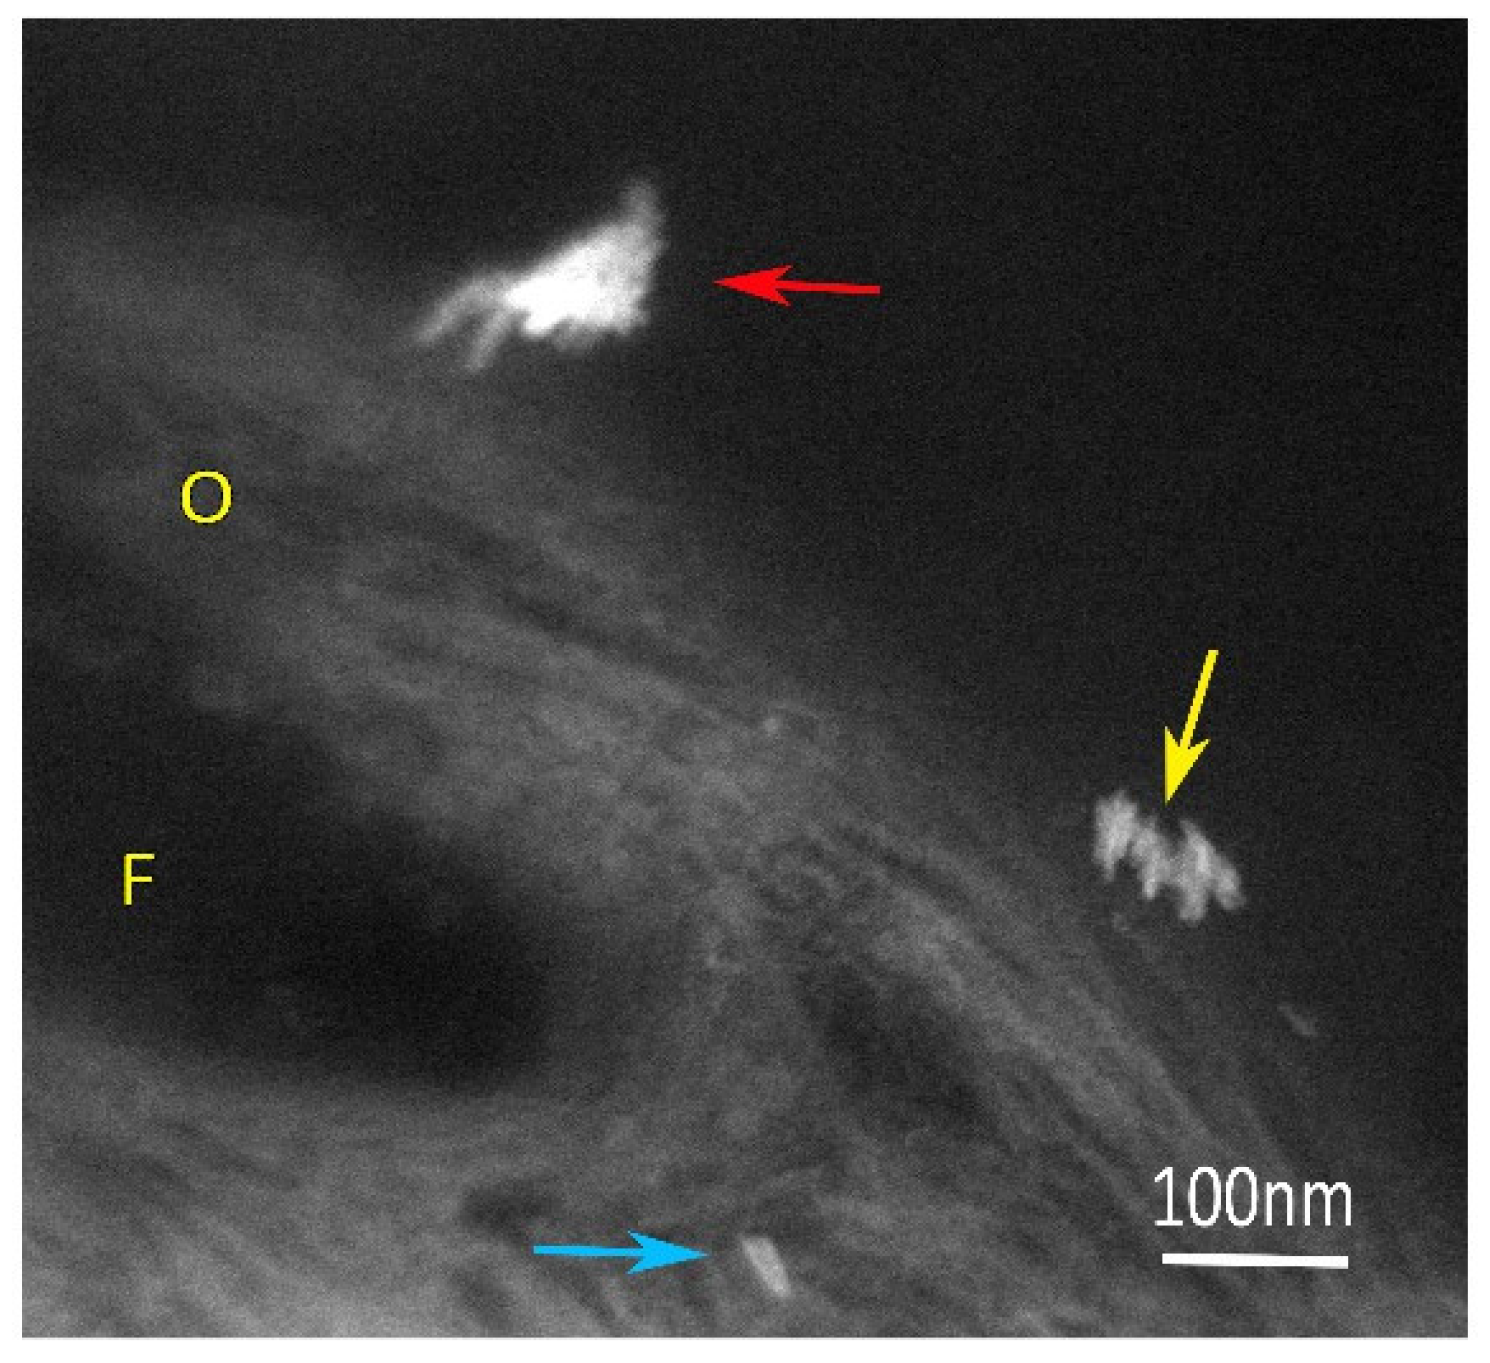
Figure 5 is a STEM–HAADF image of the same sample (but with a smaller ROI) performed before the NanoSIMS analysis.
The truncated corneocyte outgrowth and furrow (shown in Figure 4C) were clearly recognizable. The aggregate at the edge of the corneocyte (the red arrow), as previously reported via TEM and SIMS (Figure 4D–F), could now be observed with an improved resolution and measured 60 nm × 140 nm. The 93 nm × 33 nm aggregate at the base of the outgrowth (the yellow arrow), where the NPs appear aligned, is the aggregate already observed in TEM (the yellow arrow in Figure 4D). A unique 37 nm × 13 nm nanoparticle was visible at the prolongation of the furrow (the blue arrow), whereas it was not visible at a lower-resolution TEM (Figure 4D–F). These two last objects were not detected in the SIMS images. This suggests that these NPs were located deeper in the thickness of the section than the 6 nm sputtered thickness.

3.6. 3D Distribution of NPs

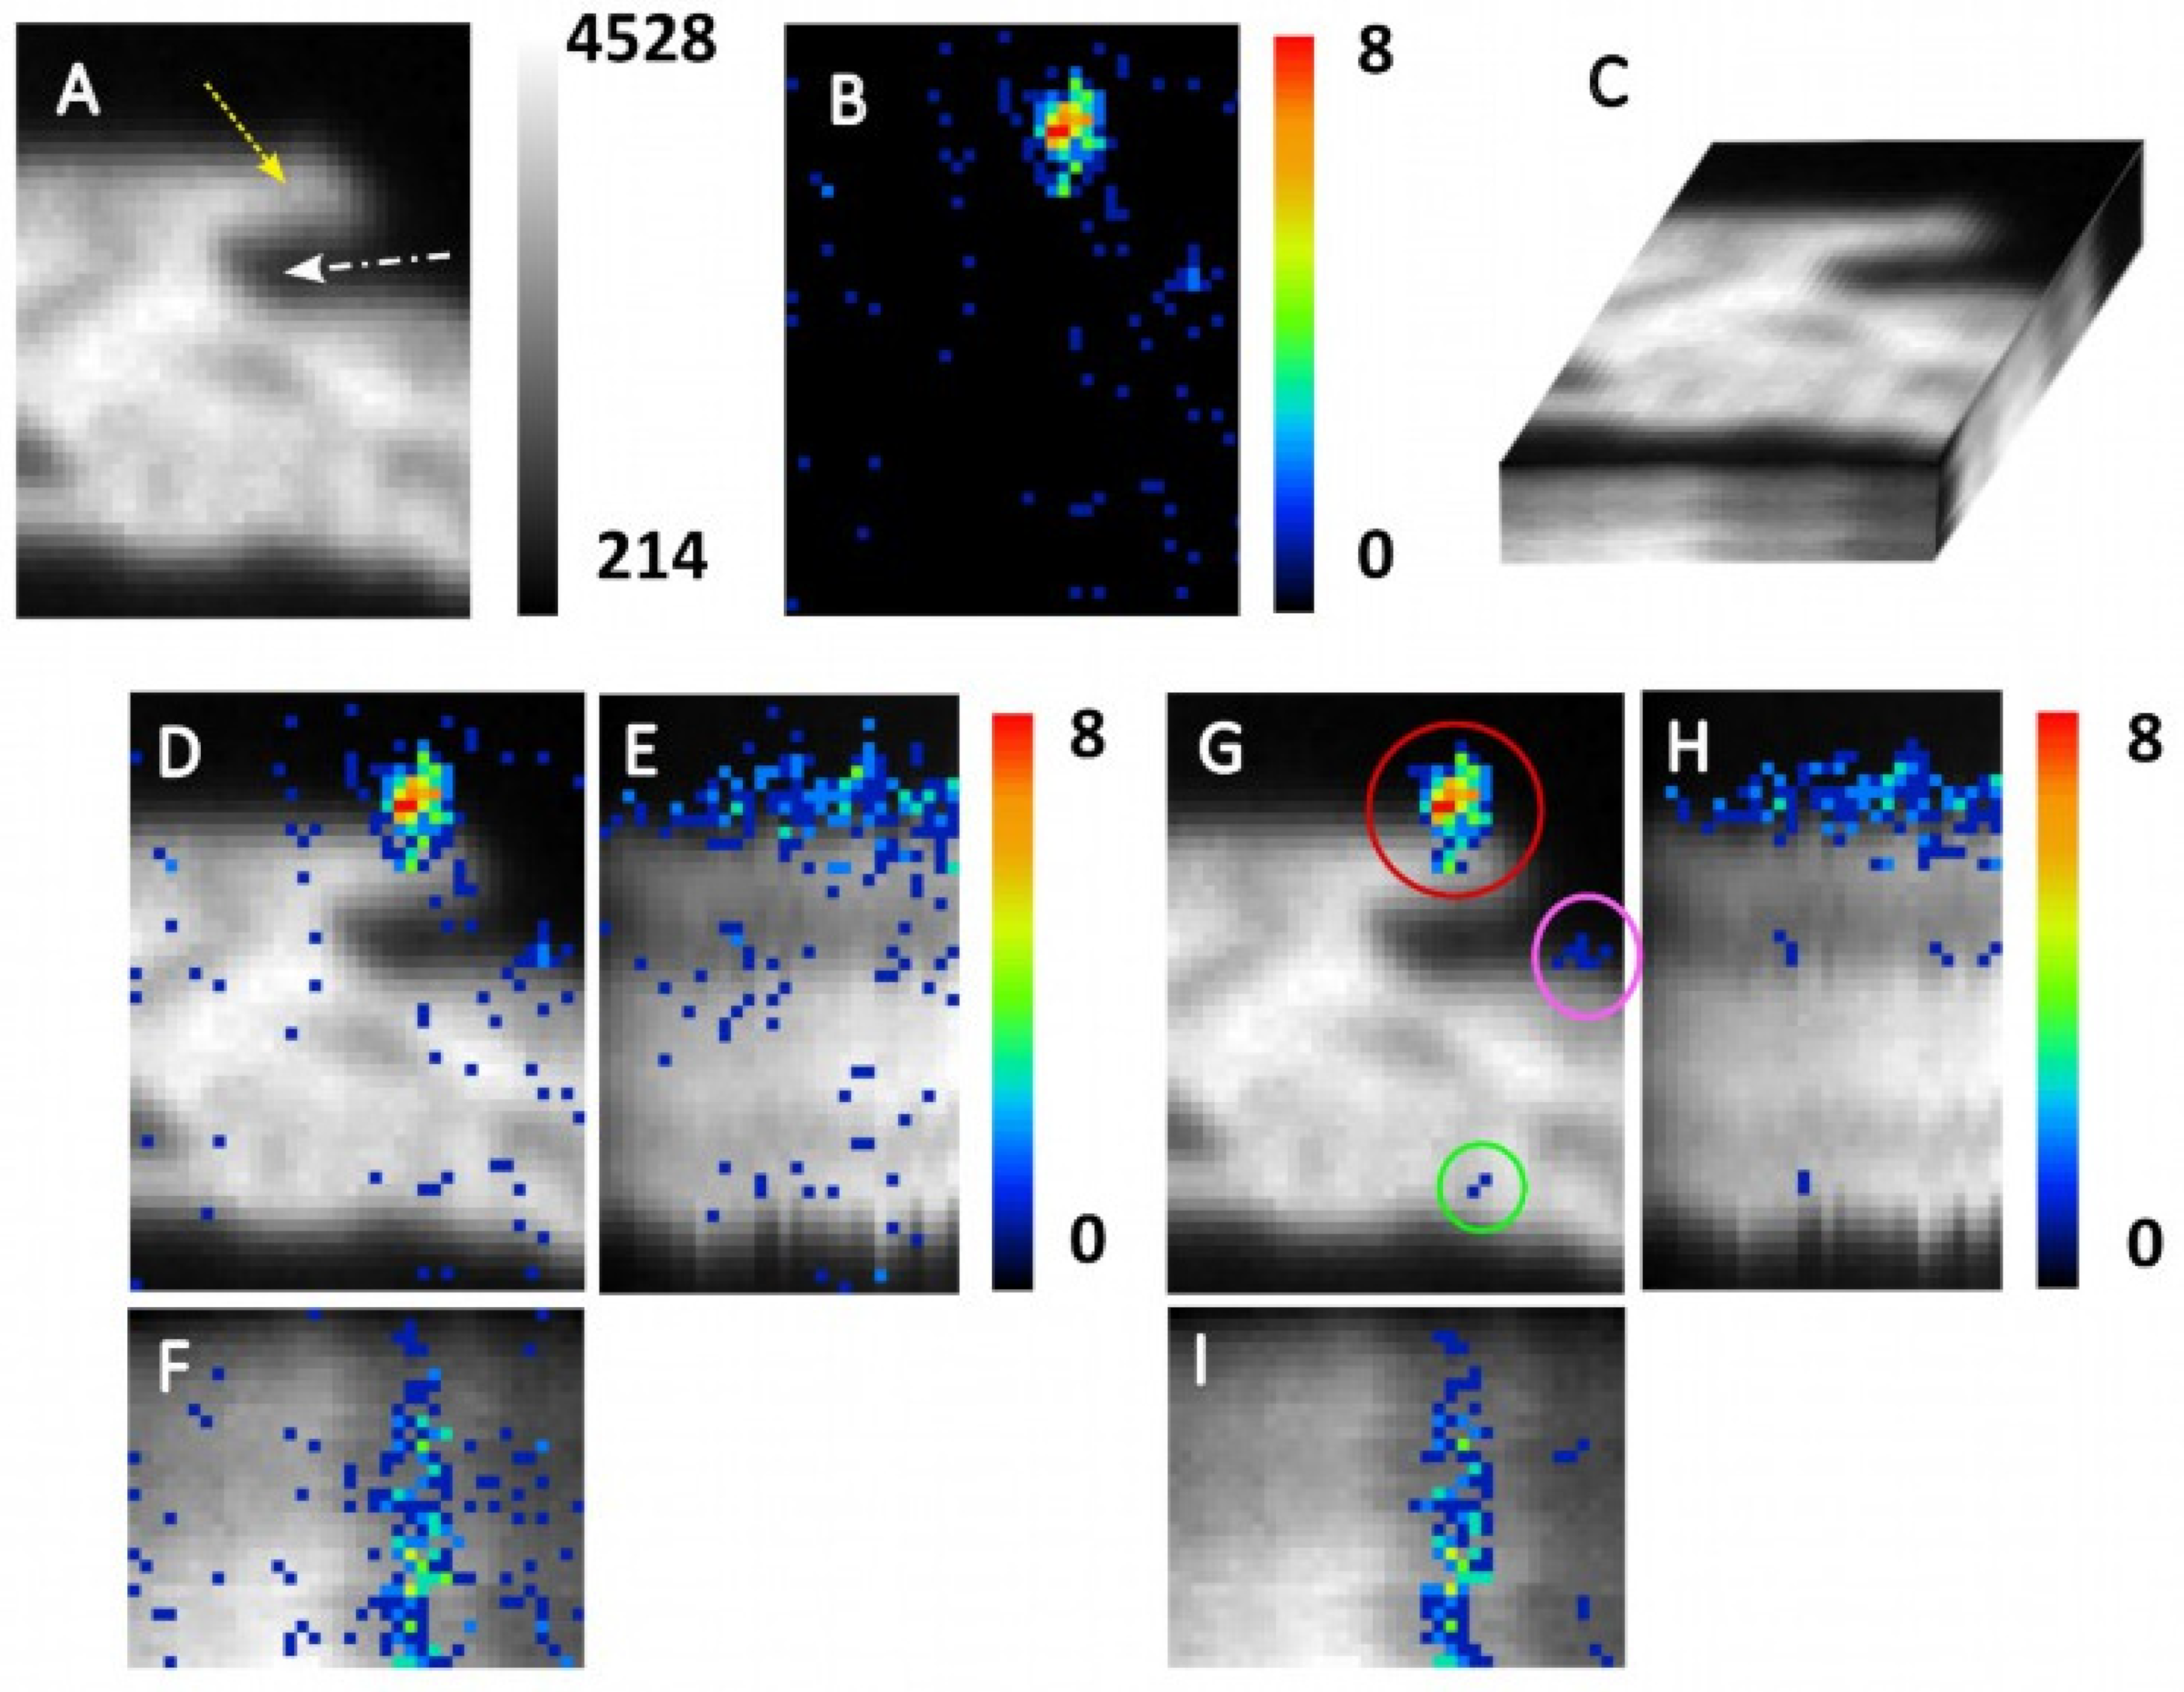
If one aims to study the localization of a nanoparticle within a biological object, it is valuable to represent the 3D distribution of this NP within the biological material using SIMS data. For this reason, we extracted the signal plane by plane to reconstruct the sputtered volume in the three X, Y, and Z-axes. Figure 6A,B are the “sum” images of the 30 planes acquired at masses 12C14N and 48Ti16O, respectively. Note that, as these images are here dissociated from the TEM image, the orientation is that of the original SIMS images, which (Figure 6A) shows the corneocyte outgrowth (the yellow arrow) and the furrow (the white arrow).
In Figure 6C, the top side of the parallelepiped represents the projection onto the XY plane (the sum of the 12C14N planes), as shown in Figure 6A. The other two sides represent the projections onto the YZ plane (the right side of the parallelepiped) and the XZ plane (the front side of the parallelepiped) of the 3D 12C14N data. It is important to note that, for improved readability, particularly along the Z-axis, the Z scale has been adjusted (see “Materials and Methods”).
Figure 6D–F shows overlays of the 48Ti16O “sum” image on the 12C14N “sum” image on the XY (Figure 6D), ZY (Figure 6E), and XZ (Figure 6F) projections. A large number of false positive pixels were scattered across the surface and at depth, as already discussed in Figure 4E. Figure 6G–I shows the corresponding SCP-filtered images. The 48Ti16O signal on the XY projection clearly shows three pixel clusters (Figure 6G): the largest (the red circle) of 47 pixels on the surface of the corneocyte outgrowth, a smaller one of 7 pixels (the pink circle) in the corneocyte furrow, and the third cluster of 2 pixels (the green circle) on the opposite and lower edge of the corneocyte. In the ZY and XZ projections (Figure 6H,I), the largest cluster was distributed from plane 3 to plane 30. The corresponding NP signal extended over approximately 300 nm on the X-axis and 400 nm on the Y-axis, and it was at least 5.1 nm in depth (on the Z-axis). Given the apparent size of the NPs (rutile form) at 42 ± 10 by 9 ± 2 nm, we estimated that there were several tens of NPs in this aggregate. We assumed that not all of the NPs were packed in a continuous aggregate, as groups of two or three pixels stood out from the main cluster over several tens of nanometers on the Y-axis (Figure 6H). The cluster circled in pink could reveal three differentiated NPs along the Z-axis (Figure 6H,I), all located in the corneocyte furrow at the 12th plane (approx. 2 nm), at the 25–26th plans (approx. 5 nm), and at the 29–30th planes (approx. 6 nm). Similarly, the signal from the cluster circled in green was compatible with the presence of a single nanoparticle visible at the 14th plane (Figure 6H) on the edge of the corneocyte.
These analyses show that the SCP filter eliminates false positive pixels, highlights small aggregates of NPs and/or isolated NPs, allows for their localization at the edges of corneocytes, and, to some extent, enables NP counting.

4. Discussion

Cosmetic Regulation (EC) No. 1223/2009 defines nanomaterials in cosmetic products as intentionally manufactured, insoluble, biopersistent substances, such as metals, metal oxides, or carbon materials, with sizes between 1 and 100 nm. In the sunscreen we applied to skin, the nanomaterials were a rutile of titanium dioxide (TiO2) nanoparticles with an apparent size of 42 ± 10 nm by 9 ± 2 nm.
To observe NPs using electron microscopy and SIMS, it is essential to incorporate steps for fixing and dehydrating the biological tissues, embedding them in resin, cutting the sections, and depositing them on a suitable support. The objectives of these preparations are manifold: (1) to preserve ultrastructures, (2) to prevent the displacement of diffusible elements, (3) to make sample sections compatible with the physical constraints of the microscopes, (4) to render biological structures visible in TEM, and (5) to ensure that preparation methods do not introduce bias. Here, sections are deposited on electron microscopy grids for which a SIMS sample holder has been specially designed. The thickness of the sections must be as thin as possible (60 to 90 nm) so that electrons from the electron beam can pass through without blurring the image. Conversely, since NanoSIMS is a destructive analysis, the section has to be thick enough (the standard thickness is about 200 nm). In multi-instrument imaging studies that rely on different physical principles and, consequently, have different requirements, it is common practice to use serial sections, with each section’s thickness adjusted to suit the specific instrument [49]. However, in this case, the analyzed areas were not exactly the same. Since nanoparticles are smaller than the section’s thickness, nanoparticle analysis requires working on the same section [50], ensuring that the same NPs are analyzed using different instruments [51]. It was, therefore, essential in our study to use sample sections compatible with the two instruments. We, therefore, observed the same 90-nm-thick section with both instruments. In the TEM images, the NPs are clearly visible and distinguished from skin structures with a few rare exceptions. The NPs are noticeable by their size, their aggregate shape, and especially the contrast inherent in their chemical composition. The SIMS images of skin surfaces on which sunscreen had been applied show large aggregates of TiO2 NPs. As we tested one, two, and three successive applications of sunscreen on the skin over 24 h, we were able to observe that the number of aggregates and their density on the skin surface increased with the amount of cumulated applied cream (not shown). This finding is encouraging, as it means that (1) the cream remained on the skin’s surface despite the sample preparation for microscopy, (2) if there is a loss of NPs, it does not disrupt the NPs’ proportionality with the number of applications, and (3) the fixation/dehydration/inclusion protocol did not induce a consequent NP loss. We could, therefore, extrapolate that NPs on the skin surface or in the skin were not relocated during the sample preparation process. Thus, we chose to present the results from samples exposed to three applications during 24 h because they were overloaded with NPs to increase the chance of NPs’ penetration into the skin (if, indeed, NPs did penetrate).
There are numerous studies on the localization of TiO2 NPs applied to the skin, often employing two (and sometimes more) imaging techniques. However, their differing resolutions can occasionally limit the precision of NP localization. With the PIXE methods, it is difficult to detect Ti, as detection limits are reached [40] with a resolution of the order of 1–2 µm. In our study, we aimed to detect and localize small NPs within biological ultrastructures. Combining the high-sensitivity imaging of NanoSIMS50 with TEM imaging appeared to be a relevant approach. To combine data from TEM and SIMS, we needed a common referential to co-localize and co-identify image objects. For this purpose, alignments were required in two contexts: the alignment of the planes of a SIMS analysis and the alignment of SIMS images on TEM images. As mentioned in the review section [52], both the alignment method transformation and evaluation criteria must be adapted to the type of image being aligned. In the case of SIMS plane alignment, the priority is to preserve the number of counted secondary ions (counts). Indeed, each SIMS image plane is a sequence of nano-analyzes, with each nano-analysis corresponding to a pixel. The value of each pixel expressed as counts is an integer, which can be described using Poisson’s probability distribution. This property is essential for the statistical analysis of an image and, in particular, the detection of statistically significant low signals [47]. Any image transformation that could alter pixel values is, therefore, not recommended. Here, the SIMS image planes were aligned using lateral translations to preserve the pixel values. These lateral translations were performed with two types of software (Ametek-Cameca’s WinImage (v 4.5, 2020) and SIEDmaker (v 2.32 2023)) that differed only in their criterion (or measure of similarity) used to evaluate alignment quality. The resulting alignments were sometimes identical and sometimes different. These differences manifested in one or more areas of the image that were sharper than the others. The best alignment method for the whole image or an ROI was chosen on the basis of maximum mutual information.
In the context of TEM and SIMS image alignment, the objective and the constraint are different. The top priority is to preserve the definition of the TEM image for the accurate identification of ultrastructures and NP localization. The SIMS image is subsequently transformed to align with the TEM image. The most commonly used alignment methods in correlative imaging involve the sequential application of isotropic and, in some cases, anisotropic transformations [52]. Each transformation is defined by parameters determined through a highly automated process. In our images, isotropic transformations (rigid or elastic) systematically resulted in the correct alignment of only a small zone to the detriment of the rest of the image. We, therefore, developed an alignment module in MoDaT, relying on the direct application of anisotropic transformations characterized by parameters determined manually by the user. We assume that this software provided better alignment for our images, indicated by higher mutual information and lower joint entropy compared to other software (EC-CLEM (v 1.0.1.5) a type of ICY plugging [53], and Fijiyama, (v 4.2.0) a type of ImageJ plugging [54])).
In our aligned SIMS and TEM images, we found that the objects seen in the SIMS images systematically appeared larger than the corresponding objects in the TEM images. This was attributed to the lower resolution of NanoSIMS. Indeed, the primary ion beam diameter has been estimated [55] at about 100 nm. As this beam is larger than a pixel (39 nm × 39 nm), it overlaps several contiguous pixels during scanning. As a result, the signal spreads across multiple pixels, causing an overestimation of the object dimensions of approximately 200 nm. To align the dimensions of SIMS objects with those of TEM objects, fusion methods for SIMS and TEM images are available [28]. These methods, which combine the advantages of TEM imaging resolution with the analytical performance of SIMS, are particularly suitable when object co-identification is unambiguous and the SIMS signal intensity is high. In our study, when dealing with isolated or aggregated NPs, the SIMS signals were often low, and object co-identification was not always straightforward. Therefore, we opted to overlay the images without using the fusion methods mentioned above despite the observed overflow.
SIMS microscopy is generally considered to be one of the most sensitive techniques. NanoSIMS50 is characterized by low background noise from the electron multipliers and ubiquitous electrical noise [56]. In our control images, the overall noise is low (about 0.23 counts per second, i.e., an average of one count per 80 pixels). The challenge is now to distinguish NPs’ signals from noise. Since, using SIMS, TiO2 NPs’ ion yield is low, the expected signal of an isolated nanoparticle is low. The risk of confusing it with background noise is high. Several methods have been reported to reduce background noise. The simplest method is to apply a threshold, e.g., to consider only pixels associated with two or more counts. Such a threshold would have resulted in the removal of most of the positive pixels in our images, restricting the study to large aggregates only. Statistical approaches have been developed to denoise images using a Fourier transformation [57] or statistical characterization of local noise [47,56]. In this study, these methods were not applicable due to the small size of the objects to be detected and their weak signals. We, therefore, applied an SCP filter to reduce image noise and, thus, highlight the signal from the NPs. It was justified by an SRIM sputtering simulation. Considering the sputtering yield (about 1.3 Ti atoms sputtered per cesium primary ion), the number of Ti atoms per NP (about 57,000), the incident cesium dose (about 12,000 Cs for a 2pA beam and 1 ms dwell time), we estimated that 27% of an NP (15,600 Ti atoms) can be sputtered. Then, an isolated NP cannot be entirely sputtered during the dwell time corresponding to a single pixel. Consider an isolated NP and the overlapping of the ion beam (as expressed above); the NP is sputtered in at least two contiguous pixels. Depending on the 3D orientation of the NP in the resin, the signal can spread across two or more contiguous pixels in at least one of the three dimensions. By removing non-contiguous positive pixels, the SCP filter effectively denoises images while preserving relevant signals (true positive pixels). In summary, we proposed in this paper a procedure to correlate TEM and SIMS images. This process involves (1) data acquisition, (2) SIMS alignment of planes, (3) TEM and SIMS alignment, (4) SCP filter application, and (5) the co-identification of nano-objects. Considering all the data, it is possible to localize in 3D nano-objects within a section thickness of a few tens of nanometers.
According to us, this work applied a correlative imaging approach. It is difficult to propose a universal definition of correlative imaging. Under the term correlative imaging, numerous studies have combined analytical imaging (of a specific signal) with structural imaging. The aim is to optimize the specificity (reliable detection), the sensitivity, and/or the detection limit of the signal of an object to be localized as precisely as possible within a clearly identified biological matrix. An example of correlative imaging is the combination of SIMS microscopy as an analytical technique and TEM as structural imaging. This approach has been previously applied in biology [27,30,31,33,34,37,38,43,58,59]. However, most of these studies compare images without overlaying them. Here, we overlaid the TEM and SIMS images obtained at two different masses: 12C14N, for the recognition of biological structures in complementarity with the TEM image, and 48Ti16O, for the specific detection of TiO2 NPs. In our study, we were able to detect and localize isolated NPs or small aggregates in contact with biological tissue. Data complementarity and image overlay (an alignment procedure and filter application) show that some NPs, even if isolated, can be detected using both techniques; some can be detected via TEM but not SIMS, and others can be detected via SIMS but not TEM. These data were used to interpret the location and/or distribution of NPs in the depth of the sample section. Our correlative approach provided more information than each technique considered in isolation. We initiated an NP localization study in deeper skin tissues, ranging from the stratum corneum to the dermis, where, for instance, no TiO2 NPs were detected after 24 h of sunscreen application. This preliminary finding is in accordance with previous results obtained in the literature [1,9,10,11,12], and it requires further investigation.

5. Conclusions

In this paper, we have demonstrated the advantages of combining TEM and SIMS imaging. These two techniques are complementary, mutually enriching each other. TEM’s high resolution enables the precise lateral localization of NPs within biological ultrastructures, while SIMS’s high sensitivity reinforces reliable NP detection and in-depth NP localization. Furthermore, our procedure for NP detection and localization can be applied to study various nano-objects (metallic or organic) with potential environmental or health implications and to determine their locations within biological tissues.

Author Contributions

Conceptualization, A.C.-F.; methodology: A.C.-F., A.D. and M.J.; software, A.D., F.D. and B.K.; formal analysis, A.C.-F. and A.D.; investigation, M.J., D.G., A.E., F.D. and B.K.; data curation, M.J., A.D., D.G., A.E., F.D. and A.C.-F.; writing—original draft preparation, A.C.-F. and A.D.; writing—review, A.E., D.G., F.D. and B.K.; project administration, A.C.-F. All authors have read and agreed to the published version of the manuscript.

Funding

This research received no external funding.

Institutional Review Board Statement

Not applicable.

Informed Consent Statement

Not applicable.

Data Availability Statement

No new data were created or analyzed in this study. Data sharing is not applicable to this article.

Acknowledgments

This work was partly undertaken using the PRIMACEN for high-pressure freezing and cryosubstitution sample (Université de Rouen Normandie, INSERM, CNRS, HeRacLeS US 51 UAR 2026, PRIMACEN, F-76000, Rouen, France) and supported by the Université de Rouen Normandie. Thanks to Celia Castro for student MET formation and image acquisition, Fabien Cuvilly for DRX analyses, and the department of “chirurgie réparatrice” of CHU de Rouen for cutaneous surgical waste. This work was partially supported by the CNRS Federation IRMA—FR 3095.

Conflicts of Interest

The authors declare no conflict of interest.

References

  1. Borm, P.J.; Robbins, D.; Haubold, S.; Kuhlbusch, T.; Fissan, H.; Donaldson, K.; Schins, R.; Stone, V.; Kreyling, W.; Lademann, J.; et al. The potential risks of nanomaterials: A review carried out of ECETOC. Part. Fibre Toxicol. 2006, 3, 11. [Google Scholar] [CrossRef] [PubMed]
  2. Dréno, B.; Alexis, A.; Chuberre, B.; Marinovich, M. Safety of titanium dioxide nanoparticles in cosmetics. J. Eur. Acad. Dermatol. Venereol. 2019, 33, 34–46. [Google Scholar] [CrossRef] [PubMed]
  3. Larese Filon, F.; Mauro, M.; Adami, G.; Bovenzi, M.; Crosera, M. Nanoparticles skin absorption: New aspects for a safety profile evaluation. Regul. Toxicol. Pharmacol. 2015, 72, 310–322. [Google Scholar] [CrossRef] [PubMed]
  4. Crosera, M.; Bovenzi, M.; Maina, G.; Adami, G.; Zanette, C.; Florio, C.; Filon Larese, F. Nanoparticle dermal absorption and toxicity: A review of the literature. Int. Arch. Occup. Environ. Health 2009, 82, 1043–1055. [Google Scholar] [CrossRef] [PubMed]
  5. Shakeel, M.; Jabeen, F.; Shabbir, S.; Asghar, M.S.; Khan, M.S.; Chaudhry, A.S. Toxicity of Nano-Titanium Dioxide (TiO2-NP) Through Various Routes of Exposure: A Review. Biol. Trace Elem. Res. 2016, 172, 1–36. [Google Scholar] [CrossRef] [PubMed]
  6. Rossi, S.; Savi, M.; Mazzola, M.; Pinelli, S.; Alinovi, R.; Gennaccaro, L.; Pagliaro, A.; Meraviglia, V.; Galetti, M.; Lozano-Garcia, O.; et al. Subchronic exposure to titanium dioxide nanoparticles modifies cardiac structure and performance in spontaneously hypertensive rats. Part. Fibre Toxicol. 2019, 16, 25. [Google Scholar] [CrossRef] [PubMed]
  7. Bettini, S.; Boutet-Robinet, E.; Cartier, C.; Coméra, C.; Gaultier, E.; Dupuy, J.; Naud, N.; Taché, S.; Grysan, P.; Reguer, S.; et al. Food-grade TiO2 impairs intestinal and systemic immune homeostasis, initiates preneoplastic lesions and promotes aberrant crypt development in the rat colon. Sci. Rep. 2017, 7, 40373. [Google Scholar] [CrossRef]
  8. Guillard, A.; Gaultier, E.; Cartier, C.; Devoille, L.; Noireaux, J.; Chevalier, L.; Morin, M.; Grandin, F.; Lacroix, M.Z.; Coméra, C.; et al. Basal Ti level in the human placenta and meconium and evidence of a materno-foetal transfer of food-grade TiO2 nanoparticles in an ex vivo placental perfusion model. Part. Fibre Toxicol. 2020, 17, 51. [Google Scholar] [CrossRef]
  9. Schulz, J.; Hohenberg, H.; Pflücker, F.; Gärtner, E.; Will, T.; Pfeiffer, S.; Wepf, R.; Wendel, V.; Gers-Barlag, H.; Wittern, K.P. Distribution of sunscreens on skin. Adv. Drug Deliv. Rev. 2002, 54, S157–S163. [Google Scholar] [CrossRef]
  10. Gontier, E.; Ynsa, M.-D.; Bíró, T.; Hunyadi, J.; Kiss, B.; Gáspár, K.; Pinheiro, T.; Silva, J.-N.; Filipe, P.; Stachura, J.; et al. Is there penetration of titania nanoparticles in sunscreens through skin? A comparative electron and ion microscopy study. Nanotoxicology 2008, 2, 218–231. [Google Scholar] [CrossRef]
  11. Filipe, P.; Silva, J.N.; Silva, R.; Cirne De Castro, J.L.; Marques Gomes, M.; Alves, L.C.; Santus, R.; Pinheiro, T. Stratum Corneum Is an Effective Barrier to TiO2 and ZnO Nanoparticle Percutaneous Absorption. Skin Pharmacol. Physiol. 2009, 22, 266–275. [Google Scholar] [CrossRef] [PubMed]
  12. Mavon, A.; Miquel, C.; Lejeune, O.; Payre, B.; Moretto, P. In vitro Percutaneous Absorption and in vivo Stratum Corneum Distribution of an Organic and a Mineral Sunscreen. Skin Pharmacol. Physiol. 2007, 20, 10–20. [Google Scholar] [CrossRef] [PubMed]
  13. Lekki, J.; Stachura, Z.; Dąbroś, W.; Stachura, J.; Menzel, F.; Reinert, T.; Butz, T.; Pallon, J.; Gontier, E.; Ynsa, M.D.; et al. On the follicular pathway of percutaneous uptake of nanoparticles: Ion microscopy and autoradiography studies. Nucl. Instrum. Methods Phys. Res. Sect. B Beam Interact. Mater. At. 2007, 260, 174–177. [Google Scholar] [CrossRef]
  14. Pflücker, F.; Hohenberg, H.; Hölzle, E.; Will, T.; Pfeiffer, S.; Wepf, R.; Diembeck, W.; Wenck, H.; Gers-Barlag, H. The Outermost Stratum Corneum Layer is an Effective Barrier Against Dermal Uptake of Topically Applied Micronized Titanium Dioxide. Int. J. Cosmet. Sci. 1999, 21, 399–411. [Google Scholar] [CrossRef] [PubMed]
  15. Menzel, F.; Reinert, T.; Vogt, J.; Butz, T. Investigations of percutaneous uptake of ultrafine TiO2 particles at the high energy ion nanoprobe LIPSION. Nucl. Instrum. Methods Phys. Res. Sect. B Beam Interact. Mater. At. 2004, 219–220, 82–86. [Google Scholar] [CrossRef]
  16. Monteiro-Riviere, N.A.; Wiench, K.; Landsiedel, R.; Schulte, S.; Inman, A.O.; Riviere, J.E. Safety Evaluation of Sunscreen Formulations Containing Titanium Dioxide and Zinc Oxide Nanoparticles in UVB Sunburned Skin: An In Vitro and In Vivo Study. Toxicol. Sci. 2011, 123, 264–280. [Google Scholar] [CrossRef] [PubMed]
  17. Pinheiro, T.; Pallon, J.; Alves, L.C.; Veríssimo, A.; Filipe, P.; Silva, J.N.; Silva, R. The influence of corneocyte structure on the interpretation of permeation profiles of nanoparticles across skin. Nucl. Instrum. Methods Phys. Res. Sect. B Beam Interact. Mater. At. 2007, 260, 119–123. [Google Scholar] [CrossRef]
  18. Franken, A.; Eloff, F.C.; Du Plessis, J.; Du Plessis, J.L. In Vitro Permeation of Metals through Human Skin: A Review and Recommendations. Chem. Res. Toxicol. 2015, 28, 2237–2249. [Google Scholar] [CrossRef]
  19. Larese, F.F.; D’Agostin, F.; Crosera, M.; Adami, G.; Renzi, N.; Bovenzi, M.; Maina, G. Human skin penetration of silver nanoparticles through intact and damaged skin. Toxicology 2009, 255, 33–37. [Google Scholar] [CrossRef]
  20. Wu, J.; Liu, W.; Xue, C.; Zhou, S.; Lan, F.; Bi, L.; Xu, H.; Yang, X.; Zeng, F.D. Toxicity and penetration of TiO2 nanoparticles in hairless mice and porcine skin after subchronic dermal exposure. Toxicol. Lett. 2009, 191, 1–8. [Google Scholar] [CrossRef]
  21. Belade, E.; Armand, L.; Martinon, L.; Kheuang, L.; Fleury-Feith, J.; Baeza-Squiban, A.; Lanone, S.; Billon-Galland, M.A.; Pairon, J.C.; Boczkowski, J. A comparative transmission electron microscopy study of titanium dioxide and carbon black nanoparticles uptake in human lung epithelial and fibroblast cell lines. Toxicol. In Vitro 2012, 26, 57–66. [Google Scholar] [CrossRef] [PubMed]
  22. Sadrieh, N.; Wokovich, A.M.; Gopee, N.V.; Zheng, J.; Haines, D.; Parmiter, D.; Siitonen, P.H.; Cozart, C.R.; Patri, A.K.; McNeil, S.E.; et al. Lack of Significant Dermal Penetration of Titanium Dioxide from Sunscreen Formulations Containing Nano- and Submicron-Size TiO2 Particles. Toxicol. Sci. 2010, 115, 156–166. [Google Scholar] [CrossRef] [PubMed]
  23. Grélard, F.; Legland, D.; Fanuel, M.; Arnaud, B.; Foucat, L.; Rogniaux, H. Esmraldi: Efficient methods for the fusion of mass spectrometry and magnetic resonance images. BMC Bioinform. 2021, 22, 56. [Google Scholar] [CrossRef] [PubMed]
  24. Leite-Silva, V.R.; Lamer, M.L.; Sanchez, W.Y.; Liu, D.C.; Sanchez, W.H.; Morrow, I.; Martin, D.; Silva, H.D.; Prow, T.W.; Grice, J.E.; et al. The effect of formulation on the penetration of coated and uncoated zinc oxide nanoparticles into the viable epidermis of human skin in vivo. Eur. J. Pharm. Biopharm. 2013, 84, 297–308. [Google Scholar] [CrossRef] [PubMed]
  25. Saka, S.K.; Vogts, A.; Kröhnert, K.; Hillion, F.; Rizzoli, S.O.; Wessels, J.T. Correlated optical and isotopic nanoscopy. Nat. Commun. 2014, 5, 3664. [Google Scholar] [CrossRef] [PubMed]
  26. Wilke, K.; Wick, K.; Keil, F.J.; Wittern, K.P.; Wepf, R.; Biel, S.S. A strategy for correlative microscopy of large skin samples: Towards a holistic view of axillary skin complexity. Exp. Dermatol. 2007, 17, 73–80. [Google Scholar] [CrossRef] [PubMed]
  27. Quintana, C.; Wu, T.D.; Delatour, B.; Dhenain, M.; Guerquin-Kern, J.L.; Croisy, A. Morphological and chemical studies of pathological human and mice brain at the subcellular level: Correlation between light, electron, and nanosims microscopies. Microsc. Res. Tech. 2007, 70, 281–295. [Google Scholar] [CrossRef]
  28. Vollnhals, F.; Audinot, J.N.; Wirtz, T.; Mercier-Bonin, M.; Fourquaux, I.; Schroeppel, B.; Kraushaar, U.; Lev-Ram, V.; Ellisman, M.H.; Eswara, S. Correlative Microscopy Combining Secondary Ion Mass Spectrometry and Electron Microscopy: Comparison of Intensity–Hue–Saturation and Laplacian Pyramid Methods for Image Fusion. Anal. Chem. 2017, 89, 10702–10710. [Google Scholar] [CrossRef]
  29. Yedra, L.; Shyam Kumar, C.N.; Pshenova, A.; Lentzen, E.; Philipp, P.; Wirtz, T.; Eswara, W. A correlative method to quantitatively image trace concentrations of elements by combined SIMS-EDX analysis. J. Anal. At. Spectrom. 2021, 36, 56–63. [Google Scholar] [CrossRef]
  30. Kopp, C.; Domart-Coulon, I.; Escrig, S.; Humbel, B.M.; Hignette, M.; Meibom, A. Subcellular Investigation of Photosynthesis-Driven Carbon Assimilation in the Symbiotic Reef Coral Pocillopora damicornis. mBio 2015, 6, e02299-14. [Google Scholar] [CrossRef]
  31. LeKieffre, C.; Jauffrais, T.; Geslin, E.; Jesus, B.; Bernhard, J.M.; Giovani, M.E.; Meibom, A. Inorganic carbon and nitrogen assimilation in cellular compartments of a benthic kleptoplastic foraminifer. Sci. Rep. 2018, 8, 10140. [Google Scholar] [CrossRef] [PubMed]
  32. Nomaki, H.; Bernhard, J.M.; Ishida, A.; Tsuchiya, M.; Uematsu, K.; Tame, A.; Kitahashi, T.; Takahata, N.; Sano, Y.; Toyofuku, T. Intracellular Isotope Localization in Ammonia sp. (Foraminifera) of Oxygen-Depleted Environments: Results of Nitrate and Sulfate Labeling Experiments. Front. Microbiol. 2016, 7, 163. [Google Scholar] [CrossRef] [PubMed]
  33. Rabasco, S.; Nguyen, T.D.K.; Gu, C.; Kurczy, M.E.; Phan, N.T.N.; Ewing, A.G. Localization and Absolute Quantification of Dopamine in Discrete Intravesicular Compartments Using NanoSIMS Imaging. Int. J. Mol. Sci. 2021, 23, 160. [Google Scholar] [CrossRef] [PubMed]
  34. Takado, Y.; Knott, G.; Humbel, B.M.; Escrig, S.; Masoodi, M.; Meibom, A.; Comment, A. Imaging liver and brain glycogen metabolism at the nanometer scale. Nanomed. Nanotechnol. Biol. Med. 2015, 11, 239–245. [Google Scholar] [CrossRef] [PubMed]
  35. Tarolli, J.G.; Jackson, L.M.; Winograd, N. Improving Secondary Ion Mass Spectrometry Image Quality with Image Fusion. J. Am. Soc. Mass Spectrom. 2014, 25, 2154–2162. [Google Scholar] [CrossRef] [PubMed]
  36. Volland, J.M.; Schintlmeister, A.; Zambalos, H.; Reipert, S.; Mozetič, P.; Espada-Hinojosa, S.; Turk, V.; Wagner, M.; Bright, M. NanoSIMS and tissue autoradiography reveal symbiont carbon fixation and organic carbon transfer to giant ciliate host. ISME J. 2018, 12, 714–727. [Google Scholar] [CrossRef] [PubMed]
  37. Lange, F.; Agüi-Gonzalez, P.; Riedel, D.; Phan, N.T.N.; Jakobs, S.; Rizzoli, S.O. Correlative fluorescence microscopy, transmission electron microscopy and secondary ion mass spectrometry (CLEM-SIMS) for cellular imaging. PLoS ONE 2021, 16, e0240768. [Google Scholar] [CrossRef] [PubMed]
  38. Loussert-Fonta, C.; Toullec, G.; Paraecattil, A.A.; Jeangros, Q.; Krueger, T.; Escrig, S.; Meibom, A. Correlation of fluorescence microscopy, electron microscopy, and NanoSIMS stable isotope imaging on a single tissue section. Commun. Biol. 2020, 3, 362. [Google Scholar] [CrossRef]
  39. Pirozzi, N.M.; Hoogenboom, J.P.; Giepmans, B.N.G. ColorEM: Analytical electron microscopy for element-guided identification and imaging of the building blocks of life. Histochem. Cell Biol. 2018, 150, 509–520. [Google Scholar] [CrossRef]
  40. Pallon, J.; Garmer, M.; Auzelyte, V.; Elfman, M.; Kristiansson, P.; Malmqvist, K.; Nilsson, C.; Shariff, A.; Wegdén, M. Optimization of PIXE-sensitivity for detection of Ti in thin human skin sections. Nucl. Instrum. Methods Phys. Res. Sect. B Beam Interact. Mater. At. 2005, 231, 274–279. [Google Scholar] [CrossRef]
  41. Kertész, Z.S.; Szikszai, Z.; Gontier, E.; Moretto, P.; Surlève-Bazeille, J.E.; Kiss, B.; Juhász, I.; Hunyadi, J.; Kiss, A.Z. Nuclear microprobe study of TiO2-penetration in the epidermis of human skin xenografts. Nucl. Instrum. Methods Phys. Res. Sect. B Beam Interact. Mater. At. 2005, 231, 280–285. [Google Scholar] [CrossRef]
  42. Le Trequesser, Q.; Saez, G.; Simon, M.; Devès, G.; Daudin, L.; Barberet, P.; Michelet, C.; Delville, M.-H.; Seznec, H. Multimodal correlative microscopy for in situ detection and quantification of chemical elements in biological specimens. Applications to nanotoxicology. J. Chem. Biol. 2015, 8, 159–167. [Google Scholar] [CrossRef]
  43. De Castro, O.; Biesemeier, A.; Serralta, E.; Bouton, O.; Barrahma, R.; Hoang, Q.H.; Cambier, S.; Taubitz, T.; Klingner, N.; Hlawacek, G.; et al. npSCOPE: A New Multimodal Instrument for In Situ Correlative Analysis of Nanoparticles. Anal. Chem. 2021, 93, 14417–14424. [Google Scholar] [CrossRef] [PubMed]
  44. Vignard, J.; Pettes-Duler, A.; Gaultier, E.; Cartier, C.; Weingarten, L.; Biesemeier, A.; Taubitz, T.; Pinton, P.; Bebeacua, C.; Devoille, L.; et al. Food-grade titanium dioxide translocates across the oral mucosa in pigs and induces genotoxicity in an in vitro model of human oral epithelium. Nanotoxicology 2023, 17, 289–309. [Google Scholar] [CrossRef] [PubMed]
  45. Dowsett, D.; Wirtz, T. Co-Registered In Situ Secondary Electron and Mass Spectral Imaging on the Helium Ion Microscope Demonstrated Using Lithium Titanate and Magnesium Oxide Nanoparticles. Anal. Chem. 2017, 89, 8957–8965. [Google Scholar] [CrossRef] [PubMed]
  46. Singh, S.; Singh, H.; Bueno, G.; Deniz, O.; Singh, S.; Monga, H.; Hrisheekesha, P.N.; Pedraza, A. A review of image fusion: Methods, application and performance metrics. Digit. Signal Process. 2023, 137, 104020. [Google Scholar] [CrossRef]
  47. Delaune, A.; Cabin-Flaman, A.; Legent, G.; Gibouin, D.; Smet-Nocca, C.; Lefebvre, F.; Benecke, A.; Vasse, M.; Ripoll, C. 50 nm-scale localization of single unmodified, isotopically enriched, proteins in cells. PLoS ONE 2013, 8, e56559. [Google Scholar] [CrossRef] [PubMed]
  48. Ziegler, J.F.; Ziegler, M.D.; Biersack, J.P. SRIM—The stopping and range of ions in matter (2010). Nucl. Instrum. Methods Phys. Res. Sect. B Beam Interact. Mater. At. 2010, 268, 1818–1823. [Google Scholar] [CrossRef]
  49. Biesemeier, A.; Eibl, O.; Eswara, S.; Audinot, J.N.; Wirtz, T.; Schraermeyer, U. Transition metals and trace elements in the retinal pigment epithelium and choroid: Correlative ultrastructural and chemical analysis by analytical electron microscopy and nano-secondary ion mass spectrometry. Metallomics 2018, 10, 296–308. [Google Scholar] [CrossRef]
  50. McMahon, G.; Glassner, B.J.; Lechene, C.P. Quantitative imaging of cells with multi-isotope imaging mass spectrometry (MIMS)—Nanoautography with stable isotope tracers. Appl. Surf. Sci. 2006, 252, 6895–6906. [Google Scholar] [CrossRef]
  51. Audinot, J.; Georgantzopoulou, A.; Piret, J.; Gutleb, A.C.; Dowsett, D.; Migeon, H.N.; Hoffmann, L. Identification and localization of nanoparticles in tissues by mass spectrometry. Surf. Interface Anal. 2013, 45, 230–233. [Google Scholar] [CrossRef]
  52. Song, G.; Han, J.; Zhao, Y.; Wang, Z.; Du, H. A Review on Medical Image Registration as an Optimization Problem. Curr. Med. Imaging Rev. 2017, 13, 274–283. [Google Scholar] [CrossRef] [PubMed]
  53. Paul-Gilloteaux, P.; Heiligenstein, X.; Belle, M.; Domart, M.C.; Larijani, B.; Collinson, L.; Raposo, G.; Salamero, J. eC-CLEM: Flexible multidimensional registration software for correlative microscopies. Nat. Methods 2017, 14, 102–103. [Google Scholar] [CrossRef] [PubMed]
  54. Fernandez, R.; Moisy, C. Fijiyama: A registration tool for 3D multimodal time-lapse imaging. Bioinformatics 2021, 37, 1482–1484. [Google Scholar] [CrossRef] [PubMed]
  55. Gardés, E.; Gibouin, D.; Radiguet, B.; David, A.; Prellier, W.; Marquardt, K. Magnesium transport in olivine mantle: New insights from miniaturized study of volume and grain boundary diffusion in Mg2SiO4 bi-crystals. Contrib. Mineral. Petrol. 2021, 176, 99. [Google Scholar] [CrossRef]
  56. Lin, Y.; Hao, J.; Miao, Z.; Zhang, J.; Yang, W. NanoSIMS image enhancement by reducing random noise using low-rank method. Surf. Interface Anal. 2020, 52, 240–248. [Google Scholar] [CrossRef]
  57. Nikolov, S.G.; Hutter, H.; Grasserbauer, M. De-noising of SIMS images via wavelet shrinkage. Chemom. Intell. Lab. Syst. 1996, 34, 263–273. [Google Scholar] [CrossRef]
  58. Azari, F.; Vali, H.; Guerquin-Kern, J.L.; Wu, T.D.; Croisy, A.; Sears, S.K.; Tabrizian, M.; McKee, M.D. Intracellular precipitation of hydroxyapatite mineral and implications for pathologic calcification. J. Struct. Biol. 2008, 162, 468–479. [Google Scholar] [CrossRef]
  59. Clode, P.L.; Kilburn, M.R.; Jones, D.L.; Stockdale, E.A.; Cliff, J.B.; Herrmann, A.M.; Murphy, D.V. In Situ Mapping of Nutrient Uptake in the Rhizosphere Using Nanoscale Secondary Ion Mass Spectrometry. Plant Physiol. 2009, 151, 1751–1757. [Google Scholar] [CrossRef]
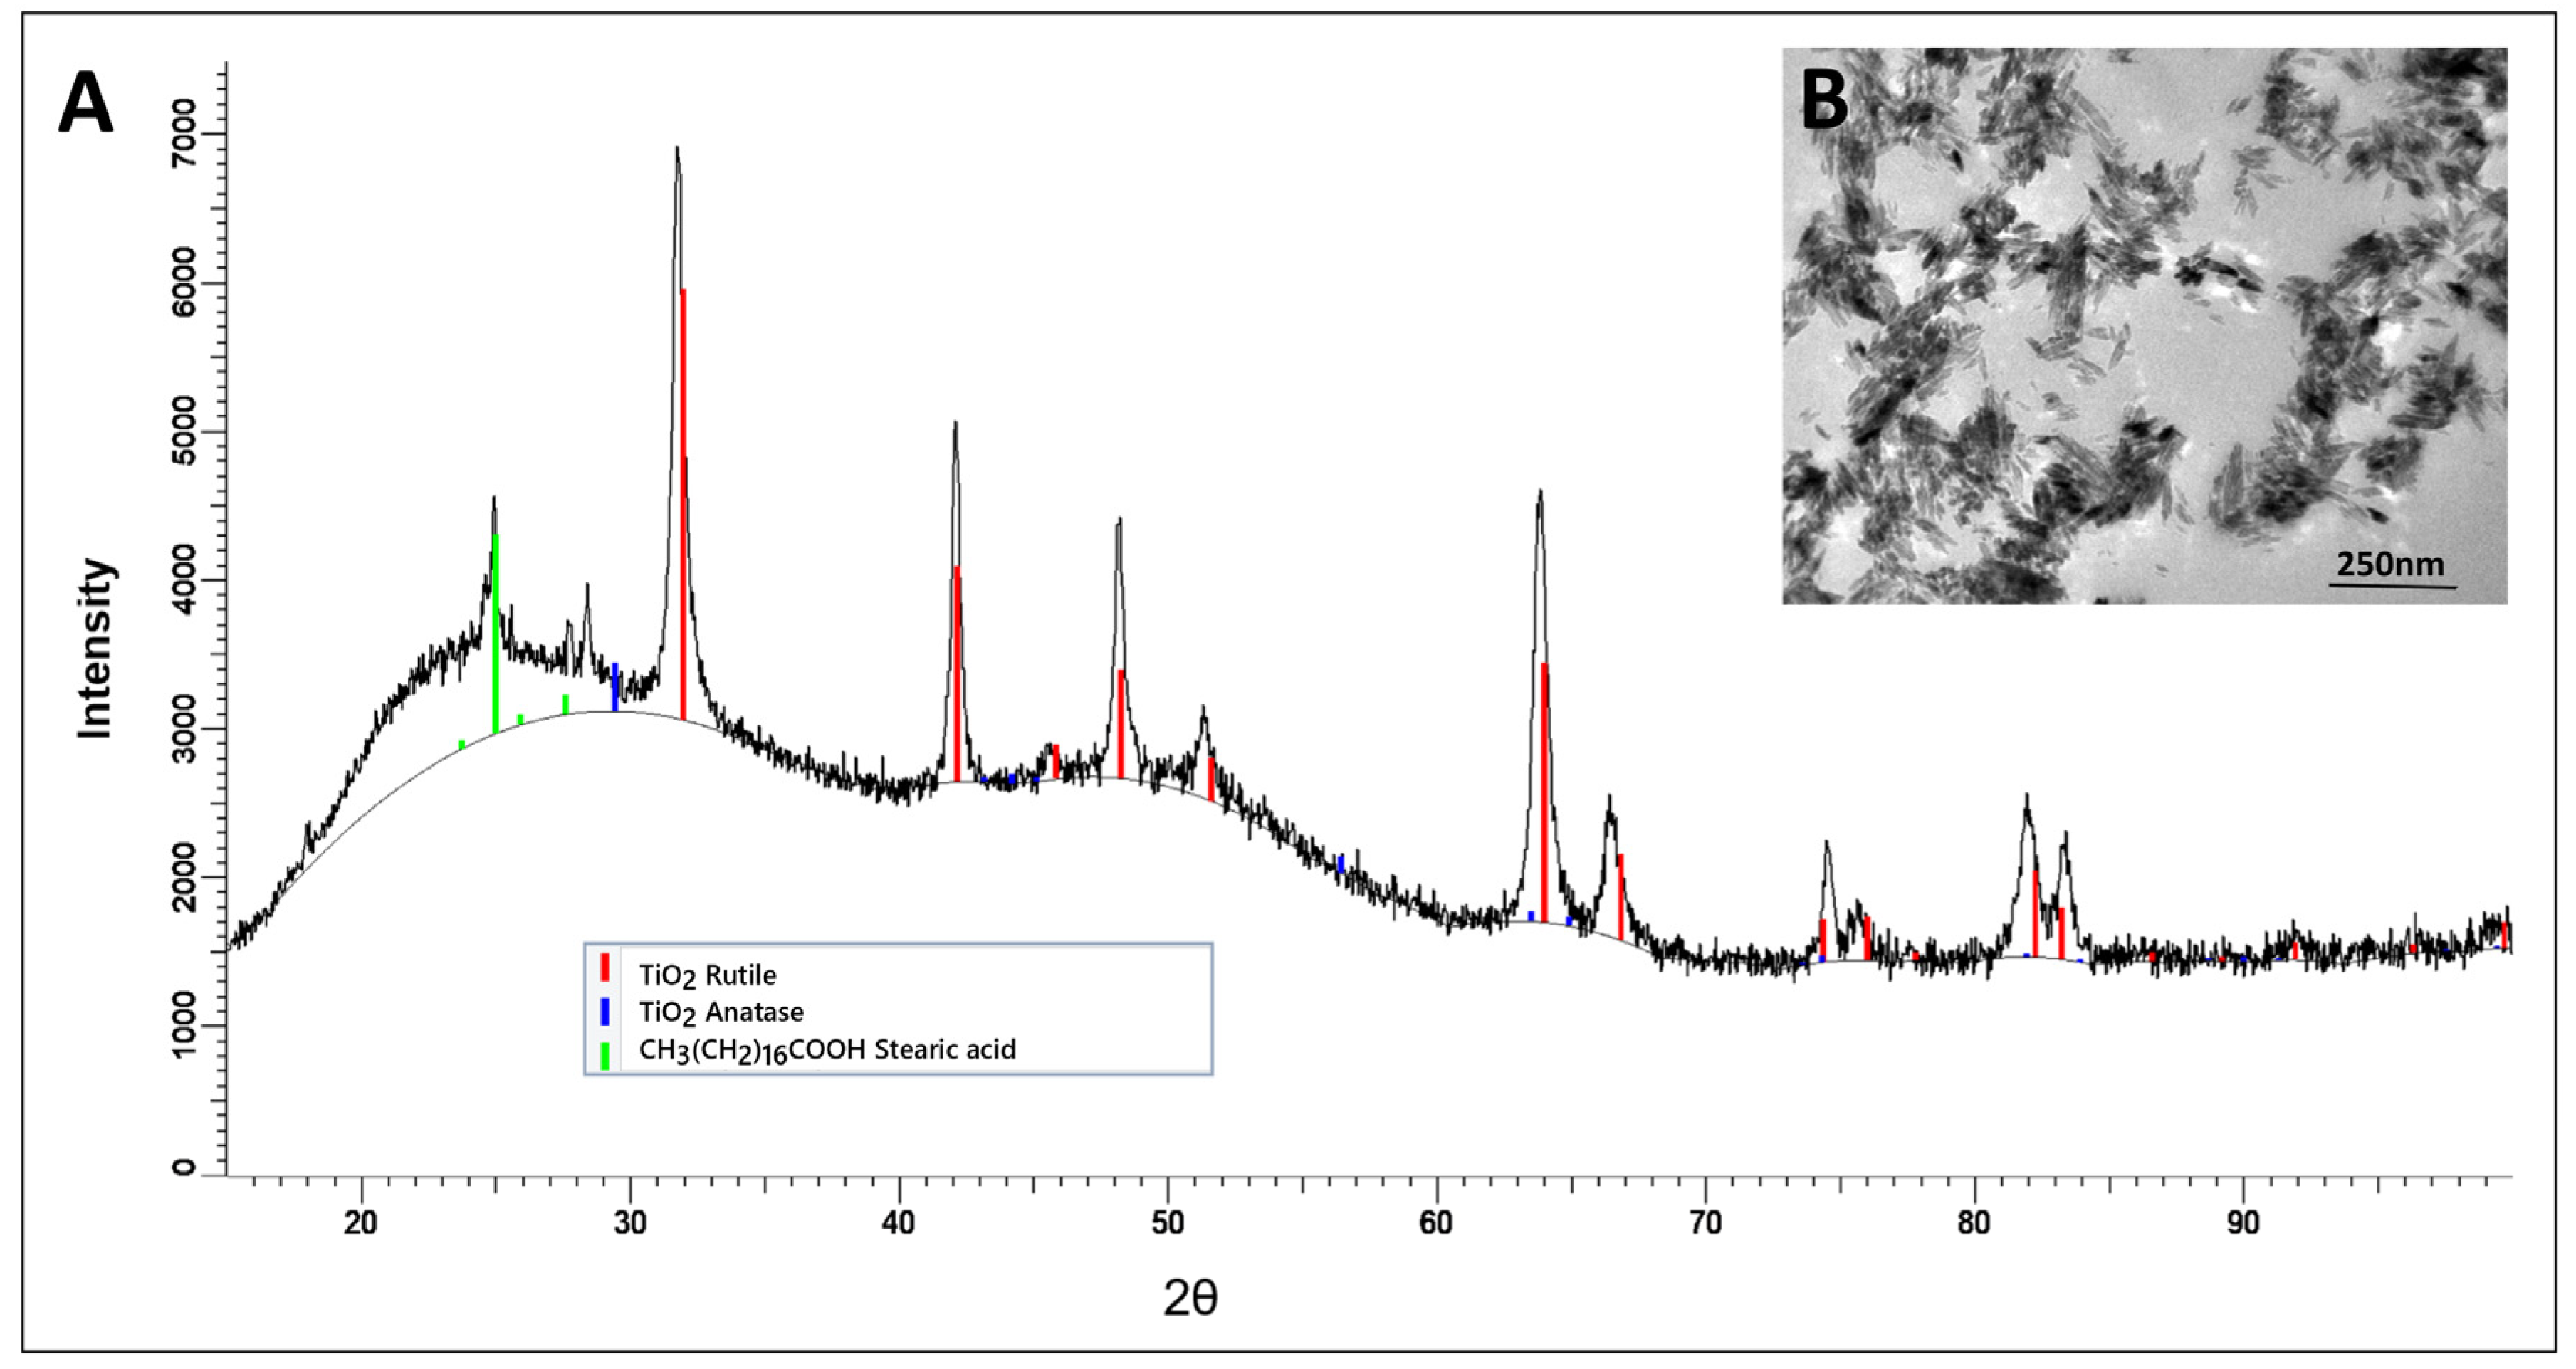
Figure 1. Characterization of TiO2 NPs via TEM and DRX analysis. (A) Diffractogram at 2θ angles with black line as the signal intensity, stearic acid (CH3(CH2)16COOH) as a reference (the green vertical bar). Compared with anatase picks (the blue vertical bar), eleven picks (the red vertical bar) indicate a rutile structure. (B) TEM image of NPs: 1.4 × 1.08 µm; 672 × 518 pixels; scale bar: 250 nm.
Applsci 13 12189 g001
Figure 2. Comparison of NanoSIMS50 “sum” images at a 12C14N mass of skin/NP samples without drift correction and with drift correction. The gray scales are the 12C14N signal intensities in the number of counts: (A) without drift correction and (B) with drift correction. (C) Profiles of the 12C14N signal intensities along the green line for (A) and the red dashed line for (B). Dwell time: 2 ms/pixel; raster: 10 µm × 10 µm, 256 × 256 pixels, sum of 20 plans. The arrow indicates sunscreen on the skin’s surface.
Applsci 13 12189 g002
Figure 3. Alignment of TEM and SIMS images using MoDaT software. (A) Mosaic of two TEM images of a skin/NP sample acquired using Jeol JEM2010. (B) “Sum” SIMS image at the 12C14N mass (the region of interest of Figure 2B) on which are surimpressed landmarks and mesh. (C) MoDaT display of the overlay of the colored 12C14N image (B) on the TEM image (A) with the corresponding surimpressed landmarks and mesh. (D) Final overlay of the 12C14N image in magenta on the TEM image in gray. (E,F) MoDaT display of the overlay of the colored 16O image on the TEM image (A) with the corresponding surimpressed landmarks and mesh. (F) Increase in the number of landmarks to align more NP aggregates compared to (E). (G) Final overlay of the 16O image in the “Cameca” color scale on the (D) image. (H) Final overlay of the 48Ti16O image in the “Cameca” color scale on the (D) image. SIMS images: dwell time, 2 ms/pixel; raster, 10 µm × 10 µm, 256 × 256 pixels, sum of 20 plans. TEM image: cropped mosaic from two 672 × 518 pixels images. Scale bar: 2 µm.
Applsci 13 12189 g003
Figure 4. Localization of TiO2 NPs close to corneocytes. (A,B) SIMS images of the skin/NP sample section in the “Cameca” color scale. (A) “Sum” image at mass 12C14N. (B) “Sum” image at mass 48Ti16O. The purple square represents the region of interest used in figures (CF). (C) Scheme of the corresponding ROI. O: Outgrowth; F: Furrow; C1, C2, and C3: Corneocytes 1, 2, and 3; arrow: inter-corneocyte contact. (D) MET image acquired via Jeol JEM 2010. The arrows indicate NP aggregates. (E,F) Overlay of the 12C14N (magenta) and 48Ti16O (“Cameca” color scale) on the TEM image without an SCP filter (E) and with an SCP filter (F). (DF) The arrows indicate NPs, and the circles indicate clusters of false positive pixels. SIMS images: dwell time, 1 ms/pixel; raster, 10 µm × 10 µm, 256 × 256 pixels, sum of 30 plans. Scale bar: 1 µm (A,B); 500 nm (CF).
Applsci 13 12189 g004
Figure 5. STEM–HAADF image of TiO2 NPs on corneocytes. This region of interest corresponds to the outgrowth and the furrow mentioned in Figure 4C. O: outgrowth, F: furrow. The arrows indicate NPs. Scale bar: 100 nm.
Applsci 13 12189 g005
Figure 6. Three-dimensional distribution of NPs in the vicinity of a corneocyte. This ROI corresponds to the outgrowth, the furrow of the corneocyte mentioned in Figure 4. (A) XY projection of the 12C14N image. Yellow dotted arrow: outgrowth; white dashed line: furrow. (B) XY projection of the 48Ti16O image of the same area as (A). (C) Representation of the analyzed volume. The XY projection of the 12C14N image is shown on the top side, the YZ projection of the 12C14N image is shown on the right side, and the XZ projection of the 12C14N image is shown on the front side. (DI) Overlay of the 48Ti16O images on the 12C14N images’ XY projections. (D,G): XY projection. (E,H) YZ projection. (F,I) XZ projection. (DF) are images without an SCP filter, and (GI) are images with an SCP filter. The colored circles indicate clusters of positive pixels. The SIMS analyzed volume was 38 × 50 × 30 pixels (1.5 µm × 2 µm × 5.7 nm) from the SIMS analysis shown in Figure 4. Dwell time: 1 ms/pixel; raster: 10 µm × 10 µm, 256 × 256 pixels, 30 plans.
Applsci 13 12189 g006
Disclaimer/Publisher’s Note: The statements, opinions and data contained in all publications are solely those of the individual author(s) and contributor(s) and not of MDPI and/or the editor(s). MDPI and/or the editor(s) disclaim responsibility for any injury to people or property resulting from any ideas, methods, instructions or products referred to in the content.